Article

Impact of Ambient Temperature and Relative Humidity on the Incidence of Hand-Foot-Mouth Disease in Wuhan, China

1
Department of Global Health, School of Health Sciences, Wuhan University, 115# Donghu Road, Wuhan 430071, China
2
Global Health Institute, Wuhan University, 115# Donghu Road, Wuhan 430071, China
3
Hubei Provincial Center for Disease control and Prevention, Wuhan 430079, China
4
State Key Laboratory of Information Engineering in Surveying, Mapping and Remote Sensing, Wuhan University, Wuhan 430079, China
5
College of Information Science and Engineering, Wuchang Shouyi University, Wuhan 430064, China
6
Environmental Health Laboratory, Department of Public Health Sciences, University of Hawaii at Manoa, 1960 East-West Rd, Biomed Bldg, D105, Honolulu, HI 96822, USA
*
Authors to whom correspondence should be addressed.
Int. J. Environ. Res. Public Health 2020, 17(2), 428; https://0-doi-org.brum.beds.ac.uk/10.3390/ijerph17020428
Submission received: 3 December 2019 / Revised: 2 January 2020 / Accepted: 7 January 2020 / Published: 8 January 2020
(This article belongs to the Special Issue Air Pollution and Climate Change-Mediated Health Impacts)

Abstract

:
Background: Few studies have previously explored the relationship between hand, foot, and mouth disease (HFMD) and meteorological factors with the effect modification of air pollution, and these studies had inconsistent findings. We therefore applied a time-series analysis assessing the effects of temperature and humidity on the incidence of HFMD in Wuhan, China to deepen our understanding of the relationship between meteorological factors and the risk of HFMD. Methods: Daily HFMD cases were retrieved from Hubei Provincial Center for Disease Control and Prevention from 1 February 2013 to 31 January 2017. Daily meteorological data including 24 h average temperature, relative humidity, wind velocity, and atmospheric pressure were obtained from Hubei Meteorological Bureau. Data on Air pollution was collected from 10 national air-monitoring stations in Wuhan city. We adopted a distributed lag non-linear model (DLNM) combined with Poisson regression and time-series analysis to estimate the effects of temperature and relative humidity on the incidence HFMD. Results: We found that the association between temperature and HFMD incidence was non-linear, exhibiting an approximate “M” shape with two peaks occurring at 2.3 °C (RR = 1.760, 95% CI: 1.218–2.542) and 27.9 °C (RR = 1.945, 95% CI: 1.570–2.408), respectively. We observed an inverted “V” shape between relative humidity and HFMD. The risk of HFMD reached a maximum value at a relative humidity of 89.2% (RR = 1.553, 95% CI: 1.322–1.824). The largest delayed cumulative effects occurred at lag 6 for temperature and lag 13 for relative humidity. Conclusions: The non-linear relationship between meteorological factors and the incidence of HFMD on different lag days could be used in the early targeted warning system of infectious diseases, reducing the possible outbreaks and burdens of HFMD among sensitive populations.

1. Introduction

Hand, foot, and mouth disease (HFMD) is a highly contagious disease transmitted by enterovirus, mainly including coxsackie virusA16 (CV-A16) and enterovirus 71 (EV-17). HFMD usually occurs among children under five years old, although sometimes adolescents and adults get infected as well [1]. The average incubation period for HFMD is from three to seven days. The main symptoms of HFMD are painful mouth ulcers, vesicles on the hands and feet, and fever [2]. Despite the fact most cases of HFMD are self-healing, some severe neurological and systemic complications may follow the infection, causing a heavy burden on public health [3,4].
In the past decades, the Asia–Pacific region has witnessed a number of HFMD epidemics. For example, Taiwan experienced an outbreak involving millions of people in 1998 [5]. In mainland China, HFMD was responsible for more than 1100 infections in Shandong in 2007 [6]. The 2008 Anhui epidemic led to 480,000 cases and 128 deaths [7]. In 2012, the annual report of the National Health and Family Planning Commission warned that both the incidence and mortality of HFMD are highest among category C infectious diseases in China [8].
Weather is considered to be a major factor affecting outbreaks of infectious diseases [9]. Studies have explored the associations between climate factors and various infectious diseases, such as tuberculosis, influenza, mumps, etc. [10,11,12]. There have been some studies on the association between meteorological factors and HFMD [13,14,15]. However, possibly due to the heterogeneity of climate factors and geographic conditions among these studies, the results were not consistent. Linear and non-linear relationships were both observed when quantifying the effects of temperature on HFMD [16,17,18]. Some studies claimed that high relative humidity contributed to an increased risk of HFMD, while others found no association [15,19,20,21,22,23]. There are relatively few studies indicating an association between wind velocity and the incidence of HFMD and the results are not consistent [20,23,24,25]. In addition, exposure to air pollution has also been found to play a role in HFMD infection [26], although such studies are rare.
Our study aims to explore the association between meteorological factors and the incidence of HFMD by controlling the effects of air pollution from 1 February 2013 to 31 January 2016 in Wuhan, China. We reported both single-day lag effects and cumulative effects. We estimated the extreme effects of temperature and humidity including the 1st, 5th, 10th, 90th, 95th, and 99th percentiles of meteorological factors. We also compared the effects of ambient temperature and apparent temperature in our sensitive analysis.

2. Methods

2.1. Study Area

Wuhan (29°58′–31°22′ N, 113°41′–115°05′ E) is the capital city of Hubei Province in central China, covering a land size of 8569.15 km2 and a total population of 11,360,000 in 2016 [27]. Wuhan has a typical subtropical monsoon climate, with a daily mean temperature of 17.3 °C and relative humidity of 80% during 2016. From 2013 to 2016, more than 65,000 HFMD cases were documented in Wuhan.

2.2. Data Collection

HFMD was categorized as a Category C infectious disease in China in 2008 and the disease surveillance is updated every day. Daily HFMD cases were retrieved from the disease surveillance system from the Disease Reporting System in Hubei Provincial Center for Disease Control and Prevention from 1 February 2013 to 31 January 2017. HFMD was diagnosed based on the clinical criteria in the “HFMD Control and Prevention Guide” published by the Chinese Ministry of Health [28].
Daily meteorological data, including 24 h average ambient temperature, relative humidity, wind velocity, vapor pressure, and atmospheric pressure, were obtained from Hubei Meteorological Bureau.
Data on air pollution were collected from 10 national air quality monitoring stations in Wuhan. Previous studies indicated that exposure to particulate matter less than or equal to 10 micrometers in aerodynamic diameter (PM10), particulate matter less than or equal to 2.5 micrometers in aerodynamic diameter (PM2.5), and sulfur dioxide (SO2), has the potential to increase the risk of HFMD [23,29,30]. Therefore, we included these three air pollutants in our analysis, namely 24 h concentrations of PM10, PM2.5, and SO2. The daily concentration of each air pollutant in Wuhan was averaged based on measurements collected from 10 monitoring stations across the city.
Apparent temperature was calculated as follows [31]:
A T = 2.7   +   1.047 · T a   +   2.0 · P v     0.65 · W V  
where AT is apparent temperature, Ta is ambient temperature (°C), Pv is vapor pressure (hPa), and WV is wind velocity (m/s) 10 m above the ground.

2.3. Statistical Analysis
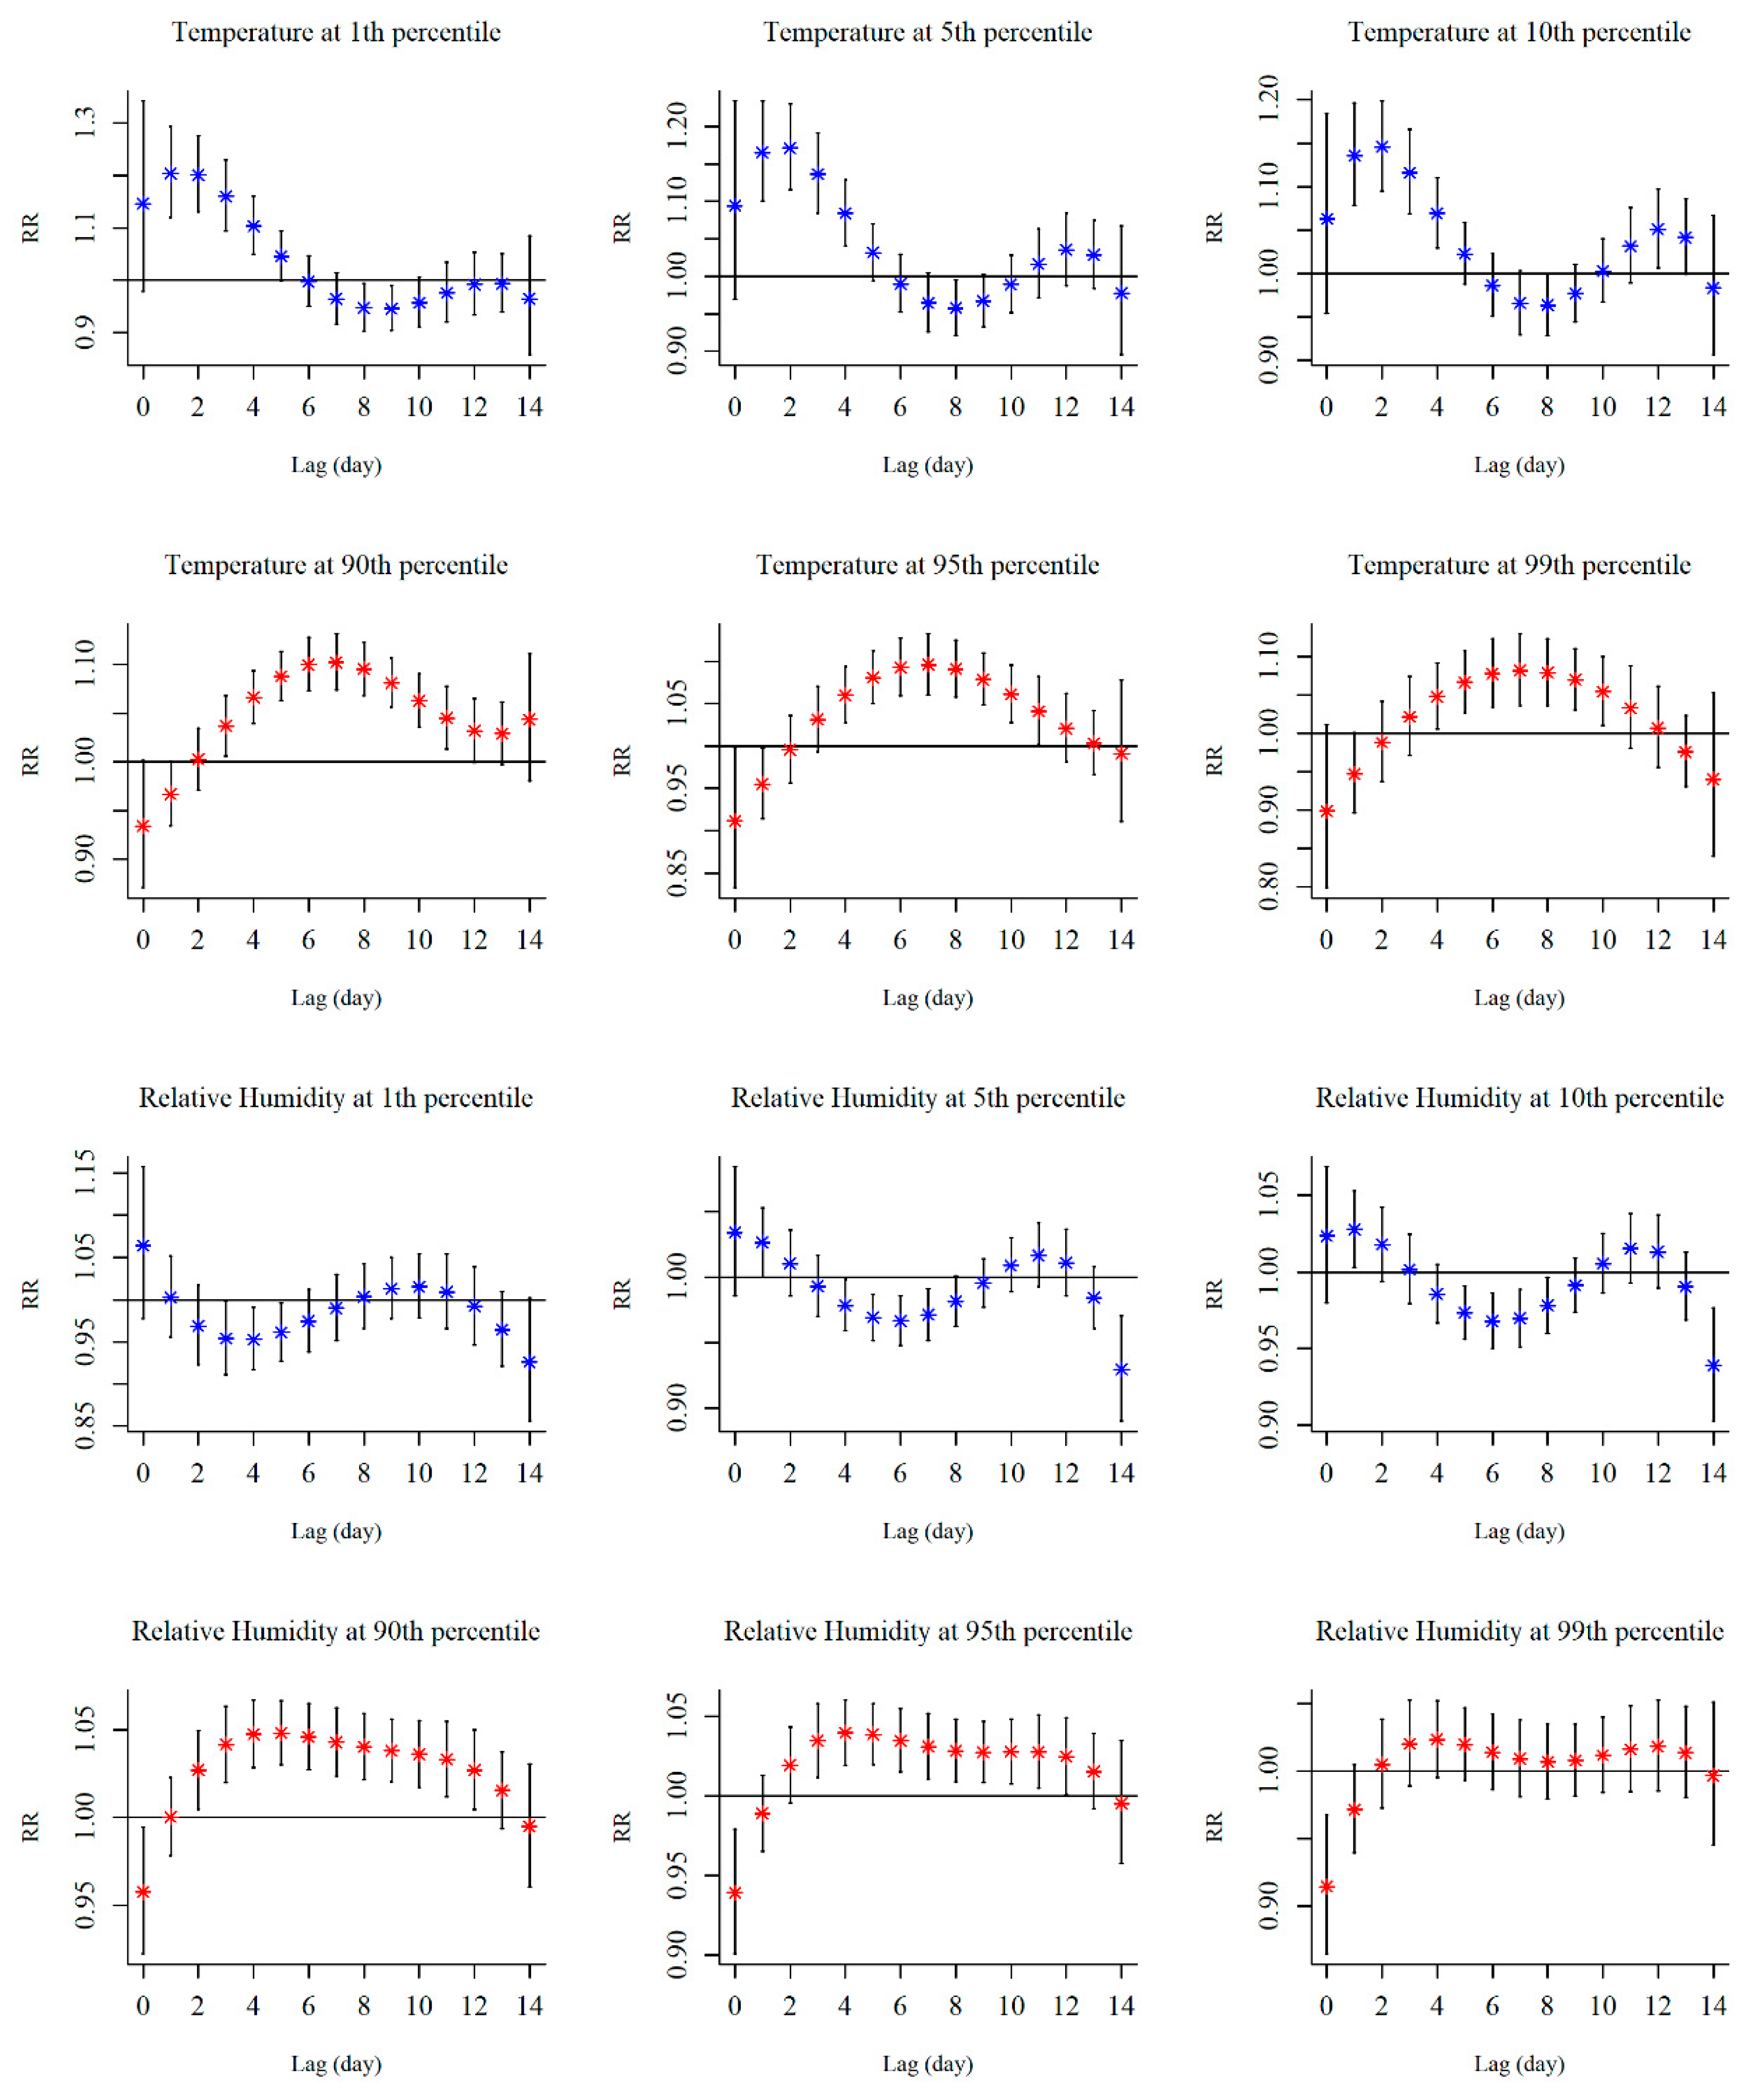
Spearman correlation was used to assess the relationship between pollutant concentrations and meteorological factors. In our univariate analysis, we found that all air pollutants and meteorological factors were significantly associated with the incidence of HFMD, except for wind velocity. Therefore, this article mainly focuses on reporting the effects of temperature and relative humidity.
As the distributed lag non-linear model (DLNM) based on the generalized linear model (GLM) or generalized additive model [32] is considered to represent the time-course of the exposure–response and cumulative lag effects in a non-linear process more flexibly [33], we adopted a DLNM with Poisson regression to estimate the effects of meteorological factors on the risk of HFMD. In order to assess the exposure–lag–response relationship, we used a cross-basis function for temperature, relative humidity, and wind velocity. The model is as follows
L o g [ E ( y t ) ] = α + c b ( M , d f , l a g , d f ) + n s ( X i ) + n s ( t i m e , 8 ) + γ D O W
where t is the day of observation; E ( y t ) is the observed number of HFMD cases on t; α is the intercept; cb is a cross-basis function used for estimating the non-linear relationship between meteorological factors and HFMD incidence; M is the examined meteorological variable that was closely linked with incidence of HFMD; ns(Xi) represents a natural cubic spline function for atmospheric pressure and air pollutants; time is the indicator variable used to control long-term trends and seasonality; DOW is an indicator variable representing day of the week. The degree of freedom (df) for each variable was determined by the Akaike Information Criterion for quasi-Poisson (Q-AIC). df for M and their corresponding lags are as follows: 5.4 for temperature, 4.4 for relative humidity, and 3.3 for wind velocity. Atmospheric pressure, PM2.5, and SO2 were controlled for by the natural cubic spline with 5, 4, and 4 df, respectively. The knots were equally spaced for exposure–response and the log scale of lags by default. The df per calendar year for time variable was set to 8. To avoid the potential collinearity due to the presence of PM2.5 and PM10 (r = 0.869), we included only PM2.5 and SO2 in the analysis, and used PM10 instead in the sensitivity analysis to verify the robustness of the model.
Because the incubation period of HFMD is 2–10 days, the maximum lag day in our analysis was set to 14 days to estimate the overall cumulative effects. We also divided lag days of the study variables into four categories (lag3, lag7, lag10, and lag14) to effectively depict various single-day effects. Spline knots were defined at equal spaces and the knots of lags were also equally placed on the log scale. We selected the medium values of ambient temperature (18.4 °C) and relative humidity (78.6%) as the reference values in the DLNM model. Relative risks (RR) with 95% confidence intervals (CIs) for different percentiles (1st, 5th, 10th, 90th, 95th, and 99th) of ambient temperature and relative humidity were used to represent the risk of HFMD for extreme meteorological factors.
We applied several sensitivity analyses to test the robustness of our model. First, we altered the df for long-term trend (6 to 7 df) to find the best model fit. Second, we replaced PM2.5 with PM10 to examine the robustness of our results. Lastly, we used the apparent temperature rather than the ambient temperature to assess the effects.
Data cleaning and analysis were accomplished using R packages “dlnm” and “spline” (v.3.4.2; R Foundation for Statistical Computing, Vienna, Austria).

3. Results

From 1 February 2013 to 31 January 2017, a total of 65,313 HFMD cases was documented in Wuhan, China. Characteristics of meteorological factors, air pollutants, and HFMD cases are shown in Table 1. The mean value of each meteorological variable was 17.29 °C for ambient temperature, 14.62 °C for apparent temperature, 77.90% for relative humidity, 1.73 m/s for wind velocity, an2d 1012.93 hPa for atmosphere pressure. The lowest apparent temperature was much lower than the lowest ambient temperature, while the highest ambient temperature was slightly higher than the highest apparent temperature. The average concentration of each air pollutant was 109.98, 72.28, and 25.31 μg/m3 for PM10, PM2.5, and SO2, respectively. The daily average number of HFMD cases was 44.8, ranging from 0 to 239. The spearman correlation between meteorological factors and air pollution is presented in Table 2. Air pollutants were negatively correlated with ambient temperature, apparent temperature, relative humidity, and wind velocity. Except for the correlation between wind velocity and apparent temperature, all other meteorological factors and air pollutants were significantly correlated with each other.
Figure 1 illustrates the seasonal fluctuation in meteorological factors, air pollutants, and HFMD cases. Ambient temperature, apparent temperature, atmosphere pressure, and PM2.5 presented a periodic pattern. The concentration of SO2 showed a decreasing but observable seasonal trend between 2013 and 2017. We also observed the seasonality of HFMD cases with two peaks in a year: one was during late spring to early summer (April to June) and the other was during late fall to winter (November to January), although the second one is less pronounced than the first one.
We used three-dimensional (3D) plots to visualize the exposure–lag–response relationship of HFMD and climate factors (Figure 2). Figure 3 demonstrates the cumulative effects of ambient temperature and relative humidity over 14 days, taking their medium values as references. The associations between ambient temperature, relative humidity, and the risk of HFMD were non-linear. The exposure–response curve for the ambient temperature presents an ‘M’ shape with two peaks. The first peak was at 2.3 °C with an RR of 1.760 (95% CI: 1.218–2.542), and the second one was at 27.9 °C with an RR of 1.945 (95% CI: 1.570–2.408). For relative humidity, we observed an inverted ‘V’ shape that reached the maximum value at a humidity of 89.2% (RR = 1.553, 95% CI: 1.322–1.824).
The associations between extreme meteorological factors and the risk of HFMD at specific lag days are shown in Figure 4. The effects of extreme low temperature peaked at lag2, then decreased and reached a second peak at lag12. The effects of extreme high temperature presented an inverted ‘V’ shape, and the peak appeared at lag7. We observed that the hot effects occurred relatively slower than the cold effects. For low temperatures, the effect estimates at the 1st percentile was greater than estimates at the 5th and 10th percentiles, while for high temperatures, the risk of HFMD at higher temperatures was lower than at lower temperatures. Low relative humidity was a significant protective factor for the risk of HFMD between lag3 to lag5 at the 90th percentile, lag4 to lag7 at the 95th percentile, and lag5 to lag8 at the 99th percentile. Relative humidity at the 90th percentile was significantly associated with an increased risk of HFMD from lag2 to lag 12. Similar with extreme high temperatures, the effects at the 90th percentile were more pronounced than those at the 99th percentile for relative humidity. The lagged period was divided at lag3, lag7, lag10, and lag14 and their effects were shown in Figure S1.
Table 3 presents the cumulative effects of extreme ambient temperature and relative humidity at lag0–14. The risk of HFMD reached the highest level at the 5th percentile for low temperature (RR = 1.756, 95% CI: 1.224–2.518), and the 90th percentile for high temperature (RR = 1.919, 95% CI: 1.530–2.407). Low relative humidity showed a protective effect for the incidence of HFMD, although it was not statistically significant and the strongest effects occurred at the 1st percentile of relative humidity (RR = 0.805, 95% CI: 0.597–1.086). Compared with the effects at the 95th percentile and the 99th percentile, the risk for the 90th percentile of the relative humidity had greater adverse effects on HFMD incidence (RR = 1.474, 95% CI: 1.261–1.722).
Table 4 shows the largest cumulative effects of meteorological factors on HFMD from lag0–1 to lag0–14. For ambient temperature, the extreme cold effects occurred at −4.3 °C from lag0–1 to lag0–10. The extreme hot weather had the greatest adverse effects, from lag0–12 to lag0–14. Different from the ambient temperature, the largest effects for the extreme low relative humidity between lag0–1 to lag0–3 were not statistically significant. High relative humidity was significantly associated with the increased risk of HFMD from lag0–4 to lag0–14.
As a sensitivity analysis, we compared the cumulative effects arising from ambient temperature and apparent temperature within 14 days (Figure 5). We observed a similar ‘M’ shape for both variables. It showed that the apparent temperature had a lower risk with two peaks: one was at −2.8 °C (RR = 1.584, 95% CI: 1.081–2.322) and the other one lay at 25.4 °C (RR = 1.647, 95% CI: 1.367–1.984). We also switched PM2.5 to PM10 in our analysis and the results remained robust (Figure S2). In addition, we changed the df for long-term trend (6 to 7 df). As a result, the estimated relative risk changed slightly, but did not affect the nonlinear “M” shape previously observed (Figure S3).

4. Discussion

In our study, ambient temperature and relative humidity were found to be significantly associated with incidence of HFMD. Lagged effects were observed for extreme temperature and relative humidity. Compared with apparent temperature, ambient temperature seemed to overestimate the potential risk of HFMD. Our study adds to the literature on the short-term association between meteorological factors and the risk of HFMD. Our finding provides more epidemiological evidence for future mechanism studies on how meteorological factors may affect HFMD outbreaks.
This study found that the association between temperature and the incidence of HFMD presented an approximate ‘M’ shape from 1 February 2013 to 1 January 2017, with two peaks at 2.3 °C (RR = 1.760, 95% CI: 1.218–2.542) and 27.9 °C (RR = 1.945, 95% CI: 1.570–2.408). Another study conducted in Wuhan also quantified the influence of temperature on HFMD from 2010 to 2015 using DLNM. The study observed an inverted “V” shape between temperature and HFMD over 14 days and the highest cumulative RR was at 26.4 °C (RR = 2.78, 95% CI: 2.08–3.72) [34]. The effects of temperature during hot days in two studies were similar but there were differences in results regarding low temperature days. The inconsistent results may result from different study periods and model settings, such as lags and df. Both linear and non-linear exposure–response relationships between temperature and HFMD were observed in various cities. Some spotted linear patterns of temperature on HFMD [13,14,16,17], while others noticed the non-linear relationships between temperature and HFMD. For example, a study in Ningbo, China also found an “M” pattern between temperature and HFMD, but the highest risk was at 31 °C [18]. Studies conducted in Chengdu, Guilin, Wuhan, and Guangdong, as well as a Chinese multi-city study, all reported an inverted “V” shape of temperature on the incidence of HFMD [23,26,30,34,35]. In addition to the different model settings, such as lags and covariates, the heterogeneity in the shape of non-linear relationships might result from differences in various climatic characteristics and regional indicators, including geographic location, economy, health care, population, and education [12].
We observed different patterns of the lagged effects due to extreme low and high temperatures. On cold days, two peaks were observed for HFMD at lag3 and lag12. Considering that the incubation period of HFMD is from three to seven days, two different mechanisms regarding the lagged effects were assumed. During lag0 to lag4, a low temperature was statistically significantly associated with increased risk of HFMD. Some studies have found that human immunity could be weakened in cold weather. Short-term exposure to low temperatures may result in a shortened microbial incubation period and lead to the development of infected viruses into diseases [36]. For the peak that occurred at lag12, we think this may be due to changes in people’s behavior caused by exposure to cold weather, which in turn led to greater viral infection potential. For example, on cold days, people wash their hands less frequently, making the most common form of HFMD infection—“contact infection”—possible.
We observed an increased risk of HFMD on hot days as well. The peak of high temperature occurred at lag7, indicating that high temperatures may be associated with more frequent virus attacks. This may be due to the fact that high temperatures facilitate the active replication of the virus, and high temperatures may increase the likelihood of people participating in outdoor activities as well [37]. We observed a downward trend in the risk of HFMD after the peak at 27.9 °C. A previous study showed that strong ultraviolet radiation in hot weather entered inactivated viruses, shortened their circulation, and reduced the likelihood of their transmission back to the host [37,38]. In addition, we found that the lagged effect of low temperature was rapid, and the effects of high temperature was slow, which was consistent with the results of a study in Guilin [23].
In our study, we observed an inverted “V” shape of the association between relative humidity and HFMD incidence. When the relative humidity increased, the risk of HFMD also increased and peaked at a relative humidity of 89.2%. Similar results have been reported in many previous studies [15,20,21,22]. However, studies in Guilin and Huainan showed no significant association between humidity and HFMD [19,23]. Thus far, the mechanism of humidity on HFMD is still unclear, but the findings of previous studies may contribute to the explanation of possible mechanisms. The high-humidity environment is prone to the spread of intestinal viruses, because the virus is more likely to adhere to the surface of objects such as toys, increasing the chance of infection [39,40]. In addition, laboratory experiments have found that the amount of virus in dry air drops faster than in a humid environments [41].
Although many studies have found an increased risk of HFMD at high humidity, the lagged effects we observed in this paper are unique and different from previous findings. In our study, we observed that the highest cumulative effect occurred for a relative humidity of 89.2% at lag12. However, a study in Guangdong showed that the effect of relative humidity peaked at around lag6, and another study showed that the maximum effect of relative humidity occurred at lag11 [42,43]. Climatological, socio-economic, demographic, and infrastructural variations in different areas may explain this discrepancy. As Wuhan is a city with relatively high humidity throughout the year, humans and viruses may not be as sensitive to the change in external relative humidity as they are in other cities.
As humans are exposed to a variety of meteorological factors every day, the ambient temperature may not accurately reflect the human body’s perception of exposure to the external environment. Apparent temperature, a biometeorological indicator that links ambient temperature, humidity, and wind velocity together, is considered to be a more objective index of human response to the thermal environment [31]. Meanwhile, the combined effects of meteorological factors on the transmission of HFMD pathogens may alter the association between ambient temperature and HFMD incidence. Therefore, we applied the apparent temperature rather than the ambient temperature in our sensitivity analysis to verify the robustness of our model. We found a higher risk of HFMD associated with the ambient temperature than the apparent temperature, which was consistent with a study in Spain. The study found that the daily average air temperature had a more severe impact on stroke than the apparent temperature [44]. Our results suggested that humidity and wind speed might modify the effects of temperature and reduce the risk of HFMD. An explanation of this phenomenon would be that during extreme hot days, humans dissipate heat through perspiration. Meanwhile, wind could increase the convective rate, which could accelerate the speed of sweating and mitigate the discomfort of human bodies [45]. In addition, the wind is able to reduce the concentration of virus in the air, thus decreasing the risk of infection [25].
Our research has several strengths. To the best of our knowledge, this is the first study that compared the discrepancy of effects between ambient temperature and apparent temperature on the incidence of HFMD using a distributed, non-linear model. Moreover, considering the potential confounding effects of air pollution on HFMD infection, we adjusted our results by including co-air pollutants PM2.5 and SO2 in the model to reduce the confounding effects. Third, we proposed two possible pathogeneses of temperature on the incidence of HFMD according to various lagged effects.
Despite the strengths, this ecological study has several limitations. First, we used mean values of meteorological factors and air pollutants from all monitoring stations to replace personal exposure, which may result in misclassification bias. Second, the data on HFMD were collected through passive monitoring, therefore the real amount of HFMD infection may be partly underestimated. Third, as data on personal characteristics such as gender and age are not available, we cannot examine the confounding effects resulting from these factors. Fourth, although we used the apparent temperature to estimate the combined effects of ambient temperature, relative humidity, and wind velocity, we did not look at other meteorological factors, such as sunshine duration and ultraviolet intensity, that may also play a role in the development of HFMD, due to no data being available.

5. Conclusions

Our study found significant associations of ambient temperature and relative humidity with HFMD incidence. The non-linear relationship we found between temperature and relative humidity and the incidence of HFMD at different lag days could be applied in the early targeted warning system of infectious diseases, reducing the possible outbreaks and burden of HFMD among sensitive populations. Given the similar transmission and infection mechanisms of airborne viruses, our findings may be applied to early warning systems for other infectious diseases such as influenza and mumps. In addition, we hope that this research can provide a basis for relevant research in the future and the related public health policy-makings.

Supplementary Materials

The following are available online at https://0-www-mdpi-com.brum.beds.ac.uk/1660-4601/17/2/428/s1, Figure S1: Relative risks of HFMD associated with ambient temperature and relative humidity at lag3, lag7, lag10, and lag14. Figure S2: Cumulative effects of ambient temperature and relative humidity associated with the incidence of HFMD adjusted for PM10 and SO2. Figure S3: Cumulative effects of ambient temperature and relative humidity associated with the incidence of HFMD altering the df for long-term trend.

Author Contributions

For research articles with several authors, a short paragraph specifying their individual contributions must be provided. The following statements should be used “Conceptualization, J.H. and S.L.; methodology, J.H.; validation, S.L.; formal analysis, J.H.; investigation, Z.Y.; resources, W.Y., L.T.; data curation, Z.Z. and S.H.; writing—original draft preparation, J.H.; writing—review and editing, S.L. and Y.L.; supervision, H.X.; project administration, S.L. and H.X.; funding acquisition, H.X. All authors have read and agreed to the published version of the manuscript.

Funding

We appreciate the supporting from the Natural Science Fund of Hubei Province (Grant No. 2018CFB634).

Conflicts of Interest

The authors declare no conflict of interest.

References

  1. World Health Organization (WHO). A Guide to Clinical Management and Public Health Response for Hand, Foot and Mouth Disease (HFMD). Available online: https://www.who.int/westernpacific/emergencies/surveillance/archives/hand-foot-and-mouth-disease (accessed on 25 May 2019).
  2. Park, S.K.; Park, B.; Ki, M.; Kim, H.; Lee, K.; Jung, C.; Sohn, Y.M.; Choi, S.-M.; Kim, D.-K.; Lee, D.S.; et al. Transmission of seasonal outbreak of childhood enteroviral aseptic meningitis and hand-foot-mouth disease. J. Korean Med. Sci. 2010, 25, 677–683. [Google Scholar] [CrossRef] [PubMed]
  3. Ooi, M.H.; Wong, S.C.; Lewthwaite, P.; Cardosa, M.J.; Solomon, T. Clinical features, diagnosis, and management of enterovirus 71. Lancet Neurol. 2010, 9, 1097–1105. [Google Scholar] [CrossRef]
  4. Huang, C.C.; Liu, C.C.; Chang, Y.C.; Chen, C.Y.; Wang, S.T.; Yeh, T.F. Neurologic complications in children with enterovirus 71 infection. N. Engl. J. Med. 1999, 341, 936–942. [Google Scholar] [CrossRef] [PubMed]
  5. Ho, M.; Chen, E.-R.; Hsu, K.-H.; Twu, S.-J.; Chen, K.-T.; Tsai, S.-F.; Wang, J.-R.; Shih, S.-R. An epidemic of enterovirus 71 infection in Taiwan. N. Engl. J. Med. 1999, 341, 929–935. [Google Scholar] [CrossRef] [PubMed]
  6. Zhang, Y.; Tan, X.-J.; Wang, H.-Y.; Yan, D.-M.; Zhu, S.-L.; Wang, D.-Y.; Ji, F.; Wang, X.-J.; Gao, Y.-J.; Chen, L.; et al. An outbreak of hand, foot, and mouth disease associated with subgenotype C4 of human enterovirus 71 in Shandong, China. J. Clin. Virol. 2009, 44, 262–267. [Google Scholar] [CrossRef] [PubMed]
  7. Ding, N.-Z.; Wang, X.-M.; Sun, S.-W.; Song, Q.; Li, S.-N.; He, C.-Q. Appearance of mosaic enterovirus 71 in the 2008 outbreak of China. Virus Res. 2009, 145, 157–161. [Google Scholar] [CrossRef]
  8. NHFPC. The National Statutory Epidemic Situation of Infectious Diseases in 2012. Available online: http://www.moh.gov.cn/wsb/pyqxx/201303/f02d91321f524a66a9df357a53bd0cf0.shtml (accessed on 23 April 2019).
  9. Wu, X.; Lu, Y.; Zhou, S.; Chen, L.; Xu, B. Impact of climate change on human infectious diseases: Empirical evidence and human adaptation. Environ. Int. 2016, 86, 14–23. [Google Scholar] [CrossRef] [Green Version]
  10. Liu, Z.; Zhang, J.; Zhang, Y.; Lao, J.; Liu, Y.; Wang, H.; Jiang, B. Effects and interaction of meteorological factors on influenza: Based on the surveillance data in Shaoyang, China. Environ. Res. 2019, 172, 326–332. [Google Scholar] [CrossRef]
  11. Xiao, Y.; He, L.; Chen, Y.; Wang, Q.; Meng, Q.; Chang, W.; Xiong, L.; Yu, Z. The influence of meteorological factors on tuberculosis incidence in Southwest China from 2006 to 2015. Sci. Rep. 2018, 8, 10053. [Google Scholar] [CrossRef]
  12. Yu, G.; Yang, R.; Yu, D.; Cai, J.; Tang, J.; Zhai, W.; Wei, Y.; Chen, S.; Chen, Q.; Zhong, G.; et al. Impact of meteorological factors on mumps and potential effect modifiers: An analysis of 10 cities in Guangxi, Southern China. Environ. Res. 2018, 166, 577–587. [Google Scholar] [CrossRef]
  13. Onozuka, D.; Hashizume, M. The influence of temperature and humidity on the incidence of hand, foot, and mouth disease in Japan. Sci. Total Environ. 2011, 410–411, 119–125. [Google Scholar] [CrossRef] [PubMed]
  14. Wu, H.; Wang, H.; Wang, Q.; Xin, Q.; Lin, H. The effect of meteorological factors on adolescent hand, foot, and mouth disease and associated effect modifiers. Glob. Health Action 2014, 7, 24664. [Google Scholar] [CrossRef] [PubMed]
  15. Yang, Y.; You, E.; Wu, J.; Zhang, W.; Jin, J.; Zhou, M.; Jiang, C.; Huang, F. Effects of relative humidity on childhood hand, foot, and mouth disease reinfection in Hefei, China. Sci. Total Environ. 2018, 630, 820–826. [Google Scholar] [CrossRef] [PubMed]
  16. Ma, E.; Lam, T.; Wong, C.; Chuang, S.K. Is hand, foot and mouth disease associated with meteorological parameters? Epidemiol. Infect. 2010, 138, 1779–1788. [Google Scholar] [CrossRef] [Green Version]
  17. Chen, C.; Lin, H.; Li, X.; Lang, L.; Xiao, X.; Ding, P.; He, P.; Zhang, Y.; Wang, M.; Liu, Q. Short-term effects of meteorological factors on children hand, foot and mouth disease in Guangzhou, China. Int. J. Biometeorol. 2014, 58, 1605–1614. [Google Scholar] [CrossRef]
  18. Huang, R.; Bian, G.; He, T.; Chen, L.; Xu, G. Effects of meteorological parameters and PM10 on the Incidence of hand, foot, and mouth disease in children in China. Int. J. Environ. Res. Public Health 2016, 13, 481. [Google Scholar] [CrossRef] [Green Version]
  19. Zhao, D.; Wang, L.; Cheng, J.; Xu, J.; Xu, Z.; Xie, M.; Yang, H.; Li, K.; Wen, L.; Wang, X.; et al. Impact of weather factors on hand, foot and mouth disease, and its role in short-term incidence trend forecast in Huainan City, Anhui Province. Int. J. Biometeorol. 2017, 61, 453–461. [Google Scholar] [CrossRef]
  20. Zhang, Z.; Xie, X.; Chen, X.; Li, Y.; Lu, Y.; Mei, S.; Liao, Y.; Lin, H. Short-term effects of meteorological factors on hand, foot and mouth disease among children in Shenzhen, China: Non-linearity, threshold and interaction. Sci. Total Environ. 2016, 539, 576–582. [Google Scholar] [CrossRef]
  21. Du, Z.; Zhang, W.; Zhang, D.; Yu, S.; Hao, Y. The threshold effects of meteorological factors on Hand, foot, and mouth disease (HFMD) in China, 2011. Sci. Rep. 2016, 6, 36351. [Google Scholar] [CrossRef] [Green Version]
  22. Lin, Y.-C.; Juan, H.-C.; Cheng, Y.-C. Ozone exposure in the culture medium inhibits enterovirus 71 virus replication and modulates cytokine production in rhabdomyosarcoma cells. Antivir. Res. 2007, 76, 241–251. [Google Scholar] [CrossRef]
  23. Yu, G.; Li, Y.; Cai, J.; Yu, D.; Tang, J.; Zhai, W.; Wei, Y.; Chen, S.; Chen, Q.; Qin, J. Short-term effects of meteorological factors and air pollution on childhood hand-foot-mouth disease in Guilin, China. Sci. Total Environ. 2019, 646, 460–470. [Google Scholar] [CrossRef] [PubMed]
  24. Jiao, K.; Hu, W.; Ren, C.; Xu, Z.; Ma, W. Impacts of tropical cyclones and accompanying precipitation and wind velocity on childhood hand, foot and mouth disease in Guangdong Province, China. Environ. Res. 2019, 173, 262–269. [Google Scholar] [CrossRef] [PubMed]
  25. Zhang, Q.; Zhou, M.; Yang, Y.; You, E.; Wu, J.; Zhang, W.; Jin, J.; Huang, F. Short-term effects of extreme meteorological factors on childhood hand, foot, and mouth disease reinfection in Hefei, China: A distributed lag non-linear analysis. Sci. Total Environ. 2019, 653, 839–848. [Google Scholar] [CrossRef] [PubMed]
  26. Du, Z.; Lawrence, W.R.; Zhang, W.; Zhang, D.; Yu, S.; Hao, Y. Interactions between climate factors and air pollution on daily HFMD cases: A time series study in Guangdong, China. Sci. Total Environ. 2019, 656, 1358–1364. [Google Scholar] [CrossRef]
  27. Zhong, P.; Huang, S.; Zhang, X.; Wu, S.; Zhu, Y.; Li, Y.; Ma, L. Individual-level modifiers of the acute effects of air pollution on mortality in Wuhan, China. Glob. Health Res. Policy 2018, 3, 27. [Google Scholar] [CrossRef]
  28. Health, C.M.o. Diagnostic Criteria and Principle of Management for Hand Foot Mouth Disease. Available online: http://www.nhc.gov.cn/yzygj/s3593g/201306/6d935c0f43cd4a1fb46f8f71acf8e245.shtml (accessed on 21 April 2019).
  29. Wei, Q.; Wu, J.; Zhang, Y.; Cheng, Q.; Bai, L.; Duan, J.; Gao, J.; Xu, Z.; Yi, W.; Pan, R.; et al. Short-term exposure to sulfur dioxide and the risk of childhood hand, foot, and mouth disease during different seasons in Hefei, China. Sci. Total Environ. 2019, 658, 116–121. [Google Scholar] [CrossRef]
  30. Yin, F.; Zhang, T.; Liu, L.; Lv, Q.; Li, X. The association between ambient temperature and childhood hand, foot, and mouth disease in Chengdu, China: A distributed lag non-linear analysis. Sci. Rep. 2016, 6, 27305. [Google Scholar] [CrossRef]
  31. Steadman, R.G. A universal scale of apparent temperature. J. Clim. Appl. Meteorol. 1984, 23, 1674–1687. [Google Scholar] [CrossRef]
  32. Smith, G.S.; Van Den Eeden, S.K.; Garcia, C.; Shan, J.; Baxter, R.; Herring, A.H.; Richardson, D.B.; Van Rie, A.; Emch, M.; Gammon, M.D. Air pollution and pulmonary tuberculosis: A nested case-control study among members of a northern California health plan. Environ. Health Perspect. 2016, 124, 761–768. [Google Scholar] [CrossRef]
  33. Gasparrini, A.; Armstrong, B.; Kenward, M.G. Distributed lag non-linear models. Stat. Med. 2010, 29, 2224–2234. [Google Scholar] [CrossRef] [Green Version]
  34. Huang, J.; Chen, S.; Wu, Y.; Tong, Y.; Wang, L.; Zhu, M.; Hu, S.; Guan, X.; Wei, S. Quantifying the influence of temperature on hand, foot and mouth disease incidence in Wuhan, Central China. Sci. Rep. 2018, 8, 1934. [Google Scholar] [CrossRef] [PubMed] [Green Version]
  35. Liao, J.; Yu, S.; Yang, F.; Yang, M.; Hu, Y.; Zhang, J. Short-Term Effects of Climatic Variables on Hand, Foot, and Mouth Disease in Mainland China, 2008–2013: A Multilevel Spatial Poisson Regression Model Accounting for Overdispersion. PLoS ONE 2016, 11, e0147054. [Google Scholar] [CrossRef] [PubMed]
  36. Altizer, S.; Dobson, A.; Hosseini, P.; Hudson, P.; Pascual, M.; Rohani, P. Seasonality and the dynamics of infectious diseases. Ecol. Lett. 2010, 9, 467–484. [Google Scholar] [CrossRef] [PubMed] [Green Version]
  37. Xiao, X.; Gasparrini, A.; Huang, J.; Liao, Q.; Liu, F.; Yin, F.; Yu, H.; Li, X. The exposure-response relationship between temperature and childhood hand, foot and mouth disease: A multicity study from mainland China. Environ. Int. 2017, 100, 102–109. [Google Scholar] [CrossRef]
  38. Bertrand, I.; Schijven, J.F.; Sánchez, G.; Wyn-Jones, P.; Ottoson, J.; Morin, T.; Muscillo, M.; Verani, M.; Nasser, A.; Husman, A.M. The impact of temperature on the inactivation of enteric viruses in food and water: A review. J. Appl. Microbiol. 2012, 112, 1059–1074. [Google Scholar] [CrossRef]
  39. Fletcher, J. The importance of correctly choosing a bandage and bandaging technique. Nurs. Times 2004, 100, 52. [Google Scholar]
  40. Wong, S.S.Y.; Yip, C.C.Y.; Lau, S.K.P.; Yuen, K.Y. Human enterovirus 71 and hand, foot and mouth disease. Epidemiol. Infect. 2010, 138, 1071–1089. [Google Scholar] [CrossRef] [Green Version]
  41. Abad, F.X.; Pintó, R.M.; Bosch, A. Survival of enteric viruses on environmental fomites. Appl. Environ. Microbiol. 1994, 60, 3704–3710. [Google Scholar] [CrossRef] [Green Version]
  42. Guo, F.; Zhang, C.; Wang, H.-q.; Sheng, X.; Xiao, L.; Sun, Y.-h.; Yang, B. Application of a laser-guided docking system in robot-assisted urologic surgery. Int. J. Med Robot. Comput. Assist. Surg. 2016, 12, 524–527. [Google Scholar] [CrossRef]
  43. Yang, H.; Wu, J.; Cheng, J.; Wang, X.; Wen, L.; Li, K.; Su, H. Is high relative humidity associated with childhood hand, foot, and mouth disease in rural and urban areas? Public Health 2017, 142, 201–207. [Google Scholar] [CrossRef]
  44. Royé, D.; Zarrabeitia, M.T.; Riancho, J.; Santurtún, A. A time series analysis of the relationship between apparent temperature, air pollutants and ischemic stroke in Madrid, Spain. Environ. Res. 2019, 173, 349–358. [Google Scholar] [CrossRef] [PubMed]
  45. Vanos, J.K.; Kosaka, E.; Iida, A.; Yokohari, M.; Middel, A.; Scott-Fleming, I.; Brown, R.D. Planning for spectator thermal comfort and health in the face of extreme heat: The Tokyo 2020 Olympic marathons. Sci. Total Environ. 2019, 657, 904–917. [Google Scholar] [CrossRef] [PubMed]
Figure 1. Seasonal fluctuations in meteorological factors, air pollutants, and HFMD cases in Wuhan, China from 1 February 2013 to 31 January 2017.
Ijerph 17 00428 g001
Figure 2. Three dimensional (3D) lag–response curves specific to ambient temperature and relative humidity.
Ijerph 17 00428 g002
Figure 3. Cumulative effects of ambient temperature and relative humidity on HFMD incidence within 14 days.
Ijerph 17 00428 g003
Figure 4. The distributed lagged effects of extreme ambient temperature and relative humidity on the incidence of HFMD at various lag days. The medium value of each variable was selected as the reference.
Ijerph 17 00428 g004
Figure 5. Cumulative effects of ambient temperature and apparent temperature on the incidence of HFMD. The medium value of each variable was selected as the reference.
Ijerph 17 00428 g005
Table 1. Description of meteorological factors, air pollution, and hand, foot and mouth disease (HFMD) cases in Wuhan from 1 February 2013 to 31 January 2017.
VariablesMean ± SDMin25th50th75thMax
Ambient Temperature (°C)17.29 ± 8.97−4.329.5518.4024.8033.45
Apparent Temperature (°C)14.62 ± 9.54−8.556.3215.6422.7731.76
Relative Humidity (%)77.90 ± 10.9940.6670.5478.6586.09100.00
Wind Velocity (m/s)1.73 ± 0.950.901.041.542.217.16
Atmospheric Pressure (hPa)1012.93 ± 9.39994.221004.761012.591020.481041.62
Vapor Pressure (hPa)17.07 ± 8.862.258.6616.0524.6636.73
PM10 (μg/m3)109.98 ± 57.4312.2367.90100.13140.36405.97
PM2.5 (μg/m3)72.28 ± 48.538.2438.5960.2290.86299.50
SO2 (μg/m3)25.31 ± 17.673.7012.9020.6932.14107.58
HFMD (counts/day)44.80 ± 38.110173164239
Table 2. Spearman correlation between ambient temperature, apparent temperature, relative humidity, wind velocity, atmospheric pressure, vapor pressure, SO2, PM10, and PM2.5.
VariablesAmbient TemperatureApparent TemperatureRelative HumidityWind VelocityAtmospheric PressureVapor PressurePM10PM2.5SO2
Ambient Temperature1
Apparent Temperature0.998 *1
Relative Humidity−0.085 *−0.075 *1
Wind Velocity0.092 *0.037−0.124 *1
Atmospheric Pressure−0.908 *−0.904 *−0.074 *−0.135 *1
Vapor Pressure0.963 *0.965 *0.166 *0.061 *−0.917 *1
PM10−0.273 *−0.263 *−0.378 *−0.274 *0.329 *−0.376 *1
PM2.5−0.496 *−0.487 *−0.141 *−0.233 *0.488 *−0.531 *0.869 *1
SO2−0.272 *−0.268 *−0.350 *−0.109 *0.263 *−0.361 *0.533 *0.551 *1
* p < 0.05.
Table 3. The cumulative effects of extreme meteorological factors on the incidence of HFMD at lag0–14.
PercentileAmbient TemperatureRelative Humidity
Value (°C)RR (95% CI)Value (%)RR (95% CI)
1th−0.11.697 (1.113–2.588)49.20.805 (0.597–1.086)
5th2.91.756 (1.224–2.518)59.00.878 (0.746–1.033)
10th5.01.681 (1.202–2.351)63.50.900 (0.769–1.053)
90th28.71.919 (1.530–2.407)92.21.474 (1.261–1.722)
95th31.01.616 (1.221–2.138)94.71.304 (1.113–1.528)
99th32.51.297 (0.916–1.839)97.51.044 (0.841–1.297)
Low temperature and relative humidity: 1st, 5th, and 10th percentiles; High temperature and relative humidity: 90th, 95th, and 99th percentiles. RR: Relative risk.
Table 4. The largest cumulative effects of ambient temperature and relative humidity on the incidence of HFMD by lag period.
LagAmbient TemperatureRelative Humidity
Value (°C)RR (95% CI)Value (%)RR (95% CI)
0–1−4.31.543 (1.047–2.275)51.31.067 (0.966–1.178)
0–2−4.31.893 (1.249–2.869)60.51.073 (0.994–1.157)
0–3−4.32.238 (1.460–3.431)62.91.072 (0.986–1.165)
0–4−4.32.521 (1.623–3.914)88.11.109 (1.020–1.207)
0–5−4.32.691 (1.704–4.249)88.51.165 (1.061–1.278)
0–6−4.32.725 (1.686–4.405)88.71.222 (1.105–1.352)
0–7−4.32.631 (1.576–4.393)88.81.281 (1.149–1.428)
0–8−4.32.444 (1.412–4.230)88.81.339 (1.192–1.504)
0–9−4.32.208 (1.237–3.942)88.91.396 (1.234–1.579)
0–10−4.31.965 (1.076–3.589)89.01.450 (1.273–1.651)
0–11−1.41.795 (1.169–2.757)89.11.498 (1.306–1.719)
0–1228.31.791 (1.467–2.186)89.21.537 (1.329–1.779)
0–1328.21.847 (1.502–2.273)89.21.559 (1.337–1.818)
0–1427.91.945 (1.570–2.408)89.21.553 (1.322–1.824)
RR: Relative risk.

