Cookstove Smoke Impact on Ambient Air Quality and Probable Consequences for Human Health in Rural Locations of Southern Nepal

 ,
,
Abstract
:1. Introduction
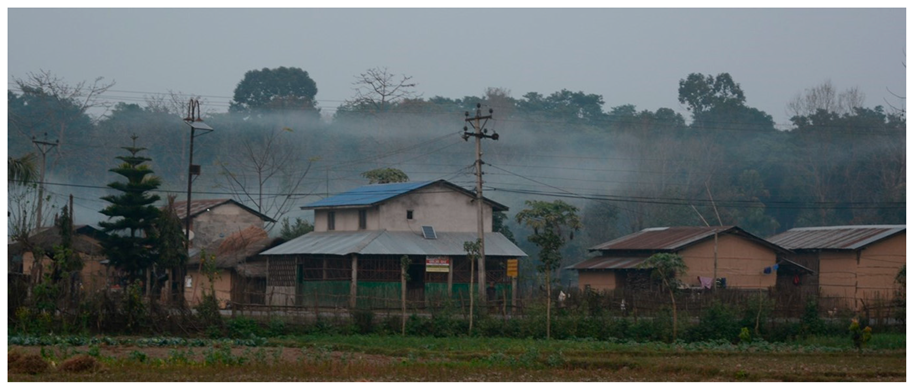
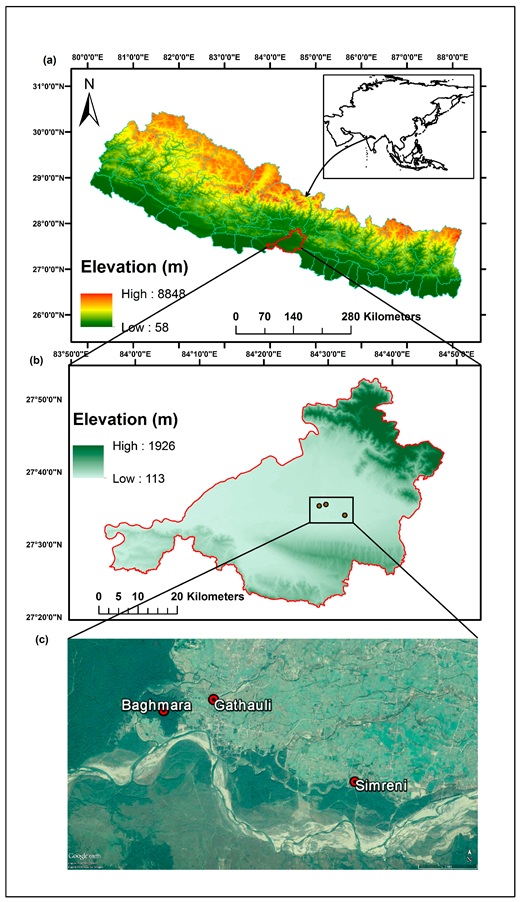
2. Study Site
3. Materials and Methods
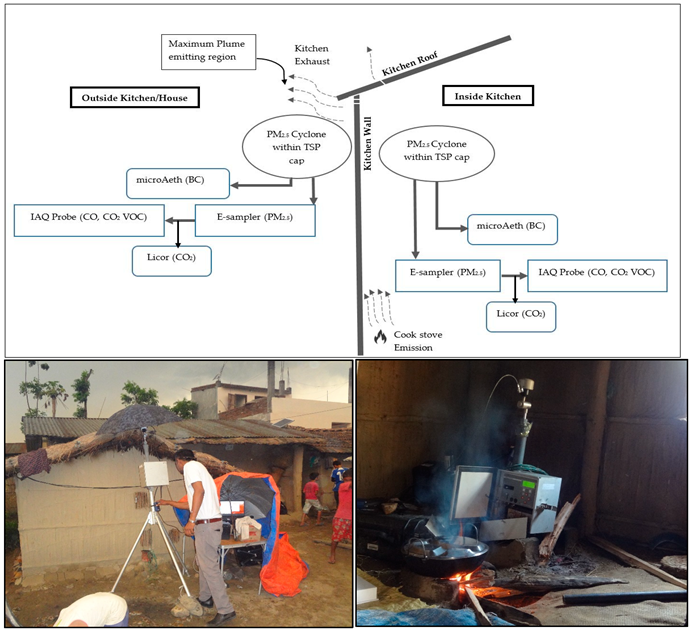
3.1. Ambient Measurements
3.2. Inside-Outside Concentration Measurements
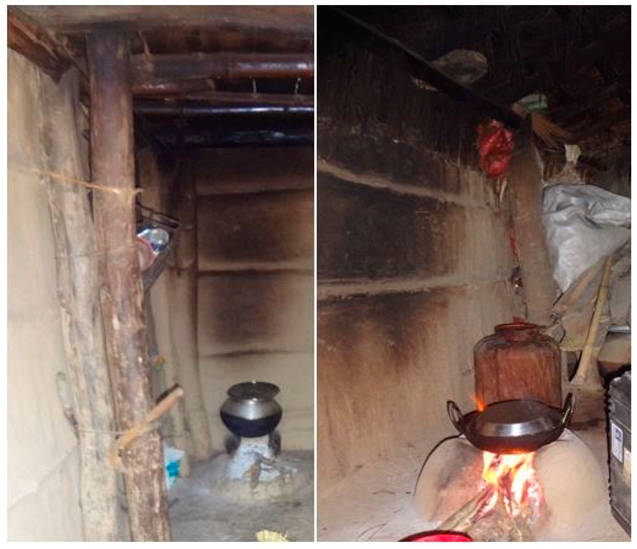
3.3. Kitchen and Fuel Composition
3.4. Emission Factor Calculation
3.5. Air Q+
4. Results and Discussion
4.1. Inside/Outside Cookstove Emissions

| Kitchen | Concentration (µg/m3) | Concentration (ppm) | Emission Factor (g/kg) | MCE | Out/In (%) Contribution | |||||||||||||
|---|---|---|---|---|---|---|---|---|---|---|---|---|---|---|---|---|---|---|
| In | Out | In | Out | In | Out | |||||||||||||
| PM2.5 | BC | PM2.5 | BC | CO | CO2 | CO | CO2 | CO2 | CO | PM2.5 | BC | CO | PM2.5 | BC | PM2.5 | BC | ||
| 1 | 1527 | 476 | 772 | 314 | 36 | 568 | 26 | 422 | 1716 | 68 | 6.2 | 1.9 | 66 | 4.2 | 1.7 | 0.94 | 68 | 89 |
| 2 | 6753 | 1213 | 1691 | 376 | 75 | 563 | 32 | 244 | 1580 | 135 | 25.4 | 4.6 | 133 | 14.8 | 3.3 | 0.88 | 58 | 72 |
| 3 | 4513 | 707 | 3083 | 493 | 69 | 708 | 51 | 529 | 1647 | 102 | 14.1 | 2.2 | 10 | 12.9 | 2.1 | 0.91 | 92 | 93 |
| 4 | 9533 | 1616 | 2115 | 514 | 132 | 1372 | 57 | 669 | 1657 | 101 | 15.4 | 2.6 | 91 | 7.1 | 1.7 | 0.91 | 46 | 66 |
| Average | 5581 | 1003 | 1915 | 424 | 78 | 803 | 41 | 466 | 1650 | 101 | 15.3 | 2.8 | 97 | 9.8 | 2.2 | 0.91 | 66 | 80 |
| Previous studies | Location | |||||||||||||||||
| Kurmi et al. [62] | 5648 | - | - | - | Nepal (n = 24) | |||||||||||||
| Chen et al. [38] | 3469 | - | - | - | Nepal (n = 2980) | |||||||||||||
| Jayarathne et al. [39] | 9027 | - | - | - | Nepal (n = 18) (Lab) | |||||||||||||
| Sota et al. [63] | 10,563 | - | - | - | Senegal (n = 8) | |||||||||||||
| Roden and Bond [44] | - | - | 4.9–16.1 | 0.2–3.4 | Hondurus (n = 12) | |||||||||||||
| Venkataraman et al. [69] | - | - | - | 0.38–0.62 | India (n = 4) | |||||||||||||
| Street et al. [21] | - | - | 3.90 | - | Estimation | |||||||||||||
| Akagi et al. [41] | - | - | 6.64 | 0.83 | Compilation | |||||||||||||
| Stockwell et al. [40] | - | - | 0.22 | - | Nepal (n = 2) | |||||||||||||
| Jayarathne et al. [39] | 12,877 | 677.9 | 10.66 | - | Nepal (n = 2) | |||||||||||||
| Grieshop et al. [67] | - | - | 1.70 | 0.24–2.4 | India (n = 26) | |||||||||||||
| Guofeng et al. [43] | - | - | 2.2 | 0.83 | China (n = 17) | |||||||||||||
| Dasch [70] | - | - | 10 | - | India (n = 18) | |||||||||||||
| Saud et al. [71] | - | - | 4.34 | - | India (n = 18) | |||||||||||||
| Saud et al. [29] | - | - | - | 0.35 | India (n = 17) | |||||||||||||
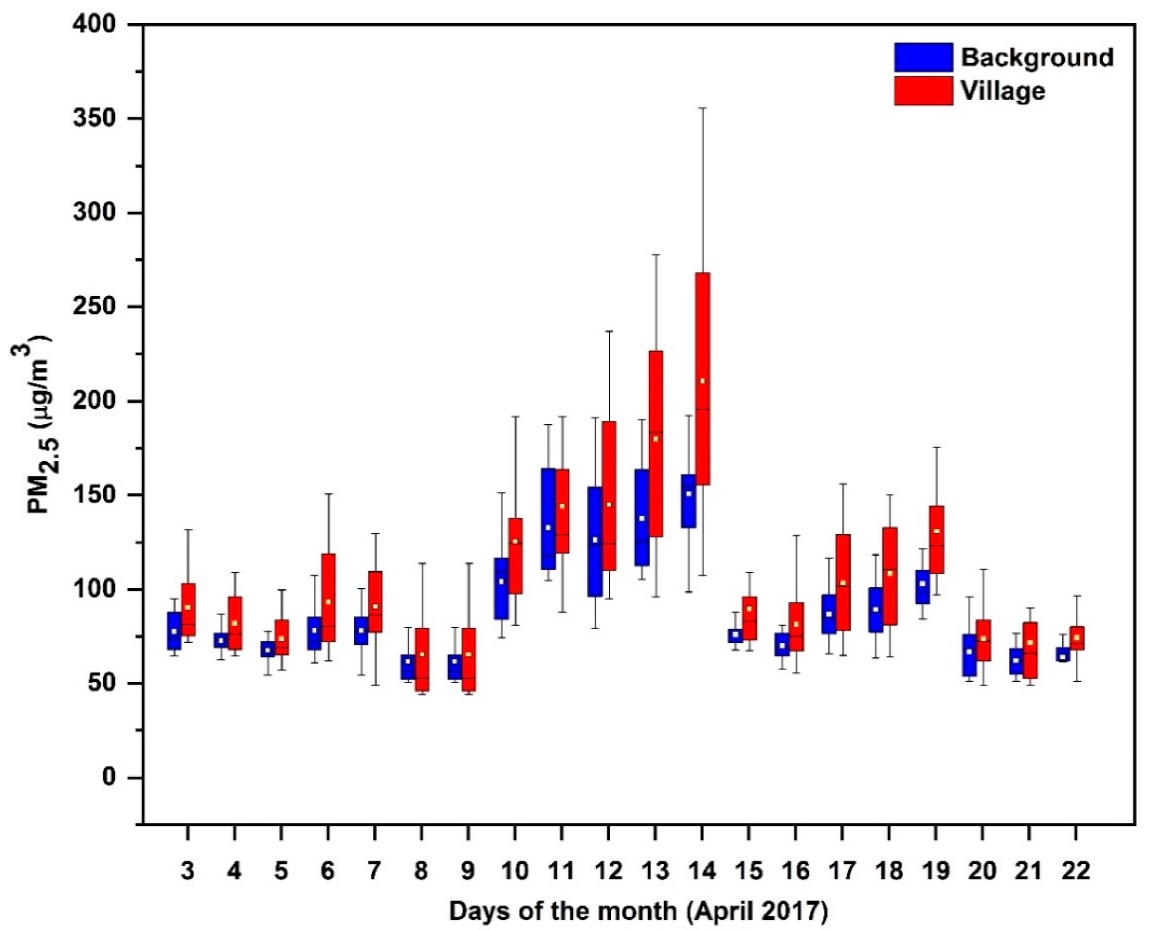
4.2. Ambient PM2.5 Variation with Meteorology
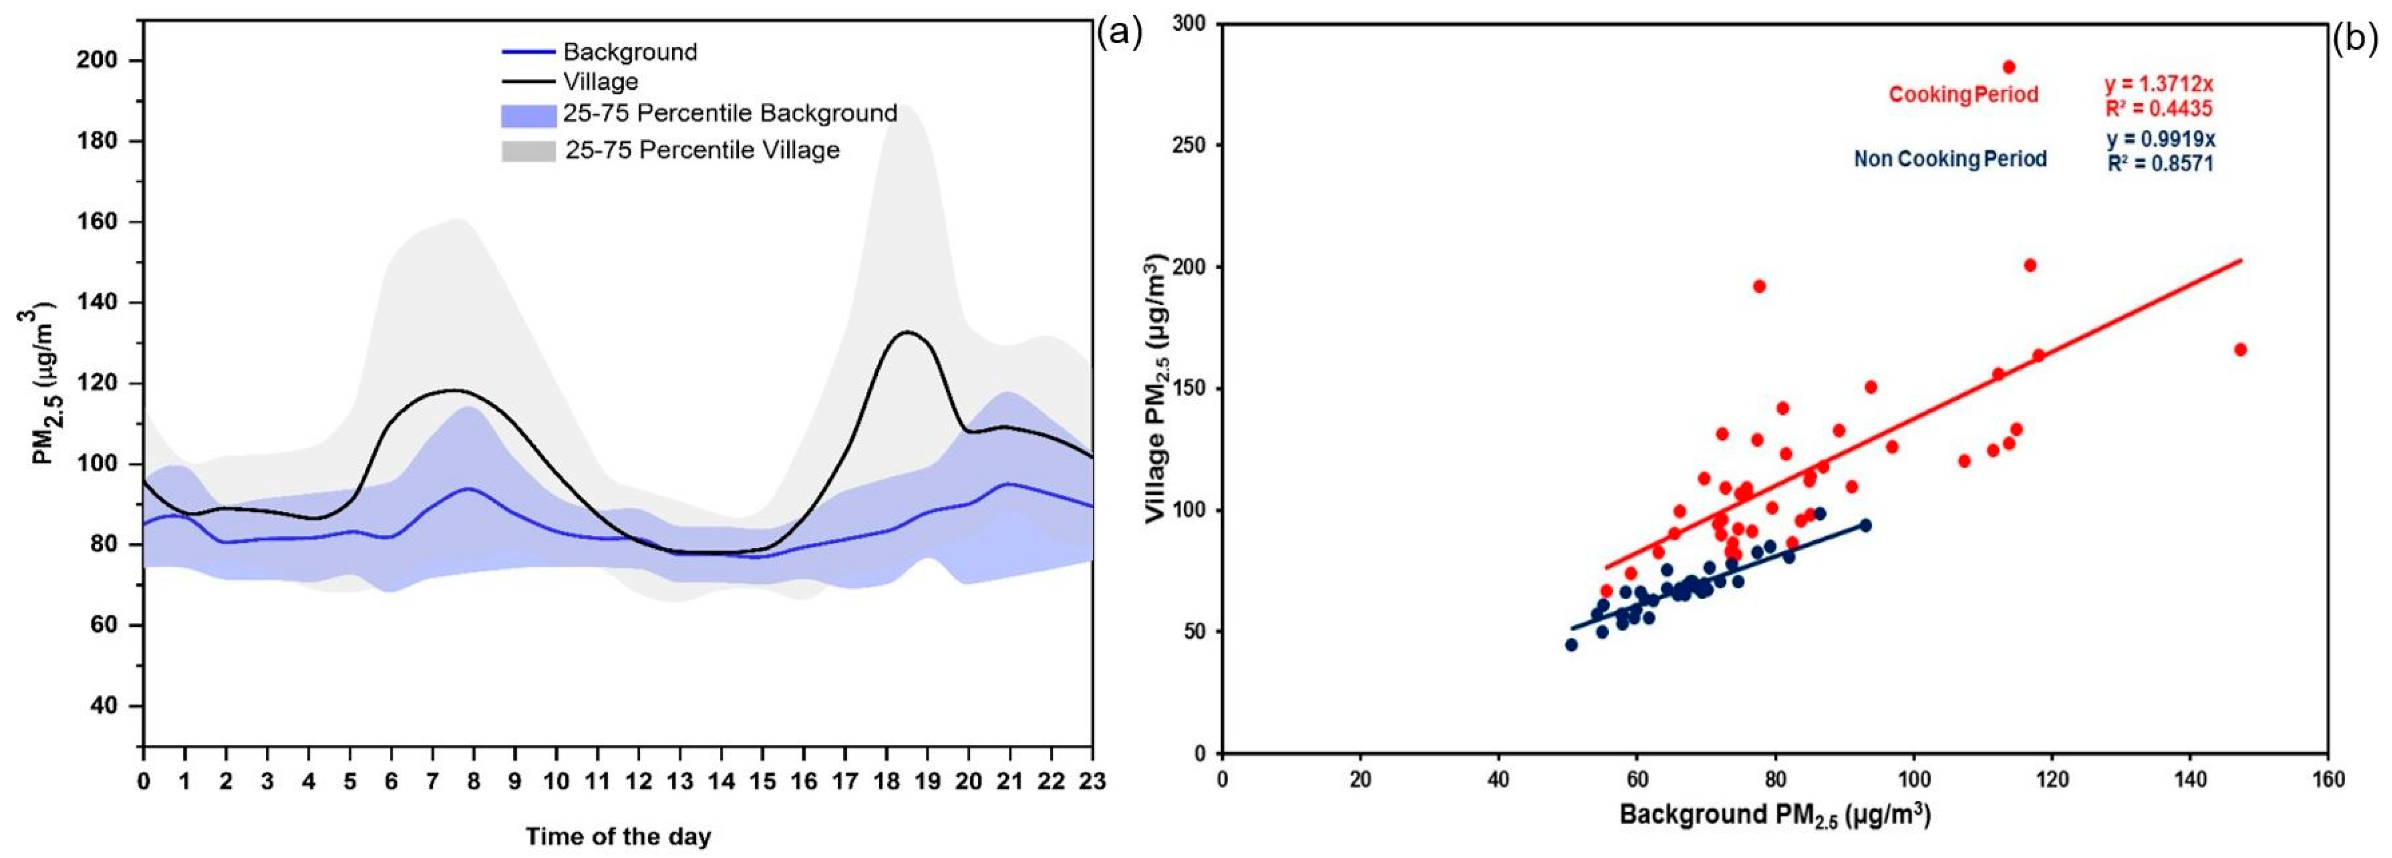
4.3. Estimating the Effect of Cookstove
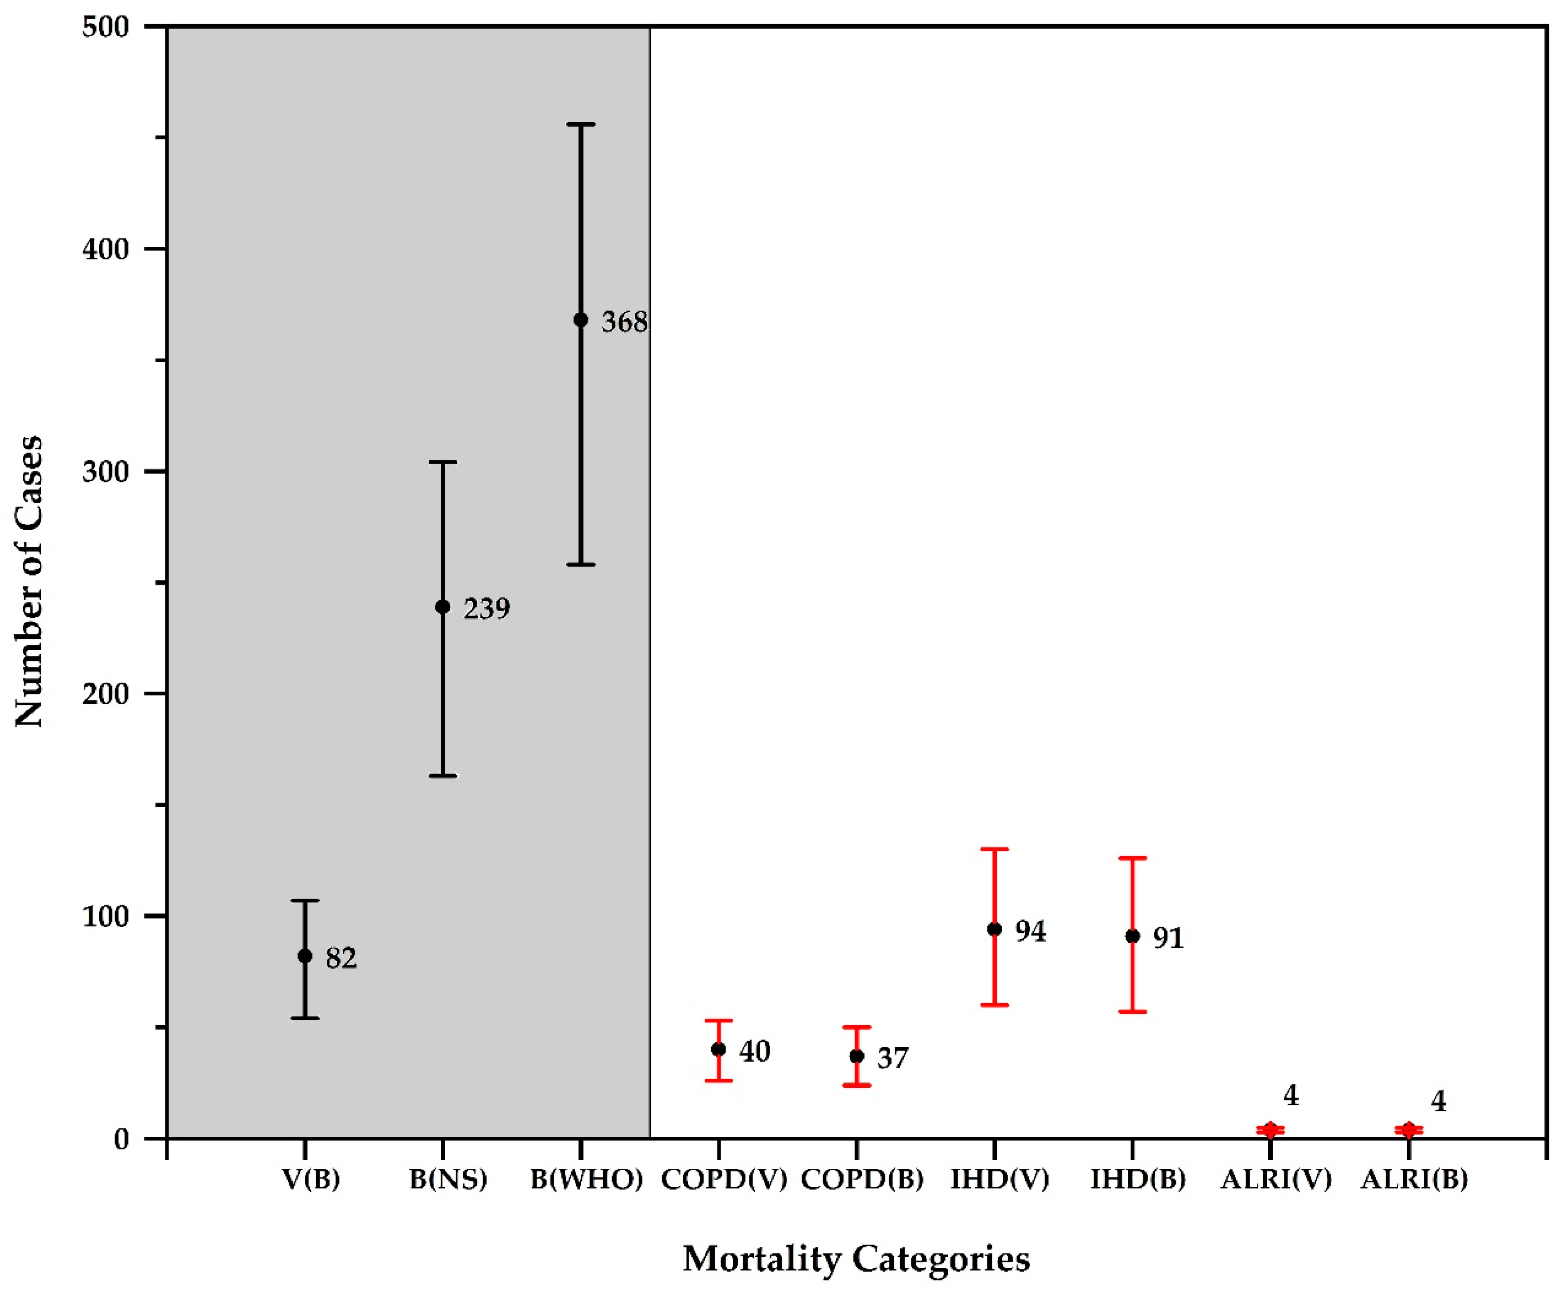
4.4. Health Risk Assessment Using Air Q+
4.5. Limitation
5. Conclusions
Supplementary Materials
Author Contributions
Acknowledgments
Data Availability
Conflicts of Interest
References
- World Health Organization. World Health Statistics 2018: Monitoring Health for the SDGs, Sustainable Development Goals; WHO: Geneva, Switzerland, 2018. [Google Scholar]
- Johnson, M.; Lam, N.; Brant, S.; Gray, C.; Pennise, D. Modeling indoor air pollution from cookstove emissions in developing countries using a Monte Carlo single-box model. Atmos. Environ. 2011, 45, 3237–3243. [Google Scholar] [CrossRef]
- Colbeck, I.; Nasir, Z.A.; Ali, Z. Characteristics of indoor/outdoor particulate pollution in urban and rural residential environment of Pakistan. Indoor Air 2010, 20, 40–51. [Google Scholar] [CrossRef] [PubMed]
- Wang, F.; Meng, D.; Li, X.; Tan, J. Indoor-outdoor relationships of PM2.5 in four residential dwellings in winter in the Yangtze River Delta, China. Environ. Pollut. 2016, 215, 280–289. [Google Scholar] [CrossRef] [PubMed]
- Venkataraman, C.; Habib, G.; Miguel, A.H.; Friedlander, S.K. Residential Biofuels in South Asia: Carbonaceous Aerosol Emissions and Climate Impacts. Science 2005, 307, 1454–1456. [Google Scholar] [CrossRef] [PubMed] [Green Version]
- Chafe, Z.A.; Brauer, M.; Klimont, Z.; Dingenen, R.V.; Mehta, S.; Rao, S. Household Cooking with Solid Fuels Contributes to Ambient PM2.5 Air Pollution and the Burden of Disease. Environ. Health Perspect. 2014, 122, 1314–1320. [Google Scholar] [CrossRef] [PubMed] [Green Version]
- Chowdhury, Z.; Zheng, M.; Schauer, J.J.; Sheesley, R.J.; Salmon, L.G.; Cass, G.R.; Russell, A.G. Speciation of ambient fine organic carbon particles and source apportionment of PM2.5 in Indian cities. J. Geophys. Res. 2007, 112. [Google Scholar] [CrossRef]
- Butt, E.W.; Rap, A.; Schmidt, A.; Scott, C.E.; Pringle, K.J.; Reddington, C.L.; Richards, N.A.D.; Woodhouse, M.T.; Ramirez-Villegas, J.; Yang, H.; et al. The impact of residential combustion emissions on atmospheric aerosol, human health, and climate. Atmos. Chem. Phys. 2016, 16, 873–905. [Google Scholar] [CrossRef] [Green Version]
- Patel, S.; Leavey, A.; He, S.; Fang, J.; Malley, K.O.; Biswas, P. Characterization of gaseous and particulate pollutants from gasification- based improved cookstoves. Energy Sustain. Dev. 2016, 32, 130–139. [Google Scholar] [CrossRef] [Green Version]
- Wangchuk, T.; He, C.; Knibbs, L.D.; Mazaheri, M.; Morawaska, L. A pilot study of traditional indoor biomass cooking and heating in rural Bhutan: Gas and particle concentrations and emission rates. Indoor Air 2016, 27, 1–9. [Google Scholar] [CrossRef] [Green Version]
- Smith, K.R.; Samet, J.M.; Romieu, I.; Bruce, N. Indoor air pollution in developing countries and acute lower respiratory infections in children. Thorax 2000, 55, 518–532. [Google Scholar] [CrossRef] [Green Version]
- Zhang, X.; Chen, X.; Zhang, X. The impact of exposure to air pollution on cognitive performance. Proc. Natl. Acad. Sci. 2018, 115, 9193–9197. [Google Scholar] [CrossRef] [PubMed] [Green Version]
- Rajagopalan, S.; Brook, R.D. Air Pollution and Type 2 Diabetes Mechanistic Insights. Diabetes 2012, 61, 3037–3045. [Google Scholar] [CrossRef] [PubMed] [Green Version]
- Pokhrel, A.K.; Smith, K.R.; Khalakdina, A.; Deuja, A.; Bates, M.N. Case-control study of indoor cooking smoke exposure and cataract in Nepal and India. Int. J. Epidemiol. 2005, 34, 1–7. [Google Scholar] [CrossRef] [PubMed] [Green Version]
- Ramanathan, V.; Carmichael, G. Global and regional climate changes due to black carbon. Nat. Geosci. 2008, 1, 221–227. [Google Scholar] [CrossRef]
- Rehman, I.H.; Ahmed, T.; Praveen, P.S.; Kar, A.; Ramanathan, V. Black carbon emissions from biomass and fossil fuels in rural India. Atmos. Chem. Phys. 2011, 11, 7289–7299. [Google Scholar] [CrossRef] [Green Version]
- Bond, T.C.; Doherty, S.J.; Fahey, D.W.; Forster, P.M.; Berntsen, T.; Deangelo, B.J.; Flanner, M.G.; Ghan, S.; Kärcher, B.; Koch, D.; et al. Bounding the role of black carbon in the climate system: A scientific assessment. J. Geophys. Res. Atmos. 2013, 118, 5380–5552. [Google Scholar] [CrossRef]
- Bond, T.C.; Streets, D.G.; Yarber, K.F.; Nelson, S.M.; Woo, J.H.; Klimont, Z. A technology-based global inventory of black and organic carbon emissions from combustion. J. Geophys. Res. Atmos. 2004, 109, 1–43. [Google Scholar] [CrossRef] [Green Version]
- Menon, S.; Koch, D.; Beig, G.; Sahu, S.; Fasullo, J.; Orlikowski, D. Black carbon aerosols and the third polar ice cap. Atmos. Chem. Phys. 2010, 10, 4559–4571. [Google Scholar] [CrossRef] [Green Version]
- Janseen, N.A.; Gerlofs-Nijland, M.E.; Lanki, T.; Salonen, R.O.; Cassee, F.; Hoek, G.; Fisher, P.; Bert, B.; Krzyzanowki, M. Health Effects of Black Carbon; World Health Organization, Regional Office for Europe: Copenhagen, Denmark, 2012. [Google Scholar]
- Streets, D.G.; Bond, T.C.; Lee, T.; Jang, C. On the future of carbonaceous aerosol emissions. J. Geophys. Res. D Atmos. 2004, 109, 1–19. [Google Scholar] [CrossRef]
- Smith, K.R.; Jerrett, M.; Anderson, H.R.; Burnett, R.T.; Stone, V.; Derwent, R.; Atkinson, R.W.; Cohen, A.; Shonkoff, S.B.; Krewski, D.; et al. Public health benefits of strategies to reduce greenhouse-gas emissions: Health implications of short-lived greenhouse pollutants. Lancet 2009, 374, 2091–2103. [Google Scholar] [CrossRef] [Green Version]
- Park, E.; Lee, K. Particulate exposure and size distribution from wood burning stoves in Costa Rica. Indoor Air 2003, 13, 253–259. [Google Scholar] [CrossRef] [PubMed]
- Chen, J.; Li, C.; Ristovski, Z.; Milic, A.; Gu, Y.; Islam, M.S.; Wang, S.; Hao, J.; Zhang, H.; He, C.; et al. A review of biomass burning: Emissions and impacts on air quality, health and climate in China. Sci. Total Environ. 2017, 579, 1000–1034. [Google Scholar] [CrossRef] [PubMed] [Green Version]
- He, C.; Morawska, L.; Hitchins, J.; Gilbert, D. Contribution from indoor sources to particle number and mass concentrations in residential houses. Atmos. Environ. 2004, 38, 3405–3415. [Google Scholar] [CrossRef]
- Monn, C.; Fuchs, A.; Kogelschatz, D.; Wanner, H. Comparison of indoor and outdoor concentrations of PM-10 and PM-2. J. Aerosol Sci. 1995, 26, 515–516. [Google Scholar] [CrossRef]
- Soneja, S.I.; Tielsch, J.M.; Curriero, F.C.; Zaitchik, B.; Khatry, S.K.; Yan, B.; Chillrud, S.N.; Breysse, P.N. Determining Particulate Matter and Black Carbon Exfiltration Estimates For Traditional Cookstove Use In Rural Nepalese Village Households. Environ. Sci. Technol. 2015, 49, 5555–5562. [Google Scholar] [CrossRef] [PubMed] [Green Version]
- Mcdonald, J.D.; Zielinska, B.; Fujita, E.M.; Sagebiel, J.C.; Chow, J.C.; Watson, J.G. Fine Particle and Gaseous Emission Rates from Residential Wood Combustion. Environ. Sci. Technol. 2000, 34, 2080–2091. [Google Scholar] [CrossRef]
- Saud, T.; Mandal, T.K.; Gadi, R.; Singh, D.P.; Sharma, S.K.; Saxena, M.; Mukherjee, A. Emission estimates of particulate matter (PM) and trace gases (SO2, NO and NO2 ) from biomass fuels used in rural sector of Indo-Gangetic Plain, India. Atmos. Environ. 2011, 45, 5913–5923. [Google Scholar] [CrossRef]
- Stewart, D.R.; Saunders, E.; Perea, R.A.; Fitzgerald, R.; Campbell, D.E.; Stockwell, W.R. Linking Air Quality and Human Health Effects Models: An Application to the Los Angeles Air Basin. Environ. Health Insights 2017, 11. [Google Scholar] [CrossRef] [Green Version]
- Oliveri Conti, G.; Heibati, B.; Kloog, I.; Fiore, M.; Ferrante, M. A review of AirQ Models and their applications for forecasting the air pollution health outcomes. Environ. Sci. Pollut. Res. 2017, 24, 6426–6445. [Google Scholar] [CrossRef]
- CBS. Environment Statistics of Nepal 2019; Central Bureau of Statistics; National Planning Commission, Government of Nepal: Kathmandu, Nepal, 2019; ISBN 9789937057486.
- Liu, X.; Yu, X.; Zhang, Z. PM2.5 concentration differences between various forest types and its correlation with forest structure. Atmosphere 2015, 6, 1801–1815. [Google Scholar] [CrossRef] [Green Version]
- Borghi, F.; Spinazzè, A.; Campagnolo, D.; Rovelli, S.; Cattaneo, A.; Cavallo, D.M. Precision and accuracy of a direct-reading miniaturized monitor in PM2.5 exposure assessment. Sensors 2018, 18, 3089. [Google Scholar] [CrossRef] [PubMed] [Green Version]
- Mahapatra, P.S.; Jain, S.; Shrestha, S.; Senapati, S.; Puppala, S.P. Ambient endotoxin in PM10 and association with inflammatory activity, air pollutants, and meteorology, in Chitwan, Nepal. Sci. Total Environ. 2018, 618, 1331–1342. [Google Scholar] [CrossRef] [PubMed]
- Karagulian, F.; Gerboles, M.; Barbiere, M.; Kotsev, A.; Lagler, F.; Borowiak, A. Review of Sensors for Air Quality Monitoring; Review of Sensors for Air Quality Monitoring: Luxembourg, 2019. [Google Scholar]
- Mukhopadhyay, R.; Sambandam, S.; Pillarisetti, A.; Jack, D.; Mukhopadhyay, K.; Balakrishnan, K.; Vaswani, M.; Bates, M.N.; Kinney, P.L.; Arora, N.; et al. Cooking practices, air quality, and the acceptability of advanced cookstoves in Haryana, India: An exploratory study to inform large-scale interventions. Glob. Health Action 2012, 1, 1–13. [Google Scholar] [CrossRef] [PubMed]
- Chen, C.; Zeger, S.; Breysse, P.; Katz, J.; Checkley, W.; Curriero, F.C.; Tielsch, J.M. Estimating Indoor PM2.5 and CO Concentrations in Households in Southern Nepal: The Nepal Cookstove Intervention Trials. PLoS ONE 2016, 11, e0157984. [Google Scholar] [CrossRef]
- Jayarathne, T.; Stockwell, C.E.; Bhave, P.V.; Praveen, P.S.; Rathnayake, C.M.; Islam, M.R.; Panday, A.K.; Adhikari, S.; Maharjan, R.; Goetz, J.D.; et al. Nepal Ambient Monitoring and Source Testing Experiment (NAMaSTE): Emissions of particulate matter from wood- and dung-fueled cooking fires, garbage and crop residue burning, brick kilns, and other sources. Atmos. Chem. Phys. 2018, 18, 2259–2286. [Google Scholar] [CrossRef] [Green Version]
- Stockwell, C.E.; Christian, T.J.; Goetz, J.D.; Jayarathne, T.; Bhave, P.V.; Praveen, P.S.; Adhikari, S.; Maharjan, R.; DeCarlo, P.F.; Stone, E.A.; et al. Nepal Ambient Monitoring and Source Testing Experiment (NAMaSTE): Emissions of trace gases and light-absorbing carbon from wood and dung cooking fires, garbage and crop residue burning, brick kilns, and other sources. Atmos. Chem. Phys. 2016, 16, 11043–11081. [Google Scholar] [CrossRef] [Green Version]
- Akagi, S.K.; Yokelson, R.J.; Wiedinmyer, C.; Alvarado, M.J.; Reid, J.S.; Karl, T.; Crounse, J.D.; Wennberg, P.O. Emission factors for open and domestic biomass burning for use in atmospheric models. Atmos. Chem. Phys. 2011, 11, 4039–4072. [Google Scholar] [CrossRef] [Green Version]
- Shrestha, I.L.; Shrestha, S.L. Indoor Air Pollution from Biomass Fuels and Respiratory Health of the Exposed Population in Nepalese Households. Int. J. Occup. Environ. Health 2005, 11, 150–160. [Google Scholar] [CrossRef]
- Guofeng, S.; Siye, W.; Wen, W.; Yanyan, Z.; Yujia, M.; Bin, W.; Rong, W.; Wei, L.; Huizhong, S.; Ye, H.; et al. Emission Factors, Size Distributions, and Emission Inventories of Carbonaceous Particulate Matter from Residential Wood Combustion in Rural China. Environ. Sci. Technol. 2012, 46, 4207–4214. [Google Scholar] [CrossRef] [Green Version]
- Roden, C. Tami Bond Emission Factors and Real-Time Optical Properties of Particles Emitted from Traditional Wood Burning Cookstoves. Environ. Sci. Technol. 2006, 40, 6750–6757. [Google Scholar] [CrossRef]
- Zhang, J.; Smith, K.R.; Ma, Y.; Ye, S.; Jiang, F.; Qi, W.; Liu, P.; Khalil, M.A.K.; Rasmussen, R.A.; Thorneloe, S.A. Greenhouse gases and other airborne pollutants from household stoves in China: A database for emission factors. Atmos. Environ. 2000, 34, 4537–4549. [Google Scholar] [CrossRef] [Green Version]
- Smith, K.R.; Khalil, M.A.K.; Rasmussen, R.A.; Thorneloe, S.A.; Manegdeg, F.; Apte, M. Greenhouse gases from biomass and fossil fuel stoves in developing countries: A Manila pilot study. Chemosphere 1993, 26, 479–505. [Google Scholar] [CrossRef]
- Ward, D.E.; Hardy, C.C. Smoke emissions from wildland fires. Environ. Int. 1991, 17, 117–134. [Google Scholar] [CrossRef] [Green Version]
- Pandey, A.; Patel, S.; Pervez, S.; Tiwari, S.; Yadama, G.; Chow, J.C.; Watson, J.G.; Biswas, P.; Chakrabarty, R.K. Aerosol emissions factors from traditional biomass cookstoves in India: Insights from field measurements. Atmos. Chem. Phys. 2017, 17, 13721–13729. [Google Scholar] [CrossRef] [Green Version]
- Shen, G.; Yang, Y.; Wang, W.; Tao, S.; Zhu, C.; Min, Y.; Xue, M.; Ding, J.; Wang, B.; Wang, R.; et al. Emission factors of particulate matter and elemental carbon for crop residues and coals burned in typical household stoves in China. Environ. Sci. Technol. 2010, 44, 7157–7162. [Google Scholar] [CrossRef] [PubMed] [Green Version]
- Andreae, M.; Marlet, P. Emission of trace gases and aerosols from biomass burning. Glob. Biogeochem. Cycles 2001, 15, 955–966. [Google Scholar] [CrossRef] [Green Version]
- Adhikari, S.; Mahapatra, P.S.; Sapkota, V.; Puppala, S.P. Characterizing Emissions from Agricultural Diesel Pumps in the Terai Region of Nepal. Atmosphere 2018, 10, 56. [Google Scholar] [CrossRef] [Green Version]
- Parashar, D.C.; Gadi, R.; Mandal, T.K.; Mitra, A.P. Carbonaceous aerosol emissions from India. Atmos. Environ. 2005, 39, 7861–7871. [Google Scholar] [CrossRef]
- Miri, M.; Derakhshan, Z.; Allahabadi, A.; Ahmadi, E.; Oliveri Conti, G.; Ferrante, M.; Aval, H.E. Mortality and morbidity due to exposure to outdoor air pollution in Mashhad metropolis, Iran. The AirQ model approach. Environ. Res. 2016, 151, 451–457. [Google Scholar] [CrossRef]
- Fattore, E.; Paiano, V.; Borgini, A.; Tittarelli, A.; Bertoldi, M.; Crosignani, P.; Fanelli, R. Human health risk in relation to air quality in two municipalities in an industrialized area of Northern Italy. Environ. Res. 2011, 111, 1321–1327. [Google Scholar] [CrossRef]
- WHO. Health Risk Assessment of Air Pollution—General Principles; WHO Regional Office for Europe: Copenhagen, Denmark, 2016. [Google Scholar]
- WHO. The Urban Health Initiative Pilot Project in Kathmandu; WHO: Geneva, Switzerland, 2018. [Google Scholar]
- Government of Nepal Central Bureau of Statistics. National Population and Housing Census 2011; Government of Nepal Central Bureau of Statistics: Kathmandu, Nepal, 2012; Volume 1.
- Government of Nepal Central Bureau of Statistics. Population Monograph of Nepal 2014; Government of Nepal Central Bureau of Statistics: Kathmandu, Nepal, 2014; ISBN 9789937289719.
- Nepal Health Research Council (NHRC). Nepal Burden of Disease 2017: A Country Report Based on the Global Burden of Disease 2017 Study; Nepal Health Research Council (NHRC): Kathmandu, Nepal, 2019.
- Snider, G.; Weagle, C.L.; Murdymootoo, K.K.; Ring, A.; Ritchie, Y.; Stone, E.; Walsh, A.; Akoshile, C.; Anh, N.X.; Balasubramanian, R.; et al. Variation in global chemical composition of PM2.5: Emerging results from SPARTAN. Atmos. Chem. Phys. 2016, 16, 9629–9653. [Google Scholar] [CrossRef] [Green Version]
- Kleinhans, U.; Wieland, C.; Frandsen, F.J.; Spliethoff, H. Ash formation and deposition in coal and biomass fired combustion systems: Progress and challenges in the field of ash particle sticking and rebound behavior. Prog. Energy Combust. Sci. 2018, 68, 65–168. [Google Scholar] [CrossRef]
- Kurmi, O.P.; Gaihre, S.; Semple, S.; Ayres, J.G. Acute exposure to biomass smoke causes oxygen desaturation in adult women. Simulated driving performance coupled with driver behaviour can predict the risk of sleepiness- related car accidents. Thorax 2011, 66, 724–725. [Google Scholar] [CrossRef] [Green Version]
- Sota, C.D.L.; Lumbreras, J.; Pérez, N.; Ealo, M.; Kane, M.; Youm, I.; Viana, M. Indoor air pollution from biomass cookstoves in rural Senegal. Energy Sustain. Dev. 2018, 43, 224–234. [Google Scholar] [CrossRef]
- Begum, B.A.; Paul, S.K.; Hossain, M.D.; Biswas, S.K.; Hopke, P.K. Indoor air pollution from particulate matter emissions in different households in rural areas of Bangladesh. Build. Environ. 2009, 44, 898–903. [Google Scholar] [CrossRef]
- Lowden, L.; Hull, T. Flammability behaviour of wood and a review of the methods for its reduction. Fire Sci. Rev. 2013, 2, 4. [Google Scholar] [CrossRef] [Green Version]
- Yokelson, R.J.; Griffith, D.W.T.; Ward, D.E. Open-path fourier transform infrared studies of large-scale laboratory biomass fires. J. Geophys. Res. Atmos. 1996, 101, 21067–21080. [Google Scholar] [CrossRef] [Green Version]
- Grieshop, A.P.; Jain, G.; Karthik, S.; Marshall, J.D. Emission factors of health- and climate-relevant pollutants measured in-home during a carbon- finance-approved. GeoHealth 2017, 1, 222–236. [Google Scholar] [CrossRef]
- Bertschi, I.T.; Yokelson, R.J.; Ward, D.E.; Christian, T.J.; Hao, W.M. Trace gas emissions from the production and use of domestic biofuels in Zambia measured by open-path Fourier transform infrared spectroscopy. J. Geophys. Res. Atmos. 2003, 108, 8469. [Google Scholar] [CrossRef] [Green Version]
- Venkataraman, C.; Rao, G.U.M.A.M. Emission Factors of Carbon Monoxide and Size-Resolved Aerosols from Biofuel Combustion. Environ. Sci. Technol. 2001, 35, 2100–2107. [Google Scholar] [CrossRef]
- Dasch, J.M. Particulate and Gaseous Emissions from Wood-Burning Fireplaces. Environ. Sci. Technol. 1982, 16, 639–645. [Google Scholar] [CrossRef]
- Saud, T.; Gautam, R.; Mandal, T.K.; Gadi, R.; Singh, D.P.; Sharma, S.K.; Dahiya, M.; Saxena, M. Emission estimates of organic and elemental carbon from household biomass fuel used over the Indo-Gangetic Plain (IGP), India. Atmos. Environ. 2012, 61, 212–220. [Google Scholar] [CrossRef]
- Mehra, M.; Panday, A.K.; Puppala, S.P.; Sapkota, V.; Adhikary, B.; Pokharel, C.P.; Ram, K. Impact of local and regional emission sources on air quality in foothills of the Himalaya during spring 2016: An observation, satellite and modeling perspective. Atmos. Environ. 2019, 216, 116897. [Google Scholar] [CrossRef]
- Zhou, Z.; Dionisio, K.L.; Verissimo, T.G.; Kerr, A.S.; Coull, B.; Howie, S.; Arku, R.E.; Koutrakis, P.; Spengler, J.D.; Fornace, K.; et al. Chemical Characterization and Source Apportionment of Household Fine Particulate Matter in Rural, Peri-urban, and Urban West Africa. Environ. Sci. Technol. 2014, 48, 1343–1351. [Google Scholar] [CrossRef] [PubMed] [Green Version]
- Watson, J.G.; Chow, J.C. Estimating Middle-, Neighborhood-, and Urban-Scale Contributions to Elemental Carbon in Mexico City with a Rapid Response Aethalometer. J. Air Waste Manage. Assoc. 2001, 51, 1522–1528. [Google Scholar] [CrossRef] [PubMed] [Green Version]
- Panday, A.K.; Prinn, R.G. Diurnal cycle of air pollution in the Kathmandu Valley, Nepal: Observations. J. Geophys. Res. 2009, 114, D09305. [Google Scholar] [CrossRef]
- Mahapatra, P.S.; Panda, S.; Das, N.; Rath, S.; Das, T. Variation in black carbon mass concentration over an urban site in the eastern coastal plains of the Indian sub-continent. Theor. Appl. Climatol. 2013, 117, 133–147. [Google Scholar] [CrossRef]
- Sharma, S.K.; Mandal, T.K.; Sharma, A.; Jain, S. Saraswati Carbonaceous Species of PM2.5 in Megacity Delhi, India During 2012. Bull. Environ. Contam. Toxicol. 2018, 100, 695–701. [Google Scholar] [CrossRef]
- Murari, V.; Kumar, M.; Singh, N.; Singh, R.S.; Banerjee, T. Particulate morphology and elemental characteristics: Variability at middle Indo-Gangetic Plain. J. Atmos. Chem. 2016, 73, 165–179. [Google Scholar] [CrossRef]
- Rajput, P.; Izhar, S.; Gupta, T. Deposition modeling of ambient aerosols in human respiratory system: Health implication of fine particles penetration into pulmonary region. Atmos. Pollut. Res. 2019, 10, 334–343. [Google Scholar] [CrossRef]
- Saikawa, E.; Panday, A.; Kang, S.; Gautam, R.; Zusman, E.; Cong, Z.; Somanathan, E.; Adhikary, B. Air Pollution in the Hindu Kush Himalaya. In The Hindu Kush Himalaya Assessment; Wester, P., Mishra, A., Mukherji, A., Shrestha, A.B., Eds.; Springer International Publishing: Cham, Switzerland, 2019; pp. 339–387. [Google Scholar]
- Ramanathan, V.; Crutzen, P.J.; Lelieveld, J.; Mitra, A.P.; Althausen, D.; Anderson, J.; Andreae, M.O.; Cantrell, W.; Cass, G.R.; Chung, C.E.; et al. Indian Ocean Experiment: An integrated analysis of the climate forcing and effects of the great Indo-Asian haze. J. Geophys. Res. Atmos. 2001, 106, 28371–28398. [Google Scholar] [CrossRef]
- Gautam, R.; Hsu, N.C.; Kafatos, M.; Tsay, S.C. Influences of winter haze on fog/low cloud over the Indo-Gangetic plains. J. Geophys. Res. Atmos. 2007, 112, 1–11. [Google Scholar] [CrossRef] [Green Version]
- Ganguly, D.; Ginoux, P.; Ramaswamy, V.; Winker, D.M.; Holben, B.N.; Tripathi, S.N. Retrieving the composition and concentration of aerosols over the Indo-Gangetic basin using CALIOP and AERONET data. Geophys. Res. Lett. 2009, 36, 1–5. [Google Scholar] [CrossRef] [Green Version]
- Mahapatra, P.S.; Puppala, S.P.; Adhikary, B.; Shrestha, K.L.; Dawadi, D.P.; Paudel, S.P.; Panday, A.K. Air quality trends of the Kathmandu Valley: A satellite, observation and modeling perspective. Atmos. Environ. 2019, 201, 334–347. [Google Scholar] [CrossRef]


| HHS Number | Cookstove | Cookstove Materials | Fuel | Date | Cooking Time | Cooking Duration (Minutes) | Ventilation Status (Based on Observation) |
|---|---|---|---|---|---|---|---|
| 1 | Traditional one pot mud cookstove | Mud, stone | Biomass | 03/04/2017 | Evening | 32 | Medium (one door with one window) |
| 2 | Traditional one pot mud cookstove | Mud, stone | Biomass | 04/04/2017 | Morning | 42 | Poor (one door with no window) |
| 3 | Traditional one pot mud cookstove | Mud, stone | Biomass | 04/04/2017 | Evening | 62 | Medium (one door with one window) |
| 4 | Traditional one pot mud cookstove | Mud, stone | Biomass | 05/04/2017 | Morning | 64 | Poor (one door with no window) |
| Period | Background PM2.5 (µg/m3) | Village PM2.5 (µg/m3) | Average Exceedance (%) |
|---|---|---|---|
| Cooking | 84.94 ± 18.96 | 116.94 ± 38.97 | 37.67 |
| Noncooking | 66.85 ± 8.58 | 67.64 ± 10.48 | 1.18 |
| Twenty Days Average | 84.47 ± 28.73 | 98.43 ± 47.17 | 16.53 |
© 2020 by the authors. Licensee MDPI, Basel, Switzerland. This article is an open access article distributed under the terms and conditions of the Creative Commons Attribution (CC BY) license (http://creativecommons.org/licenses/by/4.0/).
Share and Cite
Adhikari, S.; Mahapatra, P.S.; Pokheral, C.P.; Puppala, S.P. Cookstove Smoke Impact on Ambient Air Quality and Probable Consequences for Human Health in Rural Locations of Southern Nepal. Int. J. Environ. Res. Public Health 2020, 17, 550. https://0-doi-org.brum.beds.ac.uk/10.3390/ijerph17020550
Adhikari S, Mahapatra PS, Pokheral CP, Puppala SP. Cookstove Smoke Impact on Ambient Air Quality and Probable Consequences for Human Health in Rural Locations of Southern Nepal. International Journal of Environmental Research and Public Health. 2020; 17(2):550. https://0-doi-org.brum.beds.ac.uk/10.3390/ijerph17020550
Chicago/Turabian StyleAdhikari, Sagar, Parth Sarathi Mahapatra, Chiranjibi Prasad Pokheral, and Siva Praveen Puppala. 2020. "Cookstove Smoke Impact on Ambient Air Quality and Probable Consequences for Human Health in Rural Locations of Southern Nepal" International Journal of Environmental Research and Public Health 17, no. 2: 550. https://0-doi-org.brum.beds.ac.uk/10.3390/ijerph17020550