Exploring the Injury Severity Risk Factors in Fatal Crashes with Neural Network


1
Department of Civil and Environmental Engineering, King Fahd University of Petroleum & Minerals, KFUPM BOX 5055, Dhahran 31261, Saudi Arabia
2
Department of Construction Engineering and Management, King Fahd University of Petroleum & Minerals, Dhahran 31261, Saudi Arabia
*
Author to whom correspondence should be addressed.
Int. J. Environ. Res. Public Health 2020, 17(20), 7466; https://0-doi-org.brum.beds.ac.uk/10.3390/ijerph17207466
Submission received: 25 August 2020
/
Revised: 29 September 2020
/
Accepted: 1 October 2020
/
Published: 14 October 2020
Abstract
:A better understanding of circumstances contributing to the severity outcome of traffic crashes is an important goal of road safety studies. An in-depth crash injury severity analysis is vital for the proactive implementation of appropriate mitigation strategies. This study proposes an improved feed-forward neural network (FFNN) model for predicting injury severity associated with individual crashes using three years (2017–2019) of crash data collected along 15 rural highways in the Kingdom of Saudi Arabia (KSA). A total of 12,566 crashes were recorded during the study period with a binary injury severity outcome (fatal or non-fatal injury) for the variable to be predicted. FFNN architecture with back-propagation (BP) as a training algorithm, logistic as activation function, and six number of hidden neurons in the hidden layer yielded the best model performance. Results of model prediction for the test data were analyzed using different evaluation metrics such as overall accuracy, sensitivity, and specificity. Prediction results showed the adequacy and robust performance of the proposed method. A detailed sensitivity analysis of the optimized NN was also performed to show the impact and relative influence of different predictor variables on resulting crash injury severity. The sensitivity analysis results indicated that factors such as traffic volume, average travel speeds, weather conditions, on-site damage conditions, road and vehicle type, and involvement of pedestrians are the most sensitive variables. The methods applied in this study could be used in big data analysis of crash data, which can serve as a rapid-useful tool for policymakers to improve highway safety.
1. Introduction
Road safety has become a global public health threat in recent years. It is estimated that about 1.35 million people are killed, and over 50 million others are injured every year in traffic collisions worldwide [1]. As per the statistics from the World Health Organization (WHO) and World Bank, road traffic crashes (RTCs), on average, account for approximately 3% of the nation’s gross domestic product (GDP) worldwide, irrespective of their growth and rate of motorization [2]. A better understanding of factors contributing to traffic crashes is fundamental in improving crash prediction. However, RTCs are complex events involving many factors with multi-facet interactions, making it very challenging to comprehend them fully. Globally, various strategies have been successfully implemented to alleviate the burden of RTCs [3,4,5,6,7,8]. Intelligent traffic control and vehicle automation in urban areas are also aimed to ensure safe and sustainable traffic operation [9,10].
The Kingdom of Saudi Arabia (KSA) is located in Southwestern Asia. It is the largest country in the Arabian Peninsula, with an area of approximately 2.1 million square kilometers and a population of over 34 million. The entire area of the country is divided into 13 regions, having a mostly arid or semi-arid climate. KSA has a vast cultural diversity, with a significant proportion of the population belonging to expatriates from different parts of the world, particularly from South and East Asia and the neighboring Arab countries. The rate of urbanization is on the rise, with almost three-fifths of the population living in major cities that have integrated transportation services and access to basic services [11]. Due to rapid economic growth, particularly after the oil boom, the country has experienced an increased rate of motorization and congestion [12]. Vision 2030, announced in 2016, outlines 24 ambitious and specific goals for the political, economic, and societal domains.
The enormous growth in motorization and road infrastructure has brought alarming road safety concerns in recent years in KSA. A recent study conducted by Turki et al. indicated that, on average, 19 persons are killed, and approximately four are injured in RTCs every day in the KSA [13]. Average crash to injury ratios of 8:6 and 8:4 are reported for the entire country and eastern region in the KSA, respectively, which are significantly high compared to the global ratio of 8:1 [14,15]. The economic losses due to RTCs in KSA are estimated to be around 4.3% of the national GDP [2]. In the literature, few studies have focused on identifying crash contributing factors to guide appropriate management strategies for mitigation [14,16,17,18]. Locally conducted studies suggest that factors such as driver distractions, over speeding, and aggressive driving, especially among young KSA adults, are the main factors that have contributed to an increase in crash occurrence and worsened injury severity [15,19,20,21]. In recent years, few road safety measures (such as the installation of the SAHER program, strict enforcement of traffic rules, the imposition of heavy fines on violators, etc.) have been initiated; however, the road safety situation has only marginally improved.
As mentioned, the outcome of crash severity is significantly influenced by factors such as driver attributes, roadway characteristics, vehicle features, weather conditions, crash characteristics, and features of the built environment [22,23]. In the literature, various regression-based statistical models have been proposed to establish the relationship between crash injury severity and predictor variables. However, statistical models are built on several underlying observations and pre-defined associations among variables [24,25]. The weaker prediction performance of these models is another major concern that may be attributed to assumptions regarding linear link function and error distribution terms, which yield biased results if flouted. In recent years, machine learning-based models have emerged as a promising alternative to statistical methods in crash injury severity prediction. However, most of these studies have focused on overall prediction accuracy that does not improve the researcher’s understanding of the individual role of severity factors on injury severity outcome. To fill this research gap, this study proposes a neural network-based model of traffic crash incidents to predict the crash injury severity and evaluate the role of individual contributing factors on crash severity, in the KSA. Crash injury severity is under researched in the KSA. The rural highway crash data used in the analysis were obtained from the Ministry of Transport (MOT) at Riyadh. The findings of this study provide key insights for a better understanding of the factors contributing to fatal crashes along rural highways. The outcomes of this study are also expected to guide in identifying the critical factors heavily impacting the severity of crash accidents and proactively taking appropriate actions to mitigate them.
The rest of this paper is organized as follows. Section 2 provides a comprehensive literature review of different approaches related to crash injury severity modeling. Section 3 presents the data collection and descriptive statistics of the crash dataset. Section 4 highlights the methods utilized in this study. Section 5 provides the model prediction results and sensitivity analysis for severity risk factors using the proposed methods. Finally, Section 6 summarizes the main findings, study implications, and provide an outlook for future studies.
2. Related Work
In the literature, crash injury severity analysis has been studied under two main headings (i.e., via statistical regression approaches (mostly used) and methods based on Machine Learning (ML)). The following passages provide a brief description of previous studies focusing on different statistical and ML approaches for crash injury severity prediction.
2.1. Statistical Approaches in Crash Injury Severity Prediction
Crash injury severity is usually represented by discrete categories such as fatal, incapacitating injury, capacitating injury, possible injuries, and property damage only (PDO). Due to the discrete nature of injury severity classes, it is often analyzed by discrete outcome statistical models such as binary, multinomial, probit, and logit models [26,27,28,29]. It is widely agreed that crash data may exhibit unobserved heterogeneity, which may be tackled by adopting other advanced statistical models such as ordered logit models [26,30,31,32], bivariate/multivariate models [33,34,35,36], random parameter model, [37,38], nested logit model [39,40], and Bayesian hierarchical models [41,42].
For example, Chen et al. employed probit models to identify factors contributing to crashes involving trucks [43]. The researchers found that factors such as driver’s gender, age, time of the crash, wet pavement surfaces, and adverse weather conditions were associated with higher crash severity. Hu et al. proposed a logit model to examine factors affecting crash injury severity at railroad junctions [22]. The study results showed that variables including the number of daily trips, presence of obstacle detection devices, and markings at approach segments significantly affect crash severity. Fan et al. compared the performance of ordered logit models and multinomial logit models for injury severity predictions of crashes at highway-rail crossings [44]. In his study, Mohamed Abdel-Aty analyzed the driver injury severity with ordered probit models and multinomial logit models [45]. The results showed that several factors contributing significantly to crash severity outcomes were common in both models like driver’s gender, age, seat belt use, speed ratio, point of impact, vehicle type, dark lighting conditions, presence of curves, etc. Comparing the modeling techniques, the ordered probit approach was more promising than the multinomial logit modeling method.
Tulu et al. adopted a random-parameters logistic regression model for injury severity prediction of traffic crashes in Ethiopia [46]. Factors contributing to severe and fatal crashes included over speeding, night-time driving, collision with a heavy vehicle, and drivers with less educational background. Similarly, random parameter models were also investigated for crash severity modeling in other recent studies [38,47,48]. Kim et al. studied pedestrian injury severity in motor vehicle crashes with mixed logit models [49] and found that the odds of fatal crashes were increased significantly in the absence of street lights, collisions with trucks, speeding, drunk driving, and crashes occurring on freeways. Logistic regression is another widely used parametric approach in crash severity modeling. Jamal et al. used logistic regression to examine factors contributing to crash injury severity in the eastern province, the KSA [15]. The study reported that factors like driver’s distraction, over speeding, fatigue driving, sudden lane deviation, the involvement of pedestrians, and motorcyclists increased the injury severity. In their study, Meng et al. also utilized bi-level logistic regression to explore influential factors contributing to consecutive crash injury severity in Guizhou Province, China [50]. The study results showed that several predictor variables, including speed limit, traffic volumes, adverse weather conditions, and involvement of trucks, had a strong positive association with severe crashes.
As mentioned, previous studies have utilized a wide range of statistical models for crash severity modeling. Though statistical models have a sound theoretical basis, they assume a pre-defined association between the variables, which, if flouted, yield erroneous model estimation. Alternatively, non-parametric methods of analysis have become popular in the road safety domain in recent years.
2.2. Machine Learning Approaches in Crash Injury Severity Prediction
To overcome the limitations of statistical models, ML approaches have been increasingly employed to model the potentially nonlinear relationships between crash severity outcomes and the contributing factors [51,52,53,54,55,56,57]. ML methods are more flexible with no or fewer model assumptions for input variables, and also have better fitting characteristics. Some of the commonly used ML approaches used in crash injury severity prediction include artificial neural networks (ANN) [58,59,60], random forest [54,61,62], support vector machines (SVM) [51,63,64], naïve Bayes [65,66,67], K-means clustering (KC) [68,69,70], and decision trees (DT) [71,72,73].
Several studies have developed different artificial neural network (ANN)-based models for crash severity prediction. For example, Delen et al. applied ANN to predict crash severity using eight binary input variables through features-based sensitivity analysis [74]. Study results demonstrated the robust predictive performance of proposed MLP networks for injury severity classification. Sensitivity analysis results revealed that the driver’s age and gender, use of seat belt and alcohol, and vehicle characteristics were found to have more influence on crash severity outcomes. Al-Kheder et al. applied ANN to predict the injury severity of crashes based on 5973 traffic crash observations from Abu Dhabi collected over a span of six years [75]. To enhance the prediction accuracy of ANN classifiers, data were split into three clusters via k-means algorithms. The target severity column was categorized into four severity groups (i.e., death, severe, moderate, and minor severity). The ANN classifier, with an average prediction accuracy of 74.6%, outperformed the ordered probit model with the corresponding value at around 59.5%.
Random Forests (RF), Support Vector Machine (SVM), and Decision Trees (DT) are a few widely used ML techniques in crash severity analysis. Taamneh and Taamneh employed RF for predicting the injury severity of crashes based on six years of crash data from Abu Dhabi [76]. The data imbalance issue was tackled using SMOTE (Synthetic Minority Over-sampling Technique). For underrepresented classes (Severe Injuries and Death) in the actual dataset, the model performed poorly. Using the balanced dataset, the overall prediction accuracy of the model was around 78.5% indicating around 14% improvement. An ordered probit model was also used as a benchmark to validate the RF model. Mokhtarimousav et al. compared the SVM and random parameter mixed logit models for the severity prediction of work zone crashes [64]. Empirical findings revealed that prediction accuracy from SVM outperformed the mixed logit model. Analyzing the sensitivity of the parameters, variables such as the nature of termination areas in the work zones, type of activities, morning peaks, interstate highway types, and left-rear crashes all had a positive impact on crash severity. Wang et al. compared SVM with MLP and found that SVM achieved better prediction accuracy for crash injury severity [77].
Emhamed et al. implemented four ML algorithms, including RF, DT, Naive Bayes (NB), and logistic regression (LR), to predict crash severity prediction [78]. Findings indicated that all the algorithms yielded reasonable model performance. However, RF had the highest overall accuracy (75.5%) compared to logistic regression (74.5%), Adaboost (74.5%), and NB (73.1%). In another study, a researcher investigated the DT model for examining crash severity outcomes of motor vehicles using ten years from Missouri State [79]. The results suggested that factors such as alcohol use among drivers, over speeding, and failing to yield contribute significantly to fatal crashes. Delen et al., in their study, also compared four different ML methods (logistic regression, decision trees, NN, and SVM) to predict the injury severity of traffic crashes [80] and found that SVM achieved the highest prediction accuracy while logistic regression was the least accurate. The researchers noted that factors like collision type, non-compliance with seat belt, and drug involvement were the key contributors toward severe crashes.
3. Data Description
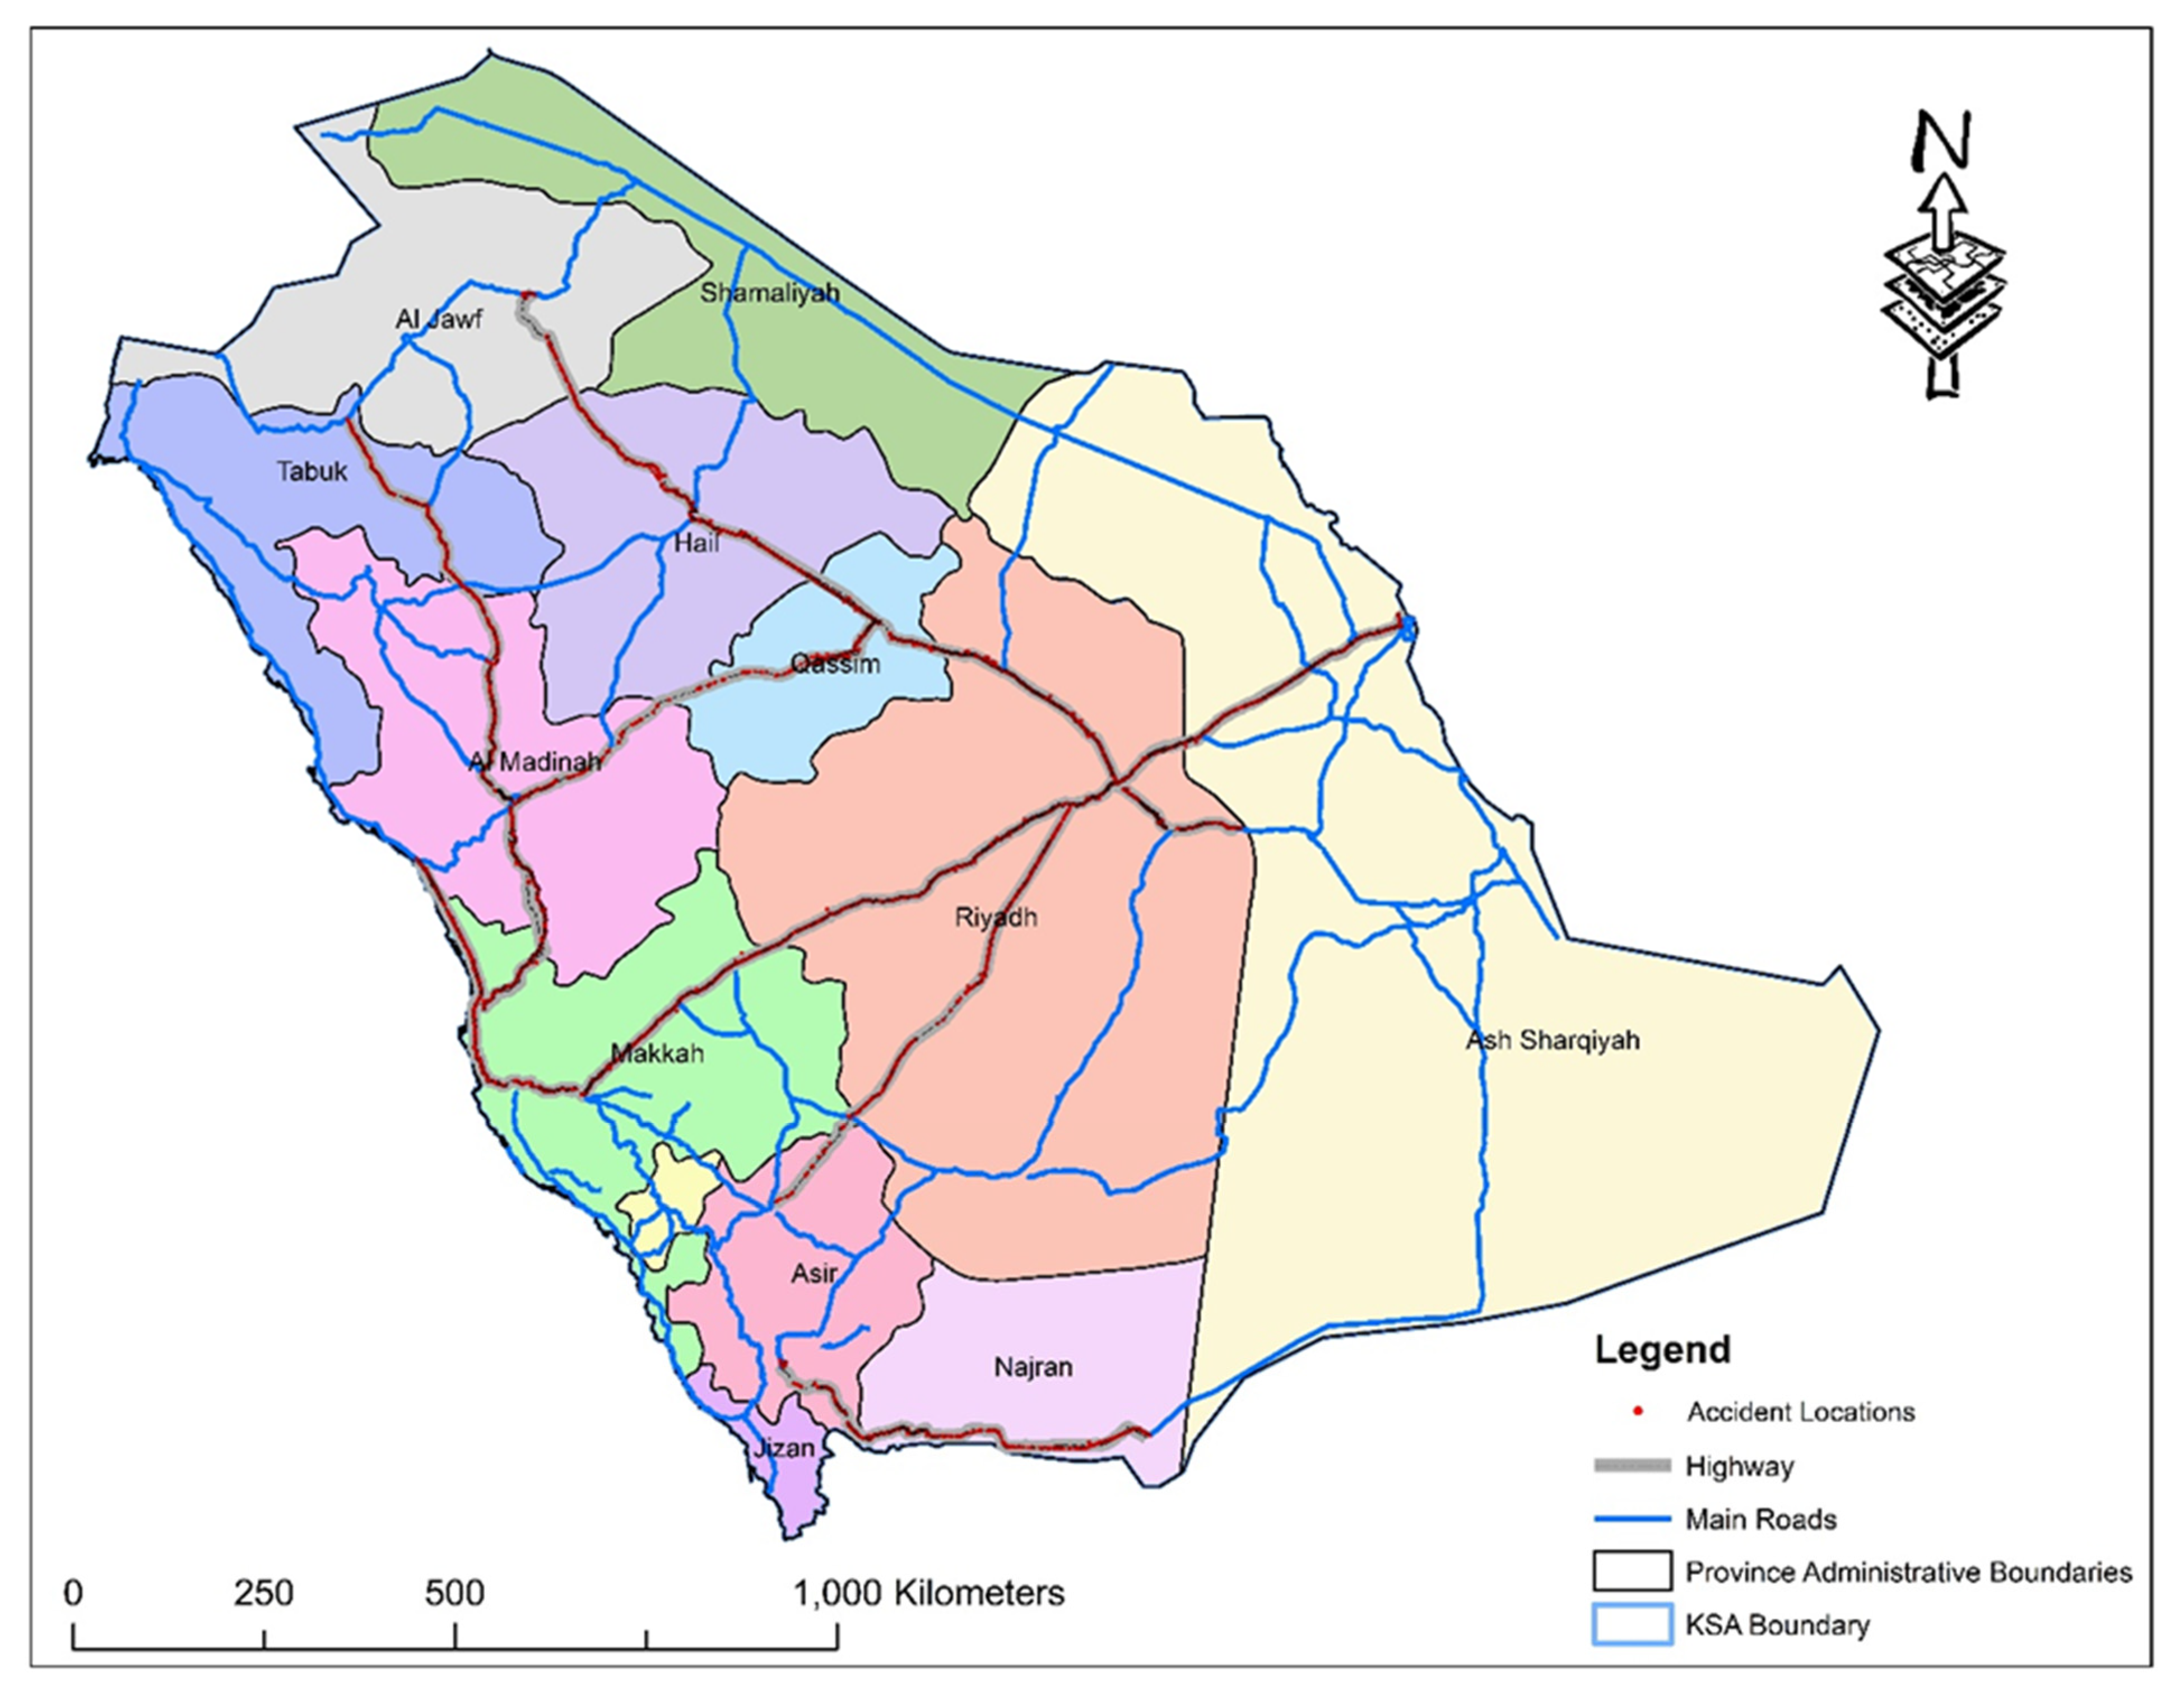
Crash data used in this study were obtained from the traffic safety department at the Ministry of Transport (MOT), Riyadh, KSA, and covered three years (January 2017 to December 2019). The data was collected along 15 major rural highways (shown in Figure 1). A large proportion of selected highways runs through plain and desert terrain, having warm to high temperature during most part of the year. The database was compiled and extracted from the crash report file prepared by the on-site emergency response expert crew. The collected data were pre-processed and cleaned by removing the observations with outliers, duplicate records, and missing information. The final dataset contained a total of 12,566 valid crash observations resulting in 1320 fatalities and 7947 injuries. It included six main predictor variables categories (i.e., temporal, environmental, roadway, vehicle, traffic, and crash) with 59 sublevels (child features) for categorical variables and seven sublevels for continuous predictor variables. Table 1 summarizes the descriptive statistics of explanatory variables. Crash injury severity was classified into two levels (either fatal or non-fatal), which was the dependent variable. Table 2 provides the distribution by injury severity category across different years. Out of the total 12,566 crashes, 881 (7%) were classified as fatal crashes, and the remaining 11,685 were non-fatal crashes. Data about traffic volumes, road inventory, and others were also collected from the MOT.
4. Methods
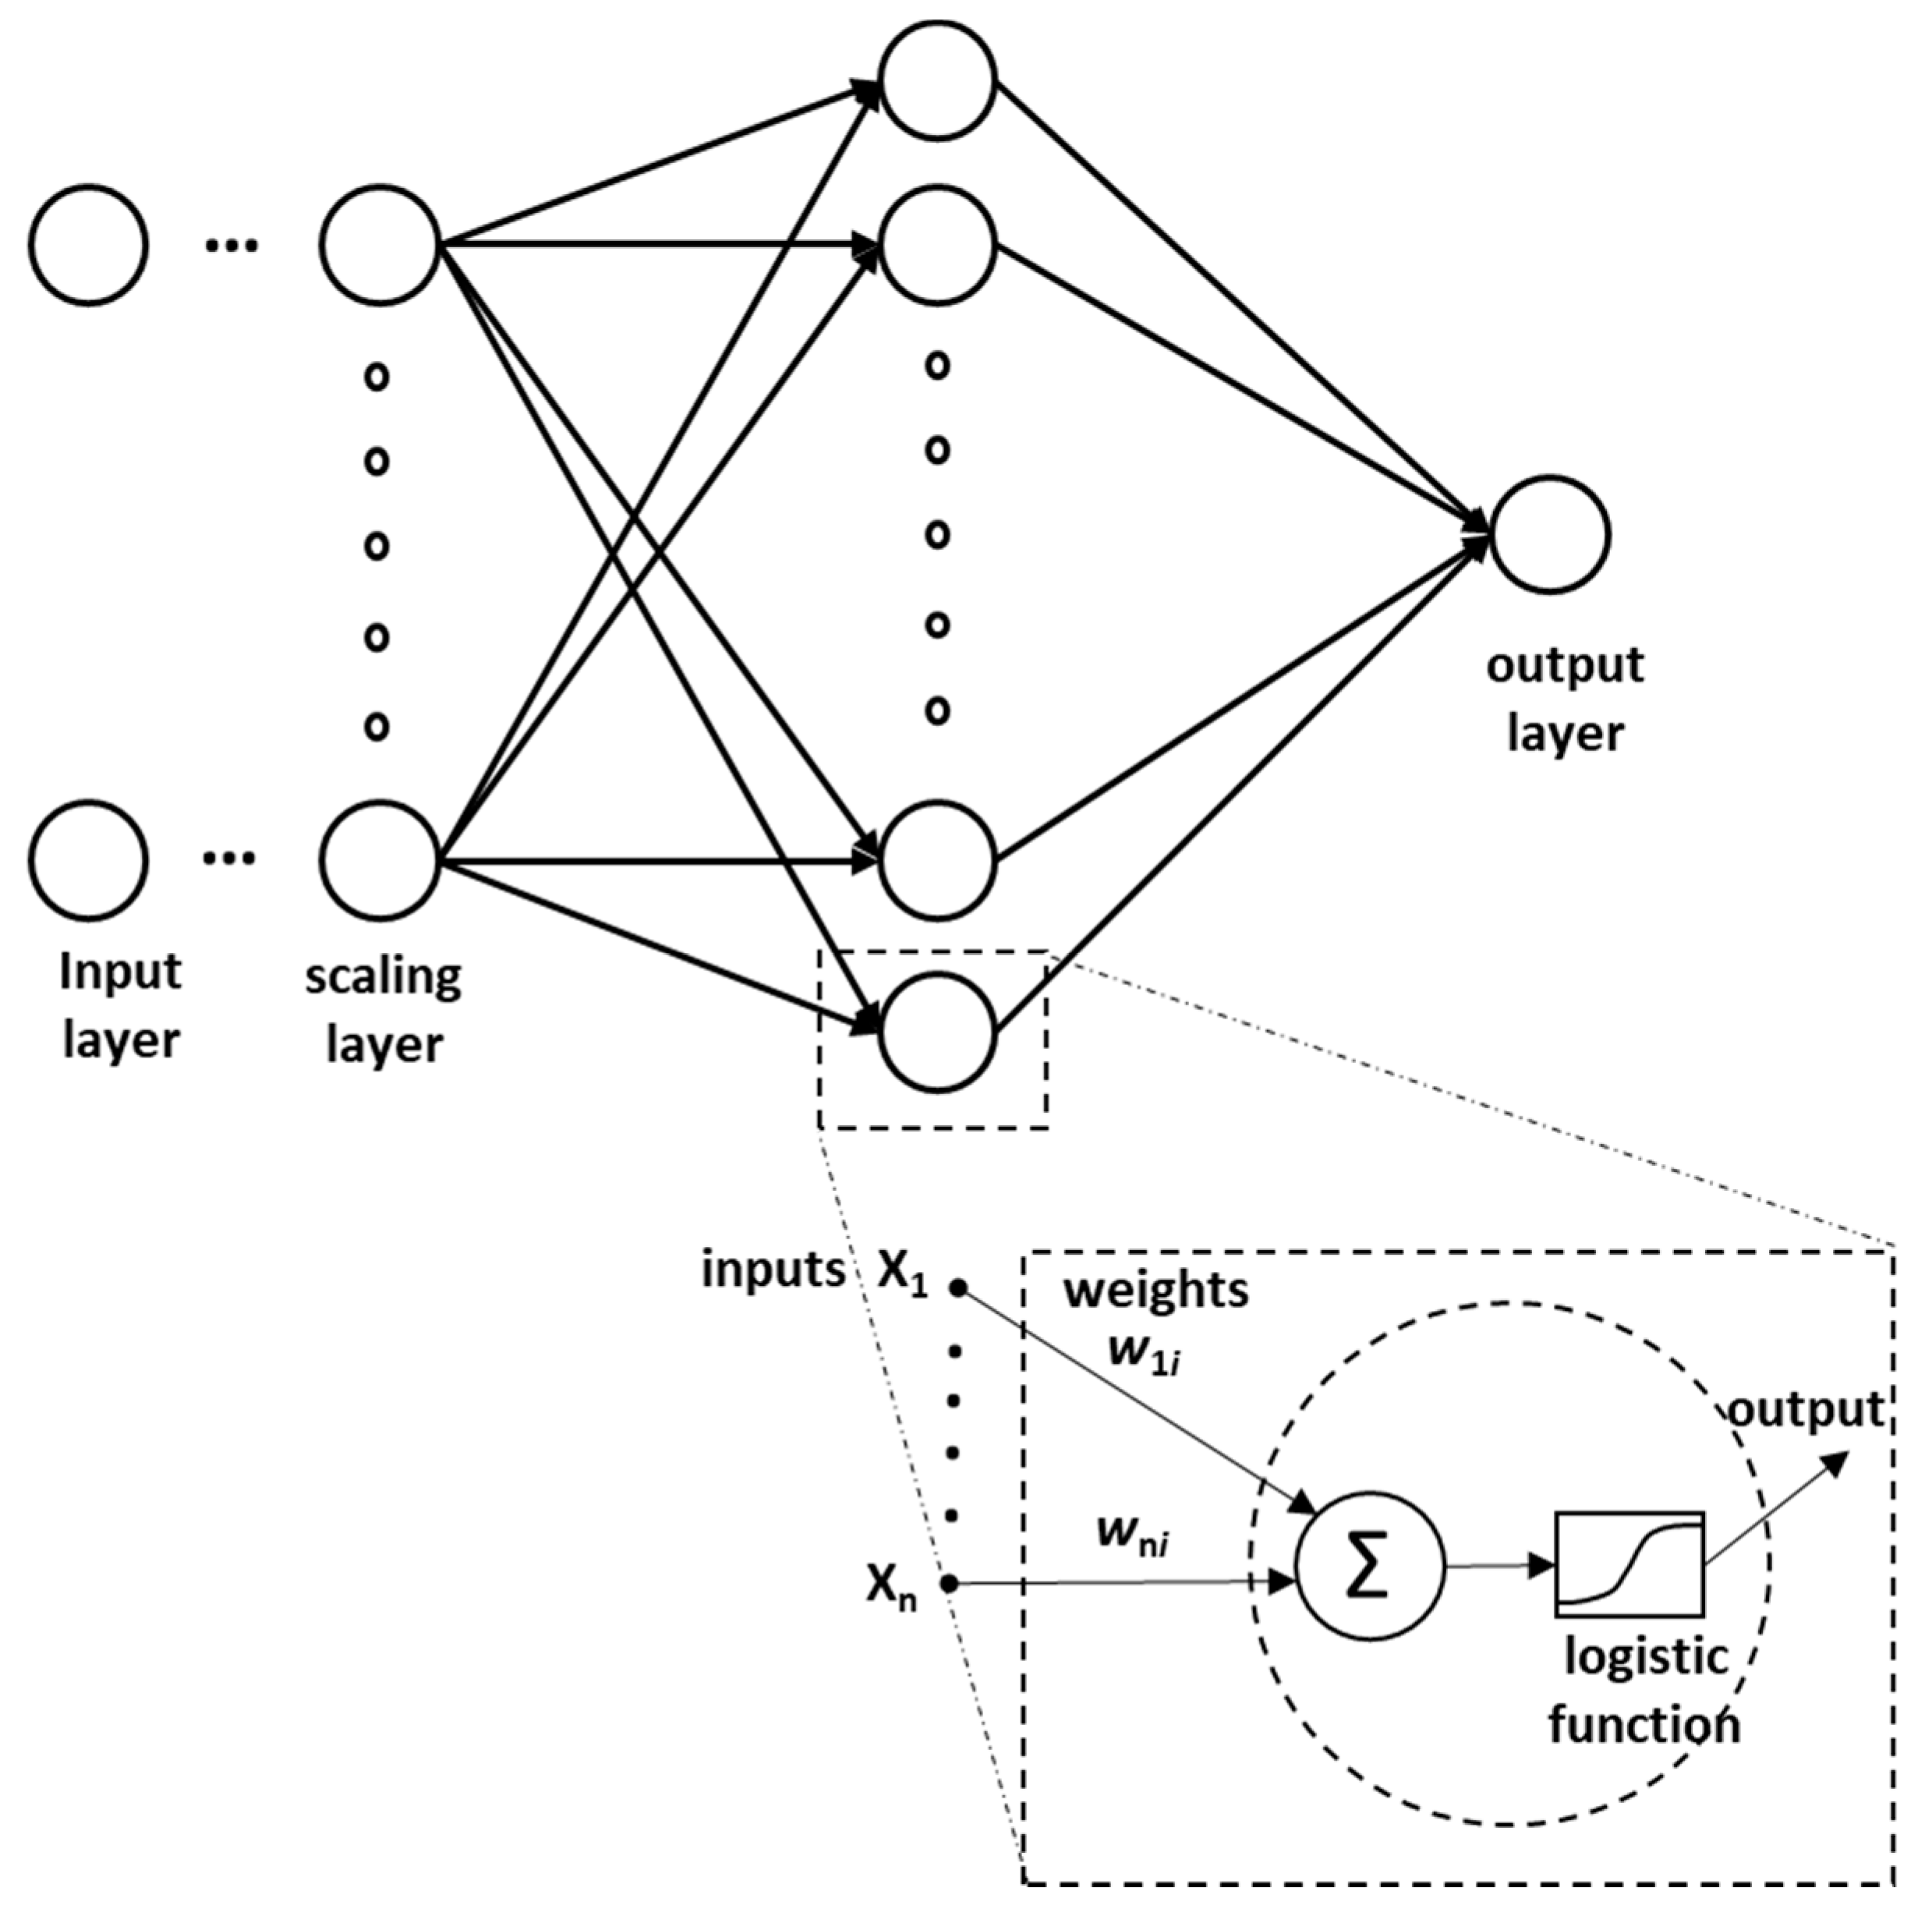
Although a number of methods can be used to model crash severity for road data, this study chose artificial neural network (ANN)-based modeling because of its ability to learn patterns from the provided instances, with explicitly defining rules. ANNs try to mimic the way neurons in the human brain work to solve the problems and learn from the happenings around them [81]. There are numerous types of ANNs based on their architecture and internal working; however, this study entailed an improved feed-forward neural network (FFNN), which was trained using a back-propagation (BP) training algorithm. Generally, such networks comprise a single input layer, one or many hidden layers, and an output layer with varying number of neurons. For each example from the dataset, the input layer comprises of the input variables provided to the ANN. Before feeding the ANN, data for each input variable is normalized so that the absolute values of the different variables do not affect the performance of the ANN. Afterward, for a given ANN architecture, weights that define the relation between neurons of various layers are randomly assigned. Then, in each iteration, these weights are adjusted to minimize the error between the predicted output and the ground truth available from the training dataset. The adjustment of the weights is continued until a reduction in error is evident. Neural Designer (Artificial Intelligence Techniques Ltd., Salamanca, Spain) was used in this study for ANN implementation.
While looking for an optimum architecture for the current problem, considering the data available and utilizing prior experience, the study limited the number of hidden layers to two with varying numbers of neurons. Then, the architecture was finalized based on the performance metrics during hit and trial runs. Accordingly, finally, the selected ANN comprises a single hidden layer with six neurons, as shown in Figure 2. Furthermore, since the purpose of the model was to predict/model crash severity, the activation function used in this study was the logistic function.
Since the performance of an ANN is heavily dependent upon the features being used, feature selection was conducted using correlation analysis between the available variables dataset and target variable (i.e., crash severity). Only features with a logistic correlation value greater than or equal to 0.04 were selected as the input features to the model. This resulted in a total of nine features to be used as input features (Accident type (r = −0.13), Weather Status (r = −0.12), ADDT (r = −0.08), Vehicle Type (r = 0.08), Number of Lanes (r = −0.05), Road Type (r = −0.05), Damage at Site (r = 0.04), Average Speed (r = 0.04), and Number of Vehicles Involved (r = 0.04)). These features were scaled to ensure the standardization of independent features so that all features are given equal importance initially. Training data for ANN comprised of 80% of the total dataset, whereas validation and testing datasets were both 10% of the total data. An important point to note was a skewed dataset (i.e., only 7% of the data represented fatal accidents). To handle this skewness, a weighted squared error was employed to train the ANN. Specifically, the error resulting from the wrong prediction of the fatal crash was penalized six times more than a non-fatal crash. The Quasi-Newton method was used to minimize the weighted squared error and optimize the ANN. Although it is based on Newton’s method, calculation of the Hessian matrix (second derivatives) is not required in this method, which is otherwise computationally expensive. Instead, the Quasi-Newton method approximately calculates the inverse of the Hessian matrix for each iteration using gradient information. In addition to mere prediction of crash severity, a mathematical model arising from ANN was further used to perform the sensitivity analysis. For this purpose, the base mathematical model was built with the following assumptions: (i) Road Type: Expressway; (ii) Weather Status: Shiny; (iii) Vehicle Type: Car; (iv) AADT: 3.55; (v) Average Speed: 2.76; (vi) Number of Lanes: 2.78; (vii) Accident Type: Crash; (viii) Number of Vehicles Involved: 1.44; and (ix) Damage at Site: No damage. Afterward, individual independent features were varied one-by-one to explore in-depth the impact of each feature variable on crash severity.
5. Results and Discussions
5.1. Model Performance Evaluation
An ANN-based mathematical model for crash severity can be represented by Equation (1).
Crash_Severity = Logistic (6.83811+ (y_1*5.79538) + (y_2*-2.85844) + (y_3*-2.70326) +
(y_4*-3.6051) + (y_5*-4.46448) + (y_6*-2.74106))
(y_4*-3.6051) + (y_5*-4.46448) + (y_6*-2.74106))
In the equation, Logistic refers to the application of a logistic function on the following mathematical expression. y_1 til y_6 represents the first and the second neuron of the hidden layer, which can be computed using the mathematical model given in Appendix A. Table 3 shows the confusion matrix and model predictive performance using different classification evaluation metrics for the test dataset. The confusion matrix shows the consistency between the actual and predicted observations for individual severity classes in the dataset. In the contingency table, the rows denote the predicted number of cases for each crash severity class, while the columns indicate the actual number of observations for a given severity group. The cells along the diagonal of the confusion matrix provide accurate severity predictions, while the off-diagonal values imitate misclassifications that result in underestimation or overestimation of a specific severity class. As shown in Table 3, a total of 43 observations of fatal injury class were correctly classified as fatal injury, and 33 cases in this severity category were misclassified as a non-fatal injury. Similarly, 731 observations of non-fatal severity class were correctly classified as non-fatal, whereas 192 observations of non-fatal observations were wrongly predicted under the fatal injury category. The overall prediction accuracy was around 77.5%, indicating an acceptable model performance. The sensitivity and specificity values obtained from the confusion matrix (given in Table 3) also showed that the proposed method is robust in predicting crash injury severity.
5.2. Sensitivity Analysis for Variable Importance
The following sections describe the results of the sensitivity analysis. As discussed before, a base model was used for this purpose, which was followed by changing the values of the variables of interest in the model one by one, to comprehend the changes in severity due to each variable.
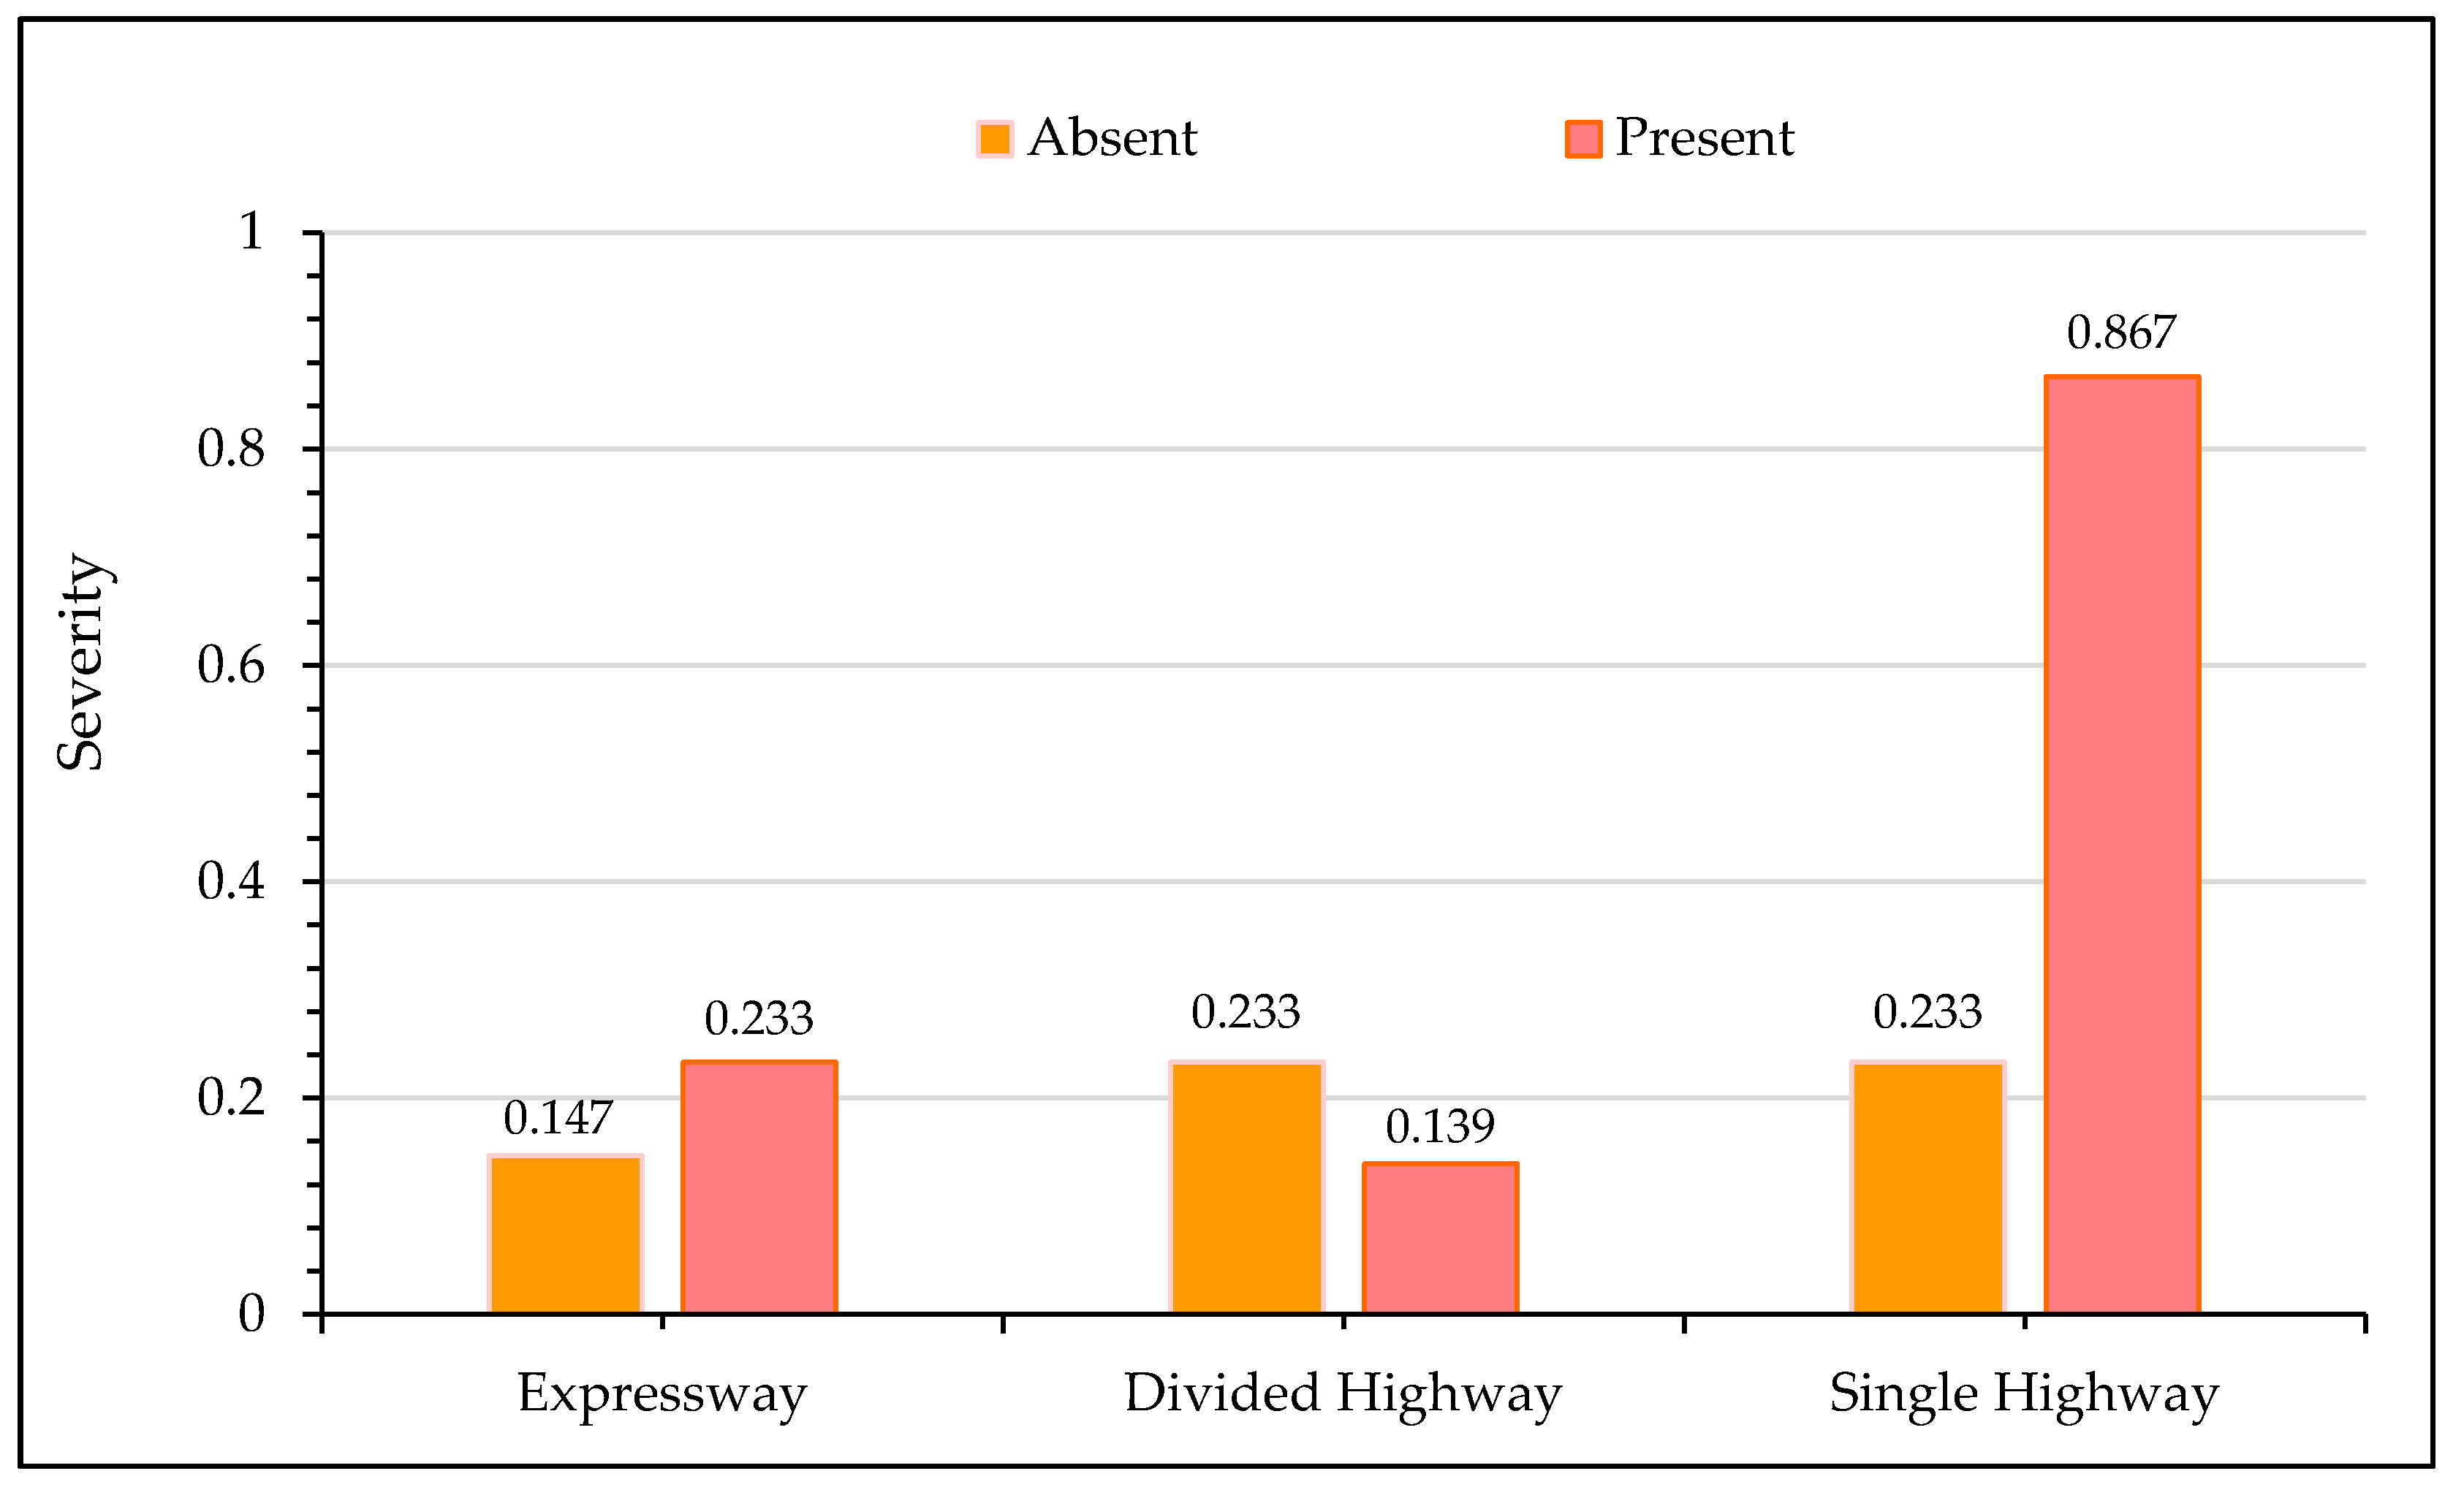
5.2.1. Sensitivity Analysis for Type of Highway
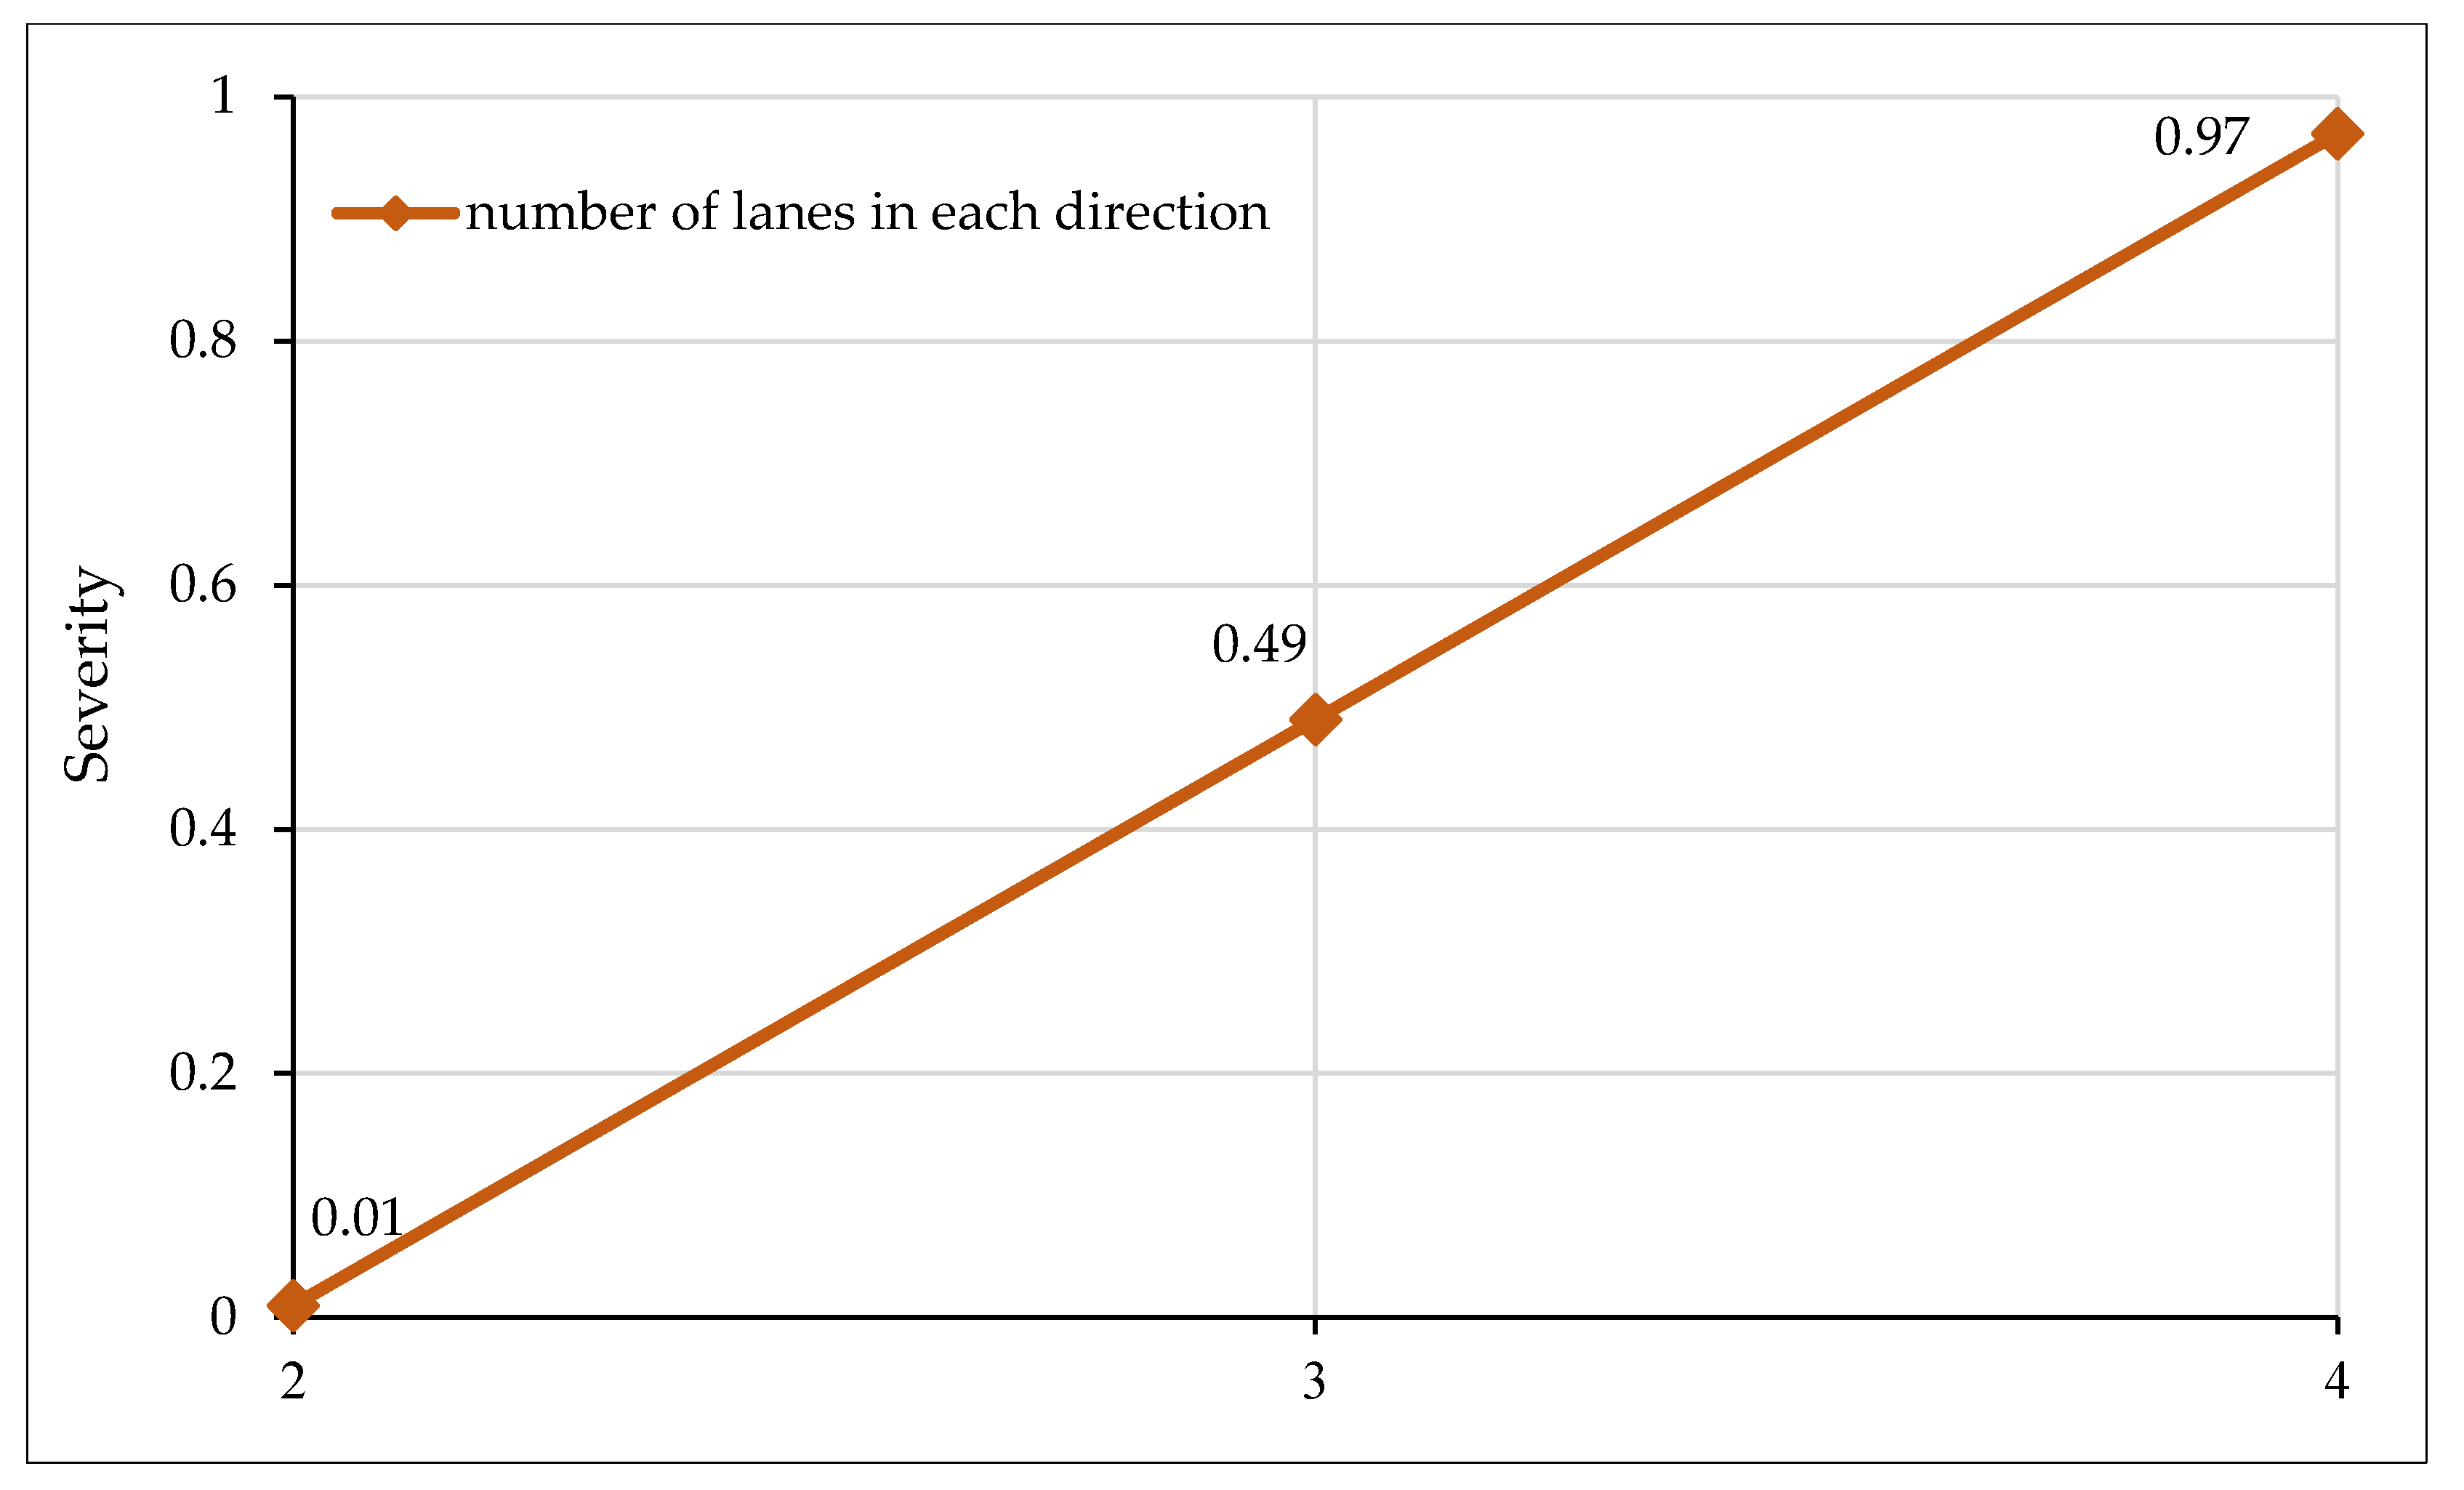
Figure 3 shows the impact of the highway type on crash severity with the x-axis representing the absence/presence of a specific highway category, and the y-axis displaying the severity outcome. Severity values close to “0” indicate that there are very low prospects of the crash being fatal, while a severity value approaching “1” represents a higher probability of a fatal crash occurrence. It may be noted from Figure 3 that the presence of an expressway increases the probability of a fatal crash by over 9%. For the current study, expressways were designated as the facilities with a minimum of three lanes in each direction and travel speed above 120 Km/h. Although freeways facilities have a forgiving design and are accompanied by protecting structures such as barriers, crash cushions, etc., the high travel speeds aggravate the impact during a crash event. The low traffic volume and forgiving road design along freeways sometimes also make the drivers more relaxed, which also intensifies the severity of crashes. These observations are intuitive and consistent with several previous studies [36,82,83]. On the other hand, the presence of a divided highway increases the chances of non-fatal crashes. A divided highway separates the traffic in the opposing direction by a median and has two lanes in each direction with a travel speed lower than expressways. Having relatively low speeds and high traffic volume could be the potential evidence for non-fatal crashes. Similarly, the majority of crashes reported on divided highways are rear end, which is also an indicator of non-fatal crashes [84,85]. Crashes occurring along a single highway have the highest probability of being fatal since there is no separating medium between the opposing traffic, and most of the crashes are head-on. It has been established that head-on crashes are associated with high fatality [86,87]. Figure 4 shows the relationships between the number of lanes in each direction versus observed crash severity. It is evident from the figure that severity increases as the number of lanes in each direction increases. With an increase in the number of lanes, drivers usually drive at high speed and are relatively relaxed, which could be one possible argument for increased crash severity.
5.2.2. Sensitivity Analysis for Weather Characteristics
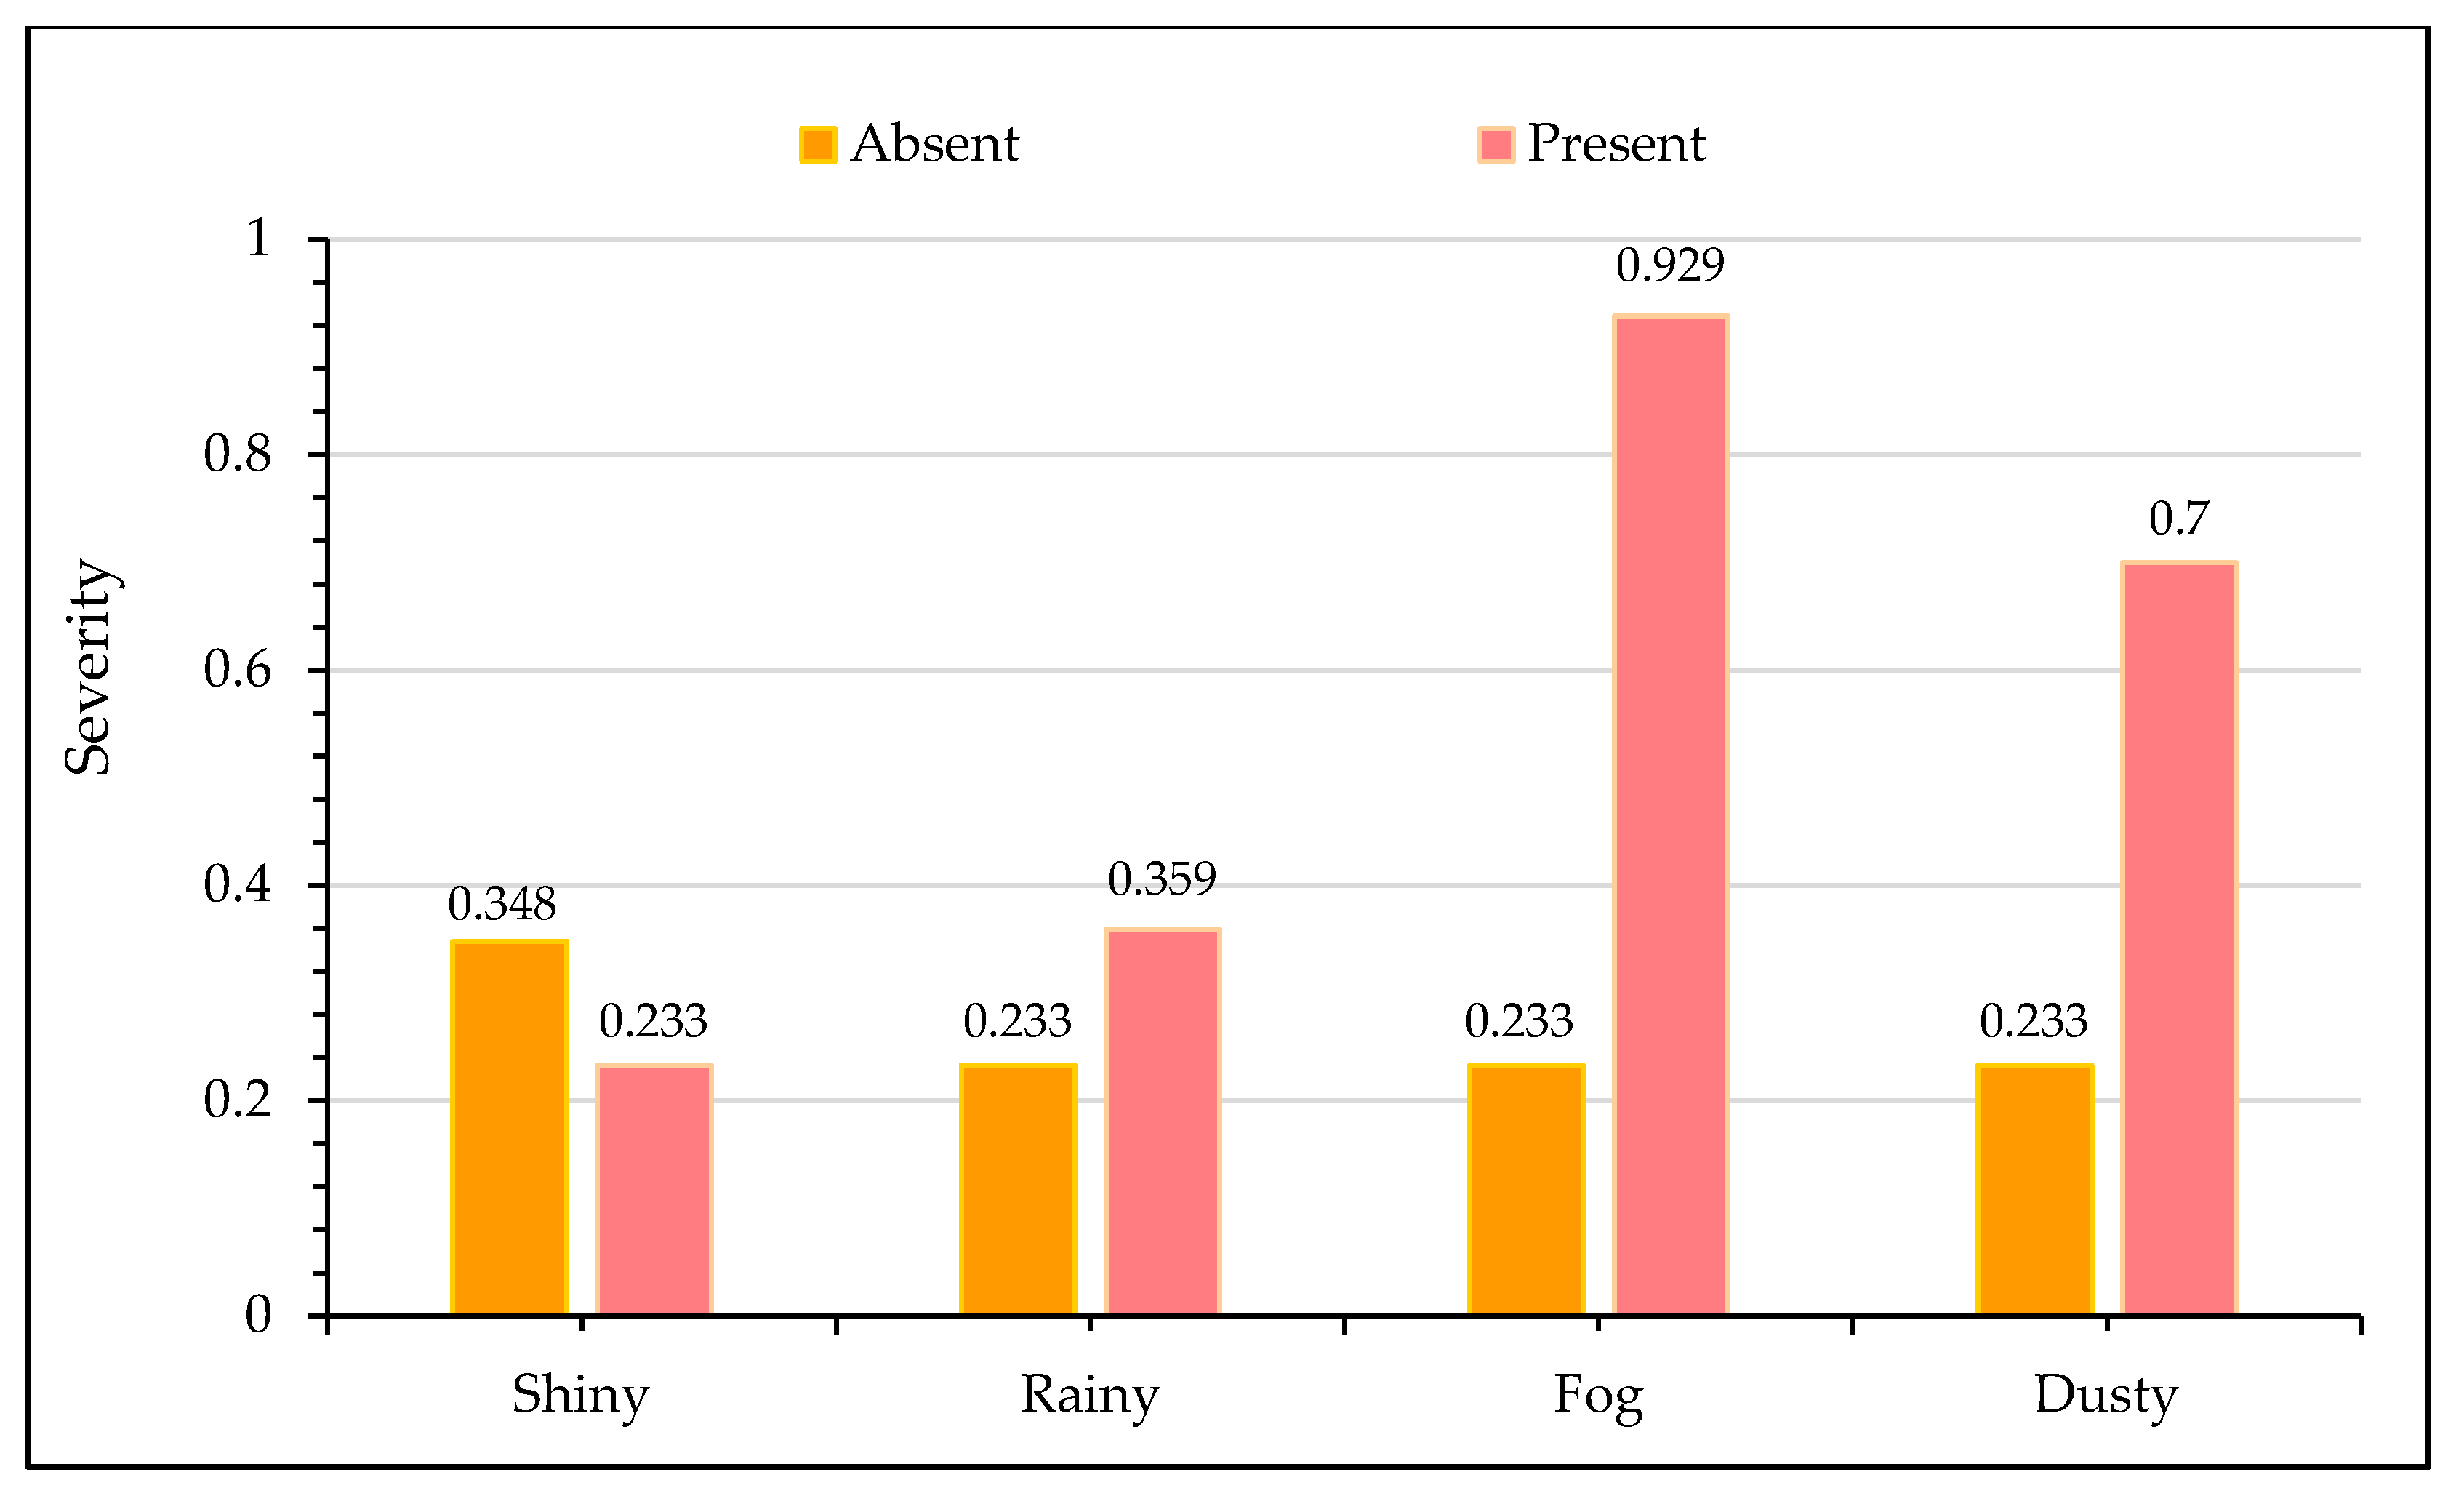
Figure 5 portrays the effect of different weather conditions on crash severity output. It is worth noting that shiny weather conditions are associated with non-fatal crashes. During clear weather, drivers usually have a good sight of the roadway ahead during travel. Furthermore, they are more aware of adjacent vehicles and can detect the danger from a long distance, which gives them ample reaction time to control their vehicles. Thus, shiny weather reduces the prospects of severe crashes [88]. In contrast, the presence of adverse weather conditions such as rainy weather, fog, dusty conditions (mostly due to sand storms) all increases the likelihood of fatal crashes. High probability of fatal crashes during rainy weather conditions may be attributed to retarded visibility and loss of friction and pavement skid resistance [89,90]. Similarly, during foggy weather conditions, the driver’s sight is severely hampered, at times limiting the vision to only a few meters ahead. Drivers are unable to detect the nearby threat, and chances of fatalities are very high, even if vehicles are maintaining average traveling speeds since drivers do not have enough time to compensate. Sand storms are other prominent causes of fatal crashes throughout the KSA as they occur at different times of the year. During such weather conditions, the atmosphere is filled with dust and sand particles lasting from a few days to weeks, imparting poor visibility. These observations are in agreement with existing research. Several previous studies have reported that the presence of adverse weather conditions increases the injury severity of traffic crashes [89,91,92].
5.2.3. Sensitivity Analysis for Vehicle Characteristics
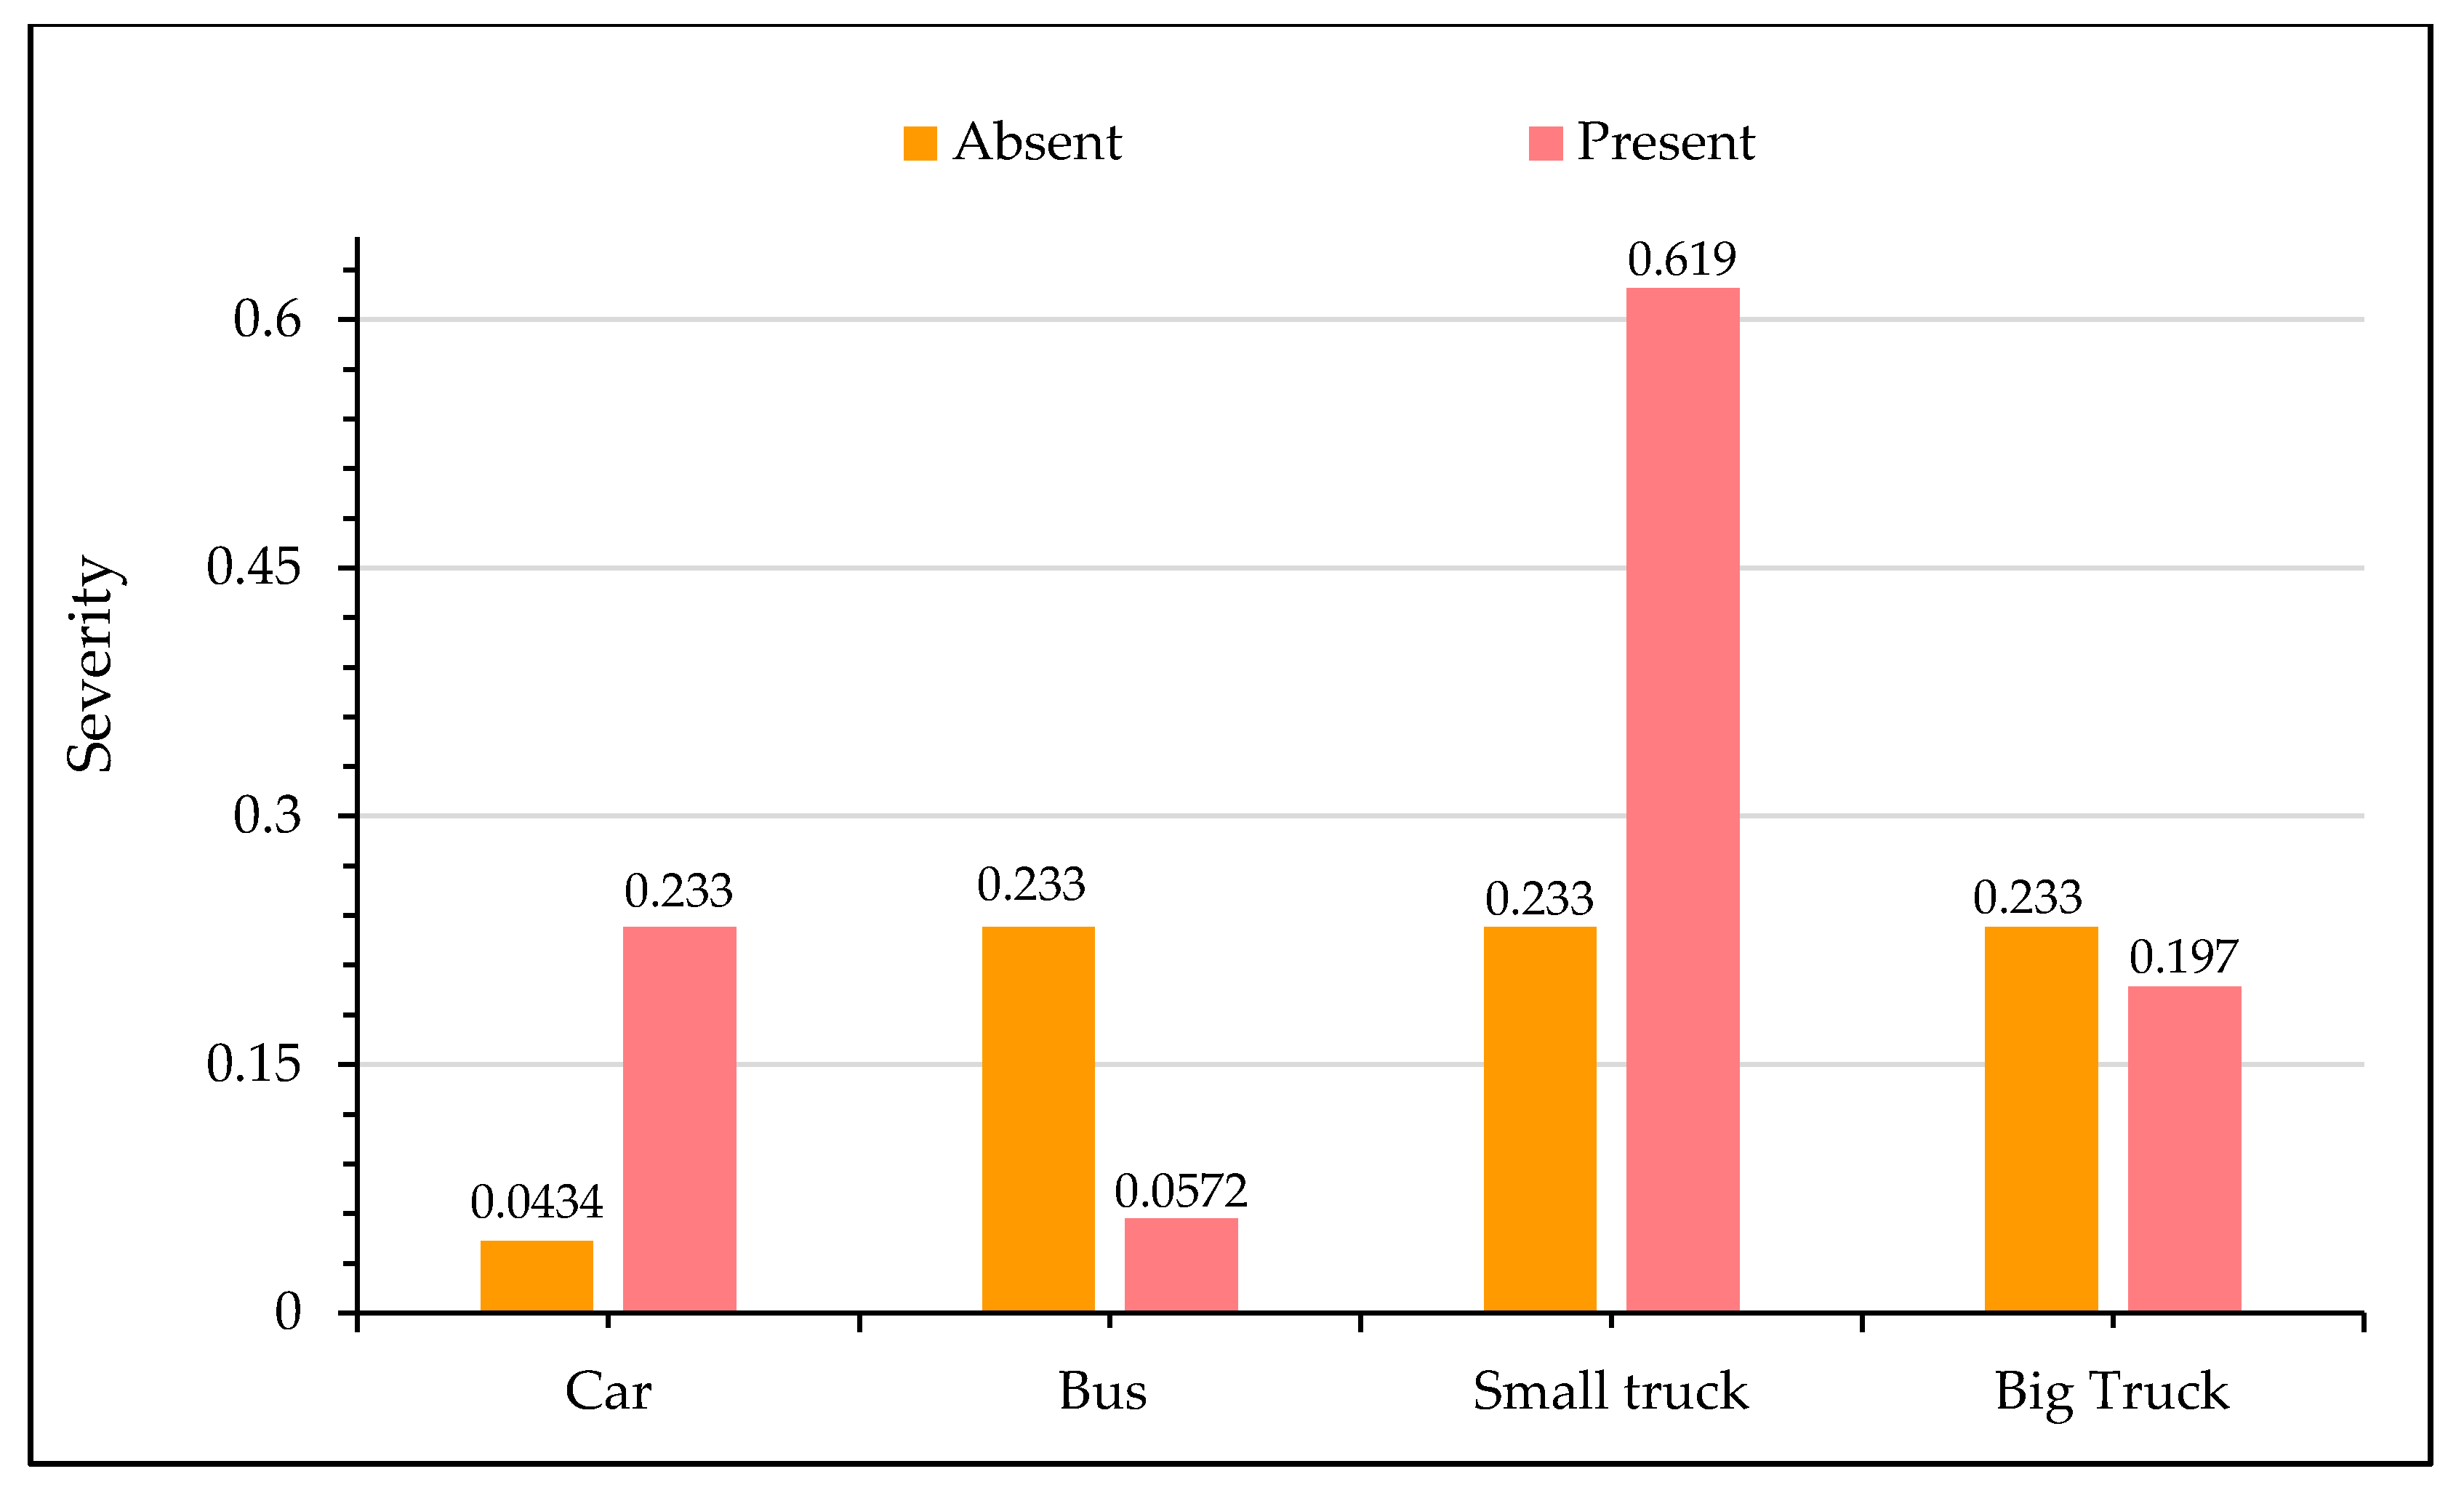
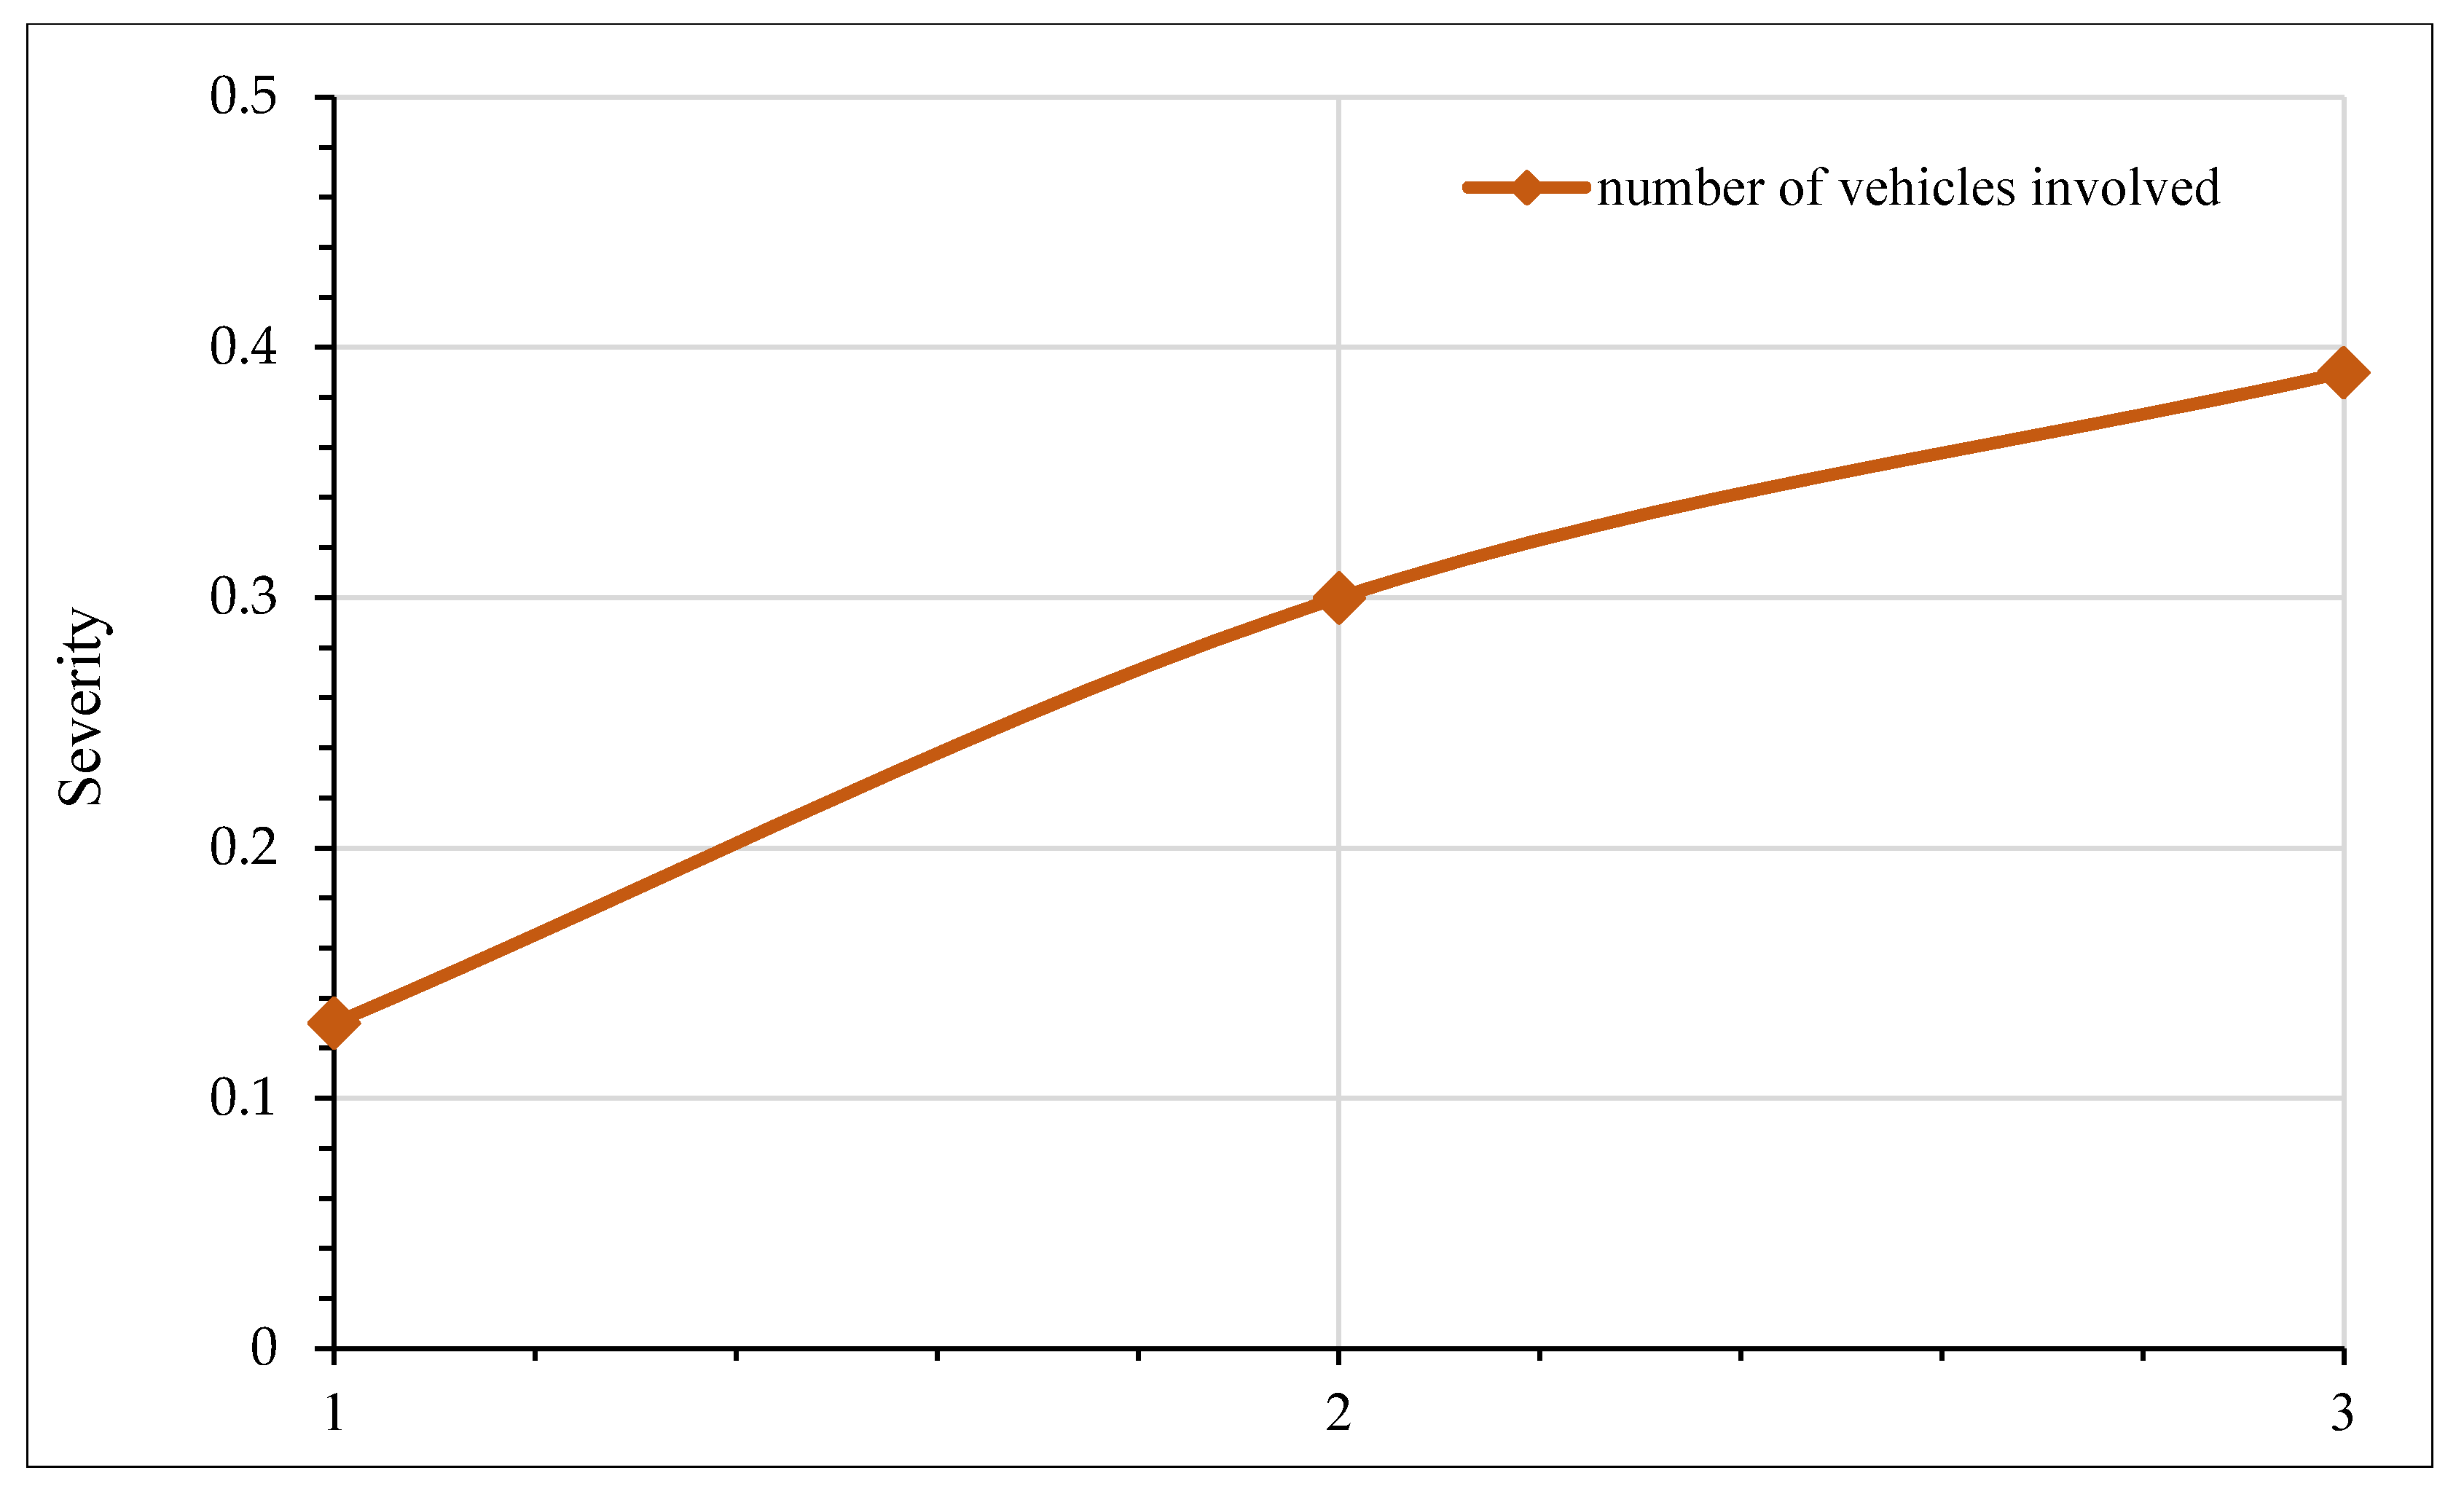
In Figure 6, sensitivity analysis for crash injury severity based on the type of vehicle involved is shown. It is evident from the figure that the presence of a car and a small truck is associated with an increased likelihood of fatal crashes. In particular, the probability of a fatal crash is increased by approximately 40% in collisions involving small trucks. This observation may be attributed to a severe impact due to the relatively high speeds of these vehicles. The literature suggests that high speed is an undeniable factor for greater kinetic energy release during motor vehicle collisions [93,94]. It is interesting to note that collisions involving buses and big trucks reduce the odds of fatal crashes. This perception is reasonable first because the average travel speed for buses and big trucks are relatively low, and second, these vehicles are structurally well-built and can absorb a significant amount of energy during the impact. Therefore, the chances of severe injuries are relatively less. These findings are consistent with the previous literature [95]. However, few studies have also reported that prospects for severe injuries are aggravated in crashes involving buses and trucks [49,96,97]. Figure 7 presents the relationship between crash injury severity and the total number of vehicles involved. It is clear that as the number of vehicles involved increases, there is a greater probability of a crash, resulting in a fatality. Earlier studies also suggest that multi-vehicle collisions are usually more prone to severe crashes [95,98,99].
5.2.4. Sensitivity Analysis for Crash Characteristics
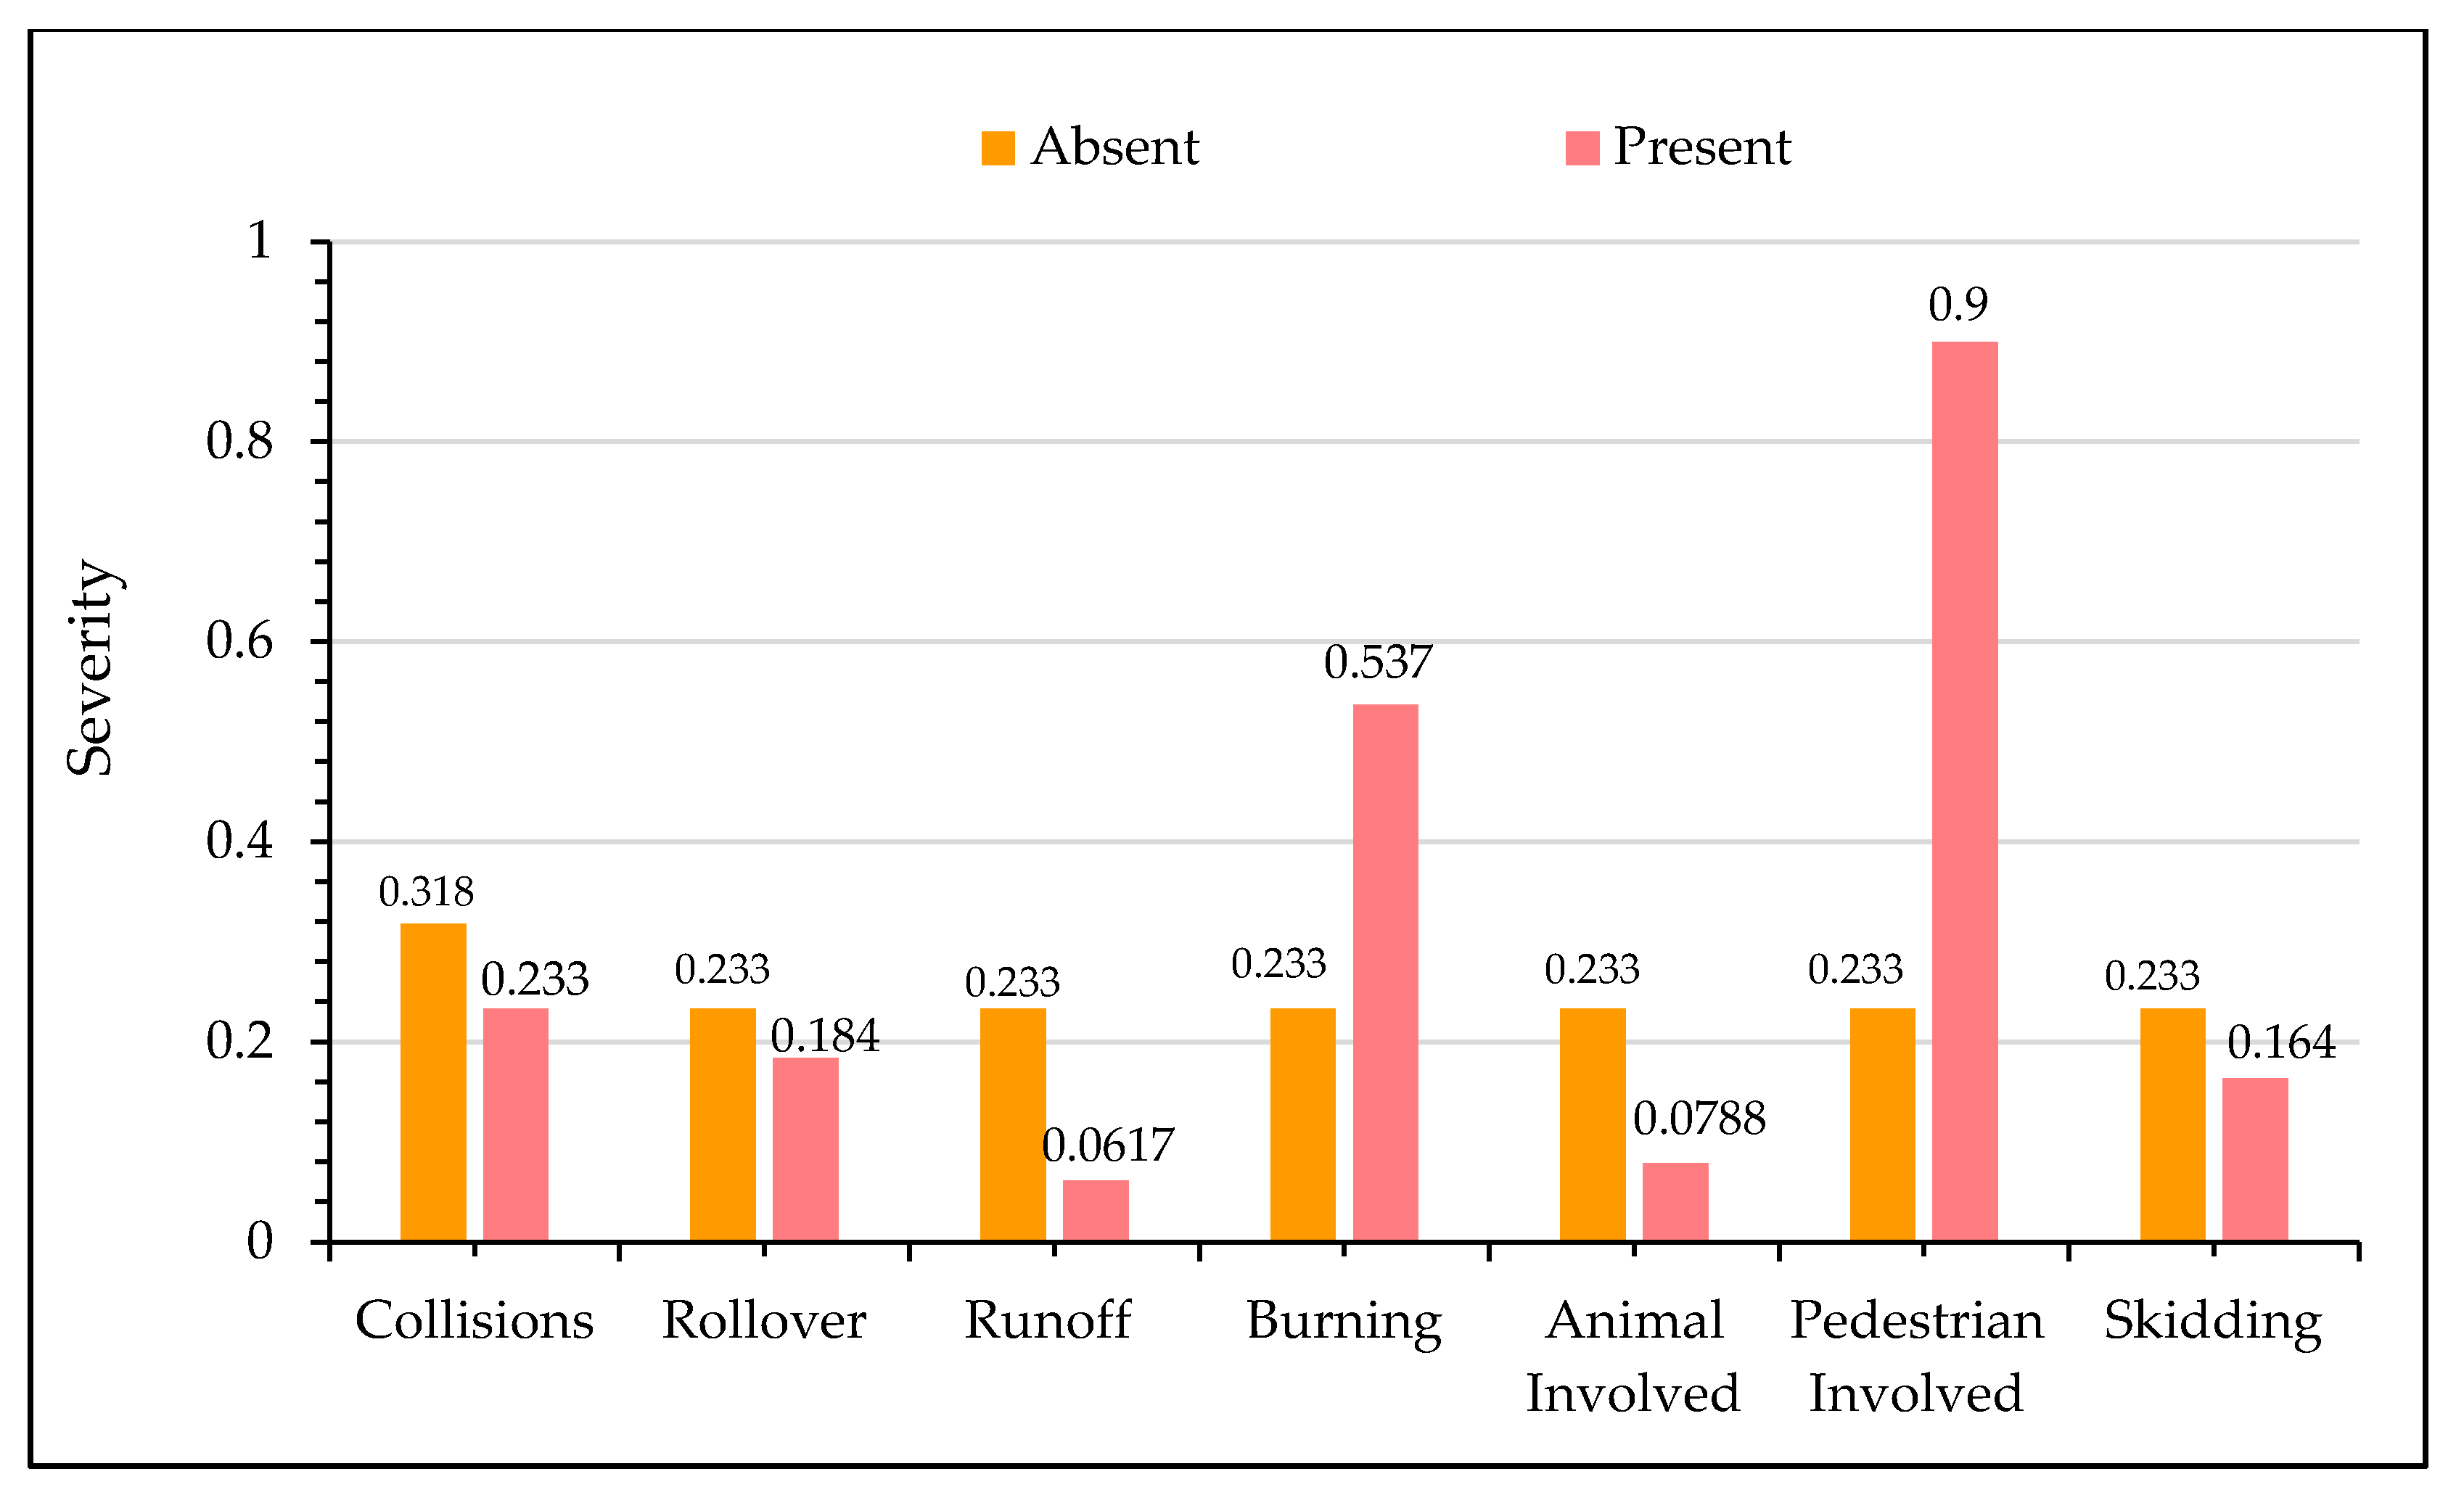
Figure 8 shows the impact of crash characteristics on motor vehicle injury severity. As shown in the figure, crash types such as collisions between motor vehicles, vehicle rollover, run-off the road, crashes involving animals, and those due to skidding are associated with less severe crashes. While hit pedestrian crashes and those with vehicles burnt during the crash are likely to increase the odds of fatal crashes. In particular, crashes involving pedestrians increases the probability of fatal crashes by around 70%. During the collisions due to vehicle impact, the engine sometimes may catch fire, which can spread quickly to the entire vehicle, preventing quick rescue operations from evacuating drivers and passengers, who succumb to death [100]. Pedestrians are classified among the vulnerable road users’ group, are directly exposed to impact, which increases the chances of fatalities [101,102]. The observation that collisions between motor vehicles lower the probability of severe injuries may seem contradictory in light of existing research; however, it is worth mentioning that the majority of crashes reported for the current study were rear-ended, which mainly occurred along divided highways and expressways. The literature suggests that rear-end usually crashes, resulting in non-fatal injury [103]. The low probability of skidding crashes may be attributed to high driver alertness and lower speeds during inclement weather. Similarly, increased likelihood of minor injuries during run-off crashes may be credited to plain and greater recovery area along most highways in the KSA. Finally, there were only a few animals crashes in the dataset; this could be one of the potential reasons for a crash being non-fatal.
5.2.5. Sensitivity Analysis for On-Site Damage Conditions
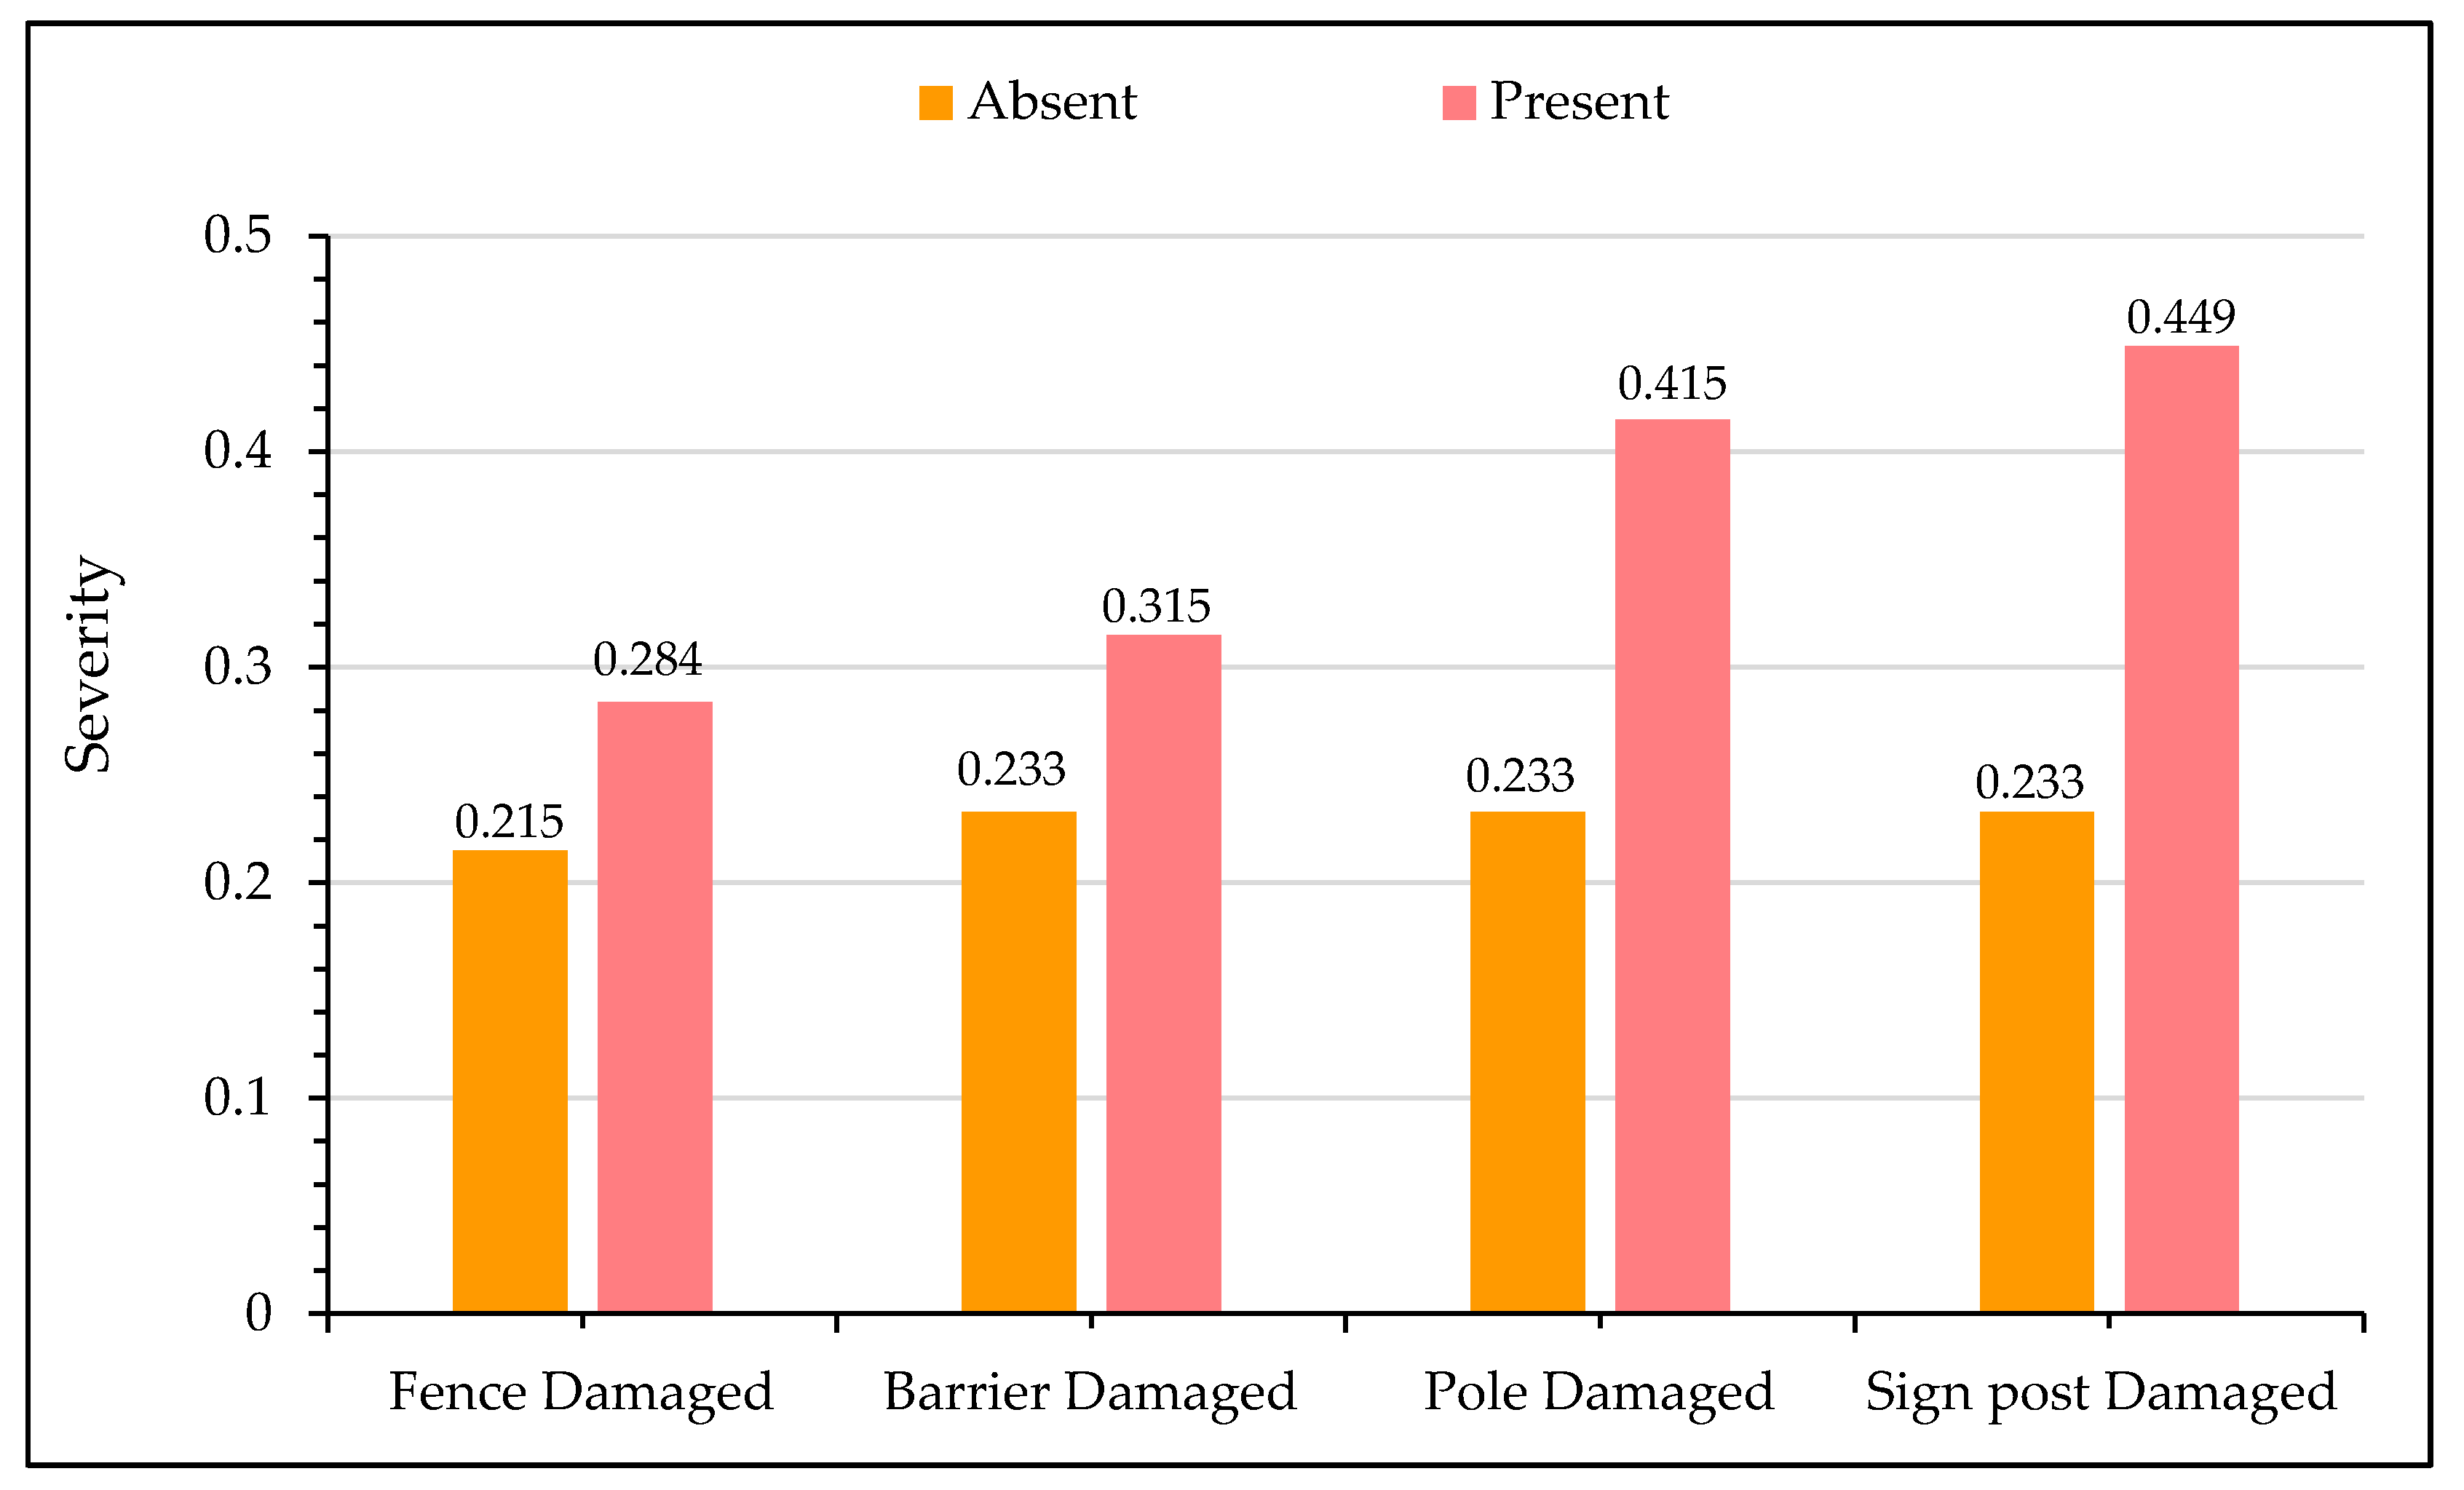
Figure 9 presents the sensitivity analysis for crash injury severity with on-site damaged conditions from crash locations. The presence of damage on the flexible barrier and fence is a hint of the slight increase in the likelihood of fatal crashes. The presence of a fence and side barrier dissipates and absorbs some of the energy of the errant vehicle and usually diverts it back to the highway. In comparison, the damage on signposts and poles are significant indicators of fatal crashes. Signposts and poles are usually located far from the main carriageway; thus, the presence of damage on them implies that either the vehicles were traveling at very high speeds or the driver fell asleep due to fatigue. Second, the structures of signposts and poles are very rigid and cannot absorb the kinetic energy upon impact, unlike flexible roadside barriers and fences.
5.2.6. Sensitivity Analysis for Traffic Characteristics
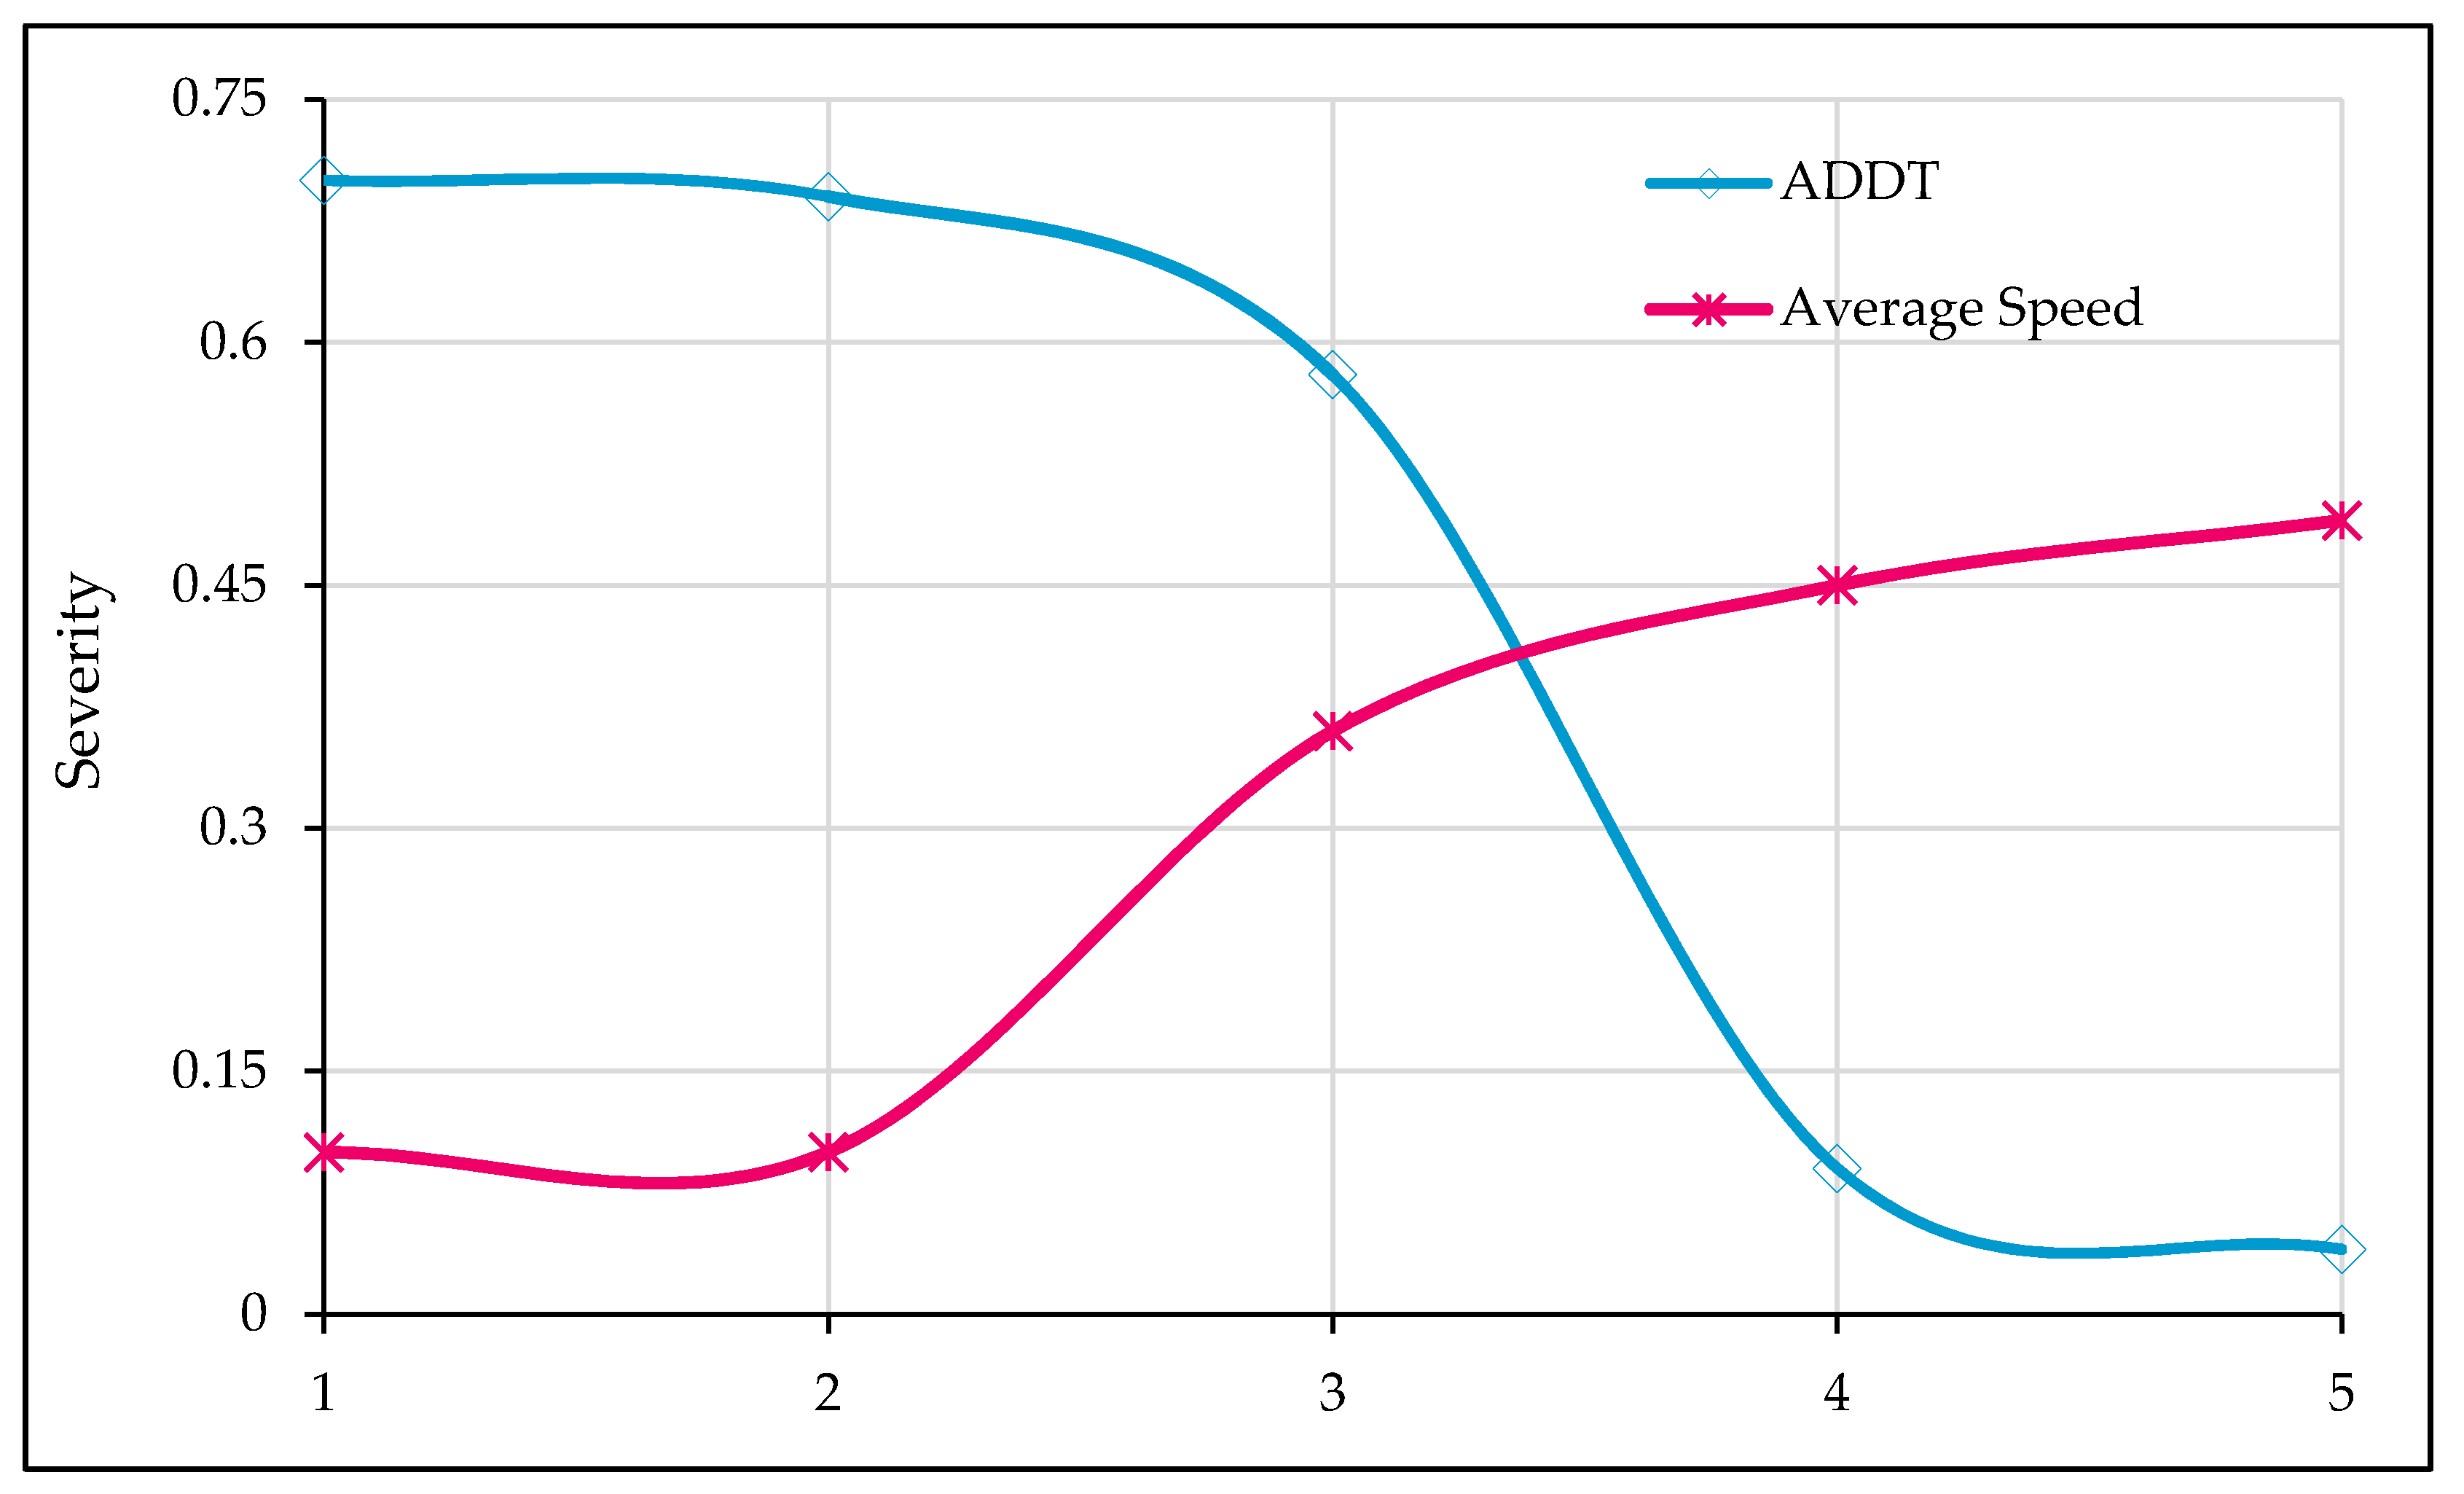
In Figure 10, the influence of traffic characteristics (AADT, and average stream speed) on crash injury severity is shown. The numeric values (1–5) for ADDT and average speeds shown on the x-axis represent the respective categories given in Table 1 (descriptive statistics). It may be noted from the figure that increasing AADT values are associated with non-fatal crashes. In contrast, high traveling speeds are indicators of fatal injury. Both these observations are intuitive and are in-line with the existing literature [86]. An increase in traffic reduces the drivers’ freedom to drive at free flow since their movement is restrained by other vehicles, who are bound to adjust their vehicle speeds. Furthermore, when ADDT is high, the drivers are more aware and alert to surrounding traffic. Many previous studies have established the association between high traveling speed and fatal crashes [93,104,105].
6. Conclusions
Traffic crashes represent a threat to public health worldwide. Predicting crash injury severity is a promising research target in the highway safety domain. In recent years, ML-based methods have emerged as favorable alternatives to statistical methods due to their exceptional abilities to capture nonlinear relationships between variables, and fewer model assumptions, unlike the later ones. However, mere accurate prediction from ML does not advance the researcher’s understanding of the individual role of injury severity contributing factors, necessitating a thorough sensitivity analysis for predictor variables. In this study, an improved FFNN model was developed for injury severity prediction and variable sensitivity analysis using three years of crash data collected along rural highways in the KSA. A total of 12,566 crashes were reported that resulted in 1320 deaths and 7947 injuries. The processed data had six main categories of explanatory variables in 59 sub-levels for categorical variables. Injury severity, the target variable was classified into two severity groups (i.e., fatal and non-fatal injury). The overall prediction accuracy was around 77.5%, indicating an acceptable model performance given the extent and nature of the available input data. In addition, the results for classification metrics sensitivity and specificity also demonstrated the favorable predictive performance and efficacy of the proposed approach. Sensitivity analysis results via optimized NN architecture showed that variables such as traffic volume, average travel speeds, weather conditions, on-site damage conditions, road and vehicle type, and pedestrian involvement have a significant association with crash injury severity outcome. The findings of this study are expected to provide useful guidance to policymakers for adopting suitable countermeasures to enhance road safety.
This study does have a few potential limitations that must be acknowledged. For example, this study was based on a limited three years of crash data with no detailed sociodemographic attributes of drivers that may have considerable influence on crash severity investigation. In the future, detailed datasets covering other road types, regions, and prolonged periods may be considered. Furthermore, this study considered only two severity groups; however, studies based on multiple injury severity classes may reveal interesting insights. Studies could also focus on the crash severity analysis of specific road user groups and collision types. Similarly, previous studies have found that crash data may involve many unobserved heterogeneity issues [106,107]. This problem may be tackled by dividing the data into several subgroups to uncover the relationship between crash injury severity and associated factors. Finally, severity prediction performance proposed methods could be compared with other advanced machine learning techniques (like ensemble learning, deep learning, Bayesian networks, etc.) and state-of-the-art statistical methods such as multivariate and random parameter models.
Author Contributions
Conceptualization, A.J. and W.U.; Methodology, W.U.; Software, W.U.; Validation, A.J.; Formal analysis, A.J., W.U.; Investigation, A.J.; Resources, W.U.; Data curation, A.J.; Writing—original draft preparation, A.J.; Writing—review and editing, W.U.; Visualization, A.J.; Supervision, W.U.; Project administration, W.U. All authors have read and agreed to the published version of the manuscript.
Funding
The authors would like to acknowledge the funding support provided by Deanship of Scientific Research (DSR) at King Fahd University of Petroleum & Minerals for funding this work.
Conflicts of Interest
The authors declare no conflict of interest.
Appendix A
- y_1 = Logistic (-0.995587 + (scaled_expressway*-0.354336) + (scaled_divided_highway*-0.29182) + (scaled_single_highway*0.43358) + (scaled_shiny*-1.08956) + (scaled_rainy*-0.511944) + (scaled_fog*1.1712) + (scaled_dusty*0.894094) + (scaled_car*-0.418529) + (scaled_bus*-0.286795) + (scaled_smalltruck*-0.312071) + (scaled_bigtruck*0.687496) + (scaled_AverageAnnulaDailyTraffic_ADDT_*-0.782044) + (scaled_Avg.Speed*0.556496) + (scaled_NumberofLanes*0.395474) + (scaled_crash*1.18782) + (scaled_roll_over*-0.554596) + (scaled_Run_off_road*-2.23453) + (scaled_burning*0.222759) + (scaled_animal*1.35505) + (scaled_skidding*0.148185) + (scaled_pedestrian*0.359489) + (scaled_no_of_vehicles_involved*0.217981) + (scaled_no_damage*-0.0865889) + (scaled_fence*0.222342) + (scaled_barrier*-0.511662) + (scaled_lighting_pole*-0.0275431) + (scaled_signboard*-0.758213));
- y_2 = Logistic (1.76863+ (scaled_expressway*2.37842) + (scaled_divided_highway*-1.83973) + (scaled_single_highway*0.14903) + (scaled_shiny*1.62146) + (scaled_rainy*0.576438) + (scaled_fog*1.33062) + (scaled_dusty*-2.01074) + (scaled_car*0.0929988) + (scaled_bus*-3.53022) + (scaled_smalltruck*0.398554) + (scaled_bigtruck*3.05684) + (scaled_AverageAnnulaDailyTraffic_ADDT_*-1.88497) + (scaled_Avg.Speed*3.50026) + (scaled_NumberofLanes*2.12327) + (scaled_crash*-0.586664) + (scaled_roll_over*-0.467537) + (scaled_Run_off_road*2.40548) + (scaled_burning*1.1775) + (scaled_animal*-1.07728) + (scaled_skidding*-1.07976) + (scaled_pedestrian*-0.50781) + (scaled_no_of_vehicles_involved*0.549078) + (scaled_no_damage*0.732242) + (scaled_fence*-2.44596) + (scaled_barrier*1.87162) + (scaled_lighting_pole*-2.40242) + (scaled_signboard*2.01491));
- y_3 = Logistic (-0.150089 + (scaled_expressway*-0.779422) + (scaled_divided_highway*0.961344) + (scaled_single_highway*-0.396142) + (scaled_shiny*-0.803468) + (scaled_rainy*0.811967) + (scaled_fog*0.0198535) + (scaled_dusty*1.61784) + (scaled_car*-5.79697) + (scaled_bus*0.207224) + (scaled_smalltruck*4.38719) + (scaled_bigtruck*4.0538) + (scaled_AverageAnnulaDailyTraffic_ADDT_*1.1388) + (scaled_Avg.Speed*2.86474) + (scaled_NumberofLanes*3.69685) + (scaled_crash*2.13024) + (scaled_roll_over*-1.62119) + (scaled_Run_off_road*-1.87732) + (scaled_burning*-1.57074) + (scaled_animal*2.69996) + (scaled_skidding*0.659162) + (scaled_pedestrian*1.14106) + (scaled_no_of_vehicles_involved*0.678435) + (scaled_no_damage*2.04318) + (scaled_fence*2.63091) + (scaled_barrier*-4.31338) + (scaled_lighting_pole*0.515242) + (scaled_signboard*-1.34195));
- y_4 = Logistic (1.09247 + (scaled_expressway*-0.987669) + (scaled_divided_highway*1.32038) + (scaled_single_highway*1.36756) + (scaled_shiny*-0.342812) + (scaled_rainy*1.35944) + (scaled_fog*1.7014) + (scaled_dusty*2.42403) + (scaled_car*3.65992) + (scaled_bus*-1.98591) + (scaled_smalltruck*-3.07896) + (scaled_bigtruck*-0.44773) + (scaled_AverageAnnulaDailyTraffic_ADDT_*5.01135) + (scaled_Avg.Speed*-0.581382) + (scaled_NumberofLanes*-5.97399) + (scaled_crash*0.469865) + (scaled_roll_over*2.85539) + (scaled_Run_off_road*-3.96823) + (scaled_burning*-0.851219) + (scaled_animal*-0.0944983) + (scaled_skidding*-0.150613) + (scaled_pedestrian*-0.655078) + (scaled_no_of_vehicles_involved*-0.534065) + (scaled_no_damage*-0.874981) + (scaled_fence*2.07124) + (scaled_barrier*-1.10295) + (scaled_lighting_pole*2.01337) + (scaled_signboard*4.01189));
- y_5 = Logistic (1.31223 + (scaled_expressway*-0.460841) + (scaled_divided_highway*1.1601) + (scaled_single_highway*0.368057) + (scaled_shiny*1.20106) + (scaled_rainy*-0.342102) + (scaled_fog*-0.368233) + (scaled_dusty*0.648587) + (scaled_car*-0.168535) + (scaled_bus*0.903567) + (scaled_smalltruck*-0.972495) + (scaled_bigtruck*0.743239) + (scaled_AverageAnnulaDailyTraffic_ADDT_*-0.602835) + (scaled_Avg.Speed*-0.433562) + (scaled_NumberofLanes*0.184835) + (scaled_crash*0.163512) + (scaled_roll_over*-1.55079) + (scaled_Run_off_road*1.83793) + (scaled_burning*0.811734) + (scaled_animal*0.33973) + (scaled_skidding*0.640188) + (scaled_pedestrian*-0.217664) + (scaled_no_of_vehicles_involved*0.0232666) + (scaled_no_damage*0.129678) + (scaled_fence*0.923295) + (scaled_barrier*0.235469) + (scaled_lighting_pole*1.06563) + (scaled_signboard*-0.993238));
- y_6 = Logistic (-1.73732 + (scaled_expressway*1.20981) + (scaled_divided_highway*-2.89906) + (scaled_single_highway*1.50868) + (scaled_shiny*-1.07576) + (scaled_rainy*-2.4256) + (scaled_fog*1.32154) + (scaled_dusty*0.900551) + (scaled_car*-5.39265) + (scaled_bus*2.01437) + (scaled_smalltruck*2.85767) + (scaled_bigtruck*2.69811) + (scaled_AverageAnnulaDailyTraffic_ADDT_*1.04841) + (scaled_Avg.Speed*-5.20317) + (scaled_NumberofLanes*3.78315) + (scaled_crash*0.463222) + (scaled_roll_over*-1.87714) + (scaled_Run_off_road*-0.591788) + (scaled_burning*0.80389) + (scaled_animal*3.39016) + (scaled_skidding*2.39256) + (scaled_pedestrian*-0.466654) + (scaled_no_of_vehicles_involved*-3.11739) + (scaled_no_damage*-0.414976) + (scaled_fence*0.38915) + (scaled_barrier*-0.164475) + (scaled_lighting_pole*-1.18927) + (scaled_signboard*-1.48262)).
References
- World Health Organisation. Global Status Report on Road Safety 2018; WHO: Geneva, Switzerland, 2019. [Google Scholar]
- Mohamed, H.A. Estimation of socio-economic cost of road accidents in Saudi Arabia: Willingness-to-pay approach (WTP). Adv. Manag. Appl. Econ. 2015, 5, 43. [Google Scholar]
- Peden, M. Global collaboration on road traffic injury prevention. Int. J. Inj. Control Saf. Promot. 2005, 12, 85–91. [Google Scholar] [CrossRef] [PubMed]
- Ker, K.; Roberts, I.; Collier, T.; Beyer, F.; Bunn, F.; Frost, C. Post-licence driver education for the prevention of road traffic crashes: A systematic review of randomised controlled trials. Accid. Anal. Prev. 2005, 37, 305–313. [Google Scholar] [CrossRef] [PubMed]
- Bunn, F. Traffic calming for the prevention of road traffic injuries: Systematic review and meta-analysis. Inj. Prev. 2003, 9, 200–204. [Google Scholar] [CrossRef] [PubMed] [Green Version]
- Peden, M.; Scurfield, R.; Sleet, D.; Hyder, A.A.; Mathers, C.; Jarawan, E.; Hyder, A.A.; Mohan, D.; Jarawan, E. World Report on Road Traffic Injury Prevention; World Health Organization: Geneva, Switzerland, 2004. [Google Scholar]
- Ernstberger, A.; Joeris, A.; Daigl, M.; Kiss, M.; Angerpointner, K.; Nerlich, M.; Schmucker, U. Decrease of morbidity in road traffic accidents in a high income country—An analysis of 24,405 accidents in a 21 year period. Injury 2015, 46, 135–143. [Google Scholar] [CrossRef]
- Ullah, I.; Jamal, A.; Subhan, F. Public perception of autonomous car: A case study for Pakistan. Adv. Transp. Stud. 2019, 49, 145–154. [Google Scholar]
- Zahid, M.; Chen, Y.; Jamal, A.; Memon, Q.M. Short term traffic state prediction via hyperparameter optimization based classifiers. Sensors 2020, 20, 685. [Google Scholar] [CrossRef] [PubMed] [Green Version]
- Jamal, A.; Rahman, M.T.; Al-Ahmadi, H.M.; Ullah, I.M.; Zahid, M. Intelligent intersection control for delay optimization: Using meta-heuristic search algorithms. Sustainability 2020, 12, 1896. [Google Scholar] [CrossRef] [Green Version]
- Salam, A.A.; Elsegaey, I.; Khraif, R.; Al-Mutairi, A. Population distribution and household conditions in Saudi Arabia: Reflections from the 2010 Census. SpringerPlus 2014, 3, 530. [Google Scholar] [CrossRef] [Green Version]
- Al-Turki, M.; Jamal, A.; Al-Ahmadi, H.M.; Al-Sughaiyer, M.A.; Zahid, M. On the Potential Impacts of Smart Traffic Control for Delay, Fuel Energy Consumption, and Emissions: An NSGA-II-Based Optimization Case Study from Dhahran, Saudi Arabia. Sustainability 2020, 12, 7394. [Google Scholar] [CrossRef]
- Al Turki, Y.A. How can Saudi Arabia use the decade of action for road safety to catalyse road traffic injury prevention policy and interventions? Int. J. Inj. Control Saf. Promot. 2014, 21, 397–402. [Google Scholar] [CrossRef] [PubMed]
- Mansuri, F.A.; Al-Zalabani, A.H.; Zalat, M.M.; Qabshawi, R.I. Road safety and road traffic accidents in Saudi Arabia: A systematic review of existing evidence. Saudi Med. J. 2015, 36, 418. [Google Scholar] [CrossRef]
- Jamal, A.; Rahman, M.T.; Ahmadi, H.M.; Mansoor, U. The Dilemma of road safety in the eastern provice of Saudi Arabia: Consequences and prevention strategies. Int. J. Environ. Res. Public Health 2020, 17, 157. [Google Scholar] [CrossRef] [PubMed] [Green Version]
- Bener, A.; Jadaan, K.S. A perspective on road fatalities in Jeddah, Saudi Arabia. Accid. Anal. Prev. 1992, 24, 143–148. [Google Scholar] [CrossRef]
- Mohamed, M.; Bromfield, N.F. Attitudes, driving behavior, and accident involvement among young male drivers in Saudi Arabia. Transp. Res. Part F Traffic Psychol. Behav. 2017, 47, 59–71. [Google Scholar] [CrossRef]
- Rahman, M.T.; Jamal, A.; Al-Ahmadi, H.M. Examining hotspots of traffic collisions and their spatial relationships with land use: A GIS-based geographicallyweighted regression Approach for dammam, Saudi Arabia. ISPRS Int. J. Geo-Inf. 2020, 9, 540. [Google Scholar] [CrossRef]
- Ageli, M.; Zaidan, A. Road traffic accidents in saudi arabia: An ardl approach and multivariate granger causality. J. Econ. Financ. 2013, 5. [Google Scholar] [CrossRef]
- Alghnam, S.; Alrowaily, M.; Alkelya, M.; Alsaif, A.; Almoaiqel, F.; Aldegheishem, A. The prevalence of seatbelt and mobile phone use among drivers in Riyadh, Saudi Arabia: An observational study. J. Saf. Res. 2018, 66, 33–37. [Google Scholar] [CrossRef]
- Bendak, S. Seat belt utilization in Saudi Arabia and its impact on road accident injuries. Accid. Anal. Prev. 2005, 37, 367–371. [Google Scholar] [CrossRef]
- Hu, S.-R.; Li, C.-S.; Lee, C.-K. Investigation of key factors for accident severity at railroad grade crossings by using a logit model. Saf. Sci. 2010, 48, 186–194. [Google Scholar] [CrossRef] [Green Version]
- Zahabi, S.A.H.; Strauss, J.; Manaugh, K.; Miranda-Moreno, L.F. Estimating potential effect of speed limits, built environment, and other factors on severity of pedestrian and cyclist injuries in crashes. Transp. Res. Rec. 2011, 2247, 81–90. [Google Scholar] [CrossRef]
- Zahid, M.; Chen, Y.; Jamal, A.; Al-Ahmadi, H.M.; Al-Ofi, A.K. Adopting machine learning and spatial analysis techniques for driver risk assessment: Insights from a case study. Int. J. Environ. Res. Public Health 2020, 17, 5193. [Google Scholar] [CrossRef] [PubMed]
- Zahid, M.; Chen, Y.; Jamal, A.; Mamadou, C.Z. Freeway short-term travel speed prediction based on data collection time-horizons: A fast forest quantile regression approach. Sustainability 2020, 12, 646. [Google Scholar] [CrossRef] [Green Version]
- Azimi, G.; Rahimi, A.; Asgari, H.; Jin, X. Severity analysis for large truck rollover crashes using a random parameter ordered logit model. Accid. Anal. Prev. 2020, 135, 105355. [Google Scholar] [CrossRef] [PubMed]
- Rifaat, S.M.; Chin, H.C. Accident severity analysis using ordered probit model. J. Adv. Transp. 2007, 41, 91–114. [Google Scholar] [CrossRef]
- Shankar, V.; Mannering, F. An exploratory multinomial logit analysis of single-vehicle motorcycle accident severity. J. Saf. Res. 1996, 27, 183–194. [Google Scholar] [CrossRef]
- Yu, R.; Abdel-Aty, M. Using hierarchical Bayesian binary probit models to analyze crash injury severity on high speed facilities with real-time traffic data. Accid. Anal. Prev. 2014, 62, 161–167. [Google Scholar] [CrossRef]
- Khattak, A.J.; Kantor, P.; Council, F.M. Role of adverse weather in key crash types on limited-access: Roadways implications for advanced weather systems. Transp. Res. Rec. 1998, 1621, 10–19. [Google Scholar] [CrossRef]
- Chen, C.; Zhang, G.; Huang, H.; Wang, J.; Tarefder, R.A. Examining driver injury severity outcomes in rural non-interstate roadway crashes using a hierarchical ordered logit model. Accid. Anal. Prev. 2016, 96, 79–87. [Google Scholar] [CrossRef]
- O’Donnell, C.J.; Connor, D.H. Predicting the severity of motor vehicle accident injuries using models of ordered multiple choice. Accid. Anal. Prev. 1996, 28, 739–753. [Google Scholar] [CrossRef]
- Lee, C.; Abdel-Aty, M. Presence of passengers: Does it increase or reduce driver’s crash potential? Accid. Anal. Prev. 2008, 40, 1703–1712. [Google Scholar] [CrossRef] [PubMed]
- Aguero-Valverde, J.; Jovanis, P.P. Bayesian multivariate Poisson lognormal models for crash severity modeling and site ranking. Transp. Res. Rec. 2009, 2136, 82–91. [Google Scholar] [CrossRef]
- Russo, B.J.; Savolainen, P.T.; Schneider IV, W.H.; Anastasopoulos, P.C. Comparison of factors affecting injury severity in angle collisions by fault status using a random parameters bivariate ordered probit model. Anal. Methods Accid. Res. 2014, 2, 21–29. [Google Scholar] [CrossRef]
- Zeng, Q.; Wen, H.; Huang, H.; Pei, X.; Wong, S.C. A multivariate random-parameters Tobit model for analyzing highway crash rates by injury severity. Accid. Anal. Prev. 2017, 99, 184–191. [Google Scholar] [CrossRef] [PubMed] [Green Version]
- Milton, J.C.; Shankar, V.N.; Mannering, F.L. Highway accident severities and the mixed logit model: An exploratory empirical analysis. Accid. Anal. Prev. 2008, 40, 260–266. [Google Scholar] [CrossRef] [PubMed]
- Wang, J.; Huang, H.; Xu, P.; Xie, S.; Wong, S.C. Random parameter probit models to analyze pedestrian red-light violations and injury severity in pedestrian–motor vehicle crashes at signalized crossings. J. Transp. Saf. Secur. 2020, 12, 818–837. [Google Scholar] [CrossRef]
- Shankar, V.; Mannering, F.; Barfield, W. Statistical analysis of accident severity on rural freeways. Accid. Anal. Prev. 1996, 28, 391–401. [Google Scholar] [CrossRef]
- Osman, M.; Paleti, R.; Mishra, S.; Golias, M.M. Analysis of injury severity of large truck crashes in work zones. Accid. Anal. Prev. 2016, 97, 261–273. [Google Scholar] [CrossRef]
- Huang, H.; Chin, H.C.; Haque, M.M. Severity of driver injury and vehicle damage in traffic crashes at intersections: A Bayesian hierarchical analysis. Accid. Anal. Prev. 2008, 40, 45–54. [Google Scholar] [CrossRef]
- Li, Z.; Chen, C.; Ci, Y.; Zhang, G.; Wu, Q.; Liu, C.; Qian, Z.S. Examining driver injury severity in intersection-related crashes using cluster analysis and hierarchical Bayesian models. Accid. Anal. Prev. 2018, 120, 139–151. [Google Scholar] [CrossRef]
- Chen, S.; Zhang, S.; Xing, Y.; Lu, J. Identifying the factors contributing to the severity of truck-involved crashes in Shanghai River-Crossing Tunnel. Int. J. Environ. Res. Public Health 2020, 17, 3155. [Google Scholar] [CrossRef] [PubMed]
- Fan, W.D.; Gong, L.; Washing, E.M.; Yu, M.; Haile, E. Identifying and quantifying factors affecting vehicle crash severity at highway-rail grade crossings: Models and their comparison. In Proceedings of the Transportation Research Board 95th Annual Meeting, Washington, DC, USA, 10–14 January 2016. [Google Scholar]
- Abdel-Aty, M. Analysis of driver injury severity levels at multiple locations using ordered probit models. J. Saf. Res. 2003, 34, 597–603. [Google Scholar] [CrossRef] [PubMed]
- Tulu, G.S.; Washington, S.; Haque, M.M.; King, M.J. Injury severity of pedestrians involved in road traffic crashes in Addis Ababa, Ethiopia. J. Transp. Saf. Secur. 2017, 9, 47–66. [Google Scholar] [CrossRef]
- Rusli, R.; Haque, M.M.; Saifuzzaman, M.; King, M. Crash severity along rural mountainous highways in Malaysia: An application of a combined decision tree and logistic regression model. Traffic Inj. Prev. 2018, 19, 741–748. [Google Scholar] [CrossRef] [PubMed]
- Chang, F.; Xu, P.; Zhou, H.; Chan, A.H.S.; Huang, H. Investigating injury severities of motorcycle riders: A two-step method integrating latent class cluster analysis and random parameters logit model. Accid. Anal. Prev. 2019, 131, 316–326. [Google Scholar] [CrossRef]
- Kim, J.-K.; Ulfarsson, G.F.; Shankar, V.N.; Mannering, F.L. A note on modeling pedestrian-injury severity in motor-vehicle crashes with the mixed logit model. Accid. Anal. Prev. 2010, 42, 1751–1758. [Google Scholar] [CrossRef]
- Meng, F.; Xu, P.; Song, C.; Gao, K.; Zhou, Z.; Yang, L. Influential Factors Associated with Consecutive Crash Severity: A Two-Level Logistic Modeling Approach. Int. J. Environ. Res. Public Health 2020, 17, 5623. [Google Scholar] [CrossRef]
- Li, Z.; Liu, P.; Wang, W.; Xu, C. Using support vector machine models for crash injury severity analysis. Accid. Anal. Prev. 2012, 45, 478–486. [Google Scholar] [CrossRef]
- Abdel-Aty, M.A.; Abdelwahab, H.T. Predicting injury severity levels in traffic crashes: A modeling comparison. J. Transp. Eng. 2004, 130, 204–210. [Google Scholar] [CrossRef]
- Tang, J.; Liang, J.; Han, C.; Li, Z.; Huang, H. Crash injury severity analysis using a two-layer Stacking framework. Accid. Anal. Prev. 2019, 122, 226–238. [Google Scholar] [CrossRef]
- Iranitalab, A.; Khattak, A. Comparison of four statistical and machine learning methods for crash severity prediction. Accid. Anal. Prev. 2017, 108, 27–36. [Google Scholar] [CrossRef] [PubMed]
- Sameen, M.I.; Pradhan, B. Severity prediction of traffic accidents with recurrent neural networks. Appl. Sci. 2017, 7, 476. [Google Scholar] [CrossRef] [Green Version]
- Pradhan, B.; Sameen, M.I. Predicting injury severity of road traffic accidents using a hybrid extreme gradient boosting and deep neural network approach. In Laser Scanning Systems in Highway and Safety Assessment; Springer: Berlin/Heidelberg, Germany, 2020; pp. 119–127. [Google Scholar]
- Sarkar, S.; Pramanik, A.; Maiti, J.; Reniers, G. Predicting and analyzing injury severity: A machine learning-based approach using class-imbalanced proactive and reactive data. Saf. Sci. 2020, 125, 104616. [Google Scholar] [CrossRef]
- Abdelwahab, H.T.; Abdel-Aty, M.A. Development of Artificial Neural Network Models to Predict Driver Injury Severity in Traffic Accidents at Signalized Intersections. Transp. Res. Rec. 2001, 1746, 6–13. [Google Scholar] [CrossRef]
- Zeng, Q.; Huang, H. A stable and optimized neural network model for crash injury severity prediction. Accid. Anal. Prev. 2014, 73, 351–358. [Google Scholar] [CrossRef] [PubMed]
- Amiri, A.M.; Sadri, A.; Nadimi, N.; Shams, M. A comparison between artificial neural network and hybrid intelligent genetic algorithm in predicting the severity of fixed object crashes among elderly drivers. Accid. Anal. Prev. 2020, 138, 105468. [Google Scholar] [CrossRef]
- Zhang, J.; Li, Z.; Pu, Z.; Xu, C. Comparing prediction performance for crash injury severity among various machine learning and statistical methods. IEEE Access 2018, 6, 60079–60087. [Google Scholar] [CrossRef]
- Mondal, A.R.; Bhuiyan, M.A.E.; Yang, F. Advancement of weather-related crash prediction model using nonparametric machine learning algorithms. SN Appl. Sci. 2020, 2, 1–11. [Google Scholar] [CrossRef]
- Dong, N.; Huang, H.; Zheng, L. Support vector machine in crash prediction at the level of traffic analysis zones: Assessing the spatial proximity effects. Accid. Anal. Prev. 2015, 82, 192–198. [Google Scholar] [CrossRef]
- Mokhtarimousavi, S.; Anderson, J.C.; Azizinamini, A.; Hadi, M. Improved support vector machine models for work zone crash injury severity prediction and analysis. Transp. Res. Rec. 2019, 2673, 680–692. [Google Scholar] [CrossRef]
- Chen, C.; Zhang, G.; Yang, J.; Milton, J.C. An explanatory analysis of driver injury severity in rear-end crashes using a decision table/Naïve Bayes (DTNB) hybrid classifier. Accid. Anal. Prev. 2016, 90, 95–107. [Google Scholar] [CrossRef] [PubMed]
- Arhin, S.A.; Gatiba, A. Predicting crash injury severity at unsignalized intersections using support vector machines and naïve Bayes classifiers. Transp. Saf. Environ. 2020, 2, 120–132. [Google Scholar] [CrossRef]
- Budiawan, W.; Saptadi, S.; Tjioe, C.; Phommachak, T. Traffic Accident Severity Prediction Using Naive Bayes Algorithm-A Case Study of Semarang Toll Road. In Proceedings of the Annual Conference on Industrial and System Engineering (ACISE), Semarang, Central Java, Indonesia, 23–24 April 2019; Volume 598, p. 012089. [Google Scholar]
- Anderson, T.K. Kernel density estimation and K-means clustering to profile road accident hotspots. Accid. Anal. Prev. 2009, 41, 359–364. [Google Scholar] [CrossRef] [PubMed]
- Mauro, R.; De Luca, M.; Dell’Acqua, G. Using a k-means clustering algorithm to examine patterns of vehicle crashes in before-after analysis. Mod. Appl. Sci. 2013, 7, 11. [Google Scholar] [CrossRef] [Green Version]
- Fiorentini, N.; Losa, M. Handling Imbalanced data in road crash severity prediction by machine learning algorithms. Infrastructures 2020, 5, 61. [Google Scholar] [CrossRef]
- Abellán, J.; López, G.; de Oña, J. Analysis of traffic accident severity using decision rules via decision trees. Expert Syst. Appl. 2013, 40, 6047–6054. [Google Scholar] [CrossRef] [Green Version]
- de Oña, J.; López, G.; Abellán, J. Extracting decision rules from police accident reports through decision trees. Accid. Anal. Prev. 2013, 50, 1151–1160. [Google Scholar] [CrossRef] [PubMed] [Green Version]
- Lu, P.; Zheng, Z.; Ren, Y.; Zhou, X.; Keramati, A.; Tolliver, D.; Huang, Y. A gradient boosting crash prediction approach for highway-rail grade crossing crash analysis. J. Adv. Transp. 2020, 2020. [Google Scholar] [CrossRef]
- Delen, D.; Sharda, R.; Bessonov, M. Identifying significant predictors of injury severity in traffic accidents using a series of artificial neural networks. Accid. Anal. Prev. 2006, 38, 434–444. [Google Scholar] [CrossRef]
- Alkheder, S.; Taamneh, M.; Taamneh, S. Severity prediction of traffic accident using an artificial neural network: Traffic accident severity prediction using artificial neural network. J. Forecast. 2017, 36, 100–108. [Google Scholar] [CrossRef]
- Taamneh, S.; Taamneh, M. Evaluation of the performance of random forests technique in predicting the severity of road traffic accidents. In Advances in Human Aspects of Transportation; Neville Stanton, Ed.; Springer: Berlin/Heidelberg, Germany, 2018; pp. 840–847. [Google Scholar]
- Wang, W.; Liu, C.; Chen, D. Predicting driver injury severity in freeway rear-end crashes by support vector machine. In Proceedings of the 2011 International Conference on Transportation, Mechanical, and Electrical Engineering (TMEE), ChangChun, China, 16–18 December 2011; pp. 1800–1803. [Google Scholar]
- AlMamlook, R.E.; Kwayu, K.M.; Alkasisbeh, M.R.; Frefer, A.A. Comparison of machine learning algorithms for predicting traffic accident severity. In Proceedings of the 2019 IEEE Jordan International Joint Conference on Electrical Engineering and Information Technology (JEEIT), Amman, Jordan, 9–11 April 2019; pp. 272–276. [Google Scholar]
- Bernard, J.M. An Application of decision tree models to examine motor vehicle crash severity outcomes. J. Transp. Res. Forum 2017, 56, 73–91. [Google Scholar] [CrossRef]
- Delen, D.; Tomak, L.; Topuz, K.; Eryarsoy, E. Investigating injury severity risk factors in automobile crashes with predictive analytics and sensitivity analysis methods. J. Transp. Health 2017, 4, 118–131. [Google Scholar] [CrossRef]
- Rojas, R. Neural Networks: A Systematic Introduction; Springer Science & Business Media: Berlin/Heidelberg, Germany, 2013. [Google Scholar]
- Theofilatos, A.; Yannis, G. A review of the effect of traffic and weather characteristics on road safety. Accid. Anal. Prev. 2014, 72, 244–256. [Google Scholar] [CrossRef] [PubMed]
- Kanellaidis, G.; Vardaki, S. Highway geometric design from the perspective of recent safety developments. J. Transp. Eng. 2011, 137, 841–844. [Google Scholar] [CrossRef]
- Khattak, A.J. Injury severity in multivehicle rear-end crashes. Transp. Res. Rec. 2001, 1746, 59–68. [Google Scholar] [CrossRef]
- Islam, S.; Jones, S.L.; Dye, D. Comprehensive analysis of single-and multi-vehicle large truck at-fault crashes on rural and urban roadways in Alabama. Accid. Anal. Prev. 2014, 67, 148–158. [Google Scholar] [CrossRef] [PubMed]
- Lee, C.; Li, X. Predicting driver injury severity in single-vehicle and two-vehicle crashes with boosted regression trees. Transp. Res. Rec. 2015, 2514, 138–148. [Google Scholar] [CrossRef]
- Liu, P.; Fan, W. Exploring injury severity in head-on crashes using latent class clustering analysis and mixed logit model: A case study of North Carolina. Accid. Anal. Prev. 2020, 135, 105388. [Google Scholar] [CrossRef]
- Hermans, E.; Brijs, T.; Stiers, T.; Offermans, C. The impact of weather conditions on road safety investigated on an hourly basis. In Proceedings of the 85th Annual Meeting of the Transportation Research Board, Washington, DC, USA, 22–26 January 2006. [Google Scholar]
- Qiu, L.; Nixon, W.A. Effects of adverse weather on traffic crashes: Systematic review and meta-analysis. Transp. Res. Rec. 2008, 2055, 139–146. [Google Scholar] [CrossRef]
- Jung, S.; Qin, X.; Noyce, D.A. Injury severity of multivehicle crash in rainy weather. J. Transp. Eng. 2012, 138, 50–59. [Google Scholar] [CrossRef] [Green Version]
- Ma, Z.; Zhao, W.; Steven, I.; Chien, J.; Dong, C. Exploring factors contributing to crash injury severity on rural two-lane highways. J. Saf. Res. 2015, 55, 171–176. [Google Scholar] [CrossRef] [PubMed]
- Ghasemzadeh, A.; Ahmed, M.M. Exploring factors contributing to injury severity at work zones considering adverse weather conditions. IATSS Res. 2019, 43, 131–138. [Google Scholar] [CrossRef]
- Razi-Ardakani, H.; Mahmoudzadeh, A.; Kermanshah, M. What factors results in having a severe crash? A closer look on distraction-related factors. Cogent Eng. 2019, 6, 1708652. [Google Scholar] [CrossRef]
- Zahid, M.; Chen, Y.; Khan, S.; Jamal, A.; Ijaz, M.; Ahmed, T. Predicting risky and aggressive driving behavior among taxi drivers: Do spatio-temporal attributes matter? Int. J. Environ. Res. Public Health 2020, 17, 3937. [Google Scholar] [CrossRef] [PubMed]
- Martensen, H.; Dupont, E. Comparing single vehicle and multivehicle fatal road crashes: A joint analysis of road conditions, time variables and driver characteristics. Accid. Anal. Prev. 2013, 60, 466–471. [Google Scholar] [CrossRef] [PubMed]
- Chang, L.-Y.; Mannering, F. Analysis of injury severity and vehicle occupancy in truck-and non-truck-involved accidents. Accid. Anal. Prev. 1999, 31, 579–592. [Google Scholar] [CrossRef]
- Donnell, E.T.; Mason, J.M., Jr. Predicting the severity of median-related crashes in Pennsylvania by using logistic regression. Transp. Res. Rec. 2004, 1897, 55–63. [Google Scholar] [CrossRef]
- Hong, J.; Tamakloe, R.; Park, D. A comprehensive analysis of multi-vehicle crashes on expressways: A double hurdle approach. Sustainability 2019, 11, 2782. [Google Scholar] [CrossRef] [Green Version]
- Wang, X.; Feng, M. Freeway single and multi-vehicle crash safety analysis: Influencing factors and hotspots. Accid. Anal. Prev. 2019, 132, 105268. [Google Scholar] [CrossRef]
- Viklund, Å.; Björnstig, J.; Larsson, M.; Björnstig, U. Car crash fatalities associated with fire in Sweden. Traffic Inj. Prev. 2013, 14, 823–827. [Google Scholar] [CrossRef] [Green Version]
- Park, S.-H.; Bae, M.-K. Exploring the determinants of the severity of pedestrian injuries by pedestrian age: A case study of Daegu Metropolitan City, South Korea. Int. J. Environ. Res. Public Health 2020, 17, 2358. [Google Scholar] [CrossRef] [Green Version]
- Uddin, M.; Ahmed, F. Pedestrian injury severity analysis in motor vehicle crashes in Ohio. Safety 2018, 4, 20. [Google Scholar] [CrossRef] [Green Version]
- Angel, A.; Hickman, M. Analysis of the factors affecting the severity of two-vehicle crashes. Ingeniería y Desarrollo 2008, 176–194. [Google Scholar]
- Høye, A. Speeding and impaired driving in fatal crashes—Results from in-depth investigations. Traffic Inj. Prev. 2020, 21, 1–6. [Google Scholar] [CrossRef] [PubMed]
- Ackaah, W.; Adonteng, D.O. Analysis of fatal road traffic crashes in Ghana. Int. J. Inj. Control Saf. Promot. 2011, 18, 21–27. [Google Scholar] [CrossRef] [PubMed]
- Sasidharan, L.; Wu, K.-F.; Menendez, M. Exploring the application of latent class cluster analysis for investigating pedestrian crash injury severities in Switzerland. Accid. Anal. Prev. 2015, 85, 219–228. [Google Scholar] [CrossRef]
- Mannering, F.L.; Shankar, V.; Bhat, C.R. Unobserved heterogeneity and the statistical analysis of highway accident data. Anal. Methods Accid. Res. 2016, 11, 1–16. [Google Scholar] [CrossRef]
Figure 1.
Locations of crashes in the study area.

Figure 2.
Artificial neural network (ANN) architecture adopted in this study.

Figure 3.
Effect of highway type on crash severity.

Figure 4.
Effect of number of lanes in each direction on crash severity.

Figure 5.
Effect of weather characteristics on crash severity.

Figure 6.
Effect of vehicle characteristics in crash severity.

Figure 7.
Effect of the number of vehicles involved in crash severity.

Figure 8.
Effect of crash characteristics on crash severity.

Figure 9.
Effect of on-site damage condition on crash severity.

Figure 10.
Effect of traffic characteristics on crash severity.


Table 1.
Descriptive statistics of variables.
| Variable Description | Variable Type | Categories | Frequency | Percent (%) |
|---|---|---|---|---|
| Dependent Variable | ||||
| Crash Injury Severity | Nominal | Fatal Injury | 881 | 7 |
| Nominal | Non-Fatal Injury | 11,685 | 93 | |
| Explanatory Variables | ||||
| Temporal Features | ||||
| Time of crash | Nominal | Peak | 7087 | 56.40 |
| Nominal | Off-peak | 5479 | 43.60 | |
| Day | Nominal | Weekday | 9011 | 71.71 |
| Nominal | Weekend | 3555 | 28.29 | |
| Season | Nominal | Winter | 2754 | 21.92 |
| Nominal | Spring | 1982 | 15.77 | |
| Nominal | Summer | 5313 | 42.28 | |
| Nominal | Autumn | 2517 | 20.03 | |
| Environmental Features | ||||
| Lighting Condition | Nominal | Day | 7601 | 60.49 |
| Nominal | Night | 4965 | 39.51 | |
| Weather | Nominal | Clear | 11,003 | 87.56 |
| Nominal | Rain | 519 | 4.13 | |
| Nominal | Cloudy | 234 | 1.86 | |
| Nominal | Sand storm | 364 | 2.90 | |
| Nominal | others | 446 | 3.55 | |
| Roadway Features | ||||
| Highway Type | Nominal | Divided Highway | 2815 | 22.40 |
| Nominal | Expressway | 9500 | 75.60 | |
| Nominal | Single Highway | 251 | 2.0 | |
| Alignment Type | Nominal | Tangent | 8082 | 64.32 |
| Nominal | Horizontal curve | 503 | 4.0 | |
| Nominal | Vertical curve | 205 | 1.63 | |
| Nominal | Near intersection | 132 | 1.05 | |
| Nominal | others | 3644 | 29.0 | |
| Surface Conditions | Nominal | Good | 7107 | 56.56 |
| Nominal | Cracks | 1257 | 10.0 | |
| Nominal | Debris | 454 | 3.61 | |
| Nominal | wet | 266 | 2.12 | |
| Nominal | others | 3481 | 27.70 | |
| Damage at Site | Nominal | Fence damaged | 2615 | 20.81 |
| Nominal | Barrier damaged | 1272 | 10.12 | |
| Nominal | Pole damaged | 498 | 3.96 | |
| Nominal | Signpost damaged | 307 | 2.44 | |
| Nominal | others | 7875 | 62.67 | |
| Shoulder width (m) | Numeric | Between 2.5–3.0 | 5312 | 42.27 |
| Numeric | Between 3.0–3.5 | 3402 | 27.07 | |
| Numeric | Between 3.5–4.0 | 3853 | 30.66 | |
| Carriageway width (m) | Numeric | <7.5 | 1974 | 15.71 |
| Numeric | between 7.5–11 | 5319 | 42.33 | |
| Numeric | >11 | 5274 | 41.97 | |
| Median width (m) | Numeric | <5 | 1177 | 9.37 |
| Numeric | Between 5–10 | 1061 | 8.44 | |
| Numeric | Between10–15 | 1759 | 14.0 | |
| Numeric | >15 | 8569 | 68.19 | |
| Road Markings | Nominal | Present | 12,264 | 97.60 |
| Nominal | Absent | 302 | 2.40 | |
| Road Cat eyes | Nominal | Present | 12,398 | 98.66 |
| Nominal | Absent | 168 | 1.34 | |
| Traffic Characteristics | ||||
| AADT | Numeric | <2000 (1) | 476 | 3.79 |
| Numeric | Between 2000–5000 (2) | 1282 | 10.20 | |
| Numeric | Between 5000–10000 (3) | 2983 | 23.74 | |
| Numeric | Between 10000–20000 (4) | 7136 | 56.79 | |
| Numeric | >20000 (5) | 687 | 5.47 | |
| Trucks % in ADDT | Numeric | <2% | 607 | 4.83 |
| Numeric | between 2–5% | 993 | 7.90 | |
| Numeric | between 5–10% | 1073 | 8.54 | |
| Numeric | between 10–20% | 6559 | 52.20 | |
| Numeric | between 20–30% | 3335 | 26.54 | |
| Average Speed (kmph) | Numeric | <90 (1) | 529 | 4.21 |
| Numeric | between 90–100 (2) | 2971 | 23.64 | |
| Numeric | between 100–110 (3) | 7467 | 59.42 | |
| Numeric | between 110–120 (4) | 1125 | 8.95 | |
| Numeric | >120 (5) | 474 | 3.78 | |
| Vehicle Features | ||||
| Type of Vehicle at Fault | Nominal | Car | 7516 | 59.81 |
| Nominal | Bus | 940 | 7.49 | |
| Nominal | Small truck | 1250 | 9.95 | |
| Nominal | Big truck | 2104 | 16.74 | |
| Nominal | others | 756 | 6.02 | |
| No. of vehicles involved | Numeric | 1 | 6612 | 52.62 |
| Numeric | 2 | 5518 | 43.91 | |
| Numeric | >2 | 436 | 3.47 | |
| Crash Characteristics | ||||
| Collision Type | Nominal | Automobile Collision | 6512 | 51.82 |
| Nominal | Hit Animal | 174 | 1.39 | |
| Nominal | Hit Pedestrian/ | 58 | 0.46 | |
| Nominal | Rollover | 3158 | 25.13 | |
| Nominal | Run-off the road | 1400 | 11.14 | |
| Nominal | Skidding | 98 | 0.78 | |
| Nominal | Vehicle Burnt | 296 | 2.36 | |
| Nominal | others | 870 | 6.92 | |
| Contributing Circumstance | Nominal | Driver (distractions, fatigue driving, disregard to traffic rules, and TCD) | 9245 | 73.57 |
| Nominal | Animal | 202 | 1.61 | |
| Nominal | Faulty vehicle component | 2120 | 16.87 | |
| Nominal | Poor roadway | 162 | 1.29 | |
| Nominal | others | 837 | 6.66 |
Table 2.
Frequency and percentage distribution by injury severity category.
| Year | Crash Injury Severity | Frequency | Percent (%) |
|---|---|---|---|
| 2017 | Fatal Injury | 256 | 6.63% |
| Non-Fatal Injury | 3603 | 93.37% | |
| Total | 3859 | 100% | |
| 2018 | Fatal Injury | 336 | 6.81% |
| Non-Fatal Injury | 4597 | 93.19% | |
| Total | 4933 | 100% | |
| 2019 | Fatal Injury | 289 | 7.66% |
| Non-Fatal Injury | 3485 | 92.34% | |
| Total | 3774 | 100% |
Table 3.
Confusion matrix for model performance evaluation.
| Actual Severity Class | Predicted Severity Class | Accuracy | Sensitivity | Specificity | |
|---|---|---|---|---|---|
| Fatal | Non-fatal | ||||
| Fatal | 43 (4.3%) | 33 (3.3%) | 77.5% | 56.6% | 79.2% |
| Non-Fatal | 192 (19.2%) | 731 (73.2%) | |||
© 2020 by the authors. Licensee MDPI, Basel, Switzerland. This article is an open access article distributed under the terms and conditions of the Creative Commons Attribution (CC BY) license (http://creativecommons.org/licenses/by/4.0/).
Share and Cite
MDPI and ACS Style
Jamal, A.; Umer, W. Exploring the Injury Severity Risk Factors in Fatal Crashes with Neural Network. Int. J. Environ. Res. Public Health 2020, 17, 7466. https://0-doi-org.brum.beds.ac.uk/10.3390/ijerph17207466
AMA Style
Jamal A, Umer W. Exploring the Injury Severity Risk Factors in Fatal Crashes with Neural Network. International Journal of Environmental Research and Public Health. 2020; 17(20):7466. https://0-doi-org.brum.beds.ac.uk/10.3390/ijerph17207466
Chicago/Turabian StyleJamal, Arshad, and Waleed Umer. 2020. "Exploring the Injury Severity Risk Factors in Fatal Crashes with Neural Network" International Journal of Environmental Research and Public Health 17, no. 20: 7466. https://0-doi-org.brum.beds.ac.uk/10.3390/ijerph17207466
Note that from the first issue of 2016, this journal uses article numbers instead of page numbers. See further details here.