Life Cycle Sustainability Performance Assessment Method for Comparison of Civil Engineering Works Design Concepts: Case Study of a Bridge

 , ,
, ,
Abstract
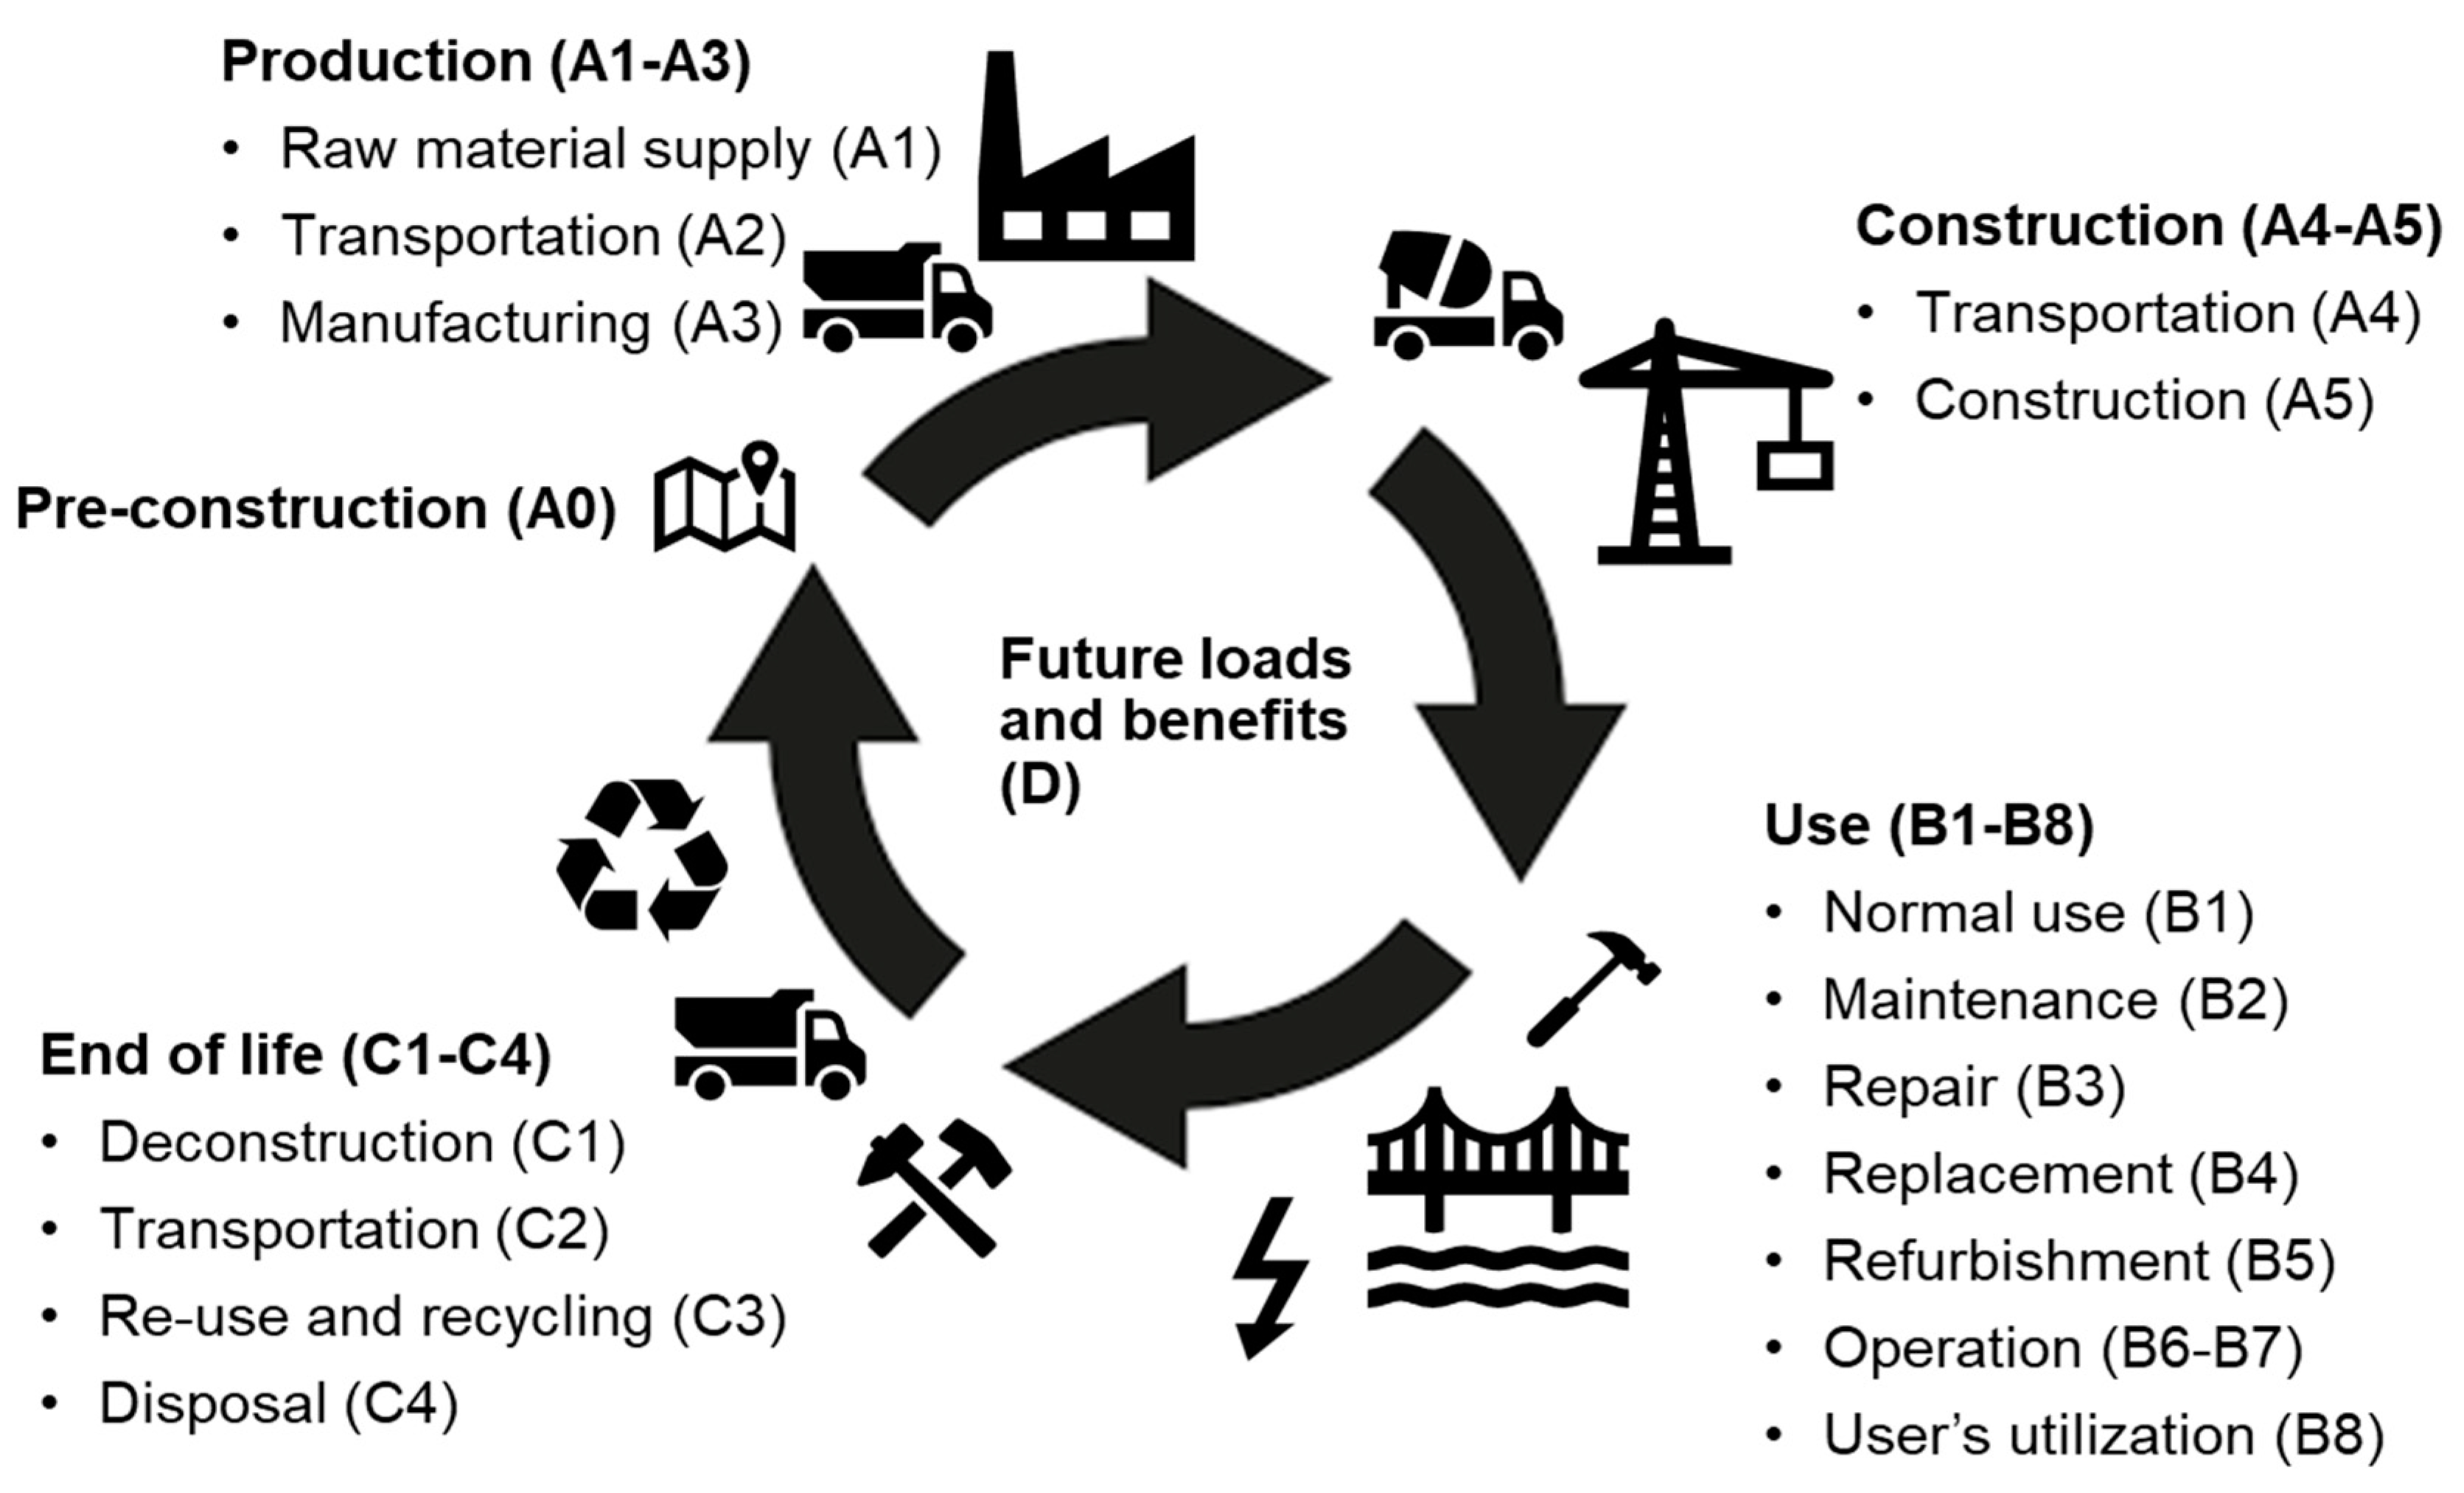
:1. Introduction
2. Materials and Methods
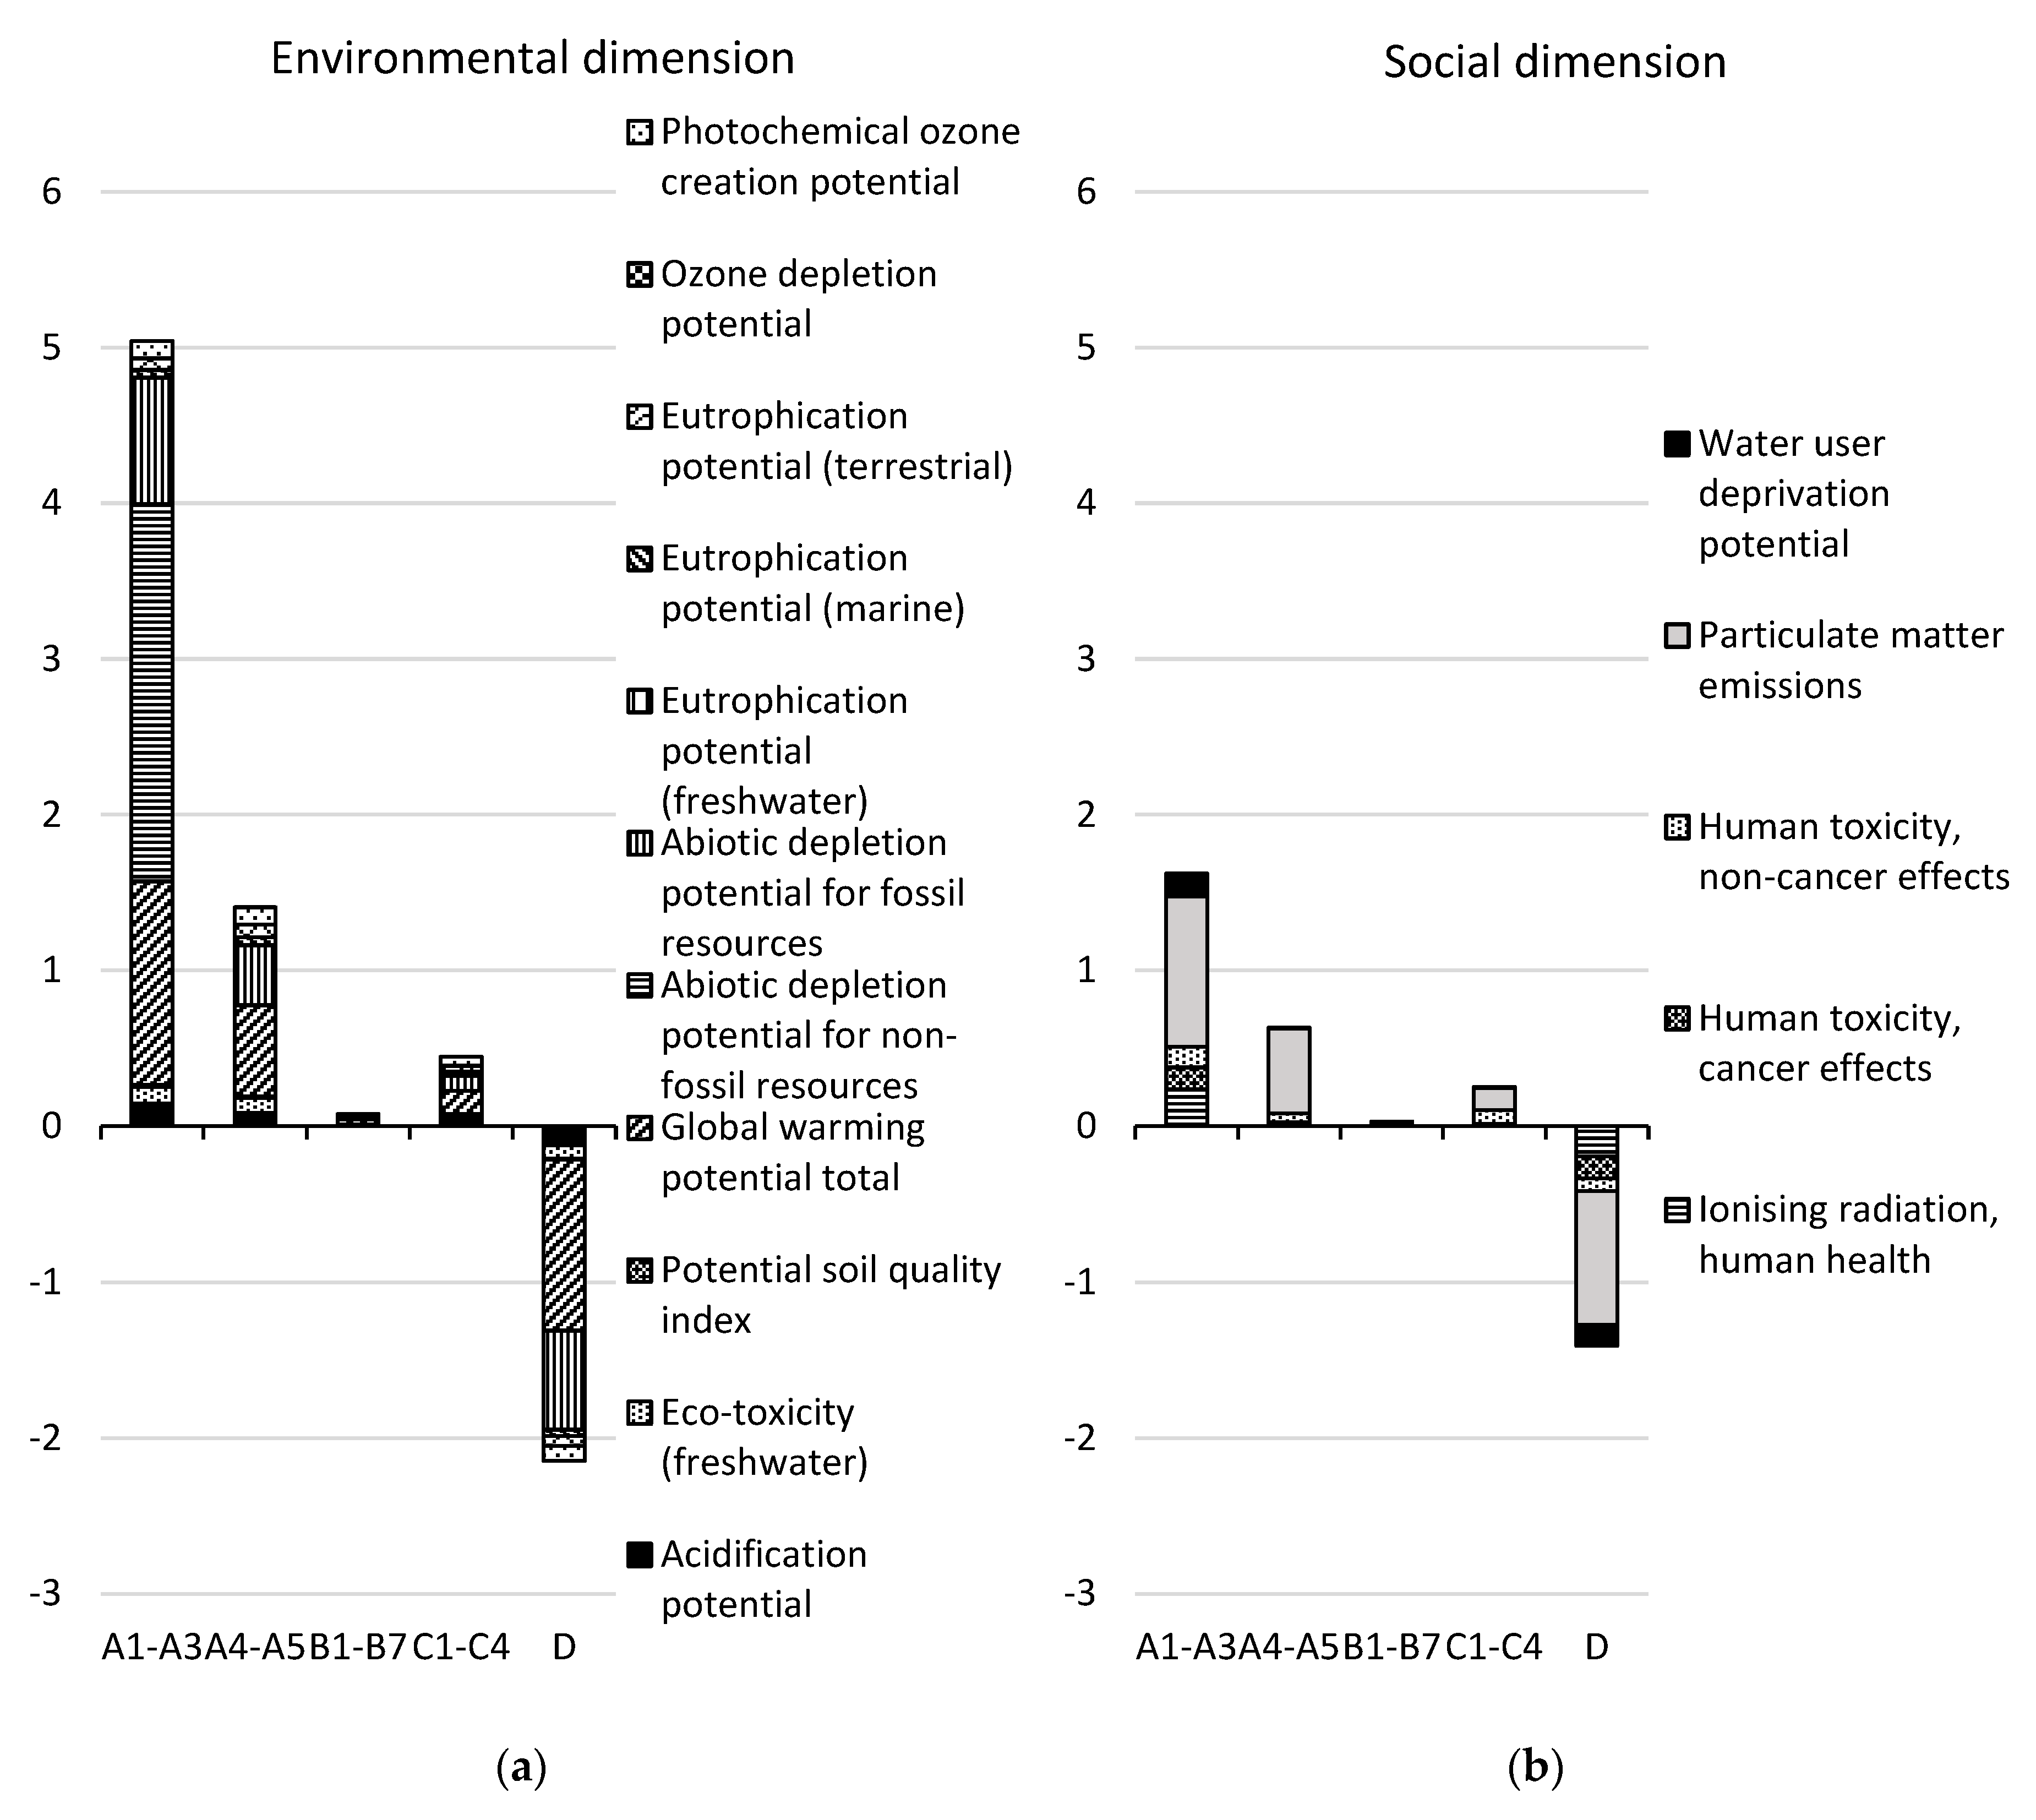
3. Results
3.1. Concrete Slab Frame Bridge Design Concept
3.1.1. Modules A1–A3
3.1.2. Modules A4–A5
3.1.3. Modules B1–B7
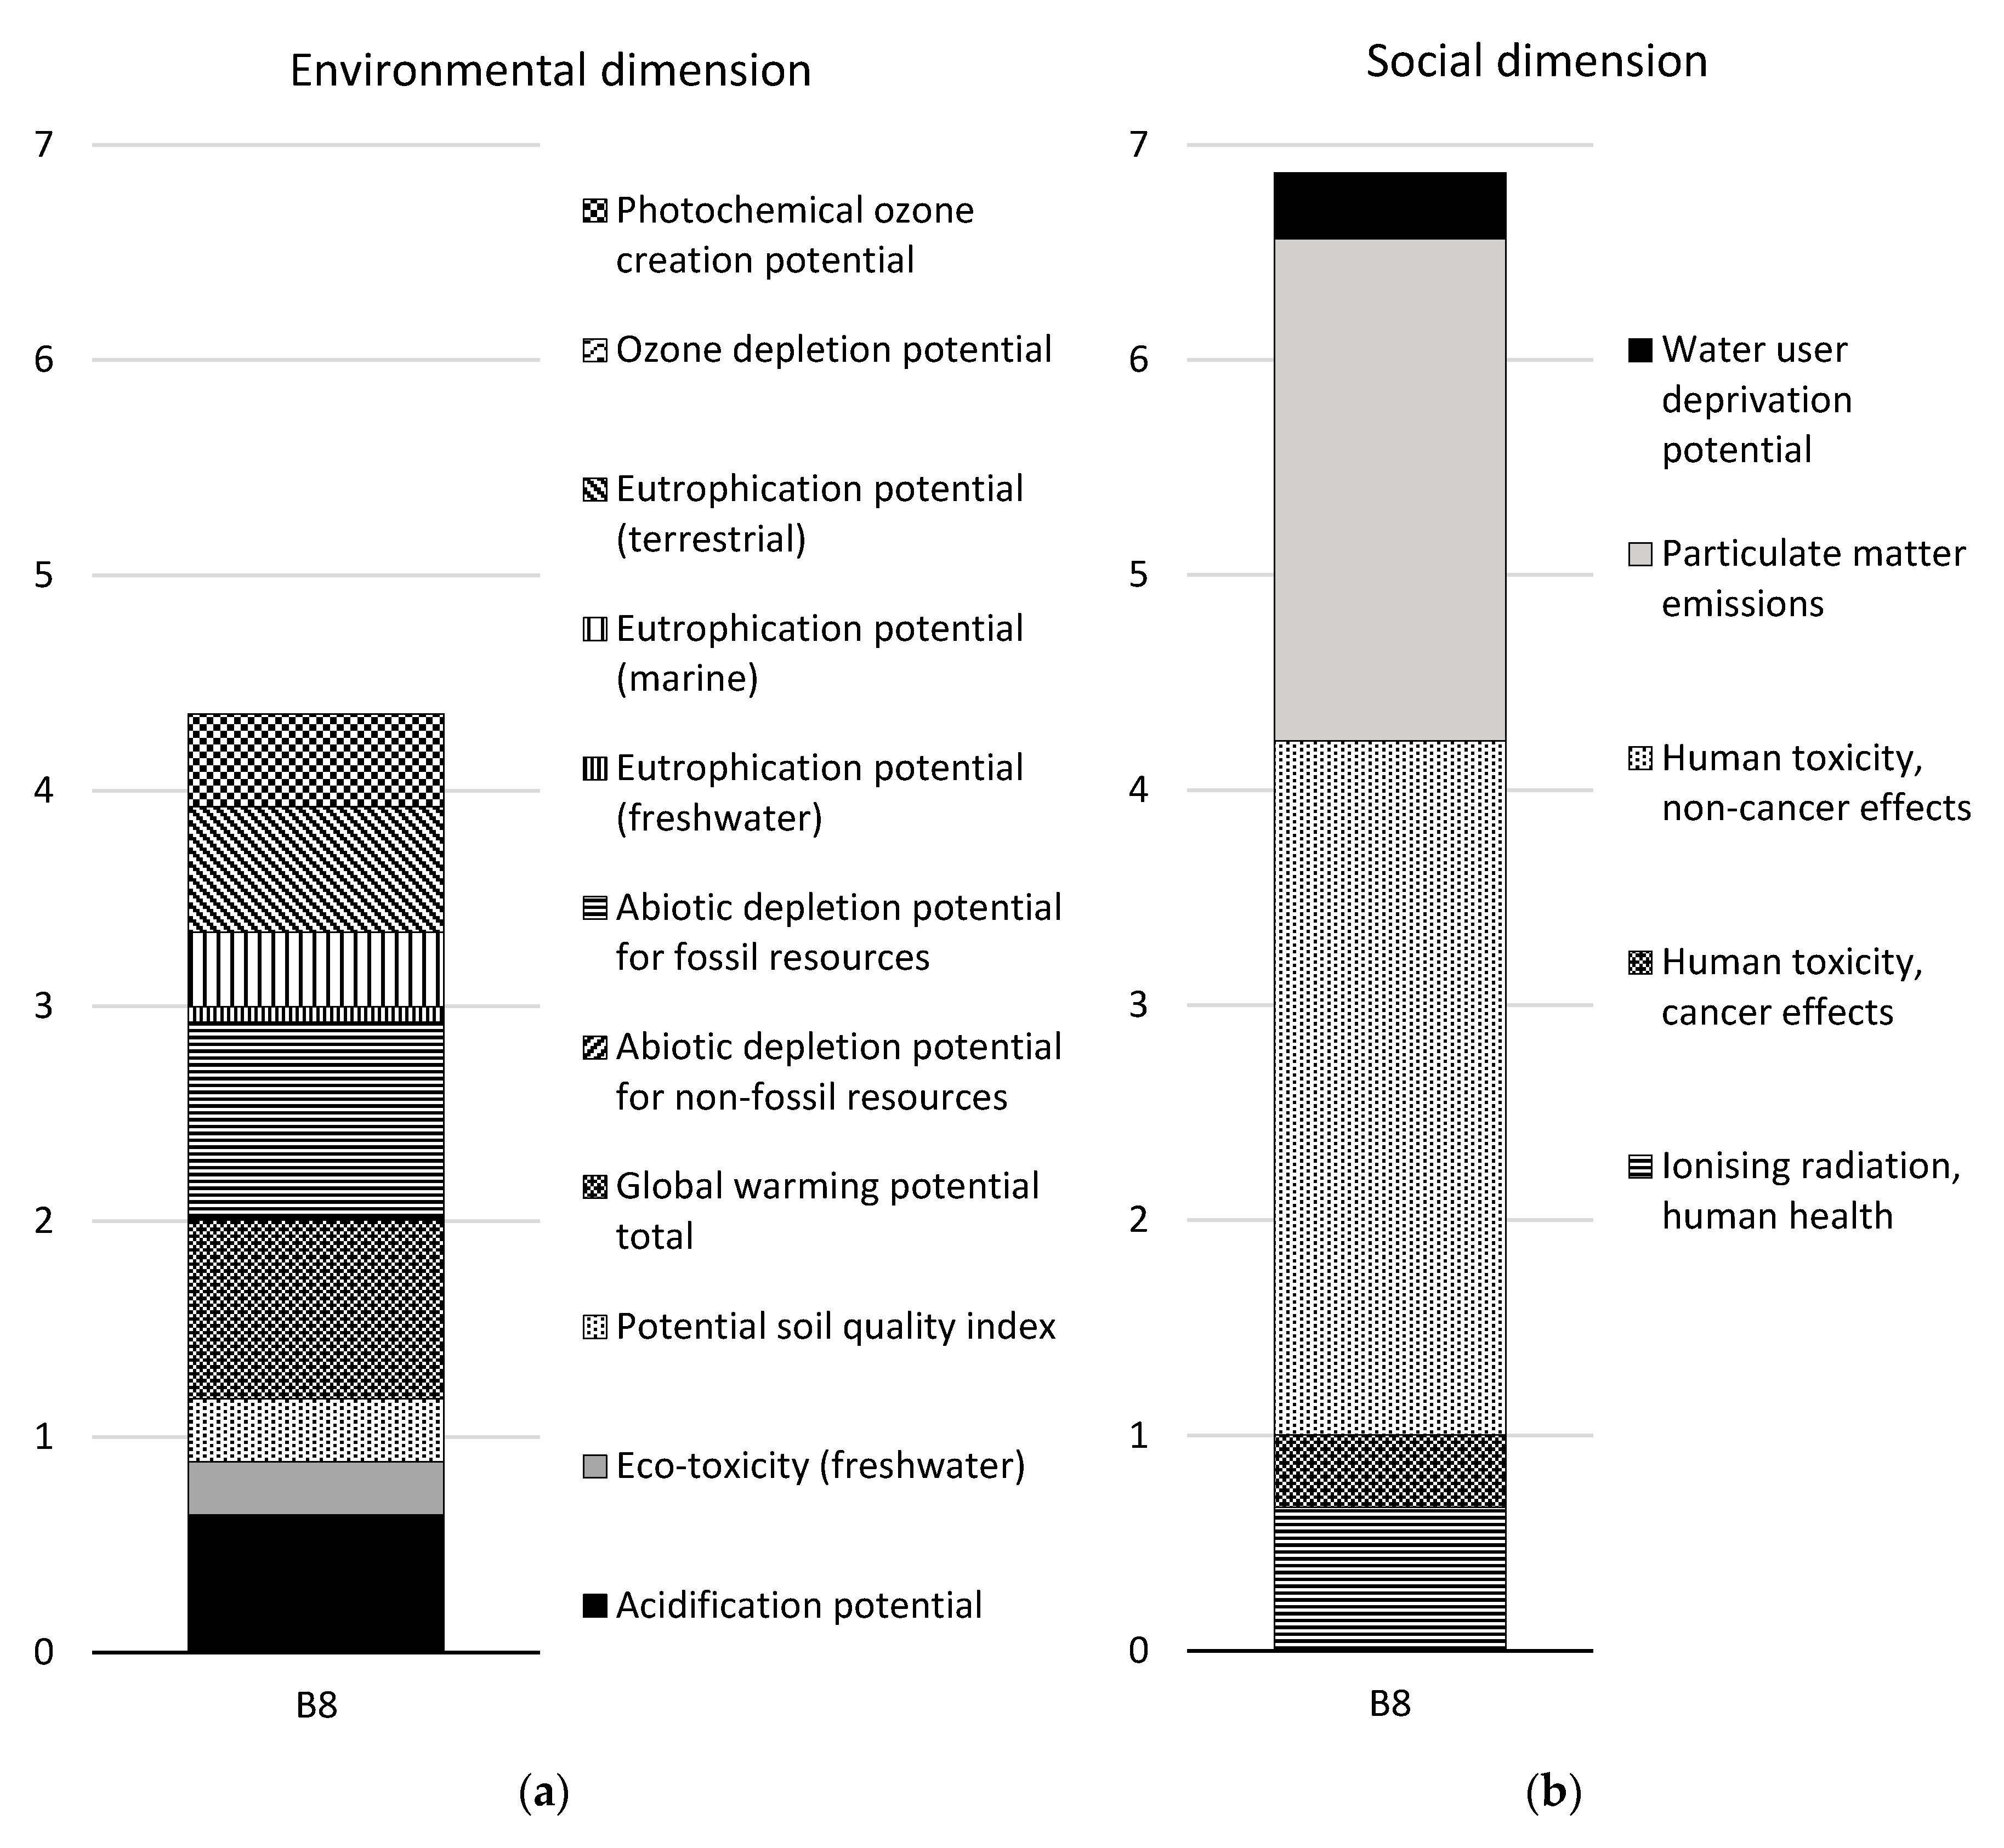
3.1.4. Module B8
3.1.5. Modules C1–C4
3.1.6. Module D
3.2. Soil-Steel Composite Bridge Design Concept
3.2.1. Modules A1–A3
3.2.2. Modules A4–A5
3.2.3. Modules B1–B7
3.2.4. Module B8
3.2.5. Modules C1–C4
3.2.6. Module D
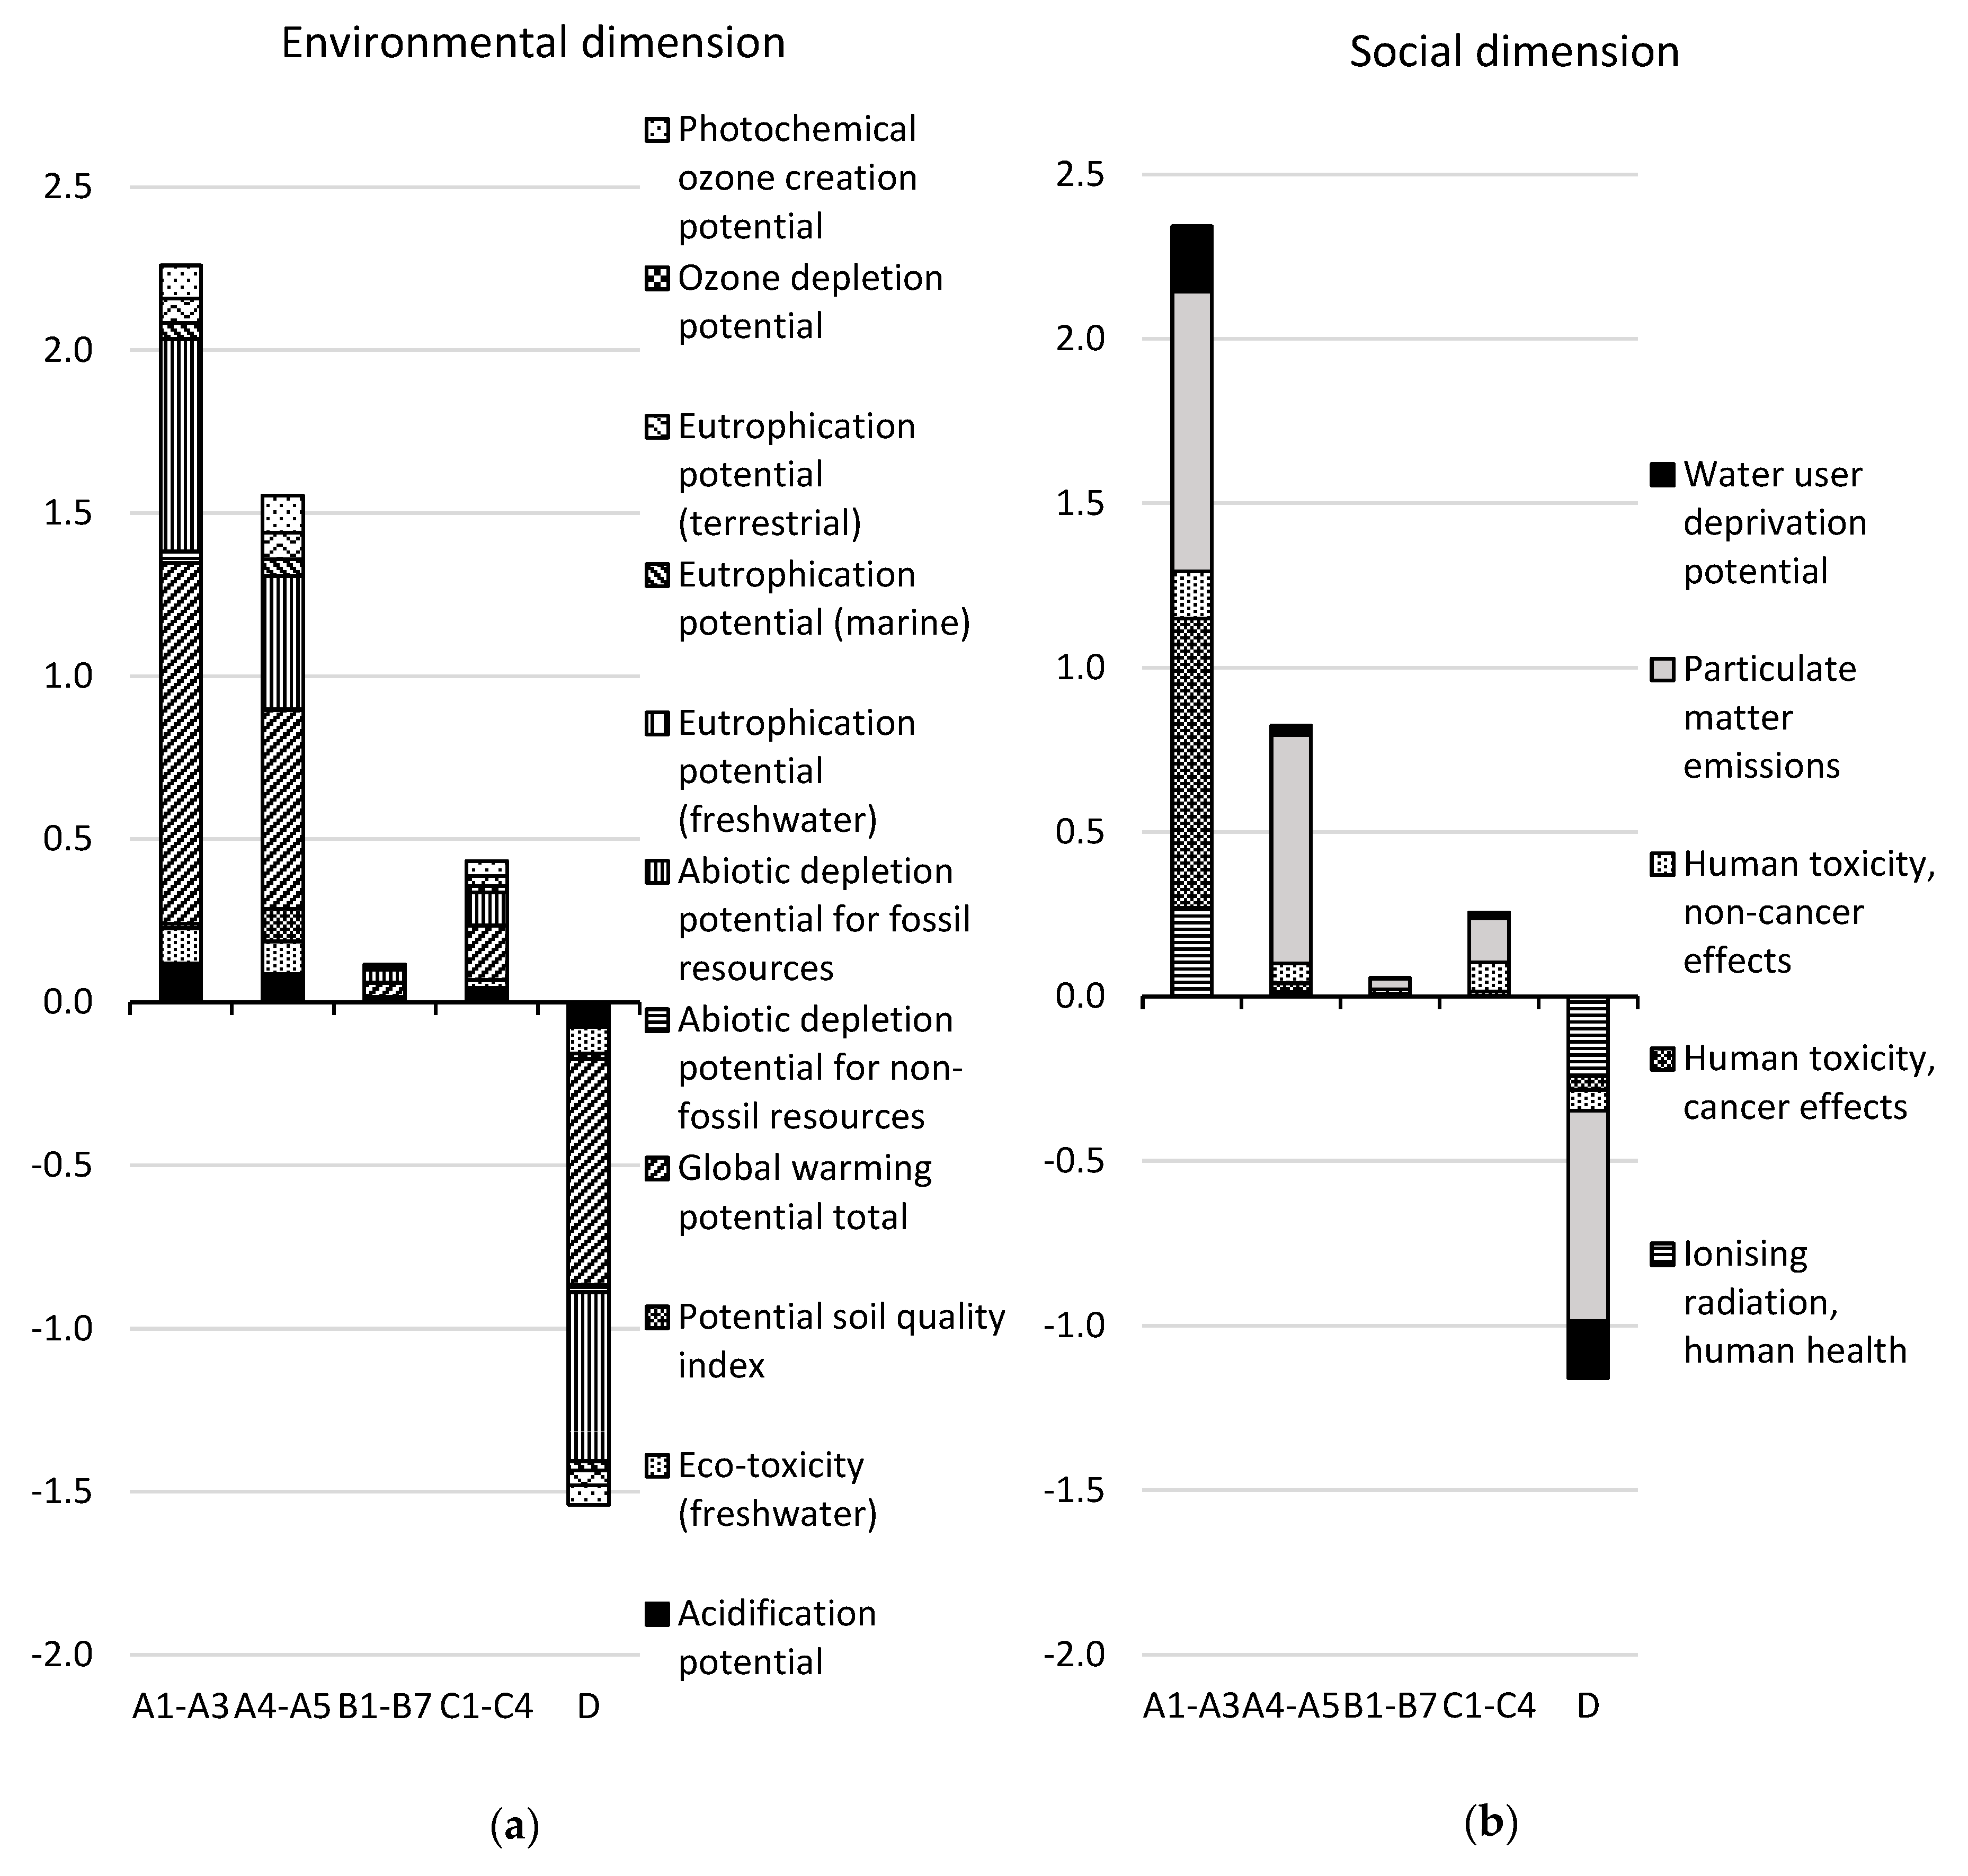
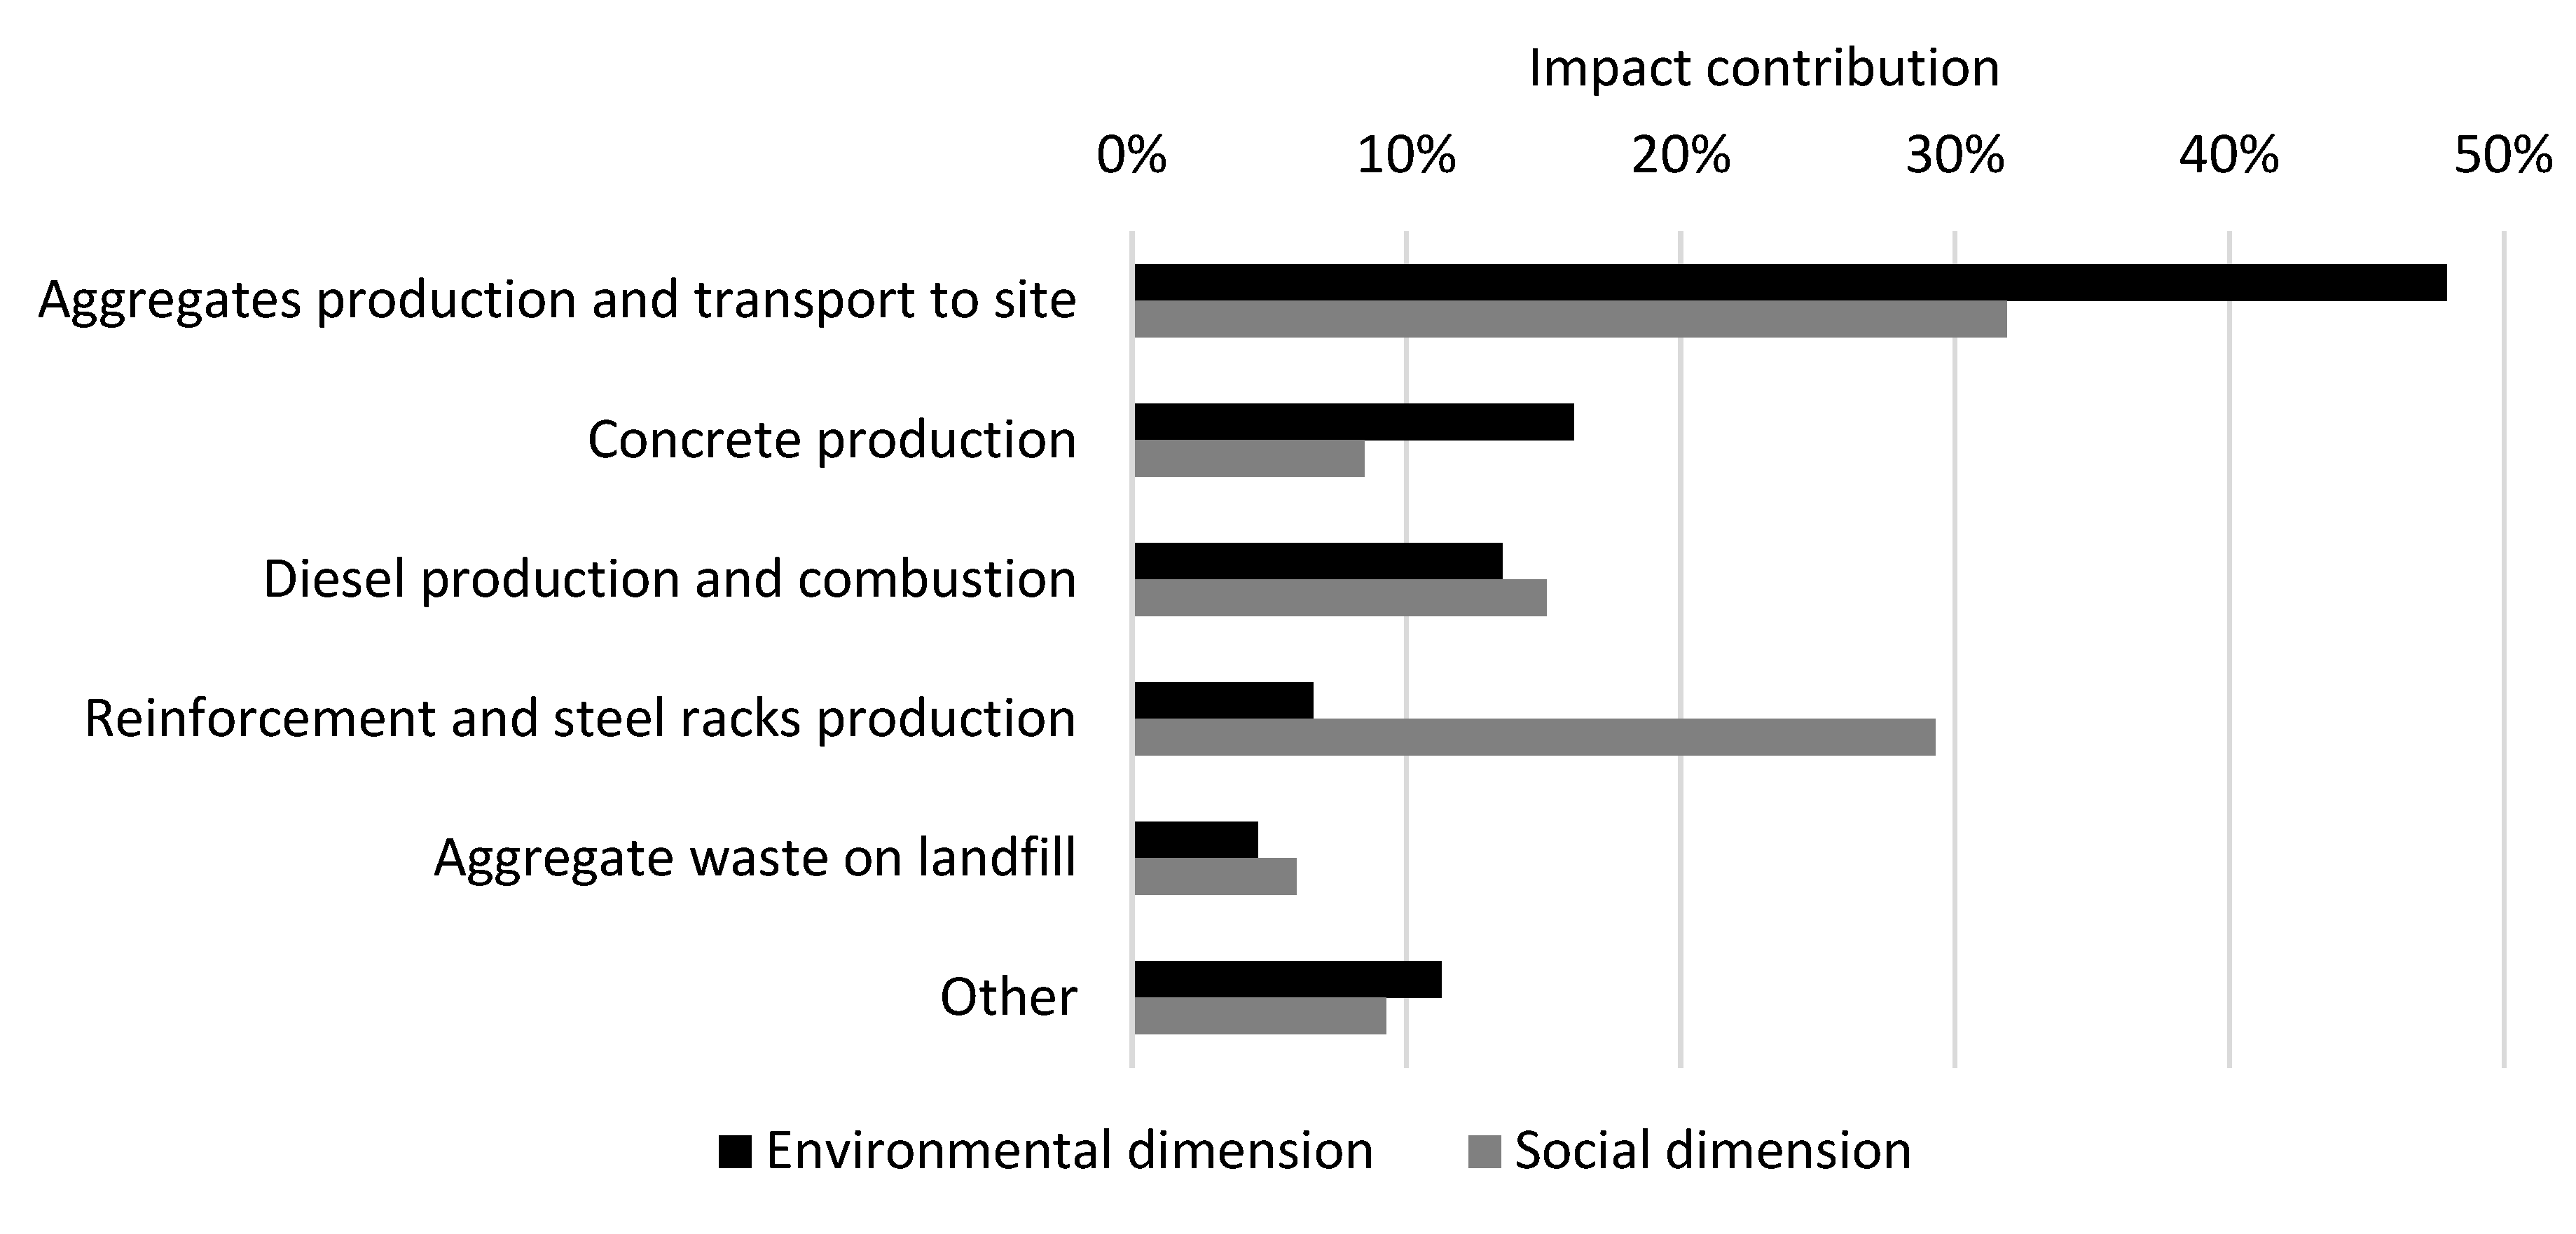
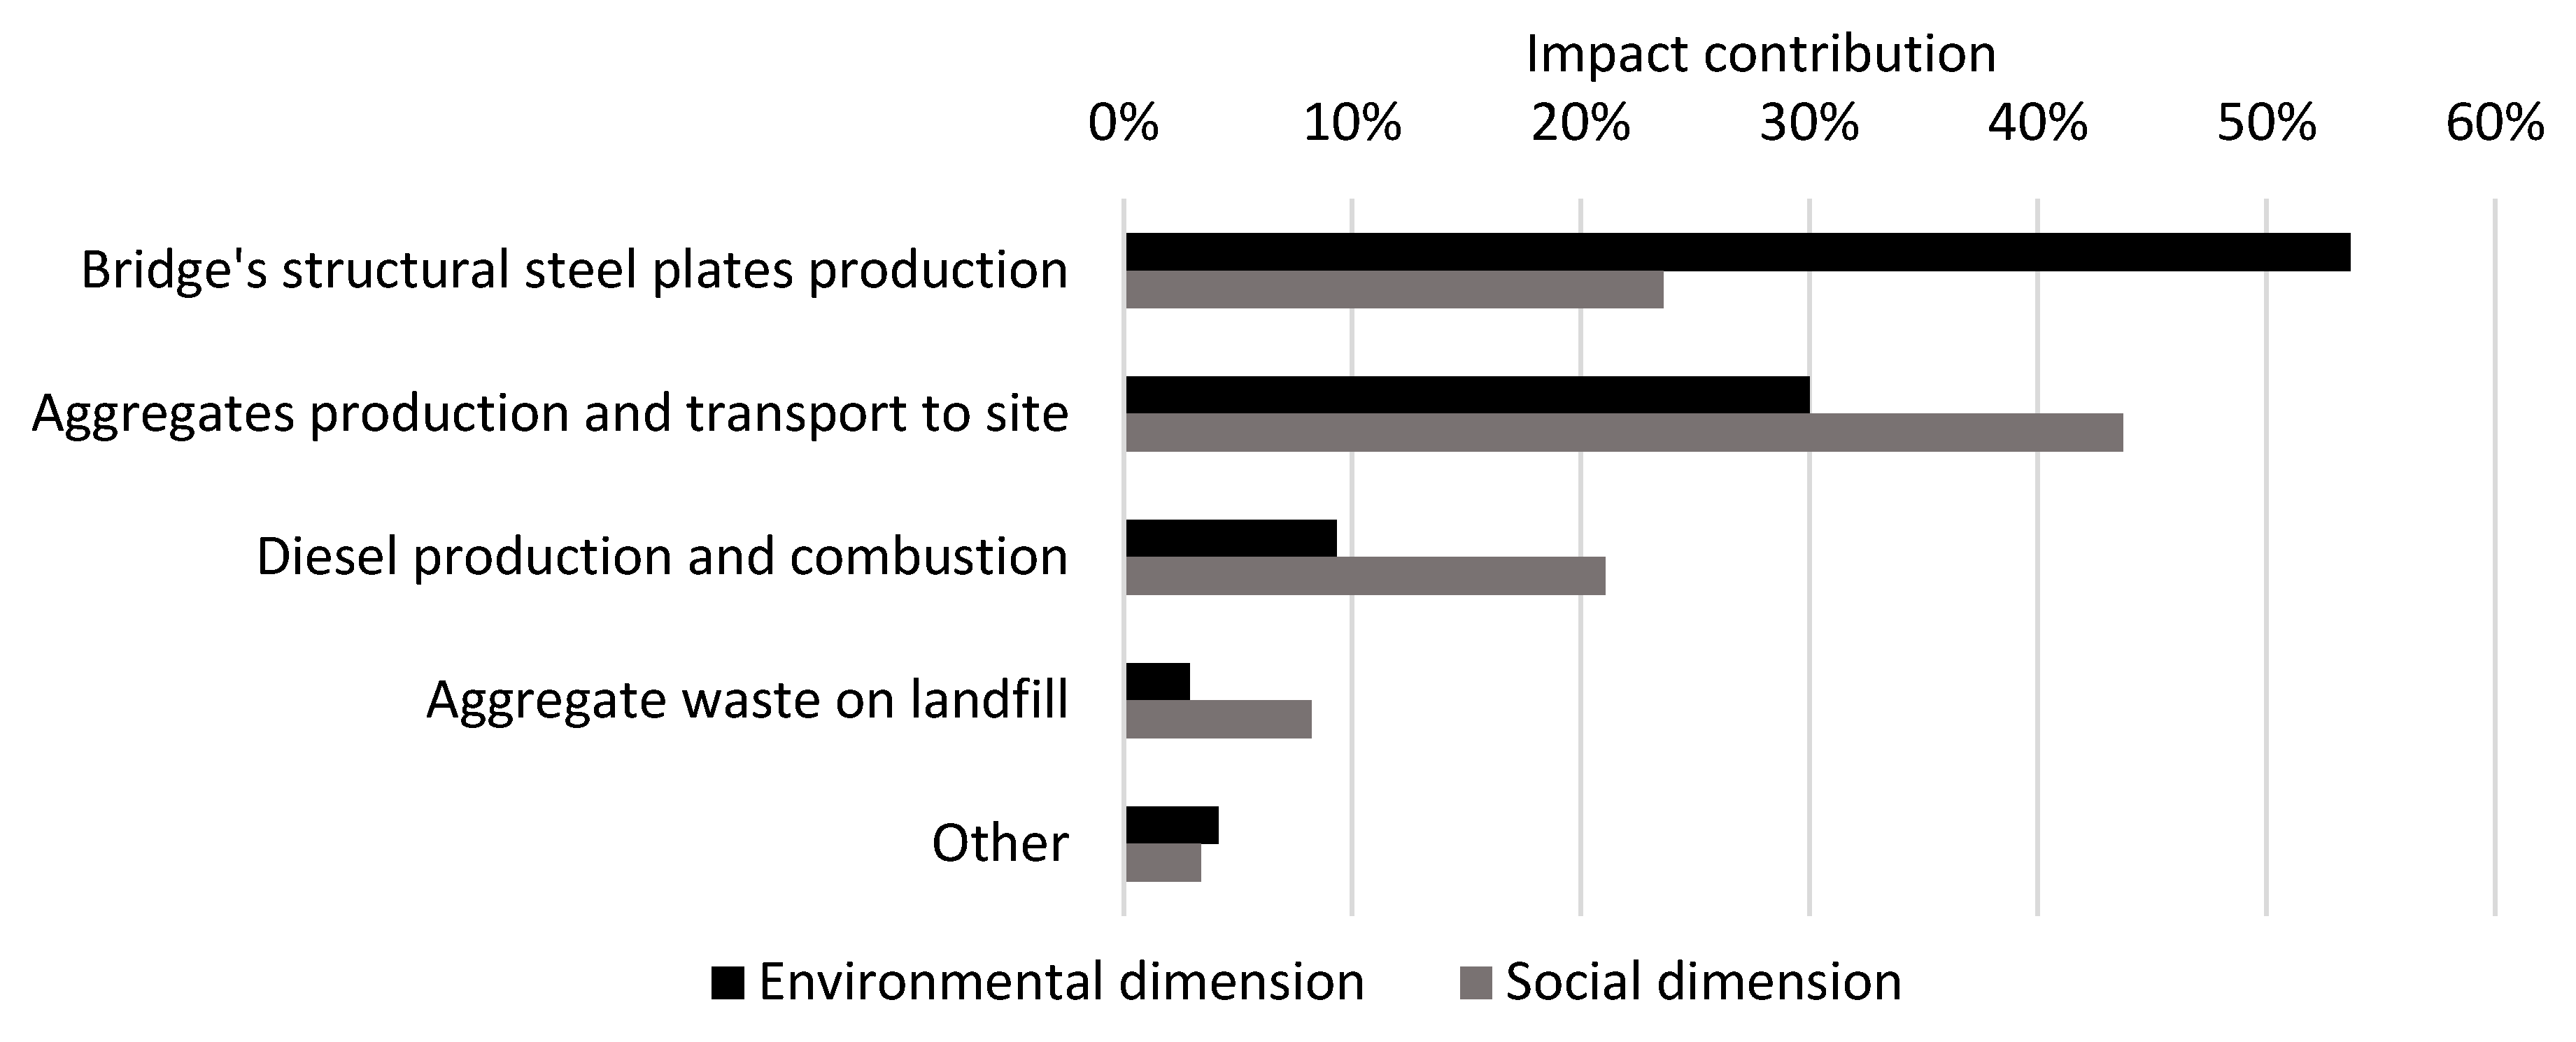
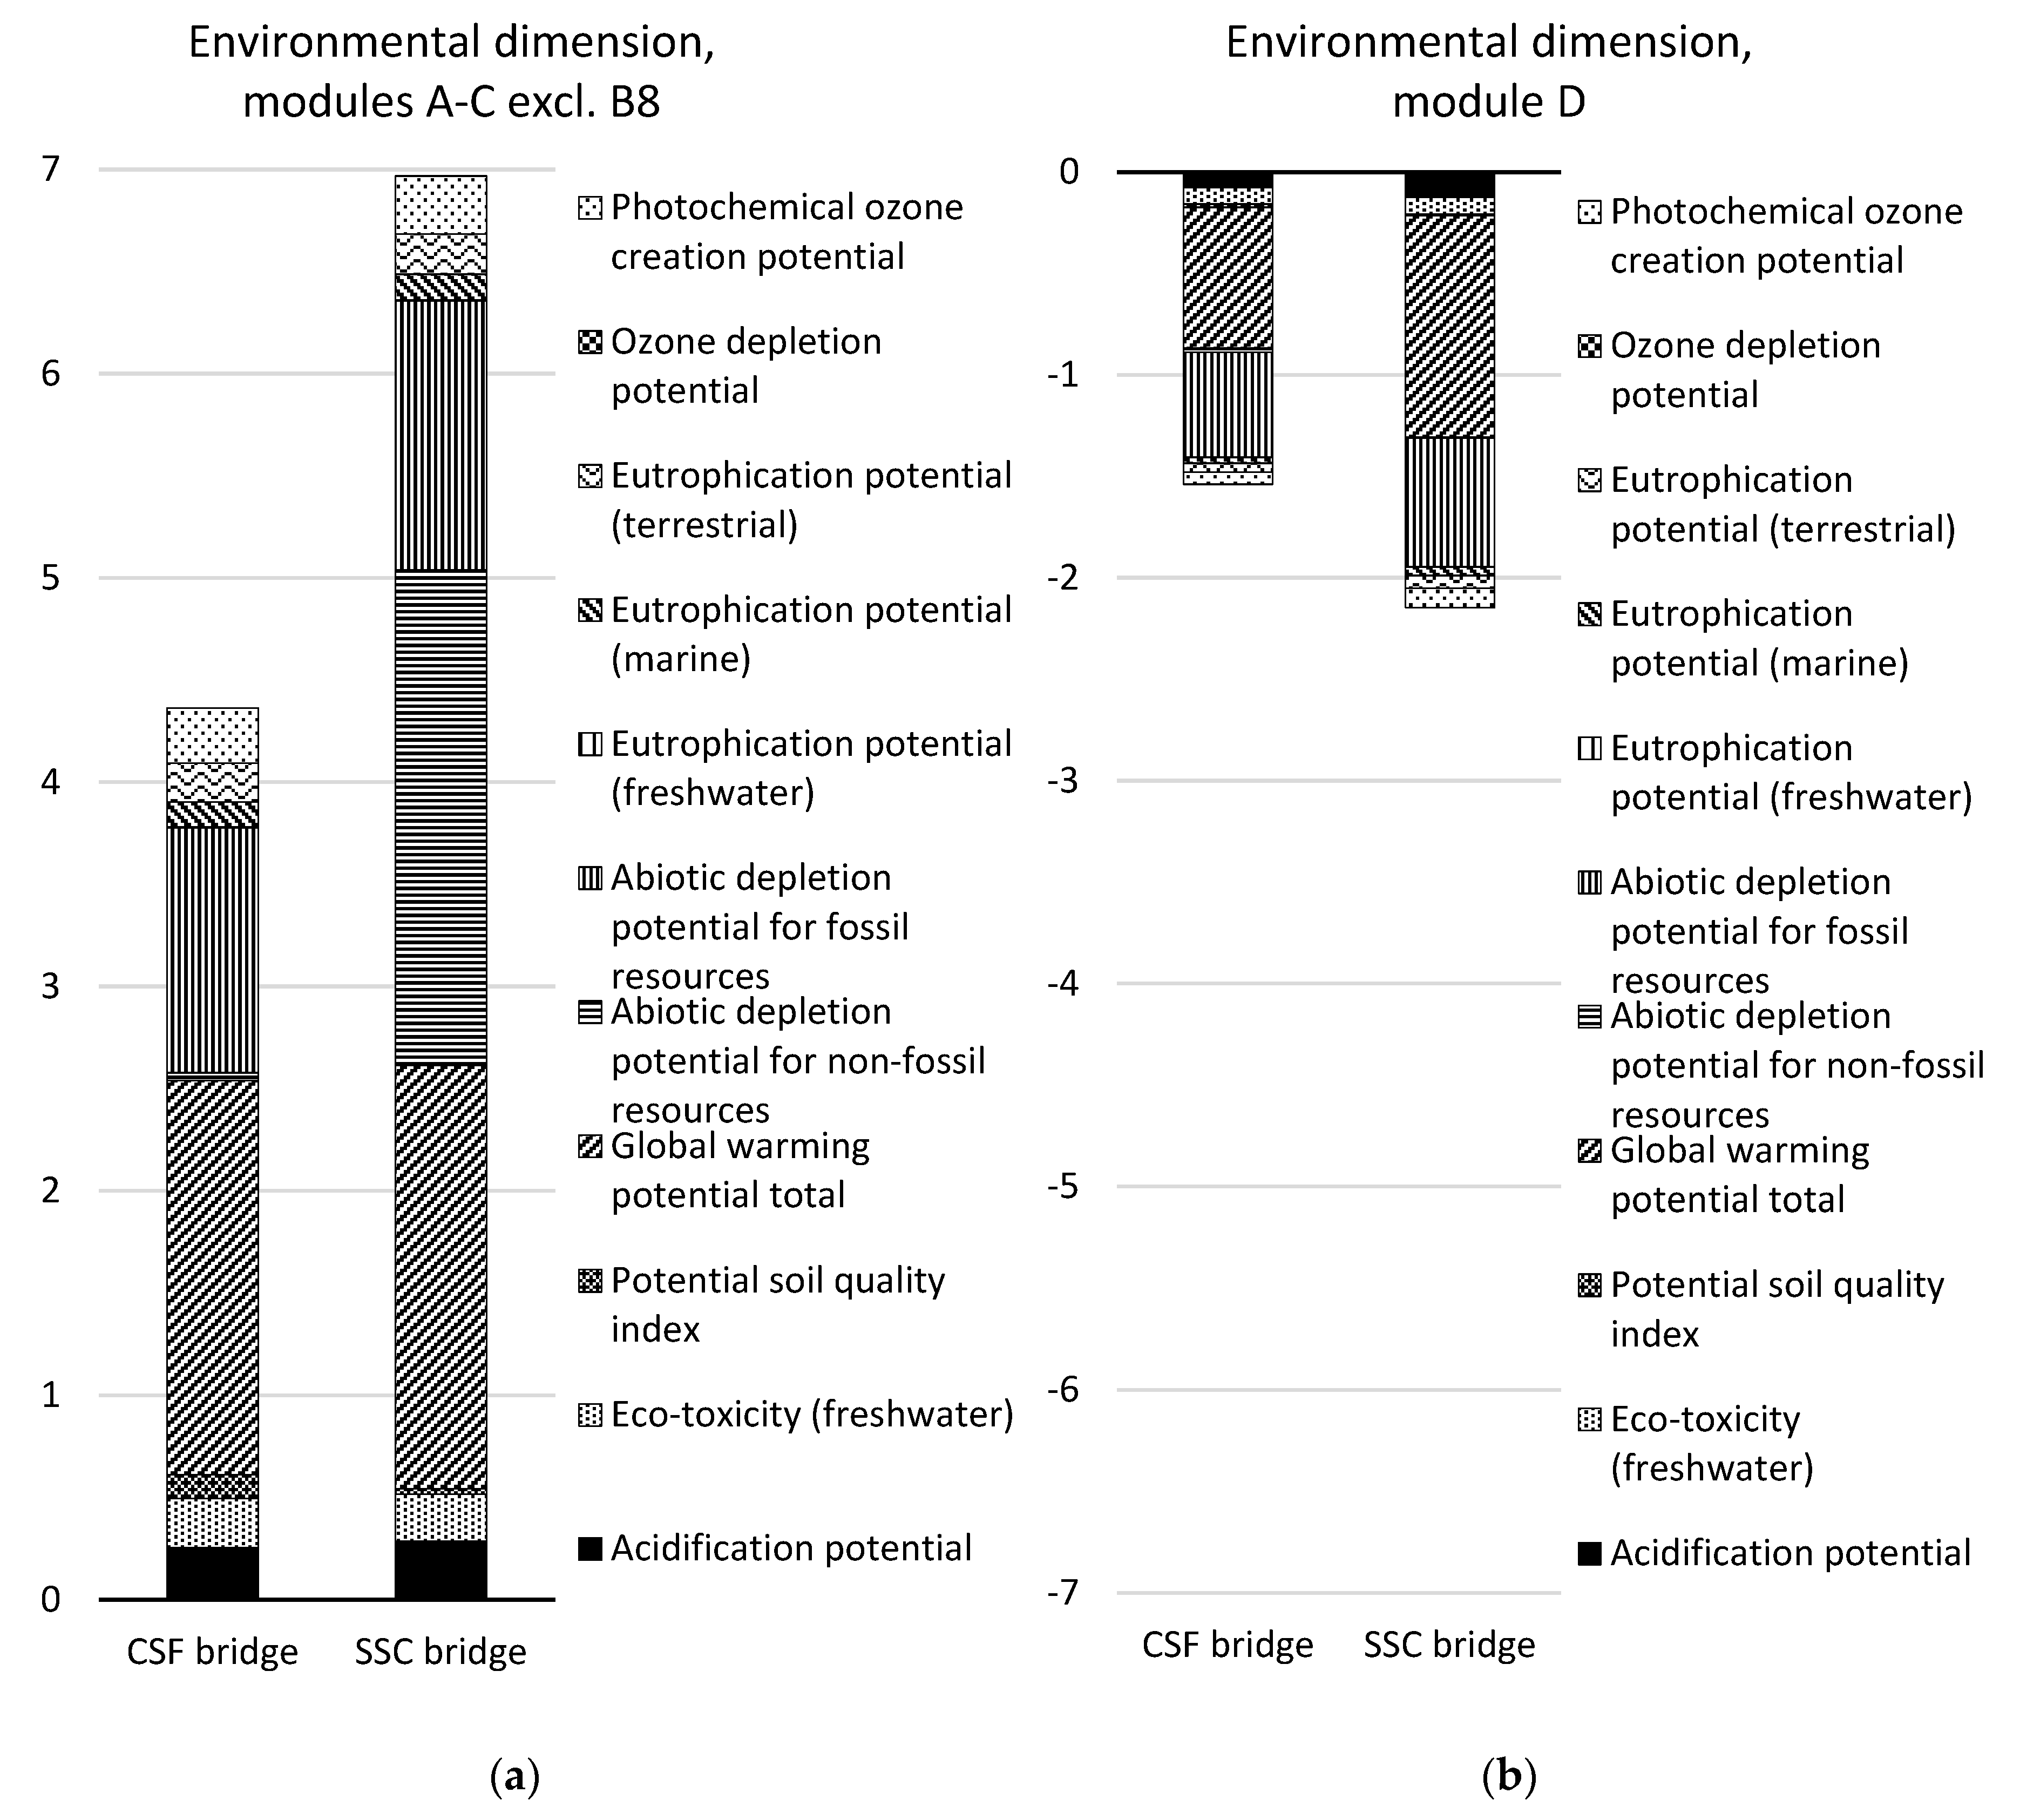
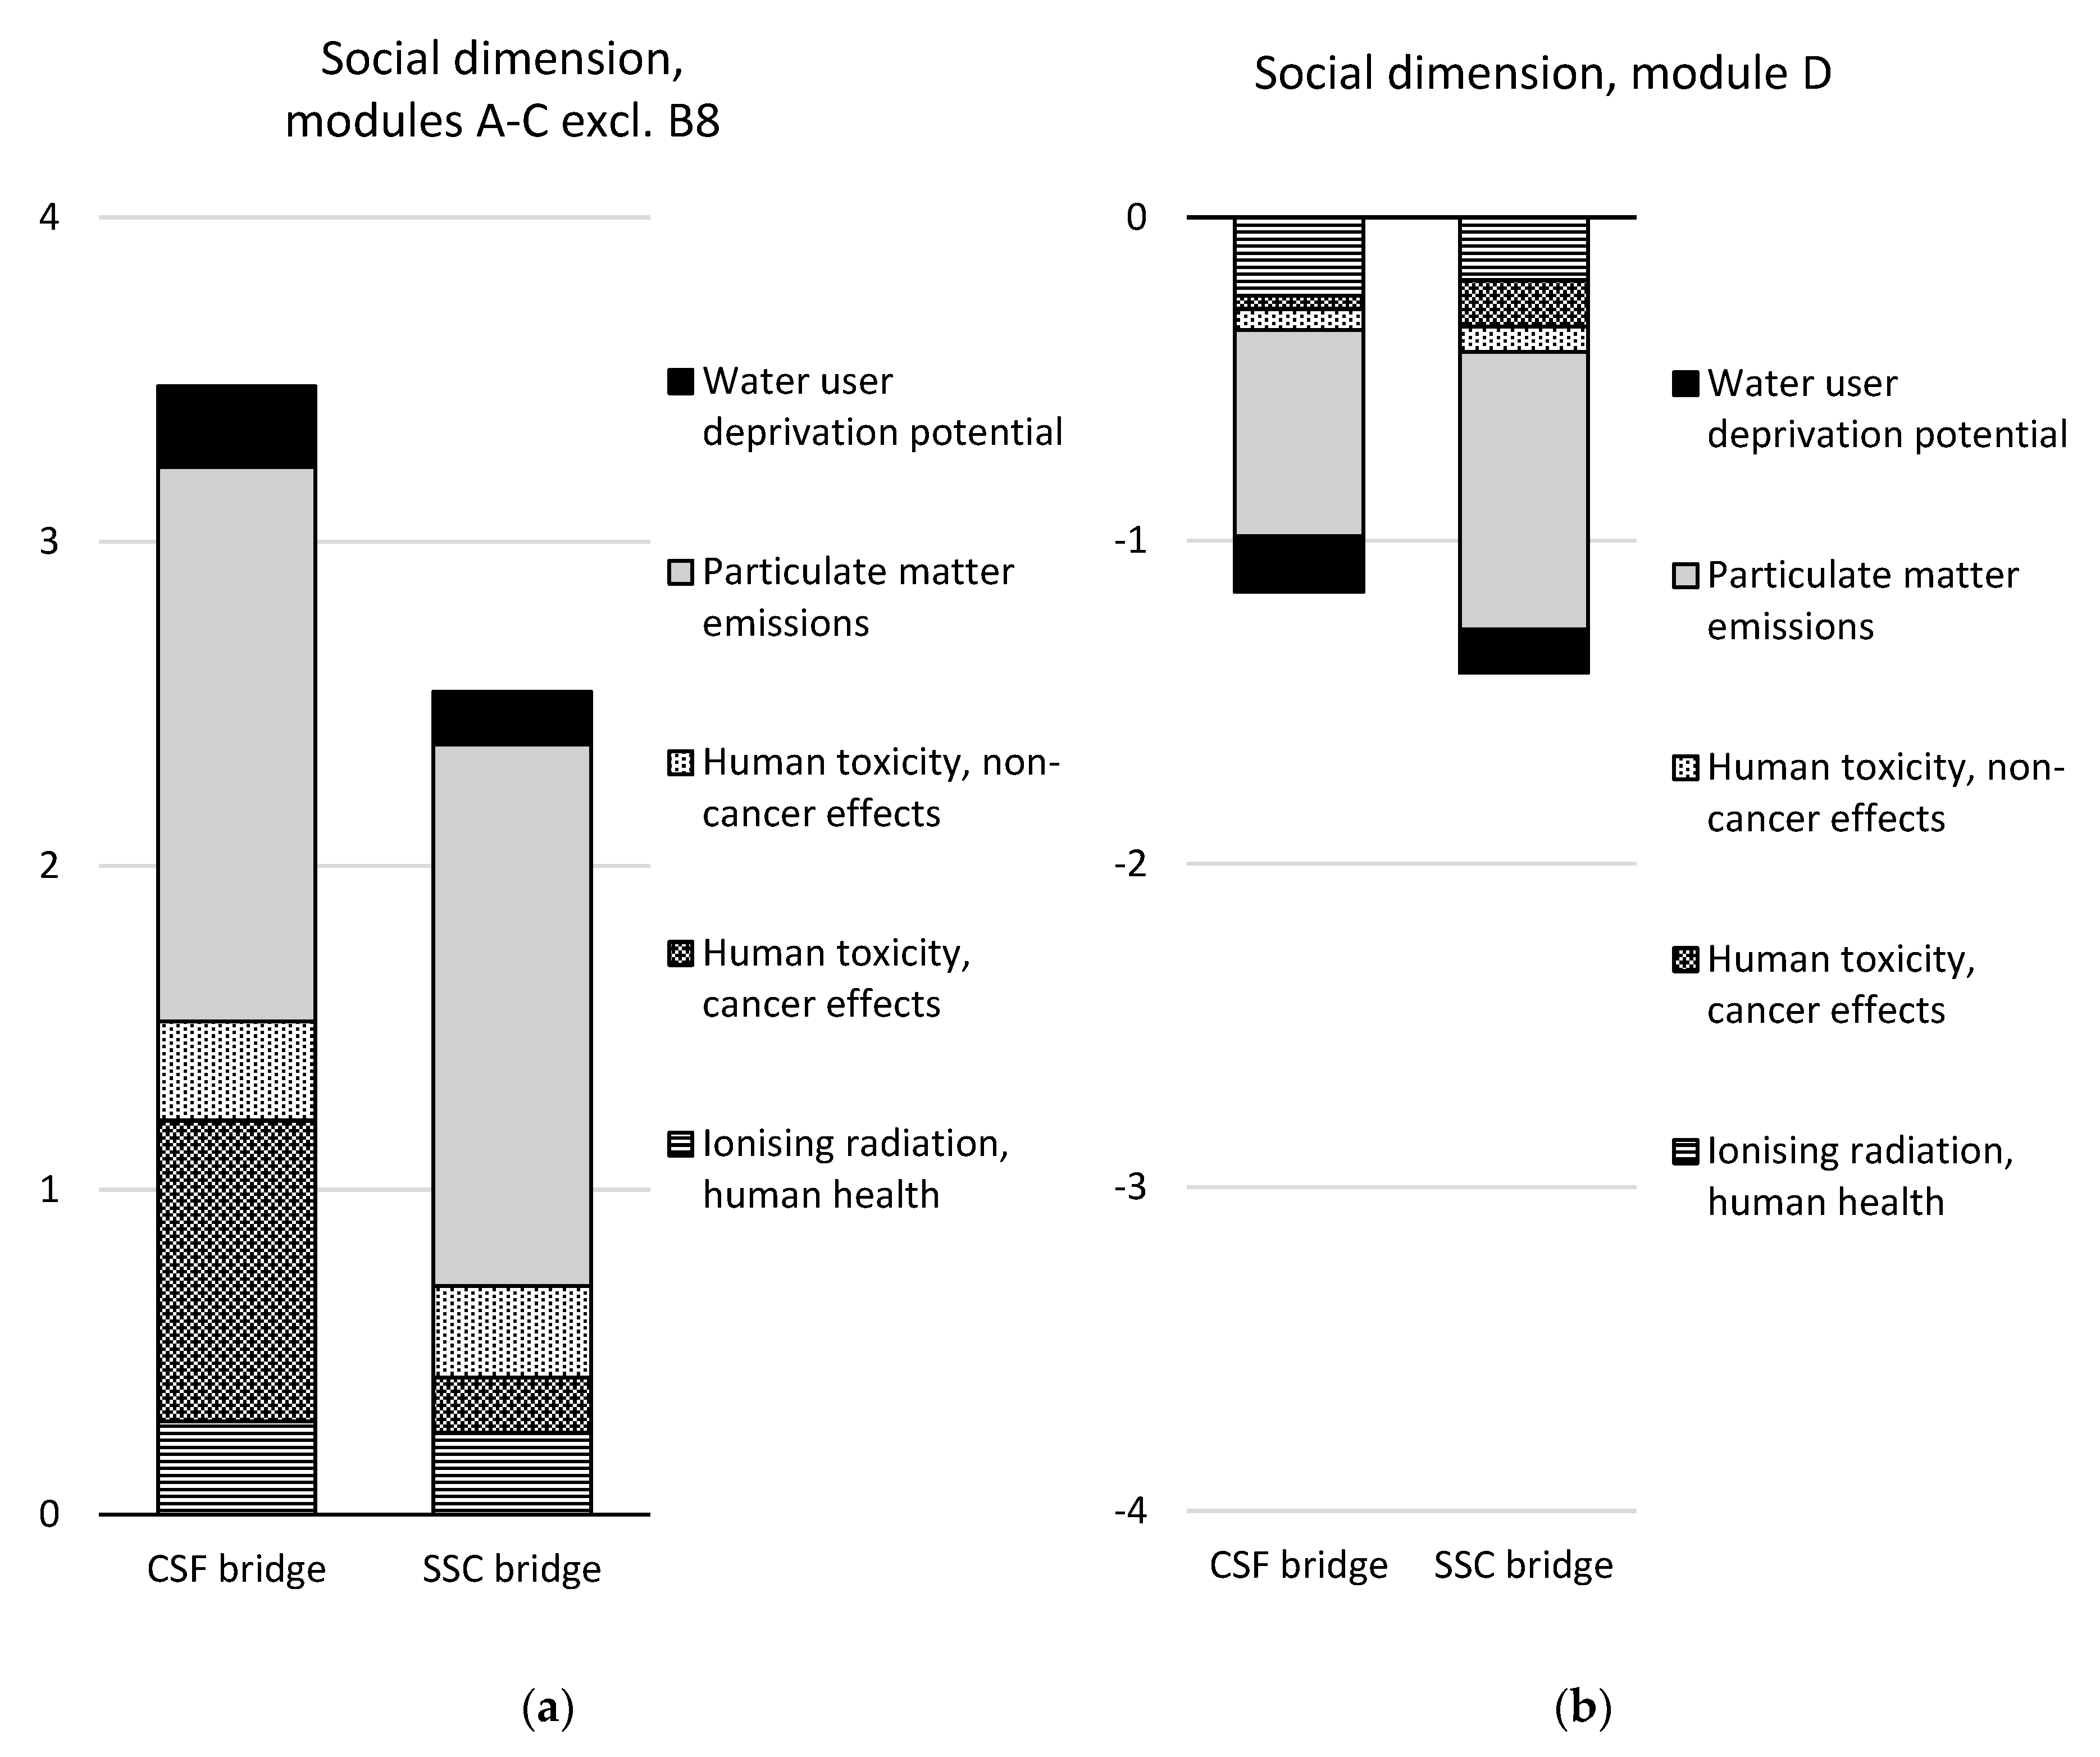
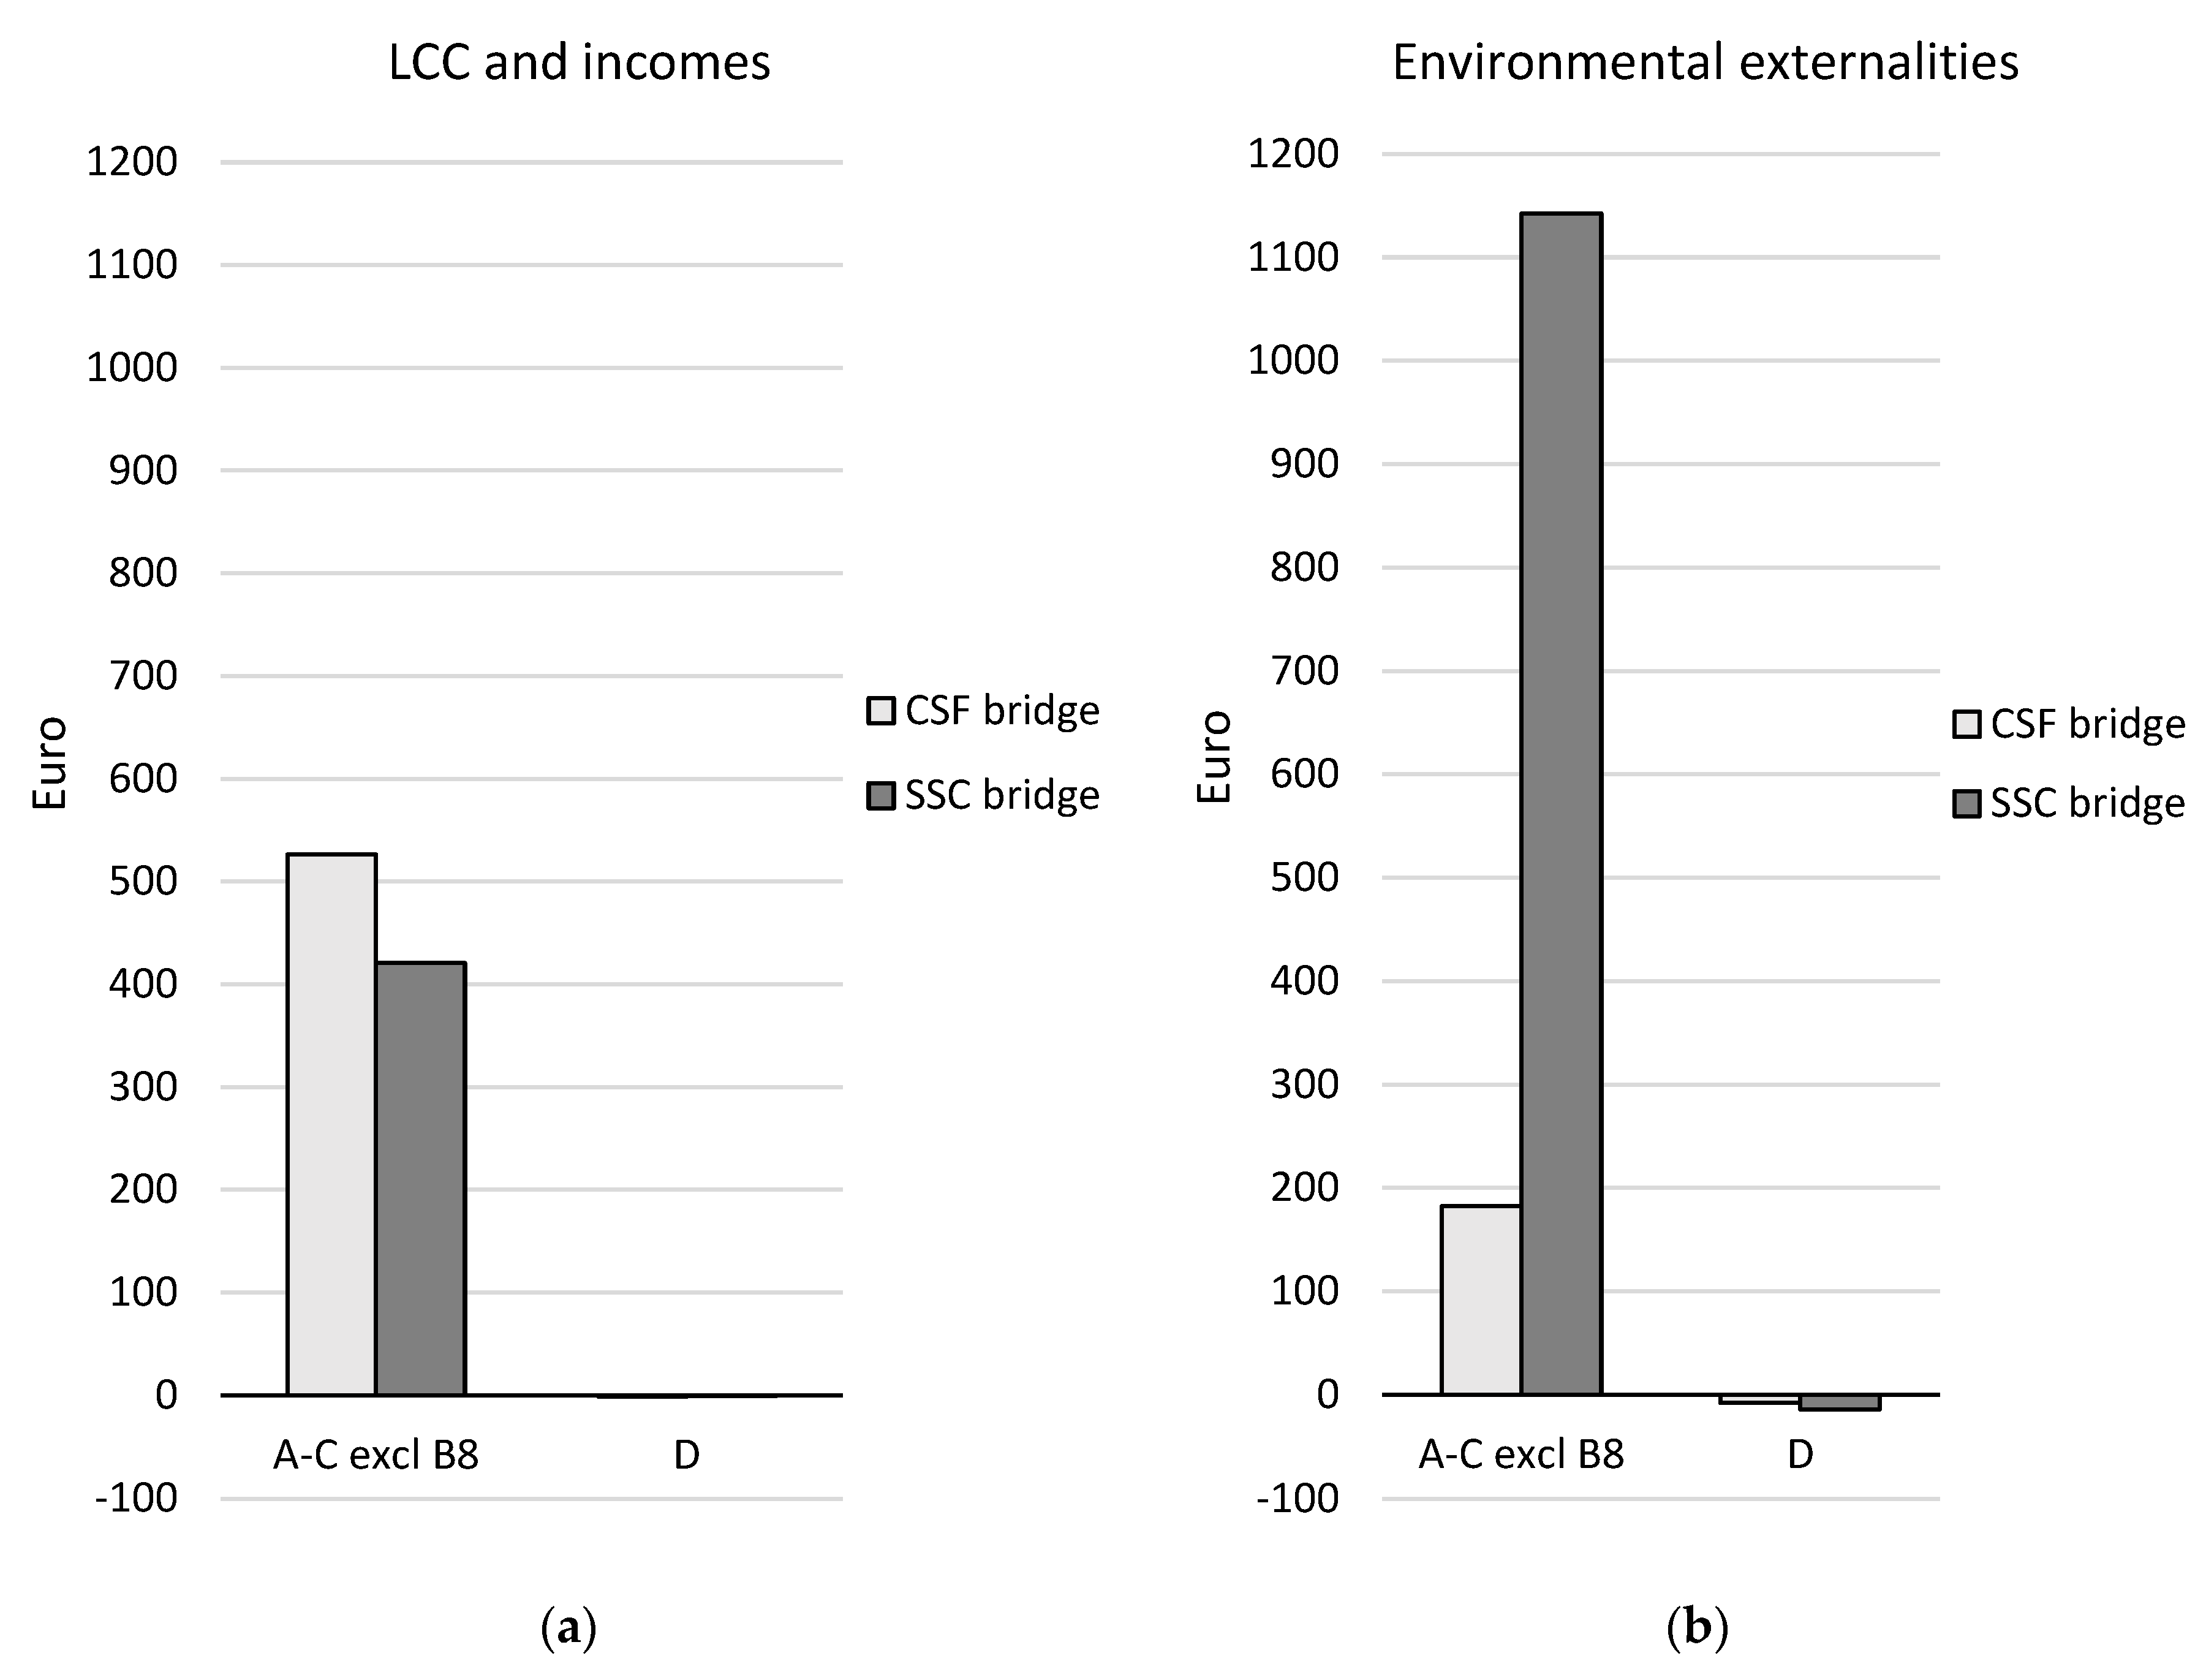
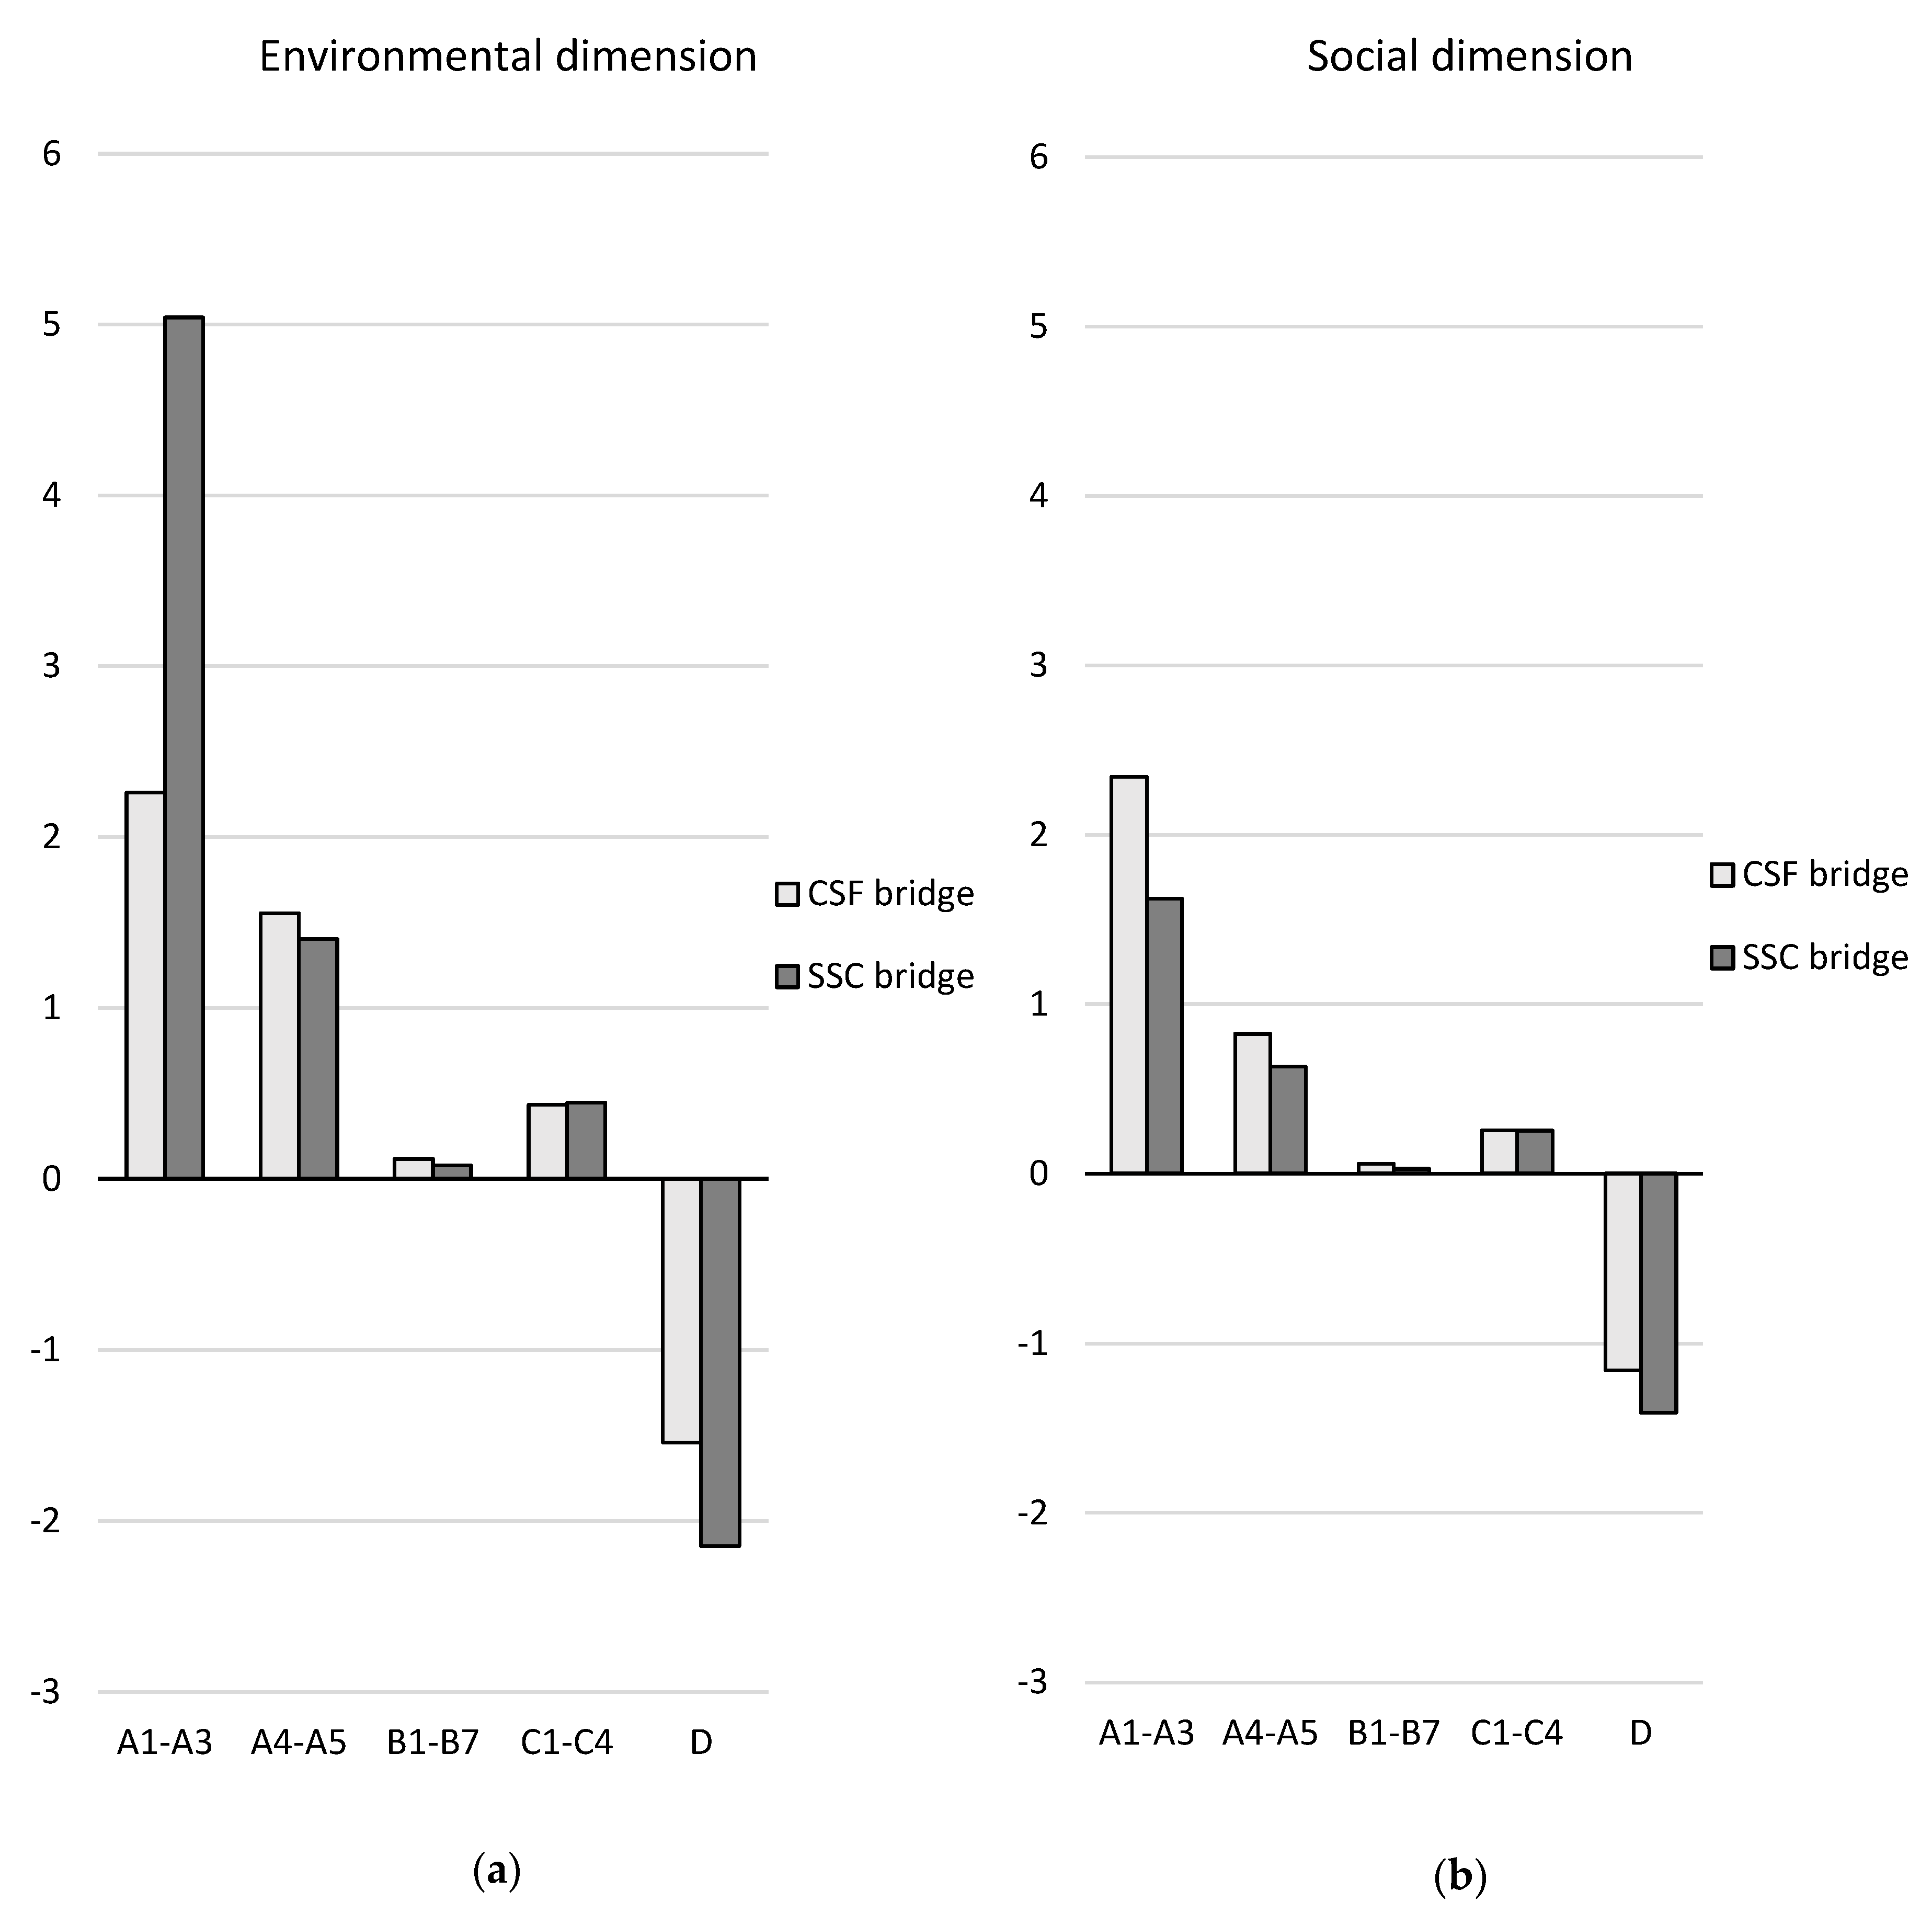
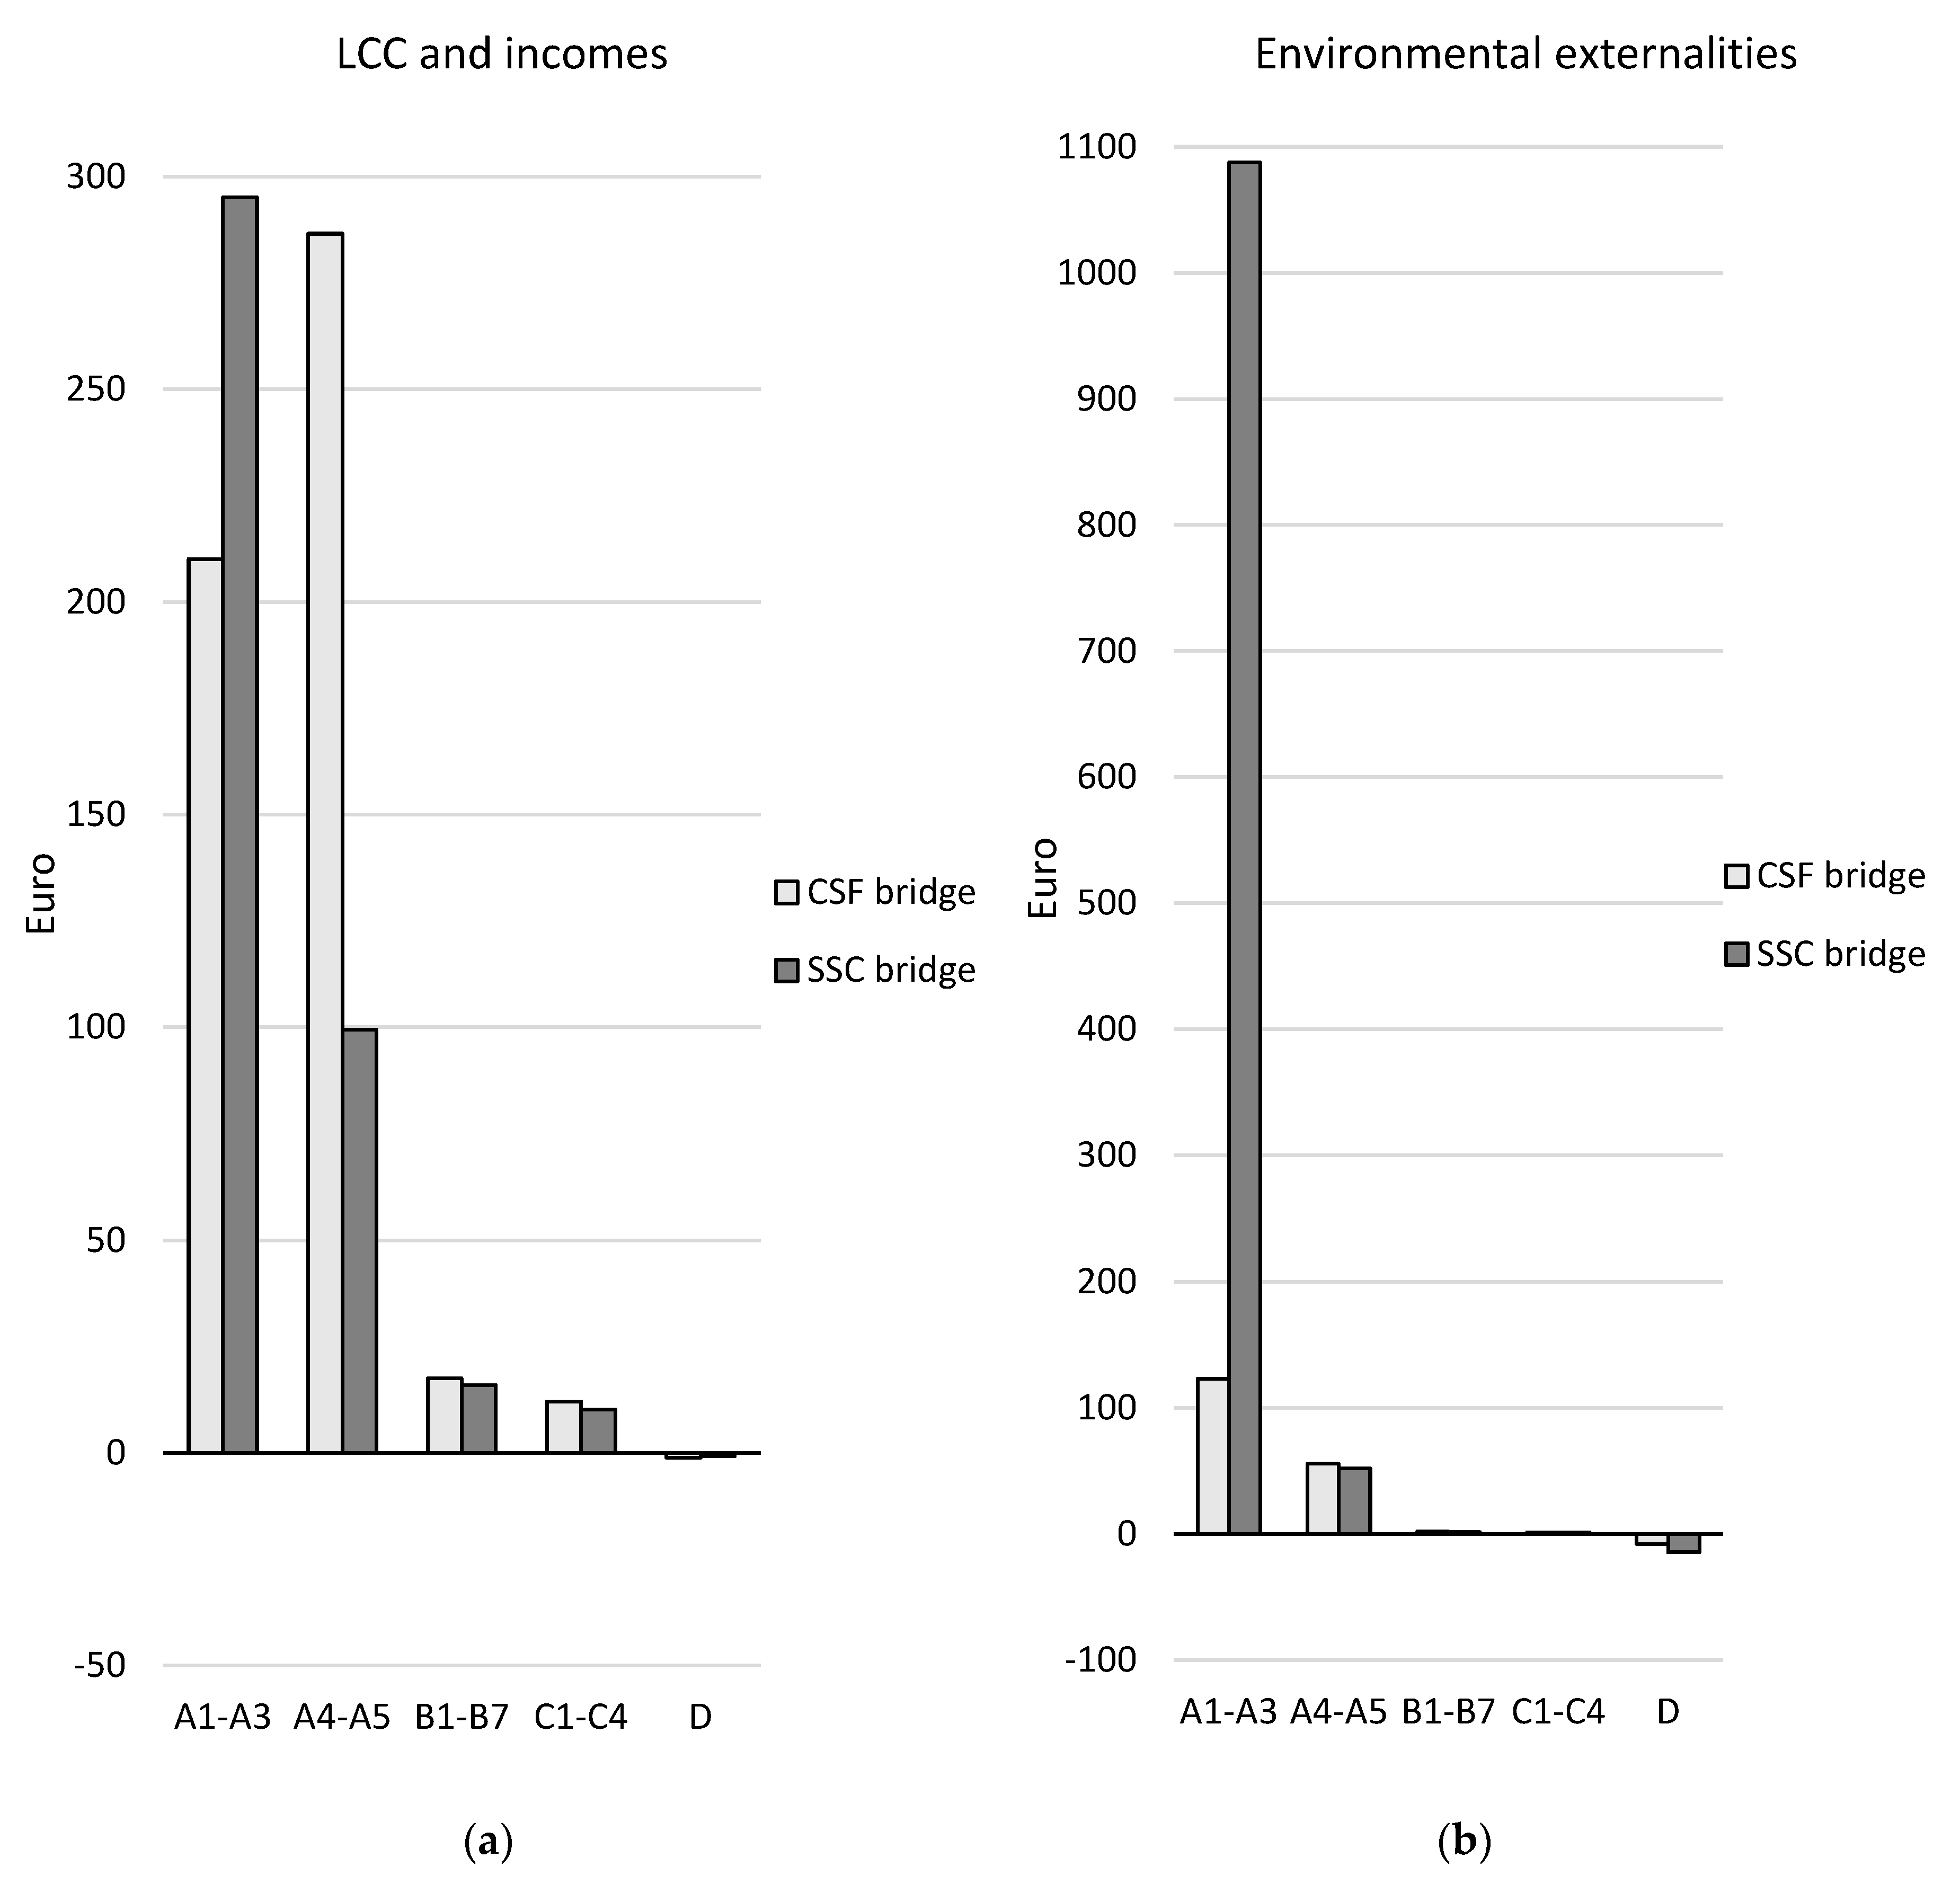
3.3. Comparison of the Design Concepts
4. Discussion
5. Conclusions
Author Contributions
Funding
Acknowledgments
Conflicts of Interest
Appendix A

| Inventory | Description | Assumption | GaBi Dataset | Country | Source |
|---|---|---|---|---|---|
| Acetylene | Acetylene | - | Ethine (acetylene) | DE | Generic dataset from Sphera |
| Aggregate waste treatment | Aggregate and macadam waste | 90% is re-used as aggregates on site, 10% is transported to landfill | Crushed stone grain 2–15 mm (undried) (EN15804 A1–A3) | EU-28 | “ |
| Inert matter (Construction waste) on landfill | DE | “ | |||
| Aggregates 0/16 and 0/90 mm | Crushed aggregates 0/16 and 0/90 from igneous rock in Sweden | European limestone 2/15 mm crushed stone | Crushed stone grain 2–15 mm (undried) (EN15804 A1–A3) | EU-28 | “ |
| Asphalt ABb | ABb asphalt from Sweden | European average supporting layer asphalt | Asphalt supporting layer (EN15804 A1–A3) | EU-28 | “ |
| Asphalt ABT | ABT asphalt from Sweden | European average asphalt pavement | Asphalt pavement (EN15804 A1–A3) | EU-28 | “ |
| Asphalt recycling | Recycling of ABb, ABT, and Viacogrip asphalt | 0.7 kWh of Swedish grid mix electricity used per ton of recycled asphalt (crushing). 1000 kg of recycled asphalt replaces 740 kg of virgin aggregates and 60 kg of virgin bitumen. | Crushed stone grain 2–15 mm (undried) (EN15804 A1–A3) | DE | “ |
| Bitumen (Eurobitume LCI report 2019) w infrastructure | EU-28 | Generic dataset based on Eurobitume report 2019 [33] | |||
| Asphalt ViacoGrip | ViacoGrip asphalt from Sweden | European average SMA asphalt | Stone mastic asphalt SMA (EN15804 A1–A3) | EU-28 | Generic dataset from Sphera |
| Average electricity/diesel driven train | - | - | Rail transport cargo—average, average train, gross tonne weight 1000 t/726 t payload capacity | GLO | “ |
| Bitumen sealant | Bitumen emulsion (EN 15804 A1–A3) | DE | “ | ||
| Bitumen sheet | Icopal Membrane 5BRO (YEP 6500) | Produced in Germany | Bitumen sheets PYE-PV 200 S5 ns (slated) (EN15804 A1–A3) | DE | “ |
| Bitumen sheet waste | Incineration in Swedish district heating plant (Jönköping) | Incineration of average municipal solid waste (MSW) in Germany | Commercial waste in municipal waste incineration plant | DE | “ |
| Bituprimer | Degadur®112 | - | Methacrylate resin products, highly-filled, flow coatings—Deutsche Bauchemie e.V. (DBC) (A1–A3) | DE | “ |
| Carbon steel reinforcement recycling | - | Average German production | Recycling potential steel profile (D) | DE | “ |
| Concrete elements | Concrete kerbstone | Bricks of concrete C20/25 | Concrete bricks (EN15804 A1–A3) | DE | “ |
| Concrete waste treatment | - | 0.7 kWh of Swedish grid mix electricity used per ton of recycled concrete (crushing). 1 kg of recycled concrete replaces 1 kg of virgin aggregates. | Crushed stone grain 2–15 mm (undried) (EN15804 A1–A3) | DE | “ |
| Container ship | - | - | Container ship, 5000 to 200,000 dwt payload capacity, ocean going | GLO | “ |
| Diesel | Diesel 7% bioblend | Diesel 6,4% bioblend | Diesel mix at filling station | EU-28 | “ |
| Diesel combustion | Diesel combustion | Combustion of diesel (modified for diesel 7% bioblend) | Diesel combustion in construction machine | GLO | “ |
| Electricity | Swedish grid mix electricity | - | Electricity grid mix | SE | “ |
| Electricity generation from waste incineration | Electricity generation from incineration wood, particle board, plywood, plastic, bitumen sheet, and hazardous waste | Swedish grid mix electricity | Electricity grid mix | SE | “ |
| Epoxy sealant | NM Försegling 62F Tix | Primer for exterior applications | Powder coating based on epoxy resin (EN15804 A1–A3) | DE | “ |
| Form oil | Form oil | From crude oil | Lubricants at refinery | EU-28 | “ |
| Geotextile | Drefon ST 550 (polypropylene fibre geotextile) | Approximated by woven cotton fibre fabric | Textile Manufacturing—Woven Fabric | GLO | Generic dataset from CottonInc |
| Graffiti protection | Graffiti Shield wax emulsion | From crude oil | Wax/Paraffins at refinery | DE | Generic dataset from Sphera |
| Hazardous waste treatment | - | Incineration | Hazardous waste in waste incineration plant | SE | “ |
| HDG steel racks | Birsta W, single sided safety barrier (HDG) | Produced by blast furnace (BF) route, average European production | Steel forged component (EN15804 A1–A3) | EU-28 | “ |
| HDG steel recycling | - | Average German production | Recycling potential steel sheet galvanised (EN15804 D) | DE | “ |
| HDG structural steel plates | SSAB Hot-rolled coils S355MC, produced in a blast furnace (BF) route in Sweden and galvanized in Poland | Produced through a BF route and galvanized, German average | Steel sheet HDG (EN 15804 A1–A3) | DE | “ |
| HVO combustion | HVO combustion | Approximated by a combination of biomass/regular diesel combustion | HVO combustion in car | GLO | Dataset based on CO2e emission data from the Swedish EPA 2018, combustion of “Other biomass”, other emissions (SO2, NOx, PM etc.) based on data for regular diesel |
| Hydrogenated Vegetable Oil (HVO) | HVO combustion | Approximated by RME | Rapeseed Methyl Ester (RME) | DE | “ |
| Impregnation (direct emissions) | SILRES® BS 1701 | Silicate emulsion primer | Primer silicate emulsion (building, exterior, white) (EN15804 A5) | DE | “ |
| Impregnation (production) Liquified Petroleum Gas (LPG) | SILRES® BS 1701 Liquified Petroleum Gas | Silicate emulsion prime coat average European production | Primer silicate emulsion (building, exterior, white) (EN15804 A1–A3) | DE | “ |
| Thermal energy from LPG | EU-28 | “ | |||
| Macadam 8/16 mm | Crushed macadam 8/16 from igneous rock in Sweden | European limestone 16/32 mm crushed rock | Crushed rock 16–32 mm (undried) (EN15804 A1–A3) | EU-28 | “ |
| Mortar | Fine concrete K40 and expander concrete EXM 702 | Average European production | Normal mortar (A1–A3) | EU-28 | “ |
| Particle board | Form board from Sweden | Average European P2 (Standard FPY) | Particle board | EU-28 | “ |
| Plastic film | - | - | Plastic Film (PE, PP, PVC) | GLO | “ |
| Plastic waste treatment | Incineration in Swedish district heating plant (Jönköping) | Incineration in average European waste incineration plant | Plastic packaging in municipal waste incineration plant | EU-28 | “ |
| Plywood | Formply from Sweden | Pine plywood produced in Germany | Plywood board (EN15804 A1–A3) | DE | “ |
| Plywood and particleboard waste treatment | Incineration in Swedish district heating plant (Jönköping) | Incineration in German waste incineration plant | Particle board in municipal waste incineration plant | DE | “ |
| Polyethylene foam | Concrete carpet | Consisting of polyethylene foam | Polyethylene foam (EN15804 A1–A3) | DE | “ |
| Polypropylene pipe | PP road drum | PP pipe produced in Germany | Polypropylene pipe (PP) (EN15804 A1–A3) | DE | “ |
| PVC tube | PVC drain hose | PVC drain pipe produced in Germany | Rain drain pipe (PVC pipe) (EN15804 A1–A3) | DE | “ |
| PVC waste treatment | PVC waste incineration in Swedish district heating plant (Jönköping) | Incineration in German waste incineration plant | Polyvinyl chloride (PVC) in waste incineration plant | DE | “ |
| Ready-mix concrete C35/45 | Betongindustri concrete C35/45 vct = 0,40 | Average European production | Concrete C35/45 (Ready-mix concrete) (EN15804 A1–A3) | EU-28 | “ |
| Recovery of heat for district heating | Heat recovery from wood, particle board, plywood, plastic, bitumen sheet, and hazardous waste | District heating produced by plant in Jönköping | District heating mix Jönköping 2019 | SE | Specific dataset based on fuel use for Jönköping district heating plant |
| Reinforcement (carbon steel) | B500B | Produced by the electric arc furnace (EAF) route, average European production | Reinforced steel (wire) (EN15804 A1–A3) | EU-28 | Generic dataset from Sphera |
| Reinforcement (stainless steel) | LDX2101 | Produced from 100% alloyed stainless steel scrap | Fixing material screws stainless steel (EN15804 A1–A3) | DE | “ |
| Road salt | - | From rock salt | Sodium chloride (rock salt) | DE | “ |
| Stainless steel reinforcement recycling | - | Average German production | Recycling potential stainless steel sheet (EN15804 D) | DE | “ |
| Tap water Truck, Euro 6 | Tap water - | Swedish tap water produced from groundwater - | Tap water from groundwater (for regionalization) | GLO (SE chosen in dummy) | “ |
| Truck, Euro 6, 20–26 t gross weight/17.3 t payload capacity | GLO | “ | |||
| Untreated wood | Spruce wood from Sweden | Coniferous wood produced in Germany | Solid construction timber (softwood) (EN15804 A1–A3) | DE | “ |
| Wood waste treatment | Wood waste incineration in Swedish district heating plant (Jönköping) | Incineration in German waste incineration plant | Wood (natural) in waste incineration plant | DE | “ |
Appendix B
| Concept | Module | Resource/Waste | Amount | Unit |
|---|---|---|---|---|
| Both | A1–A3 | Aggregates 0/16 and 0/90 mm | 6,820,600 | kg |
| Macadam 8/16 mm | 12,000 | kg | ||
| Asphalt Abb | 6983 | kg | ||
| Asphalt ABT | 4364 | kg | ||
| Asphalt ViacoGrip | 5237 | kg | ||
| Concrete elements | 8100 | kg | ||
| Hot-dip galvanized (HDG) steel racks | 250 | kg | ||
| Polypropylene pipe | 106 | kg | ||
| Geotextile | 17 | kg | ||
| A5 | Electricity (Swedish grid mix) | 4560 | kWh | |
| Tap water | 1500 | liters | ||
| PVC tube | 105 | kg | ||
| PVC waste | 105 | kg | ||
| B1 | Zinc to fresh water | 0.55 | kg | |
| PAH to fresh water | 0.112 | kg | ||
| B2 | Tap water | 400 | liters | |
| Road salt | 65 | kg | ||
| B3 | HDG steel racks | 692 | kg | |
| HDG steel racks waste for recycling | 692 | kg | ||
| B4 | HDG steel racks | 692 | kg | |
| Asphalt | 10,500 | kg | ||
| Diesel 7% bioblend | 17 | liters | ||
| Tap water | 10,000 | liters | ||
| HDG steel racks waste for recycling | 692 | kg | ||
| B5 | N/A | - | ||
| B6 | N/A | - | ||
| B7 | N/A | - | ||
| B8 | Diesel 7% bioblend | 11,797 | liters | |
| Hydrogenated Vegetable Oil (HVO) | 41,611 | liters | ||
| Electricity (Swedish grid mix) | 357,209 | kWh | ||
| Particles to fresh water | 10,950 | kg | ||
| Micro plastics to soil | 131 | kg | ||
| C1 | Diesel 7% bioblend | 39 | liters | |
| C2 | See Table A6 | - | ||
| C3 | Aggregates for re-use | 6,149,340 | Kg | |
| Asphalt waste for recycling | 16,580 | Kg | ||
| Polypropylene plastic waste for incineration | 106 | Kg | ||
| C4 | Aggregates on inert landfill | 683,260 | Kg | |
| D | Electricity (Swedish grid mix) | 19 | kWh | |
| CSF bridge | A1–A3 | Ready-mix concrete C35/45 | 463,700 | Kg |
| Reinforcement (carbon steel) | 22,680 | Kg | ||
| Reinforcement (stainless steel) | 553 | kg | ||
| Bitumen sheet | 380 | kg | ||
| Mortar | 180 | kg | ||
| Epoxy sealant | 77 | kg | ||
| Bituprimer | 35 | kg | ||
| Impregnation | 19 | liters | ||
| Graffiti protection | 19 | liters | ||
| Bitumen sealant | 10 | kg | ||
| Polyethylene foam | 5 | kg | ||
| A5 | Untreated wood | 5400 | kg | |
| Diesel 7% bioblend | 5280 | liters | ||
| Particle board | 1600 | kg | ||
| Plywood | 1000 | kg | ||
| Form oil | 130 | kg | ||
| Plastic film | 22 | kg | ||
| Concrete waste for recycling | 23,185 | kg | ||
| Wood waste for incineration | 5400 | kg | ||
| Plywood and particleboard waste for incineration | 2600 | kg | ||
| Reinforcement waste (carbon steel) for recycling | 1134 | kg | ||
| Plastic waste for incineration | 22 | kg | ||
| Bitumen sheet waste for incineration | 19 | kg | ||
| B1 | CO2 uptake | 1139 | kg | |
| Zinc oxide to air | 0.55 | kg | ||
| B2 | Diesel 7% bioblend | 70 | liters | |
| Tap water | 29,400 | liters | ||
| Graffiti shield | 15 | liters | ||
| B3 | Concrete C35/45 | 1344 | kg | |
| Tap water | 1000 | liters | ||
| Concrete waste | 1411 | kg | ||
| B4 | Concrete C35/45 | 12,600 | kg | |
| Diesel 7% bioblend | 27 | liters | ||
| Bitumen sealant | 10 | kg | ||
| Bitumen sheet | 380 | kg | ||
| Bituprimer | 35 | kg | ||
| Epoxy sealant | 77 | kg | ||
| Bitumen sealant waste for incineration | 10 | kg | ||
| Bitumen sheet waste for incineration | 380 | kg | ||
| Bituprimer waste for incineration | 35 | kg | ||
| Epoxy sealant waste for incineration | 77 | kg | ||
| C1 | Diesel 7% bioblend | 1453 | liters | |
| Tap water | 386,000 | liters | ||
| C2 | See Table A6 | - | ||
| C3 | Concrete for recycling | 448,615 | kg | |
| HDG steel for recycling | 250 | kg | ||
| Carbon steel reinforcement for recycling | 22,680 | kg | ||
| Stainless steel reinforcement for recycling | 553 | kg | ||
| Bitumen sealant waste for incineration | 10 | kg | ||
| Bitumen sheet waste for incineration | 380 | kg | ||
| Bituprimer waste for incineration | 35 | kg | ||
| Epoxy sealant waste for incineration | 77 | kg | ||
| C4 | N/A | - | ||
| D | Electricity (Swedish grid mix) | 340 | kWh | |
| SSC bridge | A1–A3 | HDG structural steel plates incl. bolts and nuts | 40,653 | kg |
| A5 | Diesel 7% bioblend | 5230 | liters | |
| B1 | Zinc oxide to air | 3.35 | kg | |
| B2 | Diesel 7% bioblend | 52 | liters | |
| Tap water | 26,200 | liters | ||
| B3 | N/A | - | ||
| B4 | N/A | - | ||
| C1 | Acetylene | 8300 | liters | |
| Diesel 7% bioblend | 2339 | liters | ||
| C2 | See Table A6 | - | ||
| C3 | HDG structural steel plates incl. bolt and nuts for recycling | 40,653 | kg | |
| C4 | N/A | - | ||
| D | N/A | - |
Appendix C
| Module | Scenario |
|---|---|
| B1 |
|
| B2 |
|
| B3 | 10% of the steel rack mass is repaired every second year, giving 692 kg over 80 years. The cost for this amount of steel is 8650 Euros. The energy used for the repairs is estimated to be negligible and was therefore not included. The work cost was calculated assuming 1 h of work per occasion and a salary of 60 Euros/h, giving 2400 Euros. |
| B4 |
|
| B5 | No refurbishment needed |
| B6 | No energy consumption |
| B7 | No water consumption |
| B8 |
|
| C1 |
|
| C2 |
|
| C3 | N/A, end-of-waste is reached for asphalt and steel racks before waste treatment takes place. |
| C4 | A total of 10% of the aggregates are disposed on an inert landfill = 683,260 kg. The cost for landfilling is 30 Euros/ton. |
| D |
|

| Module | Scenario |
|---|---|
| B1 | Carbonation of the concrete surfaces was calculated according to [40] with the following assumptions:
|
| B2 | Graffiti removal is done every 10 years by washing with hot water under high pressure. After washing, new graffiti protection is applied. It is assumed that 10% of the available surface area of 170 m2 is covered by graffiti over 10 years, giving 17 m2. It is estimated that it takes 15 min to wash 1 m2, giving 4 h to wash in total per occasion. The equipment consumes 2.15 L of diesel/h, giving 70 L over 80 years. It consumes 15 L of drinking water/minute, giving 29.4 m3 in total over 80 years. Graffiti protection of 10% of the surface, giving 15 L over 80 years. The work cost was calculated assuming 32 h of work and a salary of 60 Euros/h, giving 1 920 Euro. |
| B3 | Minor repairs in the concrete parts are needed every 10 years. A 1 m2 layer of concrete with a thickness of 70 mm is repaired per occasion, giving 1344 kg concrete repaired over 80 years. A total of 2000 L of water is used per m3 of concrete repaired, giving 1000 L over 80 years. The amount of diesel consumed is negligible and was therefore not included. The work cost was calculated assuming 14 h of work and a salary of 60 Euros/h, giving 840 Euros. |
| B4 | Replacement of edge beams is done every 40 years. The two edge beams are 400 mm wide, 500 mm high, and 6 m long, giving 5 m3 of concrete is replaced over 80 years. The equipment has a diesel consumption of 5.3 L/h, and 1 m3 concrete is removed/h, giving 27 L over 80 years. It also consumes 2000 L of drinking water/h [41], giving 10 m3 in total over 80 years. The bridge insulation is totally replaced every 40 years, giving 77 kg of epoxy sealant, 10 kg of bitumen sealant, 35 kg of bituprimer, and 380 kg of bitumen sheet over 80 years. The work cost was calculated assuming 16 h of work and a salary of 60 Euros/h, giving 1000 Euro. The cost for 1 day of scaffolding rent is estimated to be 100 Euros. |
| C1 |
|
| C2 |
|
| C3 | N/A, end-of-waste is reached for concrete and reinforcement steel before waste treatment takes place. |
| C4 | N/A, no waste is disposed. |
| D |
|
| Module | Scenario |
|---|---|
| B1 | Zinc oxidizes on the bridge’s structural steel plates into a powder which is assumed to disperse into the surrounding air (since the steel surface is protected from rain). Conservatively, it is assumed that 0.5 g of Zn is dispersed per m2 plate and year [34,42]. The area is 70 m2, giving 2.8 kg of Zn is released to air over 80 years. |
| B2 |
Washing of the bridge’s structural steel plates surface of 95 m2 is also done by using hot water under high pressure. It is done once a year using 0.5 L of drinking water/m2, giving 3800 L over 80 years. |
| B3 | No repairs are needed. |
| B4 | No replacements are needed. |
| C1 |
|
| C2 | The bridge’s structural steel plates are transported by truck to a storage facility. |
| C3 | N/A, end-of-waste is reached before waste treatment takes place. |
| C4 | N/A, no waste is disposed. |
| D | All of the bridge’s structural steel plates are recycled. The selling price is 0.1 Euro/kg steel. |
Appendix D
| Concept | Resource | Transport Mode | Distance (km) |
|---|---|---|---|
| Both | Aggregates (crushed rock), asphalt | Truck, Euro 6, 20–26 t gross weight/17.3 t payload capacity, 55% utilisation | 39 |
| Concrete elements | “ | 66 | |
| Diesel 7% bioblend | “ | 100 | |
| Steel racks | “ | 646 | |
| Aggregate waste, Asphalt waste, Concrete waste | “ | 39 | |
| Steel waste (racks, reinforcement steel, stainless steel) | “ | 50 | |
| Plastic waste | “ | 38 | |
| CSF bridge | Ready-mix concrete C35/45 | “ | 40 |
| Reinforcement (carbon steel) | Average electricity/diesel driven train, gross tonne weight 1000 t/726 t payload capacity, 40% utilisation Truck Euro 6, 20–26 t gross weight/17.3 t payload capacity, 55% utilisation | 1510 198 | |
| Reinforcement (stainless steel) | Container ship, 5000 to 200,000 dwt payload capacity, ocean going, 70% utilisation Truck Euro 6, 20–26 t gross weight/17.3 t payload capacity, 55% utilisation | 49 1045 | |
| Untreated wood, particle board, plywood | Truck Euro 6, 20–26 t gross weight/17.3 t payload capacity, 55% utilisation | 20 | |
| Bitumen sheet waste, wood waste | “ | 38 | |
| Hazardous waste | “ | 200 | |
| SSC bridge | Structural steel plates | Container ship, 5000 to 200,000 dwt payload capacity, ocean going, 70% utilisation Truck Euro 6, 20–26 t gross weight/17.3 t payload capacity, 55% utilisation | 360 2027 |
| Steel waste (structural steel plates) | Truck Euro 6, 20–26 t gross weight/17.3 t payload capacity, 55% utilisation | 50 |
References
- ISO. ISO 15392:2019—Sustainability in Buildings and Civil Engineering Works—General Principles, 2nd ed.; International Organization for Standardization (ISO): Geneva, Switzerland, 2019. [Google Scholar]
- CEN. EN 15643-5:2017—Sustainability of Construction Works—Sustainability Assessment of Buildings and Civil Engineering Works—Part 5: Framework on Specific Principles and Requirement for Civil Engineering Works; European Committee for Standardization (CEN): Brussels, Belgium, 2017. [Google Scholar]
- ISO. ISO/TS 21929-2:2015—Sustainability in Building Construction—Sustainability Indicators—Part 2: Framework for the Development of Indicators for Civil Engineering Works; International Organization for Standardization (ISO): Geneva, Switzerland, 2015; Volume 1. [Google Scholar]
- ISO. ISO 21931-2:2019—Sustainability in Buildings and Civil Engineering Works—Framework for Methods of Assessment of the Environmental, Social and Economic Performance of Construction Works as a Basis for Sustainability Assessment—Part 2: Civil Engineering; International Organization for Standardization (ISO): Geneva, Switzerland, 2019. [Google Scholar]
- Mathern, A.; Ek, K.; Rempling, R. Sustainability-driven structural design using artificial intelligence. In Proceedings of the IABSE Congress New York City—The Evolving Metropolis, New York, NY, USA, 4–6 September 2019; pp. 1–8. [Google Scholar]
- Du, G.; Safi, M.; Pettersson, L.; Karoumi, R. Life cycle assessment as a decision support tool for bridge procurement: Environmental impact comparison among five bridge designs. Int. J. Life Cycle Assess. 2014, 19, 1948–1964. [Google Scholar] [CrossRef]
- Rempling, R.; Mathern, A.; Ramos, D.T.; Fernández, S.L. Automatic structural design by a set-based parametric design method. Autom. Constr. 2019, 108, 102936. [Google Scholar] [CrossRef]
- Yepes, V.; Martí, J.V.; García-Segura, T. Cost and CO2 emission optimization of precast–prestressed concrete U-beam road bridges by a hybrid glowworm swarm algorithm. Autom. Constr. 2015, 49, 123–134. [Google Scholar] [CrossRef]
- Penadés-Plà, V.; García-Segura, T.; Yepes, V. Accelerated optimization method for low-embodied energy concrete box-girder bridge design. Eng. Struct. 2019, 179, 556–565. [Google Scholar] [CrossRef]
- Bragança, L.; Vieira, S.M.; Andrade, J.B. Early Stage Design Decisions: The Way to Achieve Sustainable Buildings at Lower Costs. Sci. World J. 2014, 2014, 1–8. [Google Scholar] [CrossRef] [PubMed]
- Ek, K.; Mathern, A.; Rempling, R.; Karlsson, M.; Brinkhoff, P.; Norin, M.; Lindberg, J.; Rosén, L. A harmonized method for automatable life cycle sustainability performance assessment and comparison of civil engineering works design concepts. IOP Conf. Ser. Earth Environ. Sci. 2020, in press. [Google Scholar]
- CEN. EN 15804:2012+A2:2019—Sustainability of Construction Works—Environmental Product Declarations—Core Rules for the Product Category of Construction Products; European Committee for Standardization (CEN): Brussels, Belgium, 2019. [Google Scholar]
- EPD International AB. Product Category Rules (PCR)—Bridges, Elevated Highways and Tunnels. Available online: https://www.environdec.com/PCR/Detail/?Pcr=12257 (accessed on 12 December 2019).
- ISO. ISO 15686-5:2017—Buildings and Constructed Assets—Service Life Planning—Part 5: Life-Cycle Costing; International Organization for Standardization (ISO): Geneva, Switzerland, 2017. [Google Scholar]
- ISO. ISO 14008:2019—Monetary Valuation of Environmental Impacts and Related Environmental Aspects; International Organization for Standardization (ISO): Geneva, Switzerland, 2019. [Google Scholar]
- GaBi Professional, Version 9.5.2.49, Software-System and Data-Base for Life Cycle Engineering; Sphera: Leinfelden-Echterdingen, Germany, 2020.
- Sala, S.; Crenna, E.; Secchi, M.; Pant, R. Global Normalisation Factors for the Environmental Footprint and Life Cycle Assessment. 2017. Available online: https://ec.europa.eu/jrc (accessed on 9 October 2020).
- Sala, S.; Cerutti, A.K.; Pant, R. Development of a Weighting Approach for the Environmental Footprint. Luxembourg. 2018. Available online: https://ec.europa.eu/jrc (accessed on 9 October 2020).
- European Commission. EF Reference Package 3.0. Available online: https://eplca.jrc.ec.europa.eu/LCDN/developerEF.xhtml (accessed on 22 September 2020).
- CEN. EN 16627:2015—Sustainability of Construction Works—Assessment of Economic Performance of Buildings—Calculation Methods; European Committee for Standardization (CEN): Brussels, Belgium, 2015. [Google Scholar]
- Steen, B. The EPS 2015d Impact Assessment Method—An Overview; Swedish Life Cycle Center: Gothenburg, Sweden, 2015. [Google Scholar]
- Hammervold, J.; Reenaas, M.; Brattebø, H. Environmental Life Cycle Assessment of Bridges. J. Bridg. Eng. 2013, 18, 153–161. [Google Scholar] [CrossRef]
- Du, G.; Pettersson, L.; Karoumi, R. Soil-steel composite bridge: An alternative design solution for short spans considering LCA. J. Clean. Prod. 2018, 189, 647–661. [Google Scholar] [CrossRef]
- Ahlroth, S.; Finnveden, G. Ecovalue08–A new valuation set for environmental systems analysis tools. J. Clean. Prod. 2011, 19, 1994–2003. [Google Scholar] [CrossRef]
- Finnveden, G.; Håkansson, C.; Noring, M. A new set of valuation factors for LCA and LCC based on damage costs—Ecovalue 2012. In Proceedings of the 6th International Conference on Life Cycle Management in Gothenburg, Gothenburg, Sweden, 25–28 August 2013. [Google Scholar]
- Laurent, A.; Olsen, S.I.; Hauschild, M.Z. Limitations of Carbon Footprint as Indicator of Environmental Sustainability. Environ. Sci. Technol. 2012, 46, 4100–4108. [Google Scholar] [CrossRef] [PubMed]
- Yepes, V.; García-Segura, T.; Moreno-Jiménez, J. A cognitive approach for the multi-objective optimization of RC structural problems. Arch. Civ. Mech. Eng. 2015, 15, 1024–1036. [Google Scholar] [CrossRef]
- Giunta, M. Assessment of the environmental impact of road construction: Modelling and prediction of fine particulate matter emissions. Build. Environ. 2020, 176, 106865. [Google Scholar] [CrossRef]
- Cheriyan, D.; Choi, J.-H. A review of research on particulate matter pollution in the construction industry. J. Clean. Prod. 2020, 254, 120077. [Google Scholar] [CrossRef]
- Ek, K.; Mathern, A.; Rempling, R.; Rosén, L.; Claeson-Jonsson, C.; Brinkhoff, P.; Norin, M. Multi-criteria decision analysis methods to support sustainable infrastructure construction. In Proceedings of the IABSE Symposium 2019: Towards a Resilient Built Environment—Risk and Asset Management, Guimarães, Portugal, 27–29 March 2019; p. 8. [Google Scholar]
- Belton, V.; Stewart, T.J. Multiple Criteria Decision Analysis—An Integrated Approach; Kluwer Academic Publishers: Dordrecht, The Netherlands, 2002. [Google Scholar]
- Penadés-Plà, V.; García-Segura, T.; Martí, J.V.; Yepes, V. A Review of Multi-Criteria Decision-Making Methods Applied to the Sustainable Bridge Design. Sustainability 2016, 8, 1295. [Google Scholar] [CrossRef] [Green Version]
- Eurobitume. The Eurobitume Life-Cycle Inventory for Bitumen, Version 3.0; European Bitumen Association: Brussels, Belgium, December 2019. [Google Scholar]
- Legret, M.; Pagotto, C. Evaluation of pollutant loadings in the runoff waters from a major rural highway. Sci. Total Environ. 1999, 235, 143–150. [Google Scholar] [CrossRef] [PubMed]
- Birgisdottir, H.; Gamst, J.; Christensen, T.H. Leaching of PAHs from Hot Mix Asphalt Pavements. Environ. Eng. Sci. 2007, 24, 1409–1422. [Google Scholar] [CrossRef]
- Ihs, A.; Möller, S. VTI Notat 53-2004 -Beräkningsmodell för Vinterväghållningskostnader; VTI: Linköping, Sweden, 2004. [Google Scholar]
- Swedish National Road and Transport Research Institute (VTI). VTI Slitagemodell. Available online: http://www.metodgruppen.nu/web/page.aspx?refid=127 (accessed on 8 October 2020).
- Magnusson, K.; Eliasson, K.; Fråne, A.; Haikonen, K.; Hultén, J.; Olshammar, M.; Stadmark, J.; Voisin, A. Swedish Sources and Pathways for Microplastics to the Marine Environment; Swedish Environmental Protection Agency: Stockholm, Sweden, 2016; Volume C 183. [Google Scholar]
- Erlandsson, M. Miljödata för arbetsfordon; Svenska Miljöinstitutet: Stockholm, Sweden, 2013; Volume BPI 13/1. [Google Scholar]
- CEN. EN 16757:2017—Sustainability of Construction Works—Environmental Product Declarations—Product Category Rules for Concrete and Concrete Elements; European Committee for Standardization (CEN): Brussels, Belgium, 2017. [Google Scholar]
- Aquajet Systems AB. Product sheet, Aqua Cutter 710H. Aquajet Systems AB. Available online: https://www.aquajet.se/wp-content/uploads/2014/06/leaflet_aqua-cutter-710H.pdf (accessed on 8 October 2020).
- Lindstrom, D.; Wallinder, I.O. Long-term use of galvanized steel in external applications. Aspects of patina formation, zinc runoff, barrier properties of surface treatments, and coatings and environmental fate. Environ. Monit. Assess. 2010, 173, 139–153. [Google Scholar] [CrossRef] [PubMed]
- AGA. Product Catalog. Gassvetsning, skärning, lödning och värmning. Available online: https://www.linde-gas.se/sv/images/Cutting_Welding_Catalogue_2018_SE_web_tcm586-137940.pdf (accessed on 8 October 2020).


| Characteristic | Case Study Prerequisite |
|---|---|
| Object of assessment | Bridge 6-1282-1 on Road 26, Sweden 6 m long, 9 m wide, 3 road lanes |
| Intended use of the assessment | Design concept comparison |
| Additional functions provided | - |
| Functional equivalent: | |
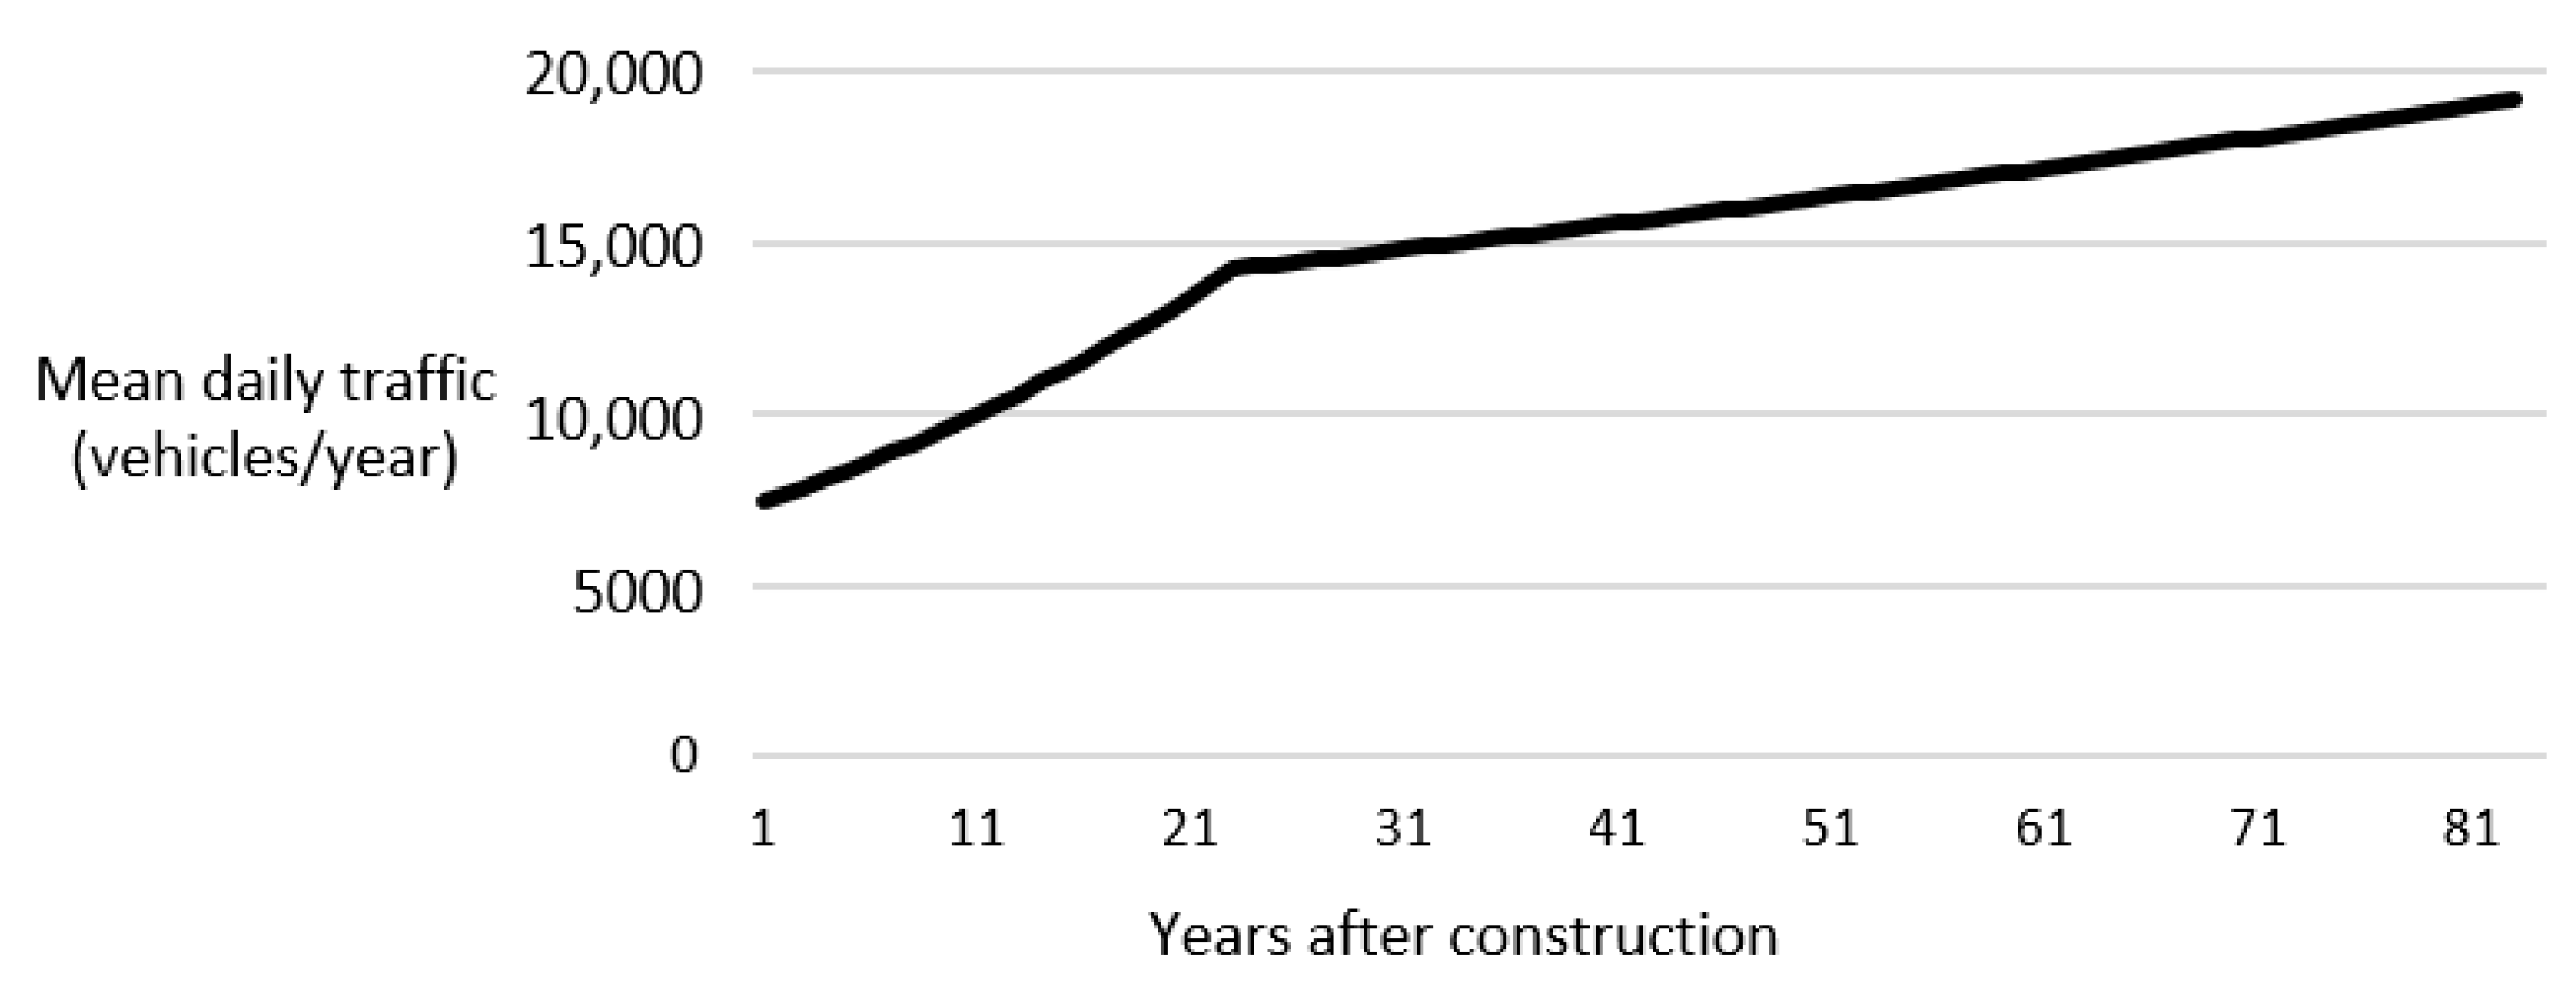
| (a) Type/use of the civil engineering works, (b) Capacity, (c) Reference study period and pattern of use, (d) Design life (required service life, RSL) | (a) Road bridge with fauna passage (b) 7200 AADT, 100 km/h (c) 80 years, see Appendix C and Appendix D (d) 80 years |
| Time of assessment in the life cycle | Detailed design/tender phase |
| Life cycle stages assessed | A1–A5, B1–B8, C1–C4, D |
| Justification of the exclusion of modules | A0 was excluded because of its insignificant impact on the sustainability performance and because it does not differ between the concepts. |
| Area of influence | Environmental, social, and economic dimensions (environmental externalities): The surroundings and people in the direct vicinity of the bridge, receiving emissions from fuel combustion and other activities during construction, use and deconstruction from passing vehicles across the length of the bridge. Economic dimension (Life cycle costs (LCC) and incomes): The users of passing vehicles on the bridge (module B8), the client of the constructed bridge (all other modules). |
| Energy and mass flows considered in the assessment | See Appendix B, Appendix C and Appendix D |
| General assumptions and scenarios used | See Appendix B, Appendix C and Appendix D |
| Sources of data for the indicators | See Appendix B, Appendix C and Appendix D |
| Statement about whether data are specific or generic | See Appendix A |
| Reference year for the cost data | 2019 |
| Dimension | Indicator | Normalization Factor (NF) | Weighting Factor (%) |
|---|---|---|---|
| Environmental | Acidification potential | 55.6 | 8.43 |
| Eco-toxicity potential (freshwater) | 42,683 | 2.61 | |
| Potential soil quality index | 819,498 | 10.80 | |
| Global warming potential total (fossil + biogenic + luluc) | 8096 | 28.63 | |
| Abiotic depletion potential for non-fossil resources | 0.0636 | 10.27 | |
| Abiotic depletion potential for fossil resources | 65,004 | 11.31 | |
| Eutrophication potential (freshwater) | 1.61 | 3.81 | |
| Eutrophication potential (marine) | 19.5 | 4.02 | |
| Eutrophication potential (terrestrial) | 177 | 5.04 | |
| Ozone depletion potential | 0.0536 | 8.58 | |
| Photochemical ozone creation potential | 40.6 | 6.50 | |
| Social | Potential ionizing radiation—human health | 4220 | 18.94 |
| Human toxicity potential—cancer effects | 0.0000169 | 8.05 | |
| Human toxicity potential—non-cancer effects | 0.000230 | 6.96 | |
| Particulate matter emissions | 0.000595 | 33.88 | |
| Water user deprivation potential | 11,469 | 32.17 |
| Dimension | Category | Indicator Name | Abbreviation | Unit of Measurement |
|---|---|---|---|---|
| Environmental | Acidification | Acidification potential | AP | mol H + eq |
| Biodiversity | Eco-toxicity potential (freshwater) | ETP-fw | CTUe | |
| Potential soil quality index | SQP | Dimensionless | ||
| Climate change | Global warming potential total (fossil + biogenic + luluc) | GWP-total | kg CO2 eq | |
| Depletion of abiotic resources—minerals and metals | Abiotic depletion potential for non-fossil resources | ADPE | kg Sb eq | |
| Depletion of abiotic resources—fossil fuels | Abiotic depletion potential for fossil resources | ADPF | MJ, net calorific value | |
| Eutrophication | Eutrophication potential (freshwater) | EP-freshwater | kg P eq | |
| Eutrophication potential (marine) | EP-marine | kg N eq | ||
| Eutrophication potential (terrestrial) | EP-terrestrial | mol N eq | ||
| Ozone depletion | Ozone depletion potential | ODP | kg CFC 11 eq | |
| Photochemical ozone creation | Photochemical ozone creation potential | POCP | kg NMVOC eq | |
| Social | Health and comfort | Potential ionizing radiation—human health | PIR | kBq U235 eq |
| Human toxicity potential—cancer effects | HTP c | CTUh | ||
| Human toxicity potential—non-cancer effects | HTP nc | CTUh | ||
| Particulate matter emissions | PM | Disease incidence | ||
| Water user deprivation potential | WDP | m3 world deprived eq | ||
| Economic | Life cycle economic balance | LCC and incomes | - | Euro |
| External cost | Environmental externalities | - | Euro |
| Indicator | A0 | A1–A3 | A4–A5 | B1–B5 | B6–B7 | B8 | C1–C4 | D |
|---|---|---|---|---|---|---|---|---|
| AP | MNA | 0.78 | 0.57 | 0.049 | 0 | 4.2 | 0.29 | −0.18 |
| ETP-fw | MNA | 1780 | 1642 | 133 | 0 | 4063 | 380 | −333 |
| SQP | MNA | 1002 | 7588 | 22 | 0 | 22,083 | 167 | −579 |
| GWP-total | MNA | 313 | 172 | 12 | 0 | 234 | 47 | −70 |
| ADPE | MNA | 2.1 × 10⁻⁴ | 1.6 × 10⁻⁵ | 4.4 × 10⁻⁶ | 0 | 5.4 × 10⁻⁵ | 3.7 × 10⁻⁶ | −1.0 × 10⁻⁴ |
| ADPF | MNA | 3740 | 2344 | 230 | 0 | 5229 | 584 | −892 |
| EP-freshwater | MNA | 5.5 × 10⁻⁴ | 5.6 × 10⁻⁴ | 2.6 × 10⁻⁵ | 0 | 3.110−2 | 1.1 × 10⁻⁴ | −2.3 × 10⁻⁴ |
| EP-marine | MNA | 0.24 | 0.25 | 0.015 | 0 | 1.68 | 0.10 | −0.05 |
| EP-terrestrial | MNA | 2.61 | 2.82 | 0.17 | 0 | 20.4 | 1.1 | −0.5 |
| ODP | MNA | 6.9 × 10⁻¹¹ | 2.6 × 10⁻¹¹ | 3.1 × 10⁻¹¹ | 0 | 4.9 × 10⁻¹⁰ | 8.5 × 10⁻¹⁴ | −3.5 × 10⁻¹³ |
| POCP | MNA | 0.64 | 0.71 | 0.046 | 0 | 2.7 | 0.28 | −0.14 |
| PIR | MNA | 60 | 3.1 | 0.57 | 0 | 148.5 | 0.39 | −13 |
| HTP c | MNA | 1.8 × 10⁻⁶ | 5.6 × 10⁻⁸ | 1.2 × 10⁻⁸ | 0 | 7.1 × 10⁻⁷ | 2.9 × 10⁻⁸ | −5.8 × 10⁻⁸ |
| HTP nc | MNA | 4.8 × 10⁻⁶ | 2.0 × 10⁻⁶ | 4.3 × 10⁻⁷ | 0 | 1.1 × 10⁻⁴ | 2.9 × 10⁻⁶ | −6.9 × 10⁻⁷ |
| PM | MNA | 1.5 × 10⁻⁵ | 1.2 × 10⁻⁵ | 5.8 × 10⁻⁷ | 0 | 4.1 × 10⁻⁵ | 2.4 × 10⁻⁶ | −3.2 × 10⁻⁶ |
| WDP | MNA | 71 | 11 | 0.86 | 0 | 109 | 6.3 | −16 |
| LCC and incomes | MNA | 210 | 287 | 18 | 0 | 86 | 12 | −1.1 |
| Environmental externalities | MNA | 123 | 56 | 2.0 | 0 | 31 | 1.4 | −7.8 |
| Dimension | Indicator (Unit) | A0 | A1–A3 | A4–A5 | B1–B7 | B8 | C1–C4 | D |
|---|---|---|---|---|---|---|---|---|
| Environmental | All (dimensionless) | MNA | 2.3 | 1.6 | 0.12 | 4.4 | 0.43 | −1.5 |
| Social | All (dimensionless) | MNA | 2.3 | 0.82 | 0.057 | 6.9 | 0.26 | −1.2 |
| Economic | LCC and incomes (Euro) | MNA | 210 | 287 | 18 | 86 | 12 | −1.1 |
| Environmental externalities (Euro) | MNA | 123 | 56 | 2.0 | 31 | 1.4 | −7.8 |
| Dimension | Indicator (Unit) | A0 | A1–A3 | A4–A5 | B1–B7 | B8 | C1–C4 | D |
|---|---|---|---|---|---|---|---|---|
| Environmental | All (dimensionless) | MNA | 5.0 | 1.4 | 0.078 | 4.4 | 0.44 | −2.1 |
| Social | All (dimensionless) | MNA | 1.6 | 0.63 | 0.029 | 6.9 | 0.25 | −1.4 |
| Economic | LCC and incomes (Euro) | MNA | 295 | 99 | 16 | 86 | 10 | −0.8 |
| Environmental externalities (Euro) | MNA | 1 087 | 52 | 1.5 | 31 | 1.3 | −14 |
| Indicator | A0 | A1–A3 | A4–A5 | B1–B5 | B6–B7 | B8 | C1–C4 | D |
|---|---|---|---|---|---|---|---|---|
| AP | MNA | 0.95 | 0.56 | 0.031 | 0 | 4.2 | 0.34 | −0.8 |
| ETP-fw | MNA | 1773 | 1571 | 89 | 0 | 4063 | 360 | −1348 |
| SQP | MNA | 977 | 781 | 13 | 0 | 22,083 | 156 | −644 |
| GWP-total | MNA | 369 | 164 | 9.1 | 0 | 233 | 42 | −309 |
| ADPE | MNA | 1.5 × 10⁻² | 1.4 × 10⁻⁵ | 7.5 × 10⁻⁷ | 0 | 5.4 × 10⁻⁵ | 3.5 × 10⁻⁶ | −2.9 × 10⁻⁵ |
| ADPF | MNA | 4667 | 2210 | 149 | 0 | 5222 | 554 | −3646 |
| EP-freshwater | MNA | 6.3 × 10⁻⁴ | 5.0 × 10⁻⁴ | 1.2 × 10⁻⁵ | 0 | 3.1 × 10⁻² | 9.8 × 10⁻⁵ | −4.1 × 10⁻⁴ |
| EP-marine | MNA | 0.24 | 0.25 | 0.0089 | 0 | 1.7 | 0.12 | −0.20 |
| EP-terrestrial | MNA | 2.6 | 2.8 | 0.10 | 0 | 20 | 1.4 | −2.2 |
| ODP | MNA | 3.8 × 10⁻¹¹ | 2.6 × 10⁻¹¹ | 2.3 × 10⁻¹⁴ | 0 | 4.9 × 10⁻¹⁰ | 8.5 × 10⁻¹⁴ | −1.5 × 10⁻¹² |
| POCP | MNA | 0.69 | 0.70 | 0.028 | 0 | 2.7 | 0.36 | −0.59 |
| PIR | MNA | 53 | 2.2 | 0.39 | 0 | 149 | 0.39 | −43 |
| HTP c | MNA | 2.9 × 10⁻⁷ | 3.3 × 10⁻⁸ | 9.4 × 10⁻⁹ | 0 | 7.1 × 10⁻⁷ | 2.8 × 10⁻⁸ | −3.0 × 10⁻⁷ |
| HTP nc | MNA | 4.4 × 10⁻⁶ | 1.9 × 10⁻⁶ | 1.4 × 10⁻⁷ | 0 | 1.1 × 10⁻⁴ | 2.9 × 10⁻⁶ | −2.6 × 10⁻⁶ |
| PM | MNA | 1.7 × 10⁻⁵ | 9.6 × 10⁻⁶ | 2.9 × 10⁻⁷ | 0 | 4.1 × 10⁻⁵ | 2.5 × 10⁻⁶ | −1.5 × 10⁻⁵ |
| WDP | MNA | 53 | 1.9 | 0.47 | 0 | 109 | 2.5 | −48 |
| LCC and incomes | MNA | 295 | 99 | 16 | 0 | 86 | 10 | −0.8 |
| Environmental externalities | MNA | 1087 | 52 | 1.5 | 0 | 31 | 1.3 | −14 |
| Dimension, Indicator (unit) | CSF Bridge | SSC Bridge | ||
|---|---|---|---|---|
| A–C | D | A–C | D | |
| Environmental, all (dimensionless) | 4.4 | −1.5 | 7.0 | −2.1 |
| Social, all (dimensionless) | 3.5 | −1.2 | 2.5 | −1.4 |
| Economic, LCC and incomes (Euro) | 526 | −1.1 | 421 | −0.8 |
| Economic, Environmental externalities (Euro) | 182 | −7.9 | 1 142 | −14 |
Publisher’s Note: MDPI stays neutral with regard to jurisdictional claims in published maps and institutional affiliations. |
© 2020 by the authors. Licensee MDPI, Basel, Switzerland. This article is an open access article distributed under the terms and conditions of the Creative Commons Attribution (CC BY) license (http://creativecommons.org/licenses/by/4.0/).
Share and Cite
Ek, K.; Mathern, A.; Rempling, R.; Brinkhoff, P.; Karlsson, M.; Norin, M. Life Cycle Sustainability Performance Assessment Method for Comparison of Civil Engineering Works Design Concepts: Case Study of a Bridge. Int. J. Environ. Res. Public Health 2020, 17, 7909. https://0-doi-org.brum.beds.ac.uk/10.3390/ijerph17217909
Ek K, Mathern A, Rempling R, Brinkhoff P, Karlsson M, Norin M. Life Cycle Sustainability Performance Assessment Method for Comparison of Civil Engineering Works Design Concepts: Case Study of a Bridge. International Journal of Environmental Research and Public Health. 2020; 17(21):7909. https://0-doi-org.brum.beds.ac.uk/10.3390/ijerph17217909
Chicago/Turabian StyleEk, Kristine, Alexandre Mathern, Rasmus Rempling, Petra Brinkhoff, Mats Karlsson, and Malin Norin. 2020. "Life Cycle Sustainability Performance Assessment Method for Comparison of Civil Engineering Works Design Concepts: Case Study of a Bridge" International Journal of Environmental Research and Public Health 17, no. 21: 7909. https://0-doi-org.brum.beds.ac.uk/10.3390/ijerph17217909