1. Introduction
Occupational Health and Safety (OHS) in the construction industry, has not seen much improvement; thus, fatal and non-fatal occupational injuries occur frequently [
1,
2,
3,
4]. Due to the complicated nature of construction industry—continual changes, use of many different resources, temporary and transitionary employment, and harsh working environments—and involvement of various stakeholders, the number of occupational injuries in this industry is extremely high [
2,
5,
6]. Given that workers play a key role in the construction industry, some human-related factors such as physical and mental health of the workers can play a pivotal role in occupational safety [
7].
When it comes to OHS of workers, work-related injuries vary across industries and countries [
8,
9,
10]. Countries with clear OHS regulations and requirements are quite different from those still in the process of adopting them. Taking Turkey as an example, the construction industry reported an average fatality rate of 22.35 in 100,000 workers, while figures for the manufacturing industry were around 6.2 between 2007 and 2016 [
11]. Even more, the average fatality rate between 1988 and 2011 had jumped to 25.5 in the construction industry in Turkey [
12]. Another developing country, whose construction industry constitutes a major proportion of fatal- and non-fatal accidents recorded among all industries, is Malaysia. Though the construction industry has recently evolved, thanks to the use of modern technology and equipment, yet the rate of accidents on construction sites has not noticeably decreased [
13]. Hamid et al. [
14] asserted that there was 125% increase of fatal injuries on construction sites in Malaysia from 2009 to 2015. Similarly, according to Muhamad Zaini et al. [
13], fatalities on construction sites experienced an approximately 30% rise over a four-year period, starting from the year 2015. In contrast to developing counties, the status quo in developed countries is significantly better. Taking the US as an example, the fatal and non-fatal reported in 2017 were 3.1 per 100 people and 5.35 per 5190 people, respectively [
11].
With the above in mind, constant improvement of current practices of the construction industry in developing countries should be high on the agenda for practitioners and policymakers alike. One remedial solution would be adopting appropriate and prudent assessment strategies [
15]. Through having such propitious safety risk assessment, hazards and the ensuing accidents that pose threats to workers can successfully be identified, analyzed, and evaluated [
16]. Considering this, various methods and techniques have been developed for risk analysis [
17,
18,
19,
20,
21,
22].
However, almost all available assessment models depend on considering two parameters, namely, probability and severity; these cannot lead to comprehensive assessments [
23]. In addition, the use of raw numbers is a source of inconsistency, which cannot capture experts’ subjective views for conducting the assessment stage. Fuzzy Inference System (FIS), which maps the truth of any statement to a matter of a degree can overcome these shortcomings. Yet, one disadvantage of traditional FIS is that it often requires users to design the rules, which is impractical [
24]. To solve this problem, Adaptive Neuro-Fuzzy Inference System (ANFIS) was developed by Jiang et al. [
25], taking advantage of an artificial neural network (ANN) that is designed for learning characteristics and rules from large amount of data by adjusting the coefficients in the networks and reduce the error of output. Later on, ANFIS has been well-explored and widely adopted in safety management with proven long-lasting effects [
26,
27,
28,
29].
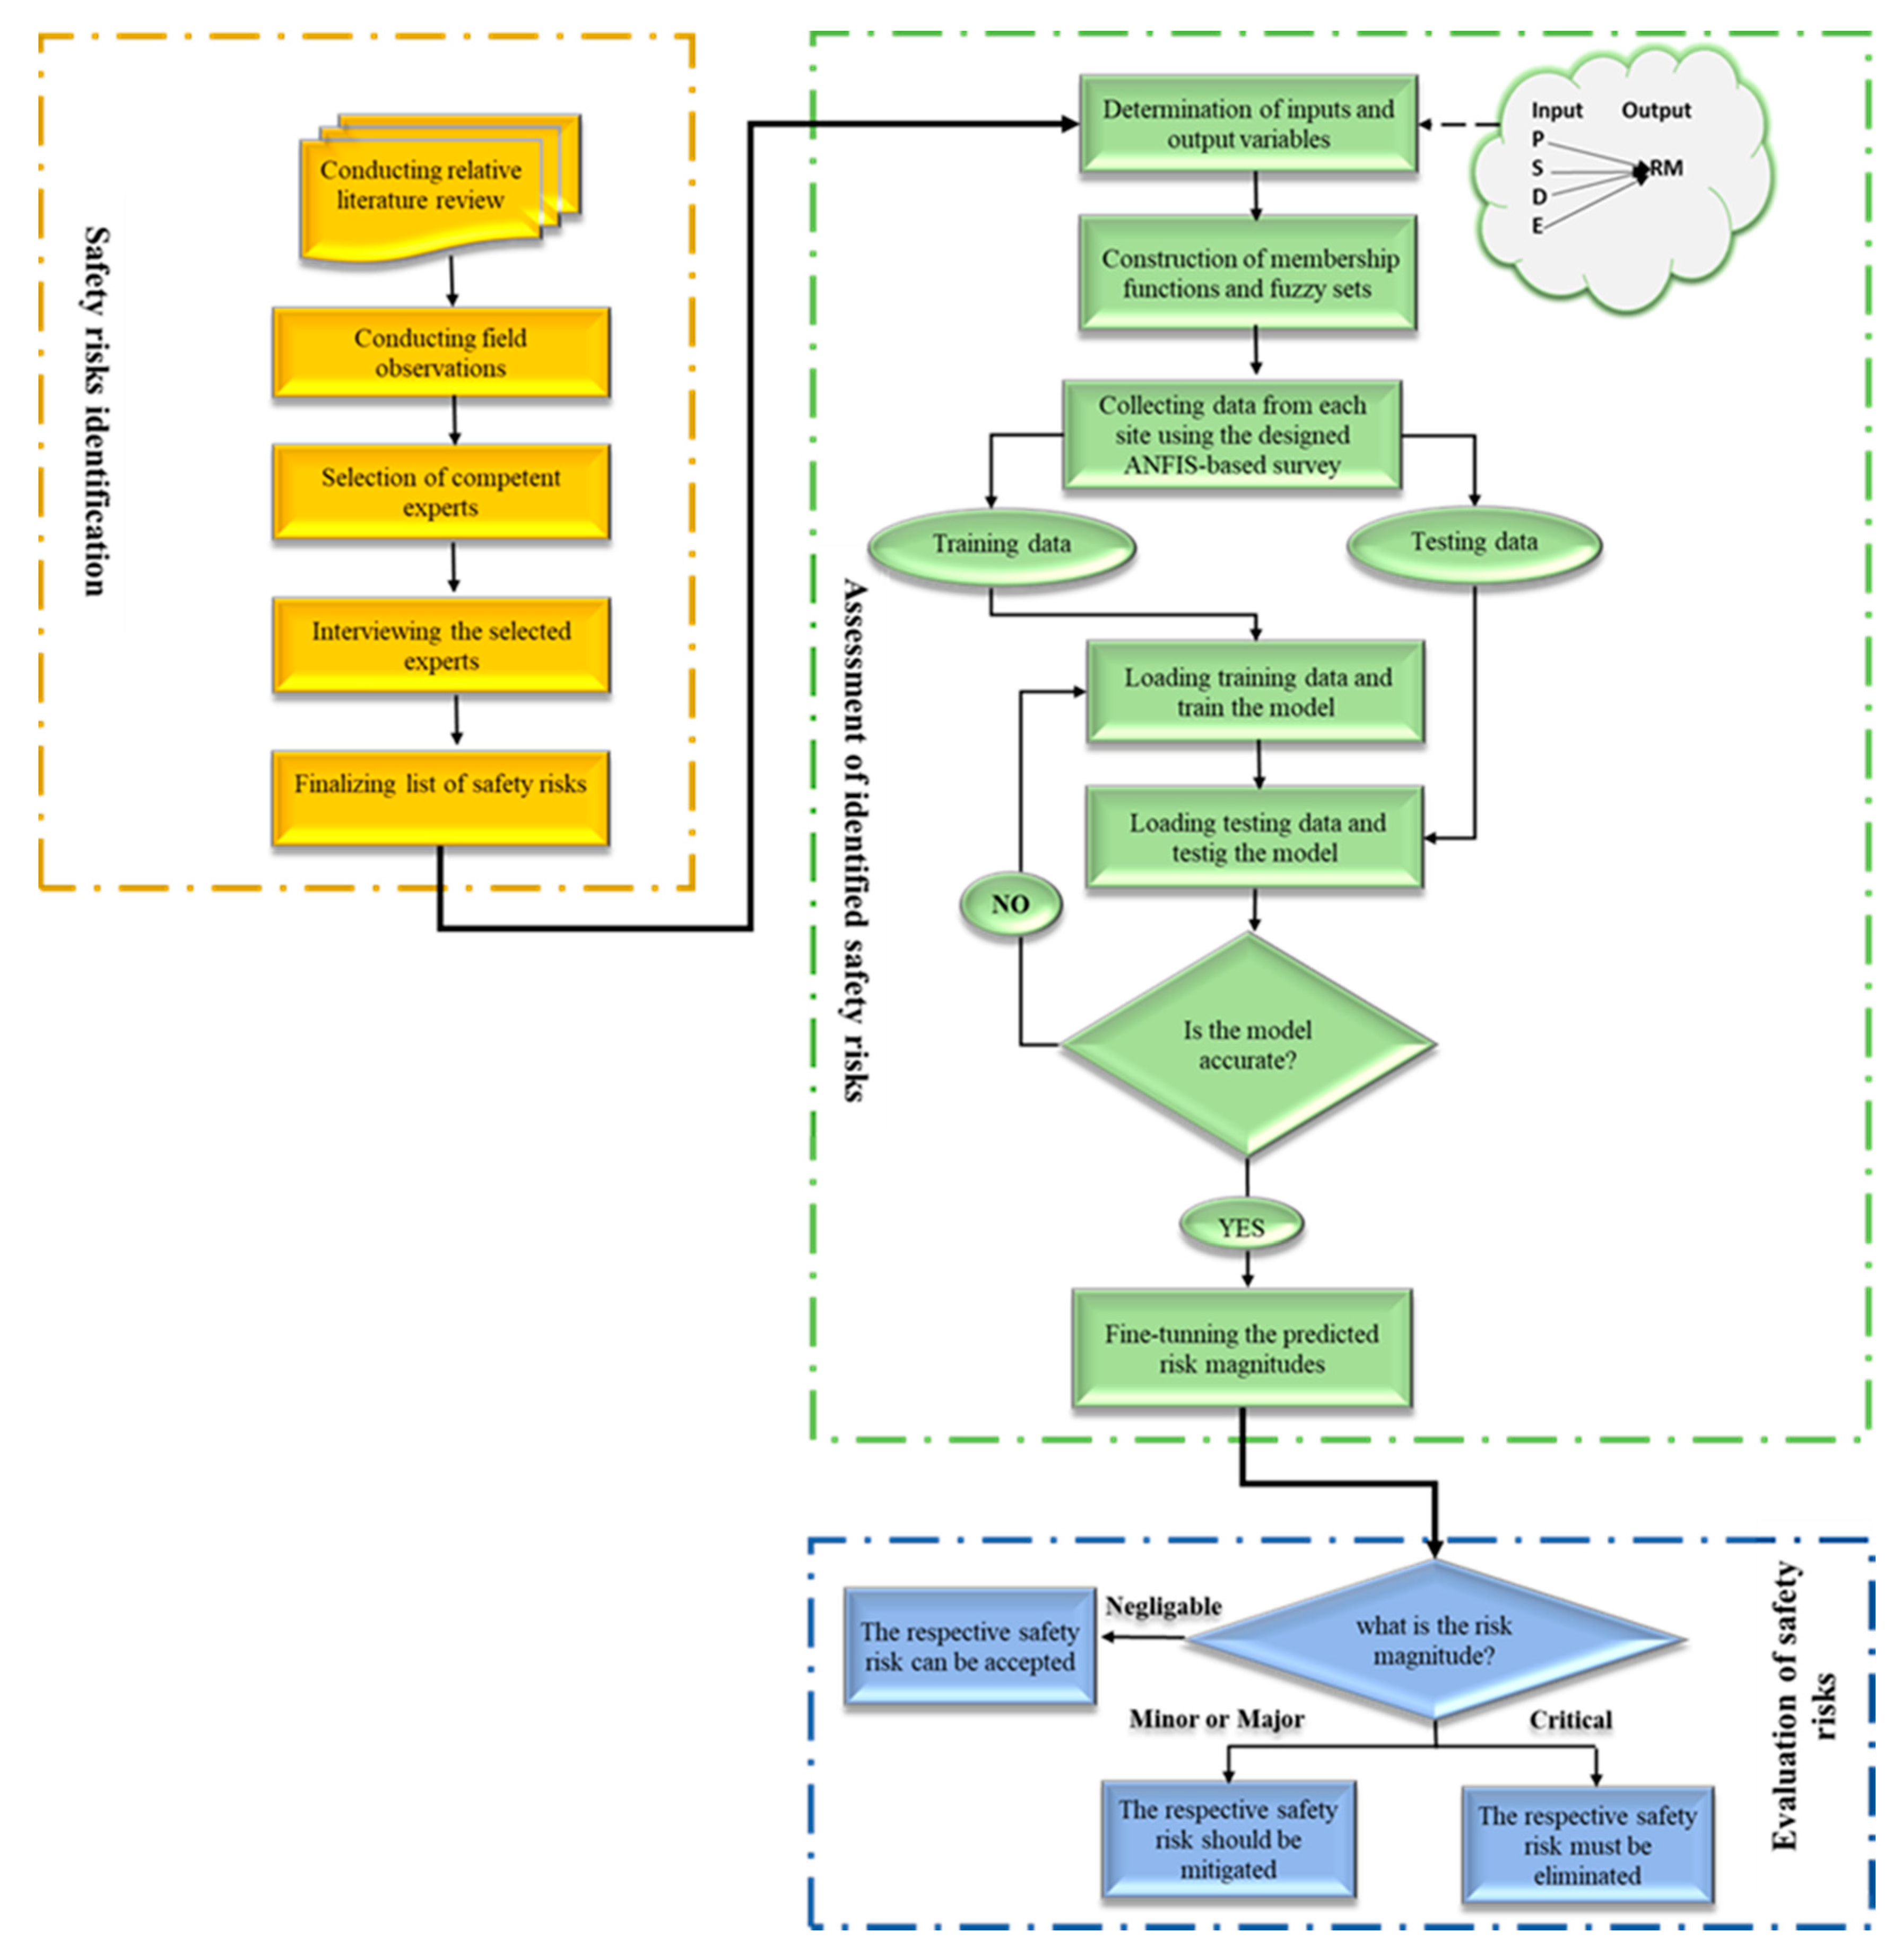
Despite the above developments, to date, there has not been any predictive safety risk assessment developed hitherto, through which identified risks can prudently be assessed using the integrated ANFIS method. Such scarcity leads to impairing the views of concerned safety professionals in dealing with the identified safety risks at later stages. To address these things, in this paper, an Ensemble Predictive Safety Risk Assessment Model (EPSRAM), based on the integration of neural networks with fuzzy inference systems, is developed to prudently assess the OHS risks related to workers on construction sites. Practicality of EPSRAM is showcased in applying it to several Malaysian construction projects. Following objectives are formulated in developing EPSRAM:
To fully identify crucial safety risks on construction sites, through interviewing several qualified experts; and
To analyze the magnitude of identified safety risks, and accordingly evaluate them using the proposed ANFIS method.
Findings reveal that where crucial safety risks are identified in construction sites, safety professionals will be provided with a prudent illustration of magnitudes, as well as, their suitable evaluations in an interactive and user-friendly way using the developed EPSRAM in the study. In other words, the major goal of the developed EPSRAM is to assist the concerned safety decision makers in predicting: (1) the magnitude of safety risks identified, and (2) the suitable evaluation strategy for dealing with the safety risks analyzed.
The remainder of this paper is designed as follows.
Section 2 provides a brief review of previous studies on the topic, and
Section 3 delves scrupulously into EPRAM, as developed.
Section 4 is allocated to share the findings accompanied by discussions.
Section 5 is for acknowledging limitations and offering recommendations for future studies, whereas concluding remarks are presented in
Section 6.
2. Literature Review
Assessing safety risk in construction sites has received much attention from researchers over the past decade. Hallowell [
30] proposes a new model that evaluates safety and health risk of construction processes and can be used as a systematic method for strategic selection of safety program elements, with a database of industry experts’ experience in construction risk prevention [
30]. The author quantifies construction risk with probability and severity, to evaluate the risk of construction activities or safety program elements. With rapid advancement of computing power and related methods in recent years, different models and programs on assessing construction risk are introduced with improved accuracy. For example, Aminbakhsh et al. [
18] proposed a security risk assessment framework based on the safety cost theory (COS) model and analytic hierarchy process (AHP), to address construction budget overrun, without compromising worker’s safety [
18]. Since construction activities are interrelated in several aspects and executed simultaneously, Esmaeili and Hallowell [
31] developed a decision support system to assess the safety level of workers with Delphi method. In a study conducted by Sousa et al. [
32], a model was developed for the enhancement of workers’ safety for resource management. A statistic model was developed by Isaac and Edrei [
33] to monitor the exposure of workers for various activities. In order to develop this model, they used a series of data related to the duration of activities.
Fatalities have been reported as a safety serious issue related to construction activities; as a result, several research studies have focused on this issue. For instance, Malekitabar et al. [
34] investigated the risk of accidents—considering probability and severity—by identifying five-level safety drivers. Tixier et al. [
35] developed a model to analyze the safety risks by Kernel density estimators and Copulas, while Raviv et al. [
36] especially analyzed accidents that occur in using tower crane. When it comes to the adoption of sustainable approaches in the construction industry, safety requirements need to be met to ensure every possible new safety risk is carefully considered. Therefore, several research studies have been conducted to assess safety risks using sustainable techniques (e.g., Dewlaney et al. [
37], Karakhan and Gambatese [
38], Hwang et al. [
39], and Zhang and Mohandes [
40]).
In another stream of research, probabilistic approaches have been widely used for the purpose of safety risk assessment in the construction industry. For example, Mahdiyar et al. [
41] used Monte Carlo simulation for the safety assessment of slopes under seismic conditions. However, this approach requires a large dataset, which is not typically available on worker’s safety. As a result, the use of experts’ knowledge and fuzzy set theory has been recommended rather than statistical- and probabilistic- based models [
42,
43], to deal with the insufficiency of and uncertainties of data. There are many studies on developing risk assessment models or decision support systems, considering different conditions and parameters and using variety of methods. One example is the integration of Pythagorean fuzzy analytic hierarchy process with different Multi-Criteria Decision-Making (MCDM) methods. (e.g., [
15,
44,
45,
46,
47,
48,
49,
50,
51,
52,
53]).
Despite extensive research and improvements in recent years, uncertainty is usually the main cause of model failures. Besides, collecting data from construction industry experts is still problematic, given that any data collected from experts are exposed to subjective judgments, with high variance. Therefore, a model that can accurately predict construction risks is much needed. As mentioned above, a study in which a predictive model for safety risk assessment is developed is nonexistent. More importantly, the topic of safety risk assessment in Malaysia has not received adequate attention from researchers, despite the cruciality of this matter in developing countries like Malaysia. Thus, developing a comprehensive predictive assessment model is very relevant, particularly to the Malaysian context, where practitioners still rely on traditional assessment methods. As such, this study intends to propose a model for prediction of occupational risks that affect construction workers based on experts’ perceptions using ANFIS method. Through this—proposed EPSRAM—construction managers can assess the risk factors related to construction projects with higher efficiency compared to conventional risk assessment methods, which involve a large number of subjective judgments from construction project experts.
4. Results and Discussion
As discussed, this study delves into the assessment of safety risks that pose threats to construction workers in Kuala Lumpur. For the sake of brevity, only the main results are reported hereinafter. Firstly, through interviewing the qualified experts selected for the study, a comprehensive pool of crucial safety risks was developed, as tabulated in
Table 7. Subsequently, based on the data collected from the chosen construction sites (which are related to the assessment of safety risk regarding the four determined parameters), several fuzzy-based rules were created using Sugeno-type FIS method.
Table 8 summarizes the data from one of the selected construction sites. To check and approve the consistency of results, Cronbach alpha was used as recommended by Zhang and Mohandes [
40], as a result of which responses were found to be of good consistency—the calculated alpha equals 0.7973. With the consistency of collected data established, four rules were then built up based on the variables assigned to the defined safety risk. To take SR1 as an example, the following rules were created in MATLAB (Version 2017b): If P is
, S is
, E is
and E is
, then
. Similarly, the pertinent rules for other safety risks on each construction site were created.
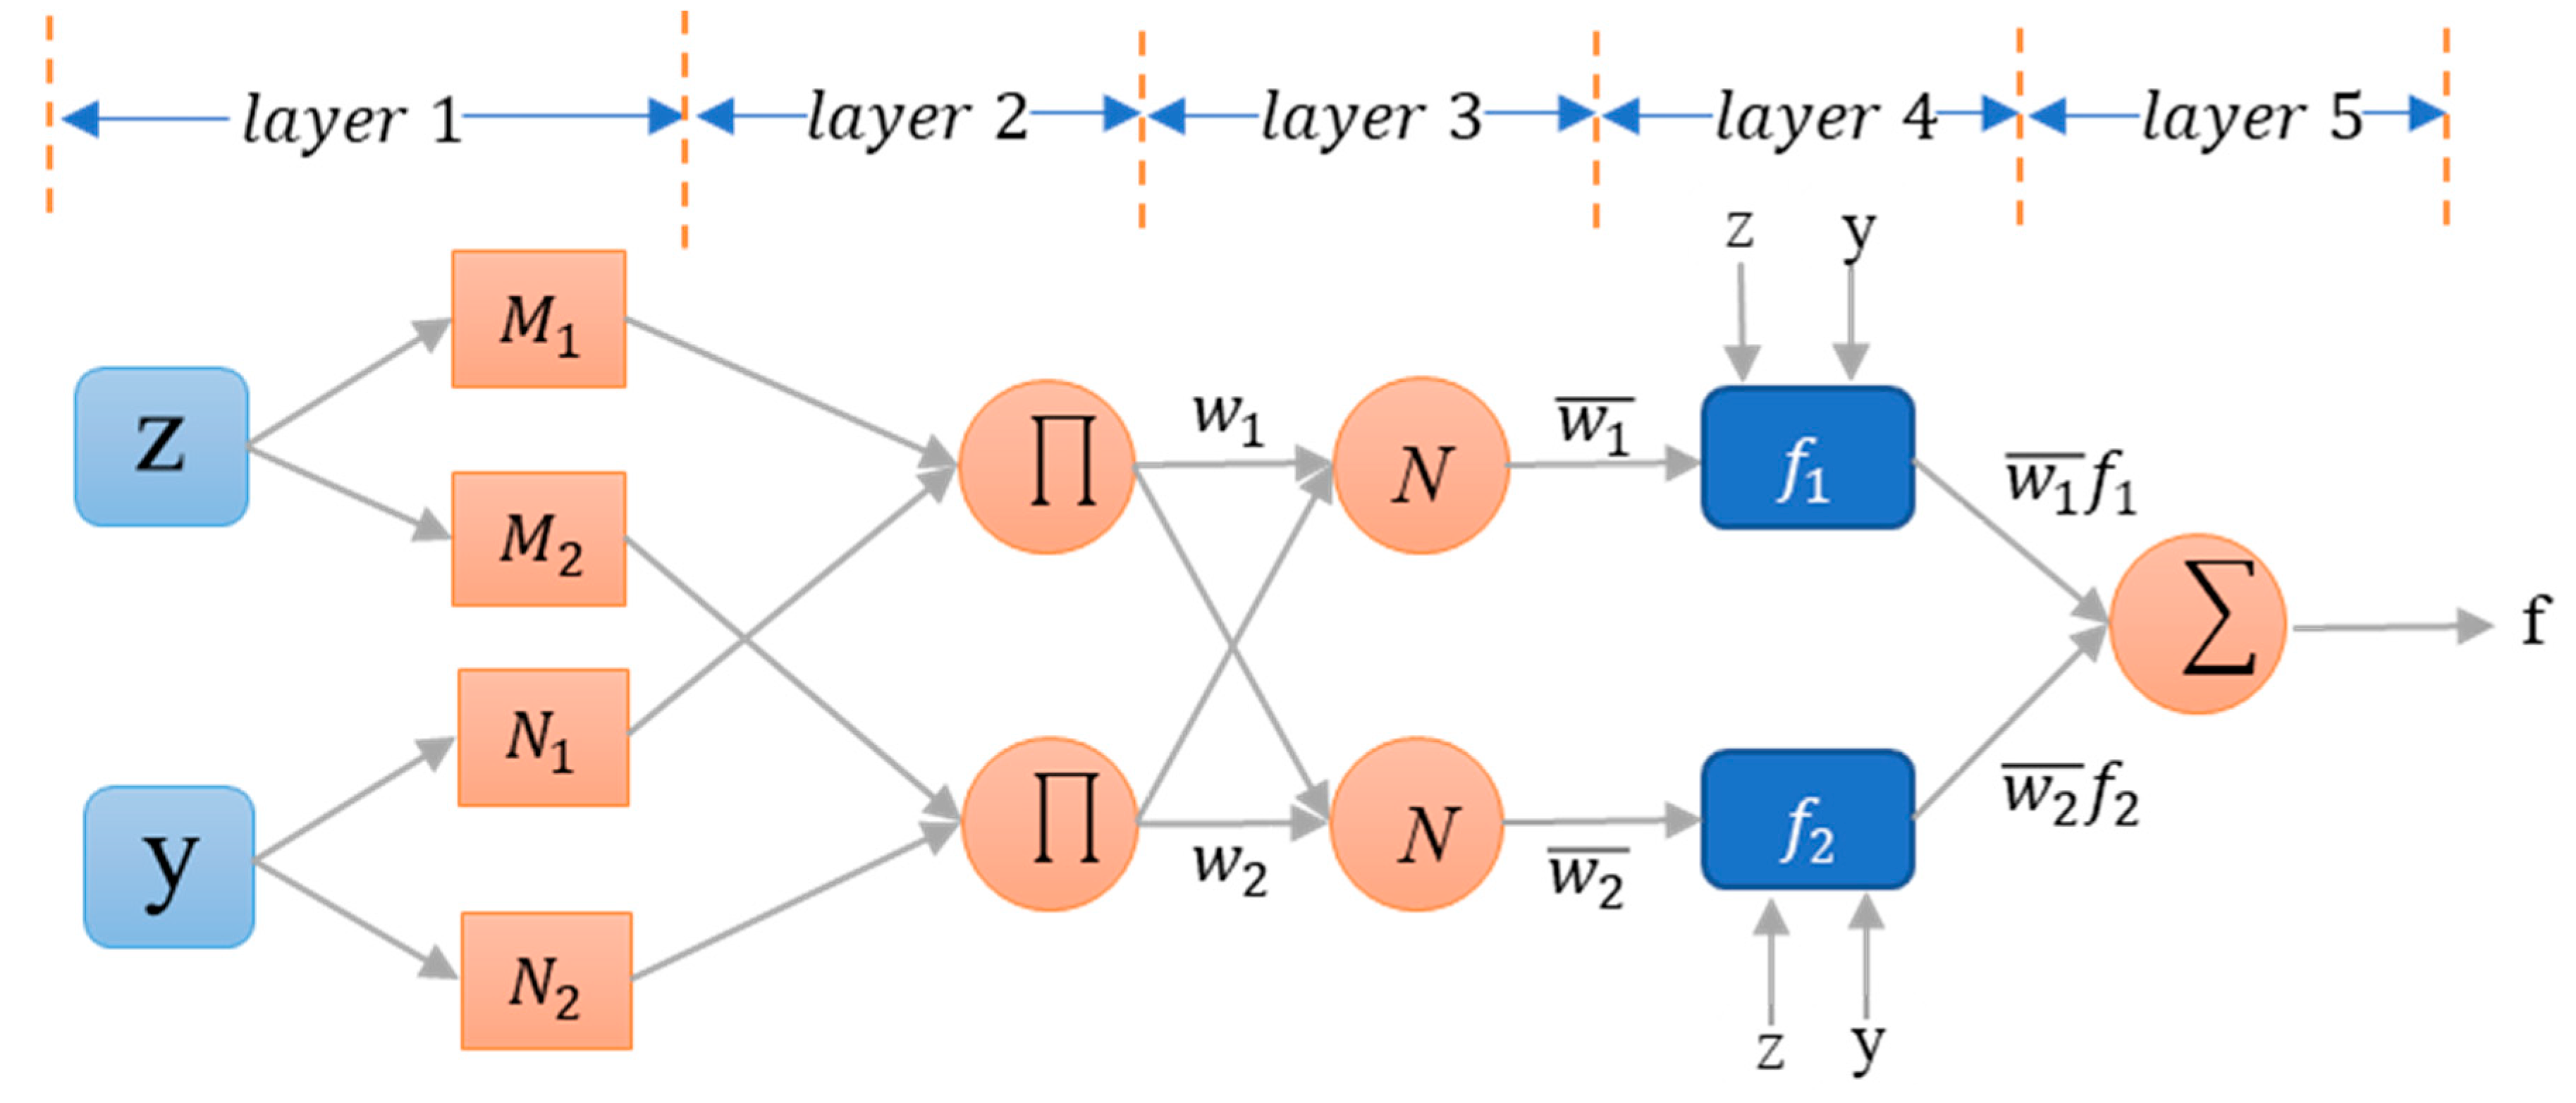
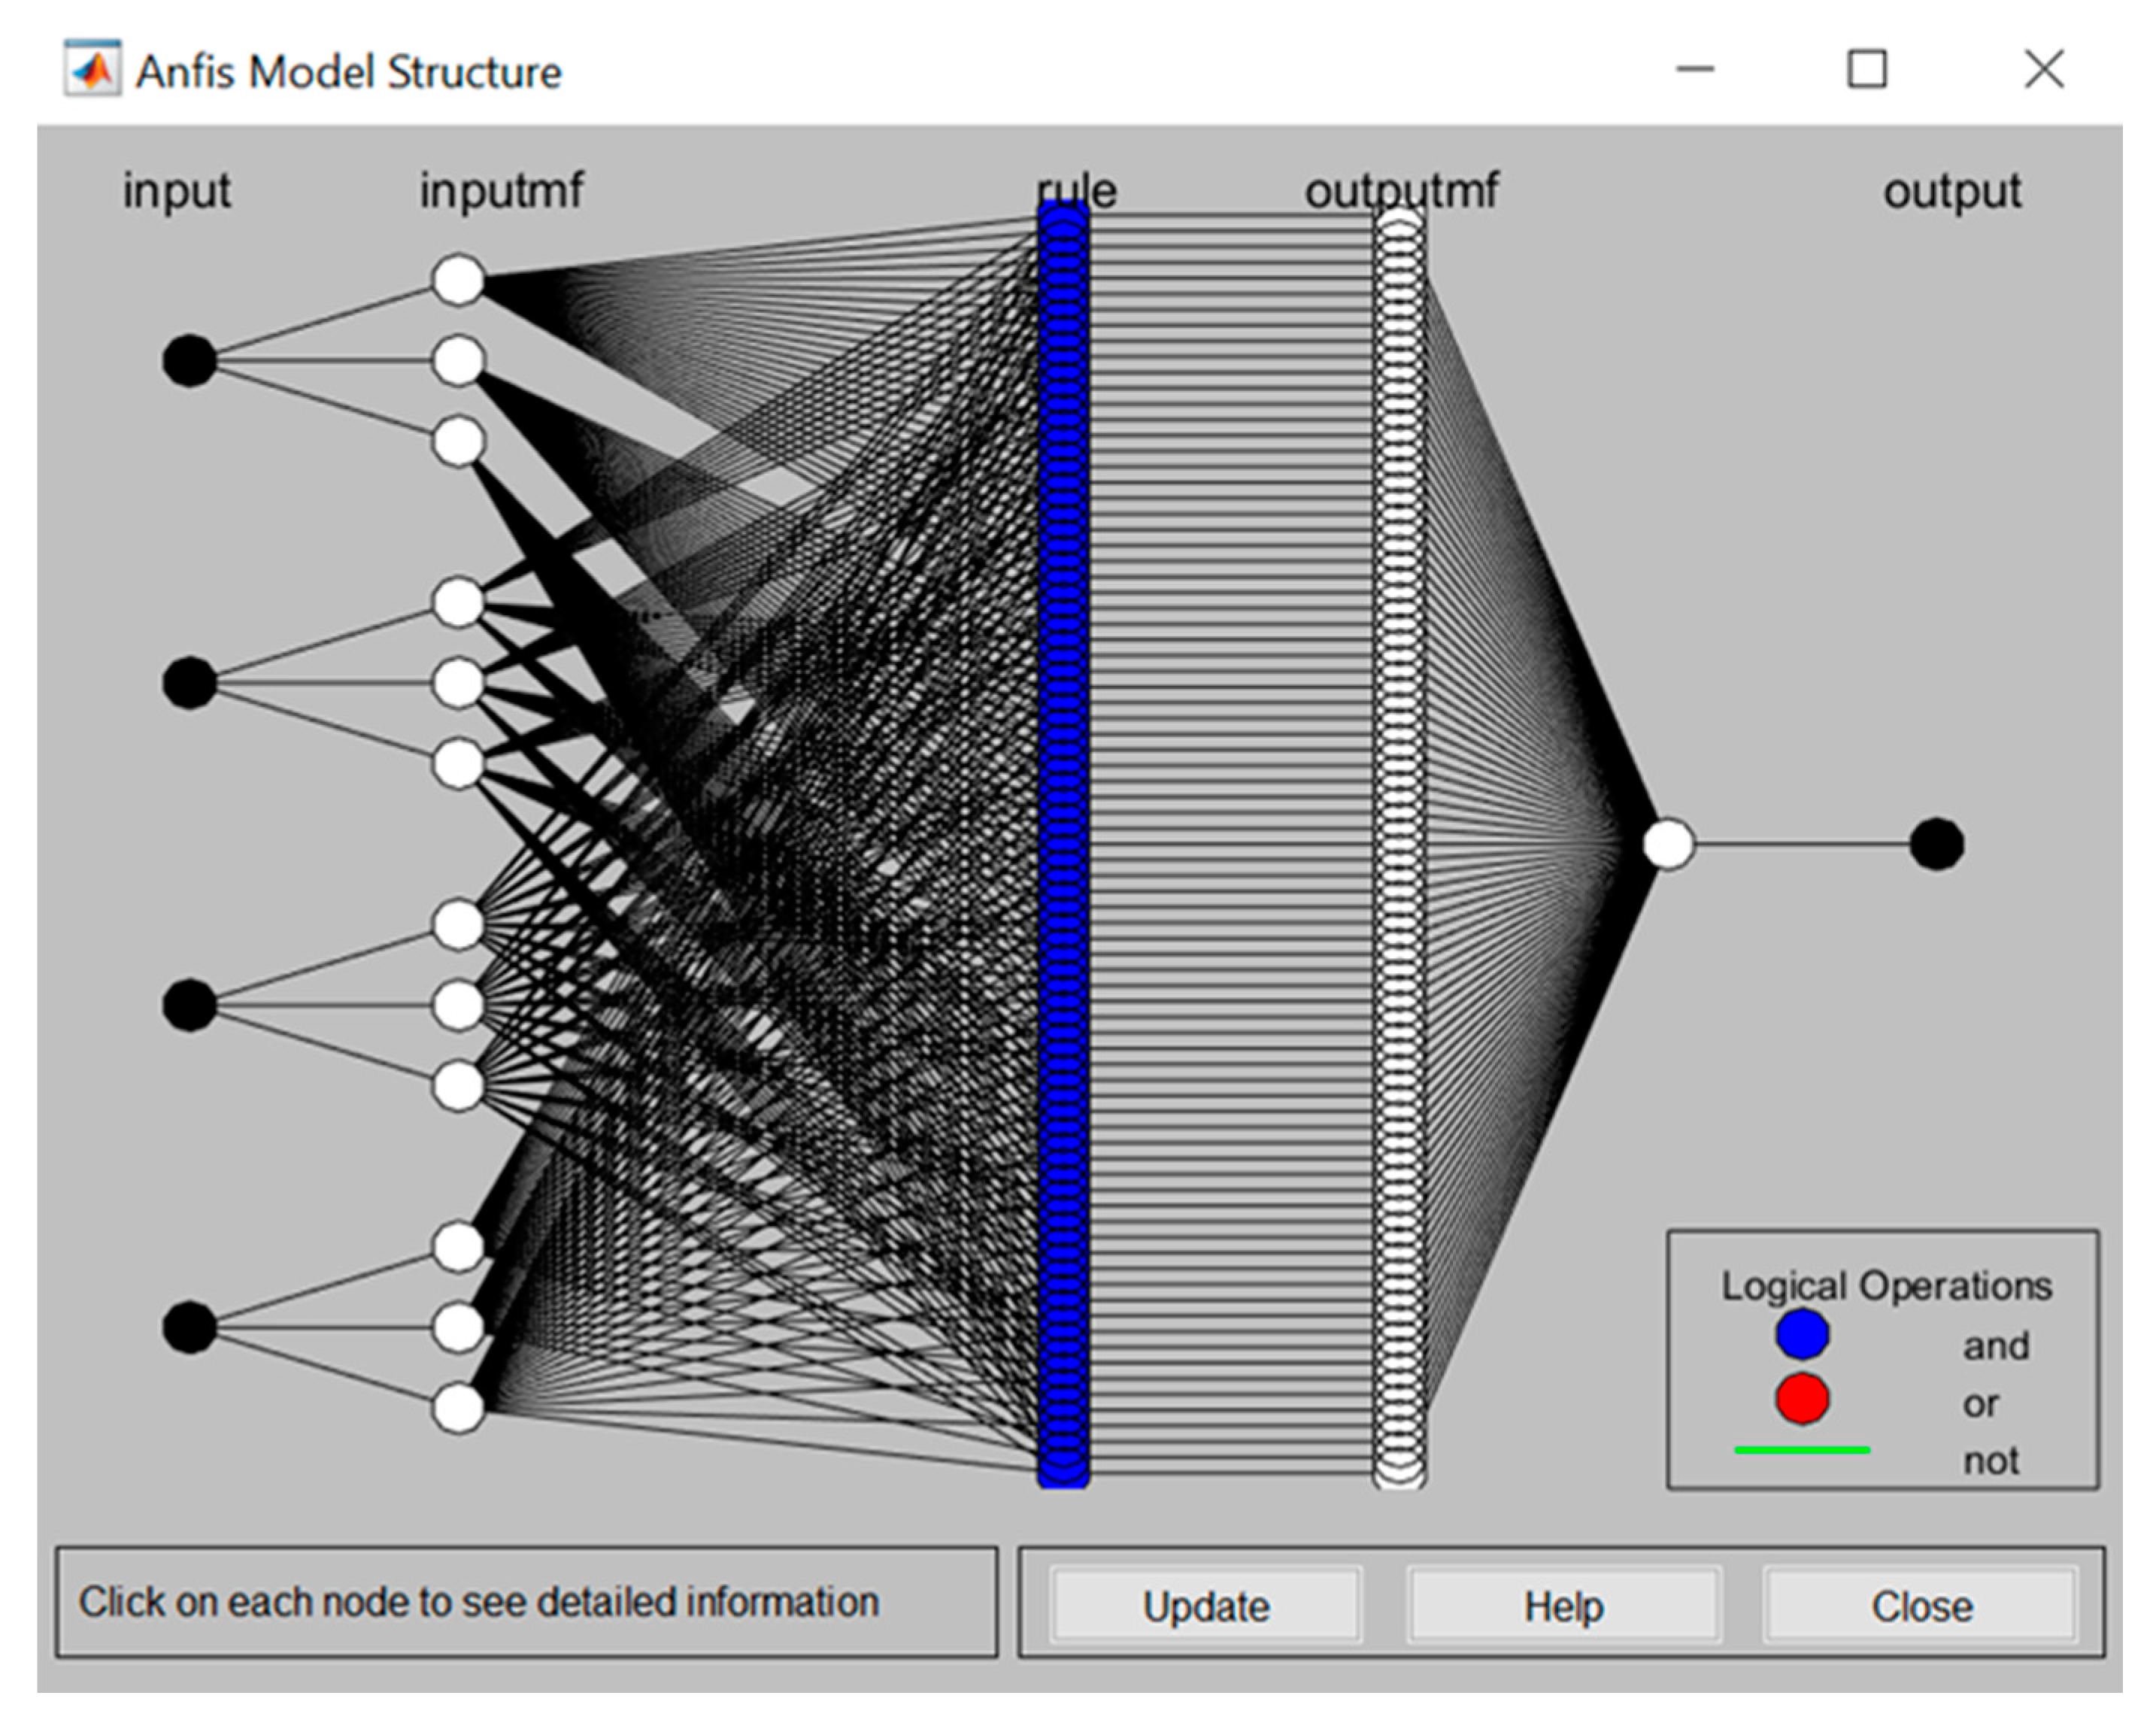
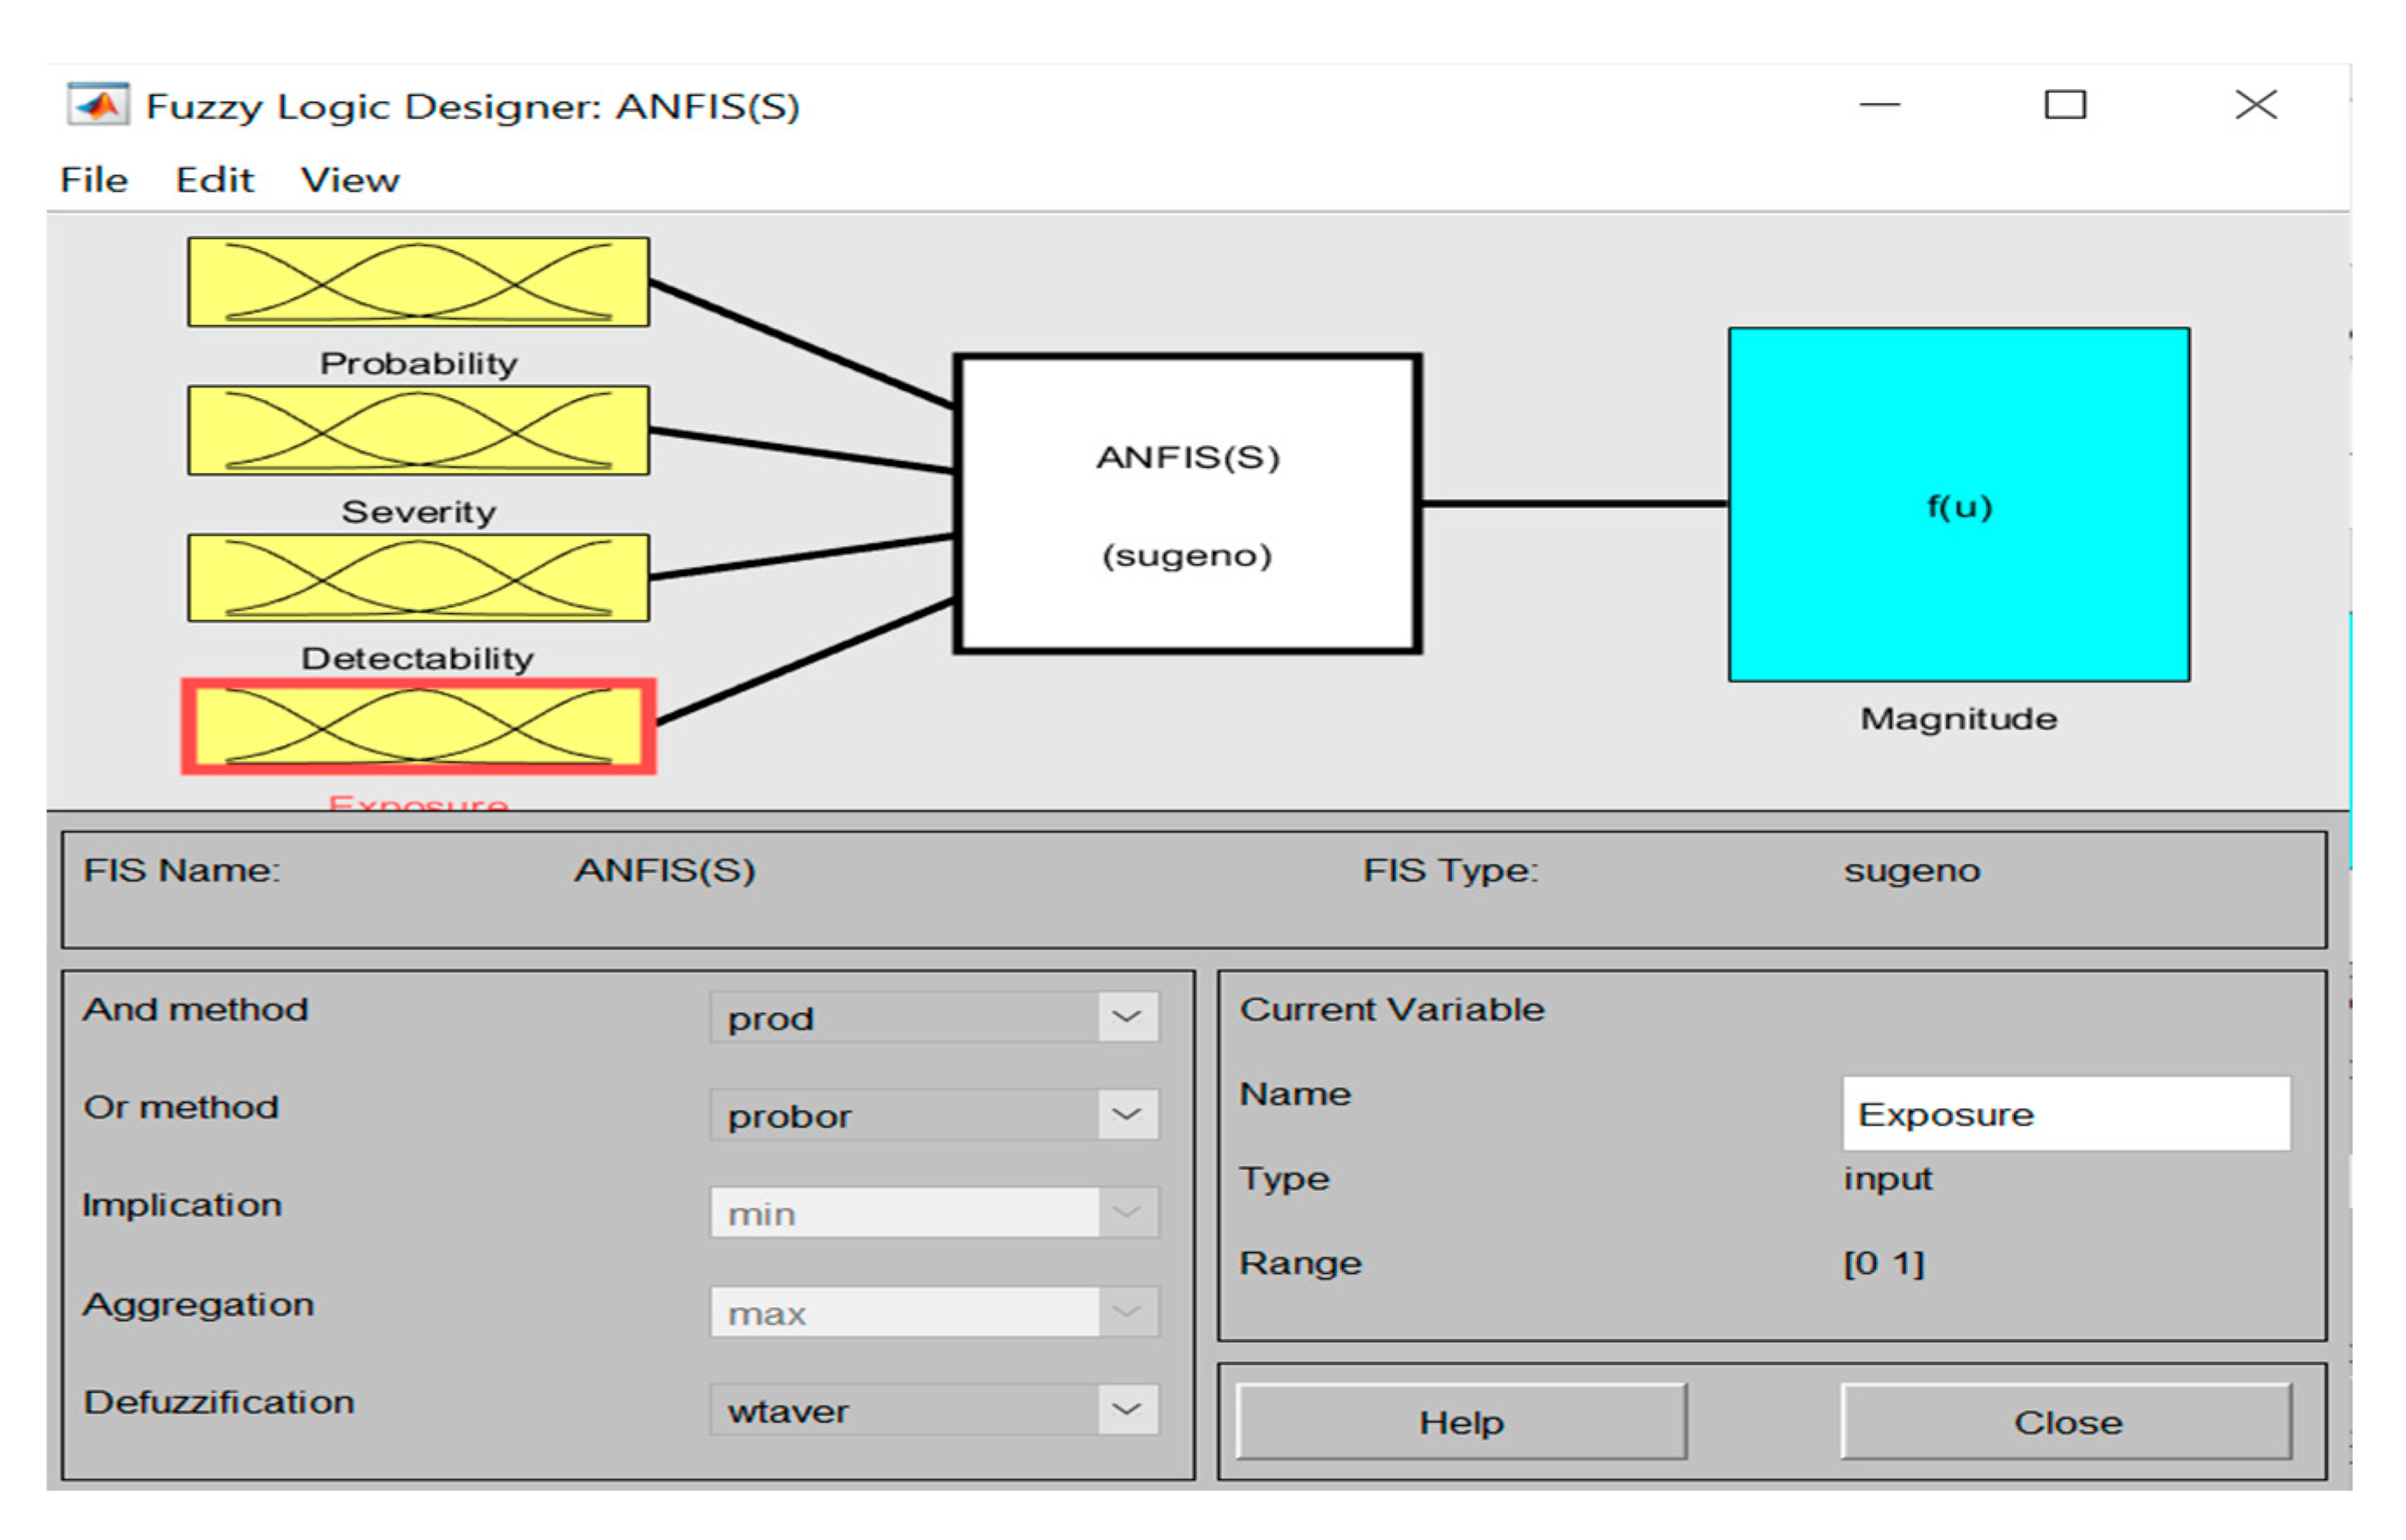
Figure 5 and
Figure 6 illustrate respectively the whole structure of the developed ANFIS model and the fuzzy logic designer page for the inputs to predict the desired outputs. To run the simulations related to the proposed ANFIS method, ANFIS toolbox in MATLAM was used, in view of its ability in providing interactive as well as inclusive results [
26,
28].
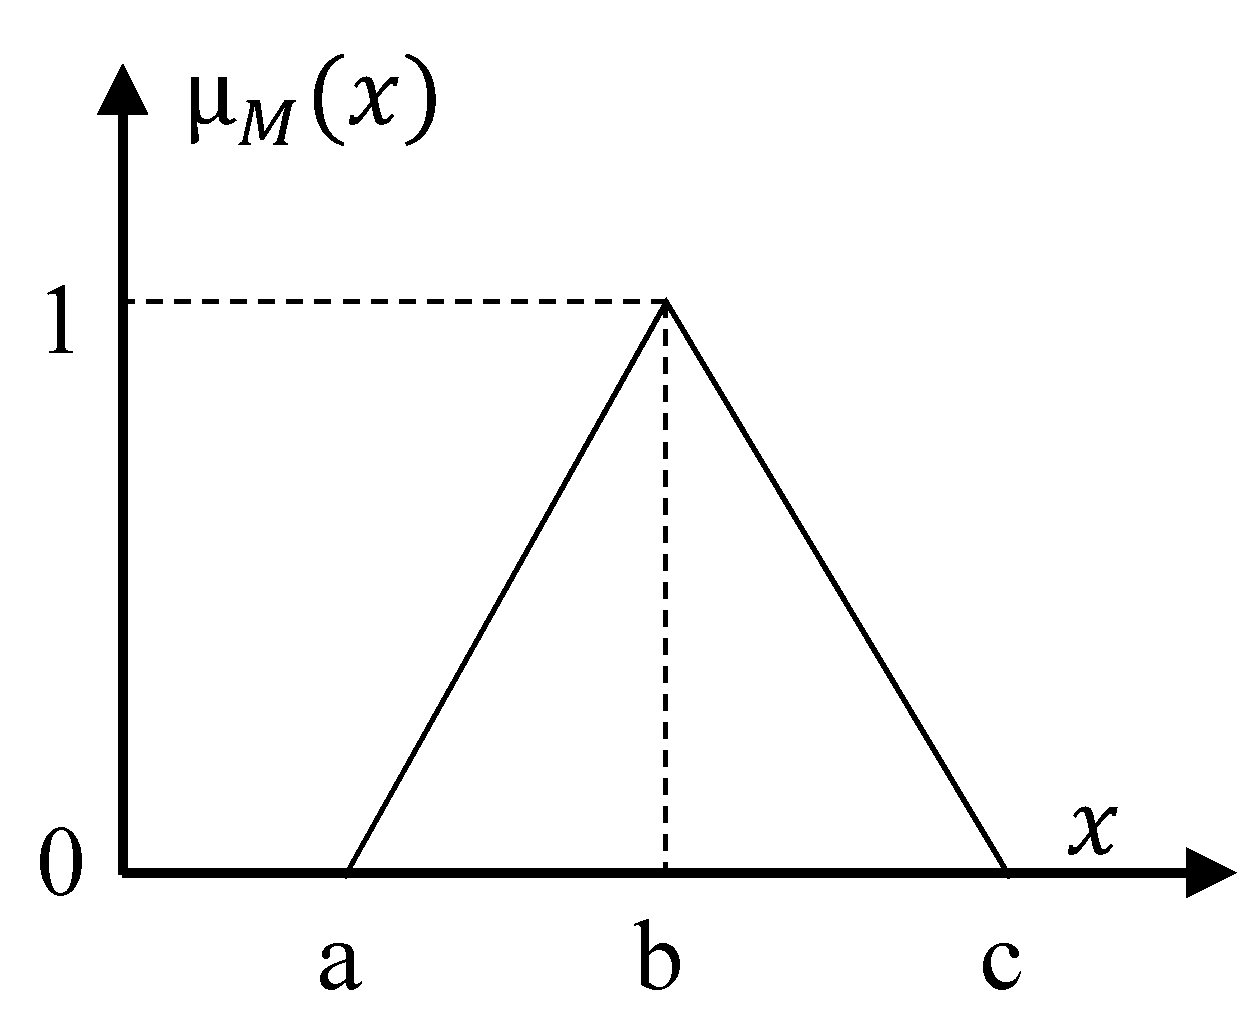
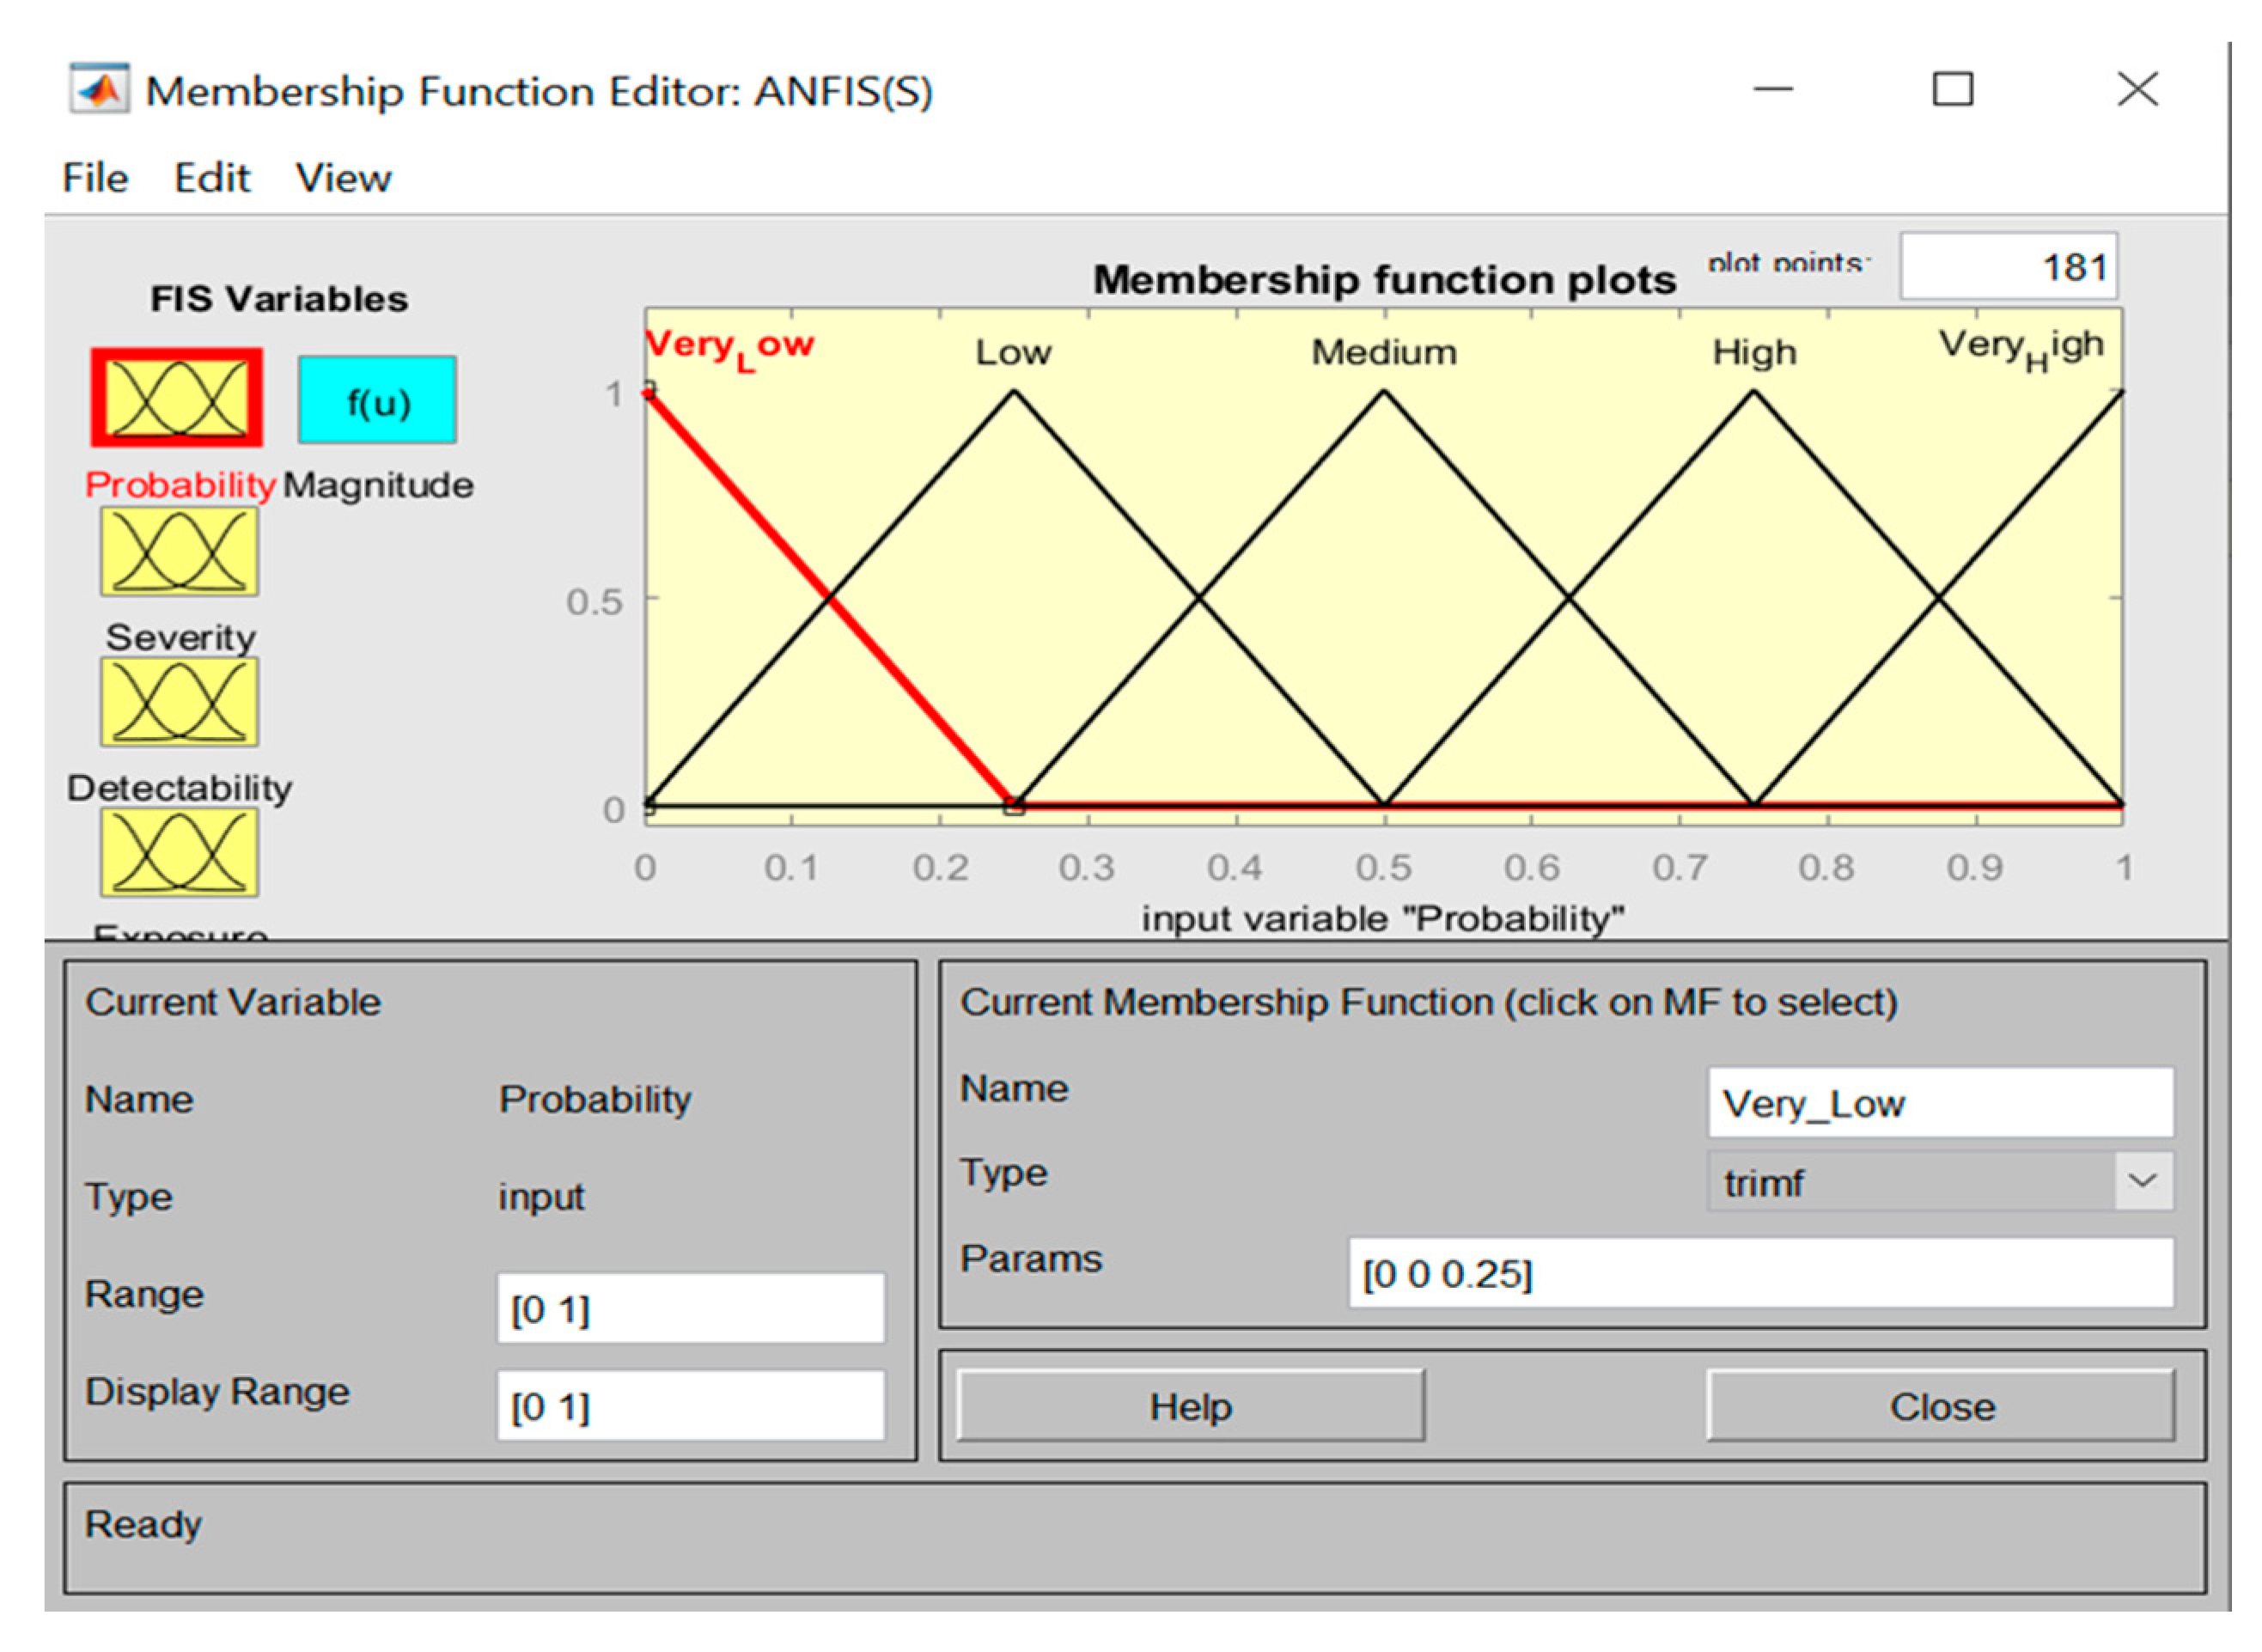
Furthermore,
Figure 7 demonstrates the fuzzy ratings and the membership functions for inputs (i.e., triangular membership functions).
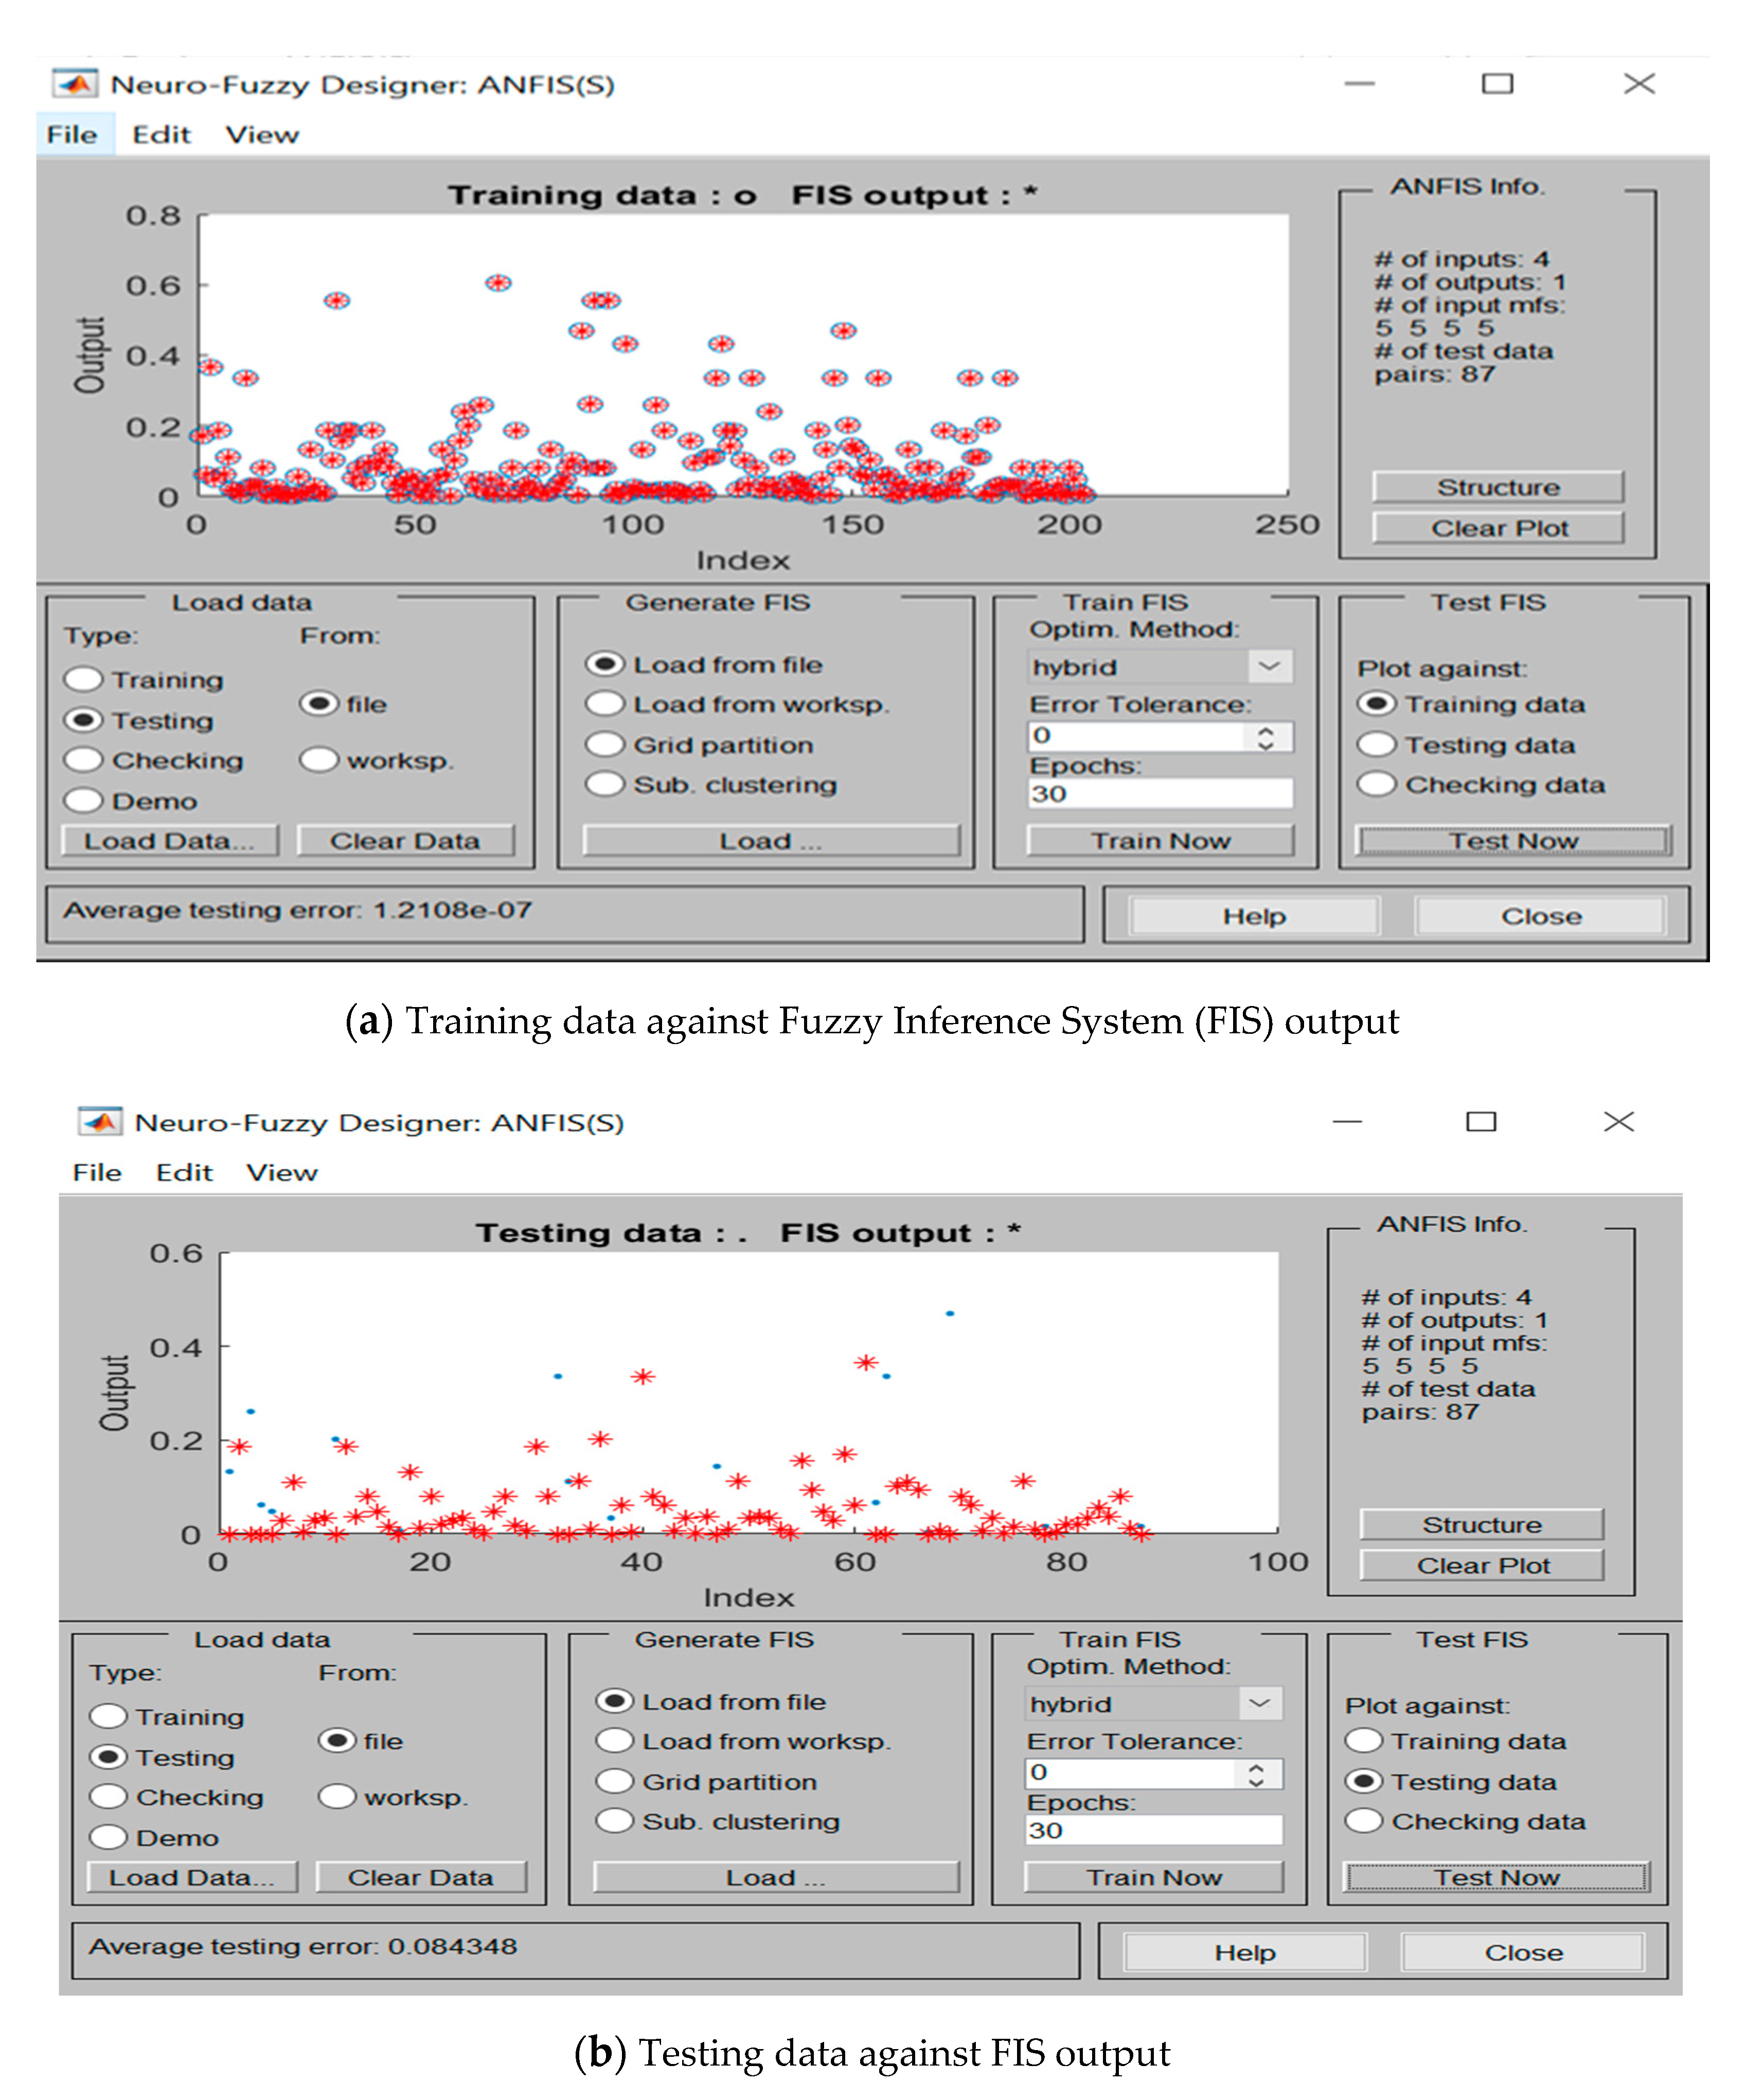
As inferred from
Figure 8, the trained and tested output of ANFIS, which illustrates the predicted Risk Magnitude (FIS output) for both training and testing data, are in good harmony with the actual data. Notably, after training the pertinent data set in ANFIS, it was observed that the training process ceased at epoch 12.
Table 9 shows the ANFIS structure together with related training parameters.
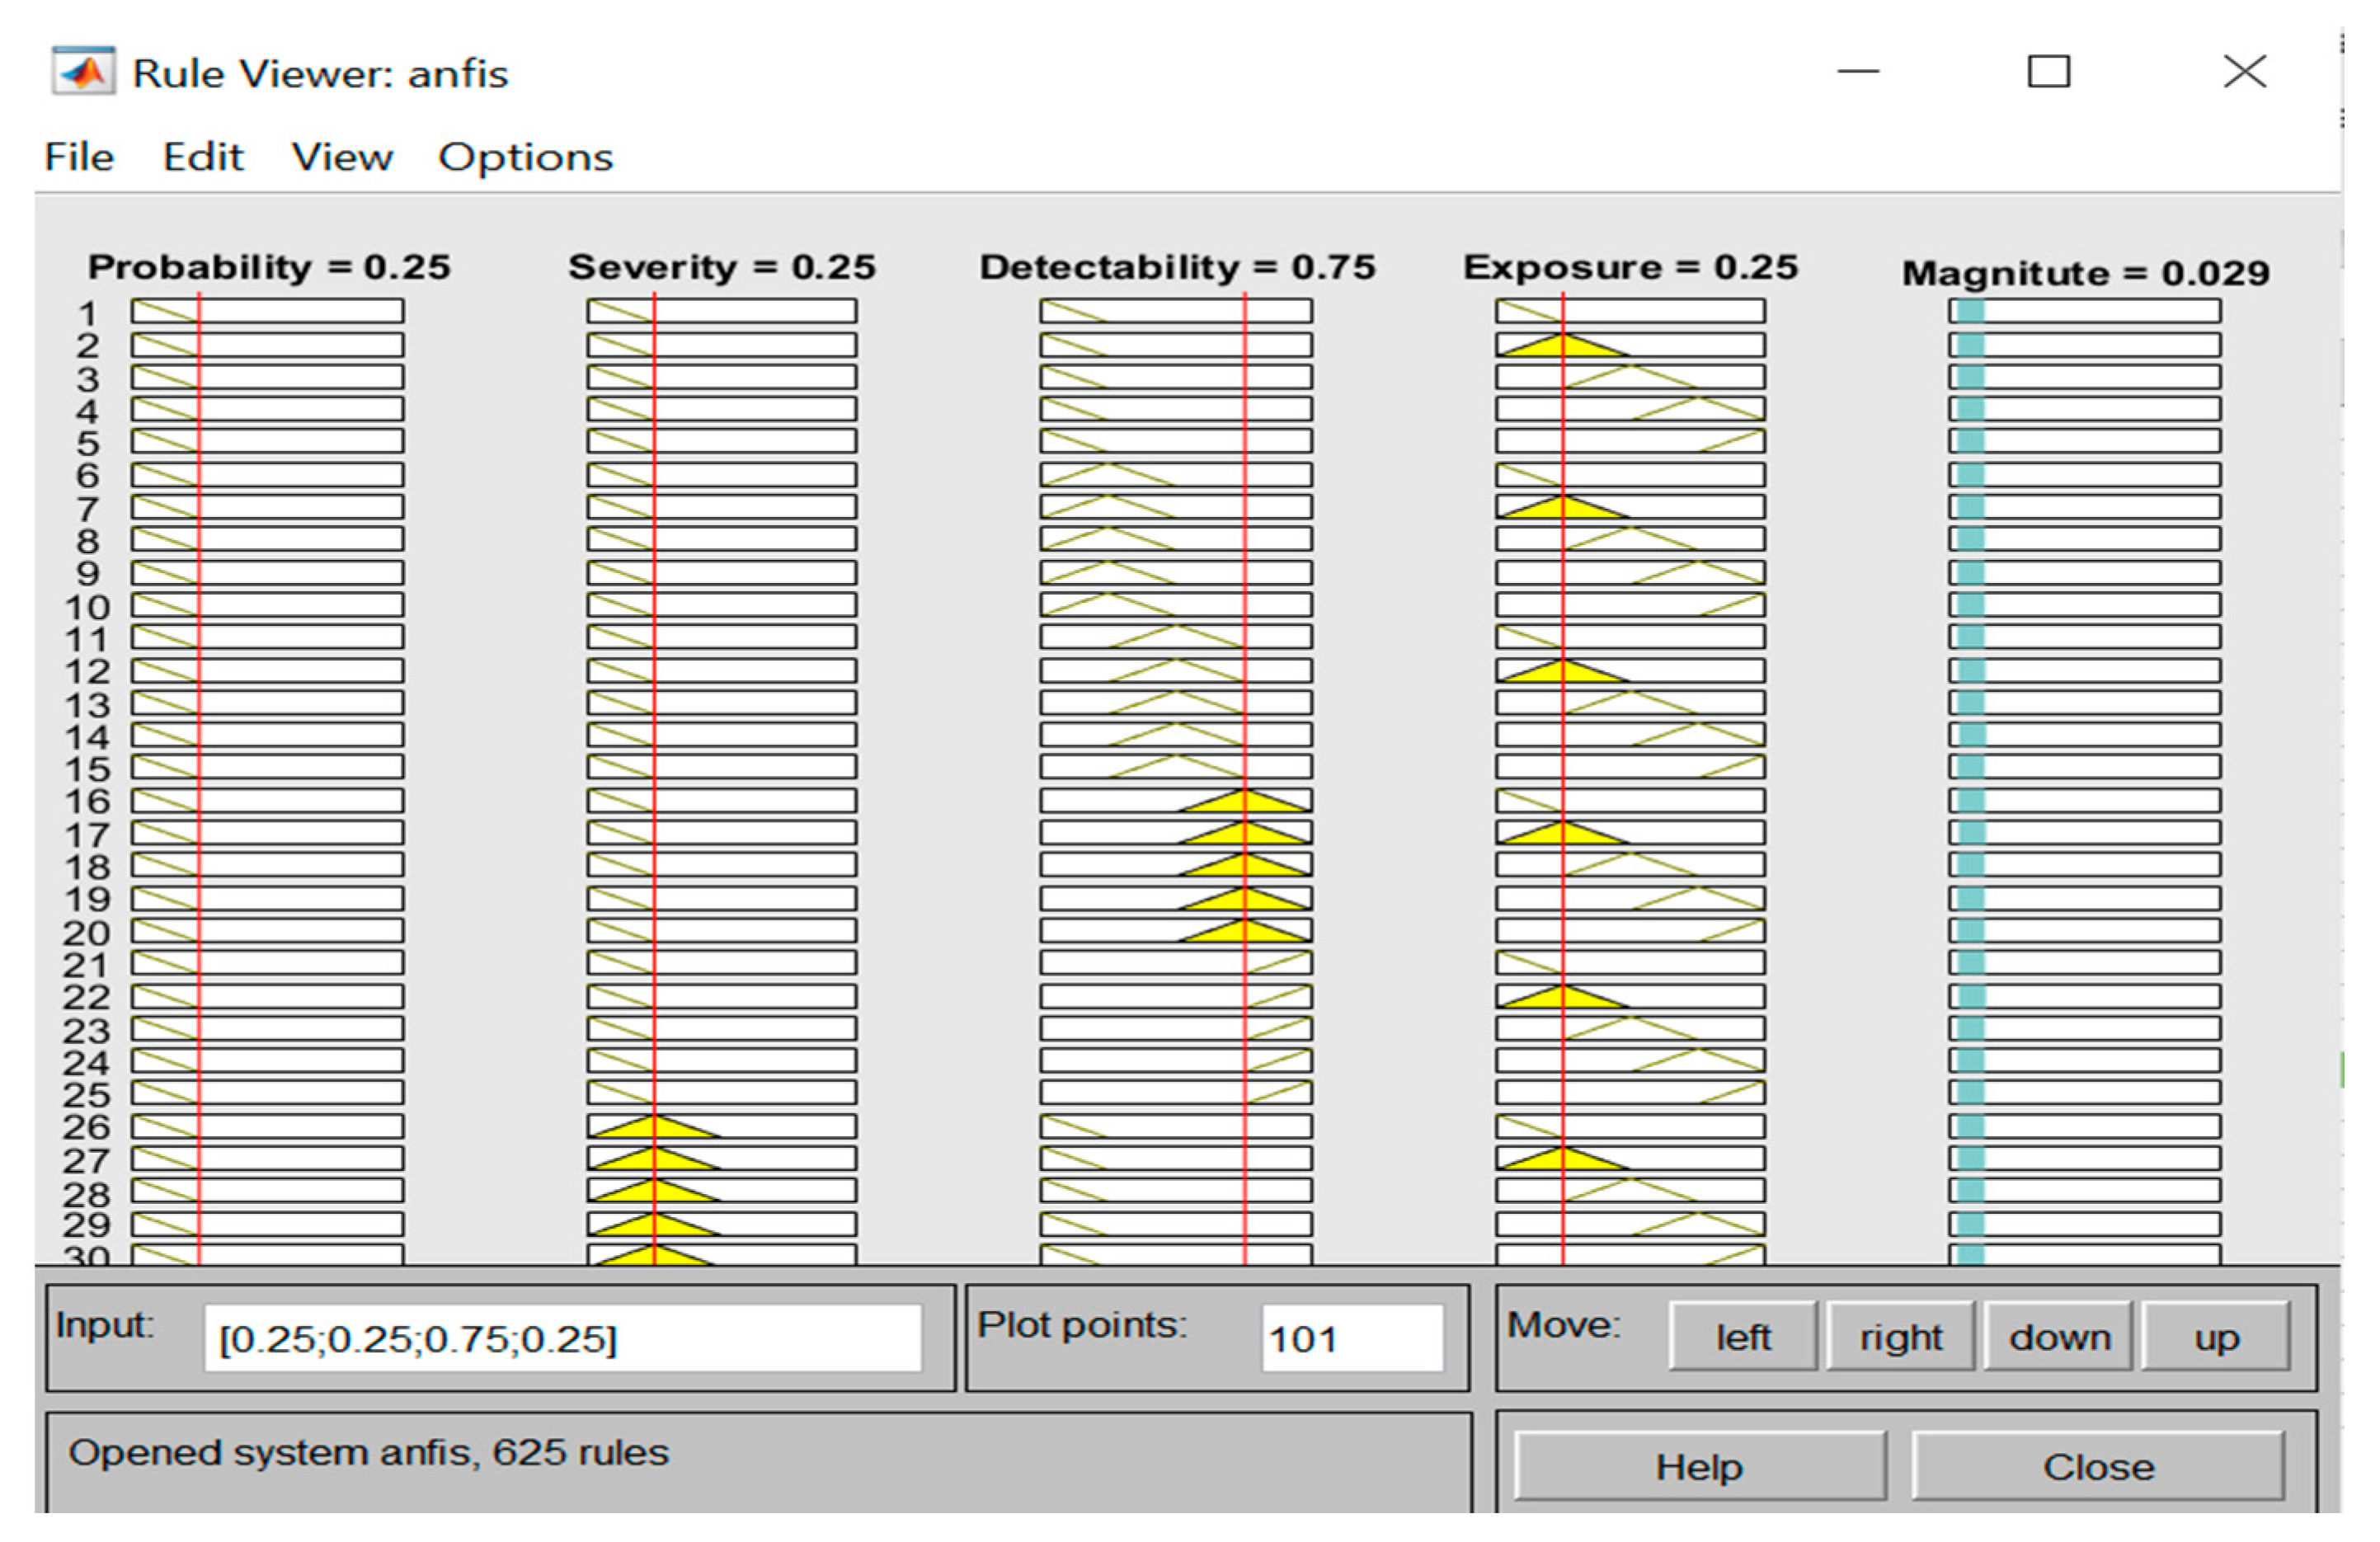
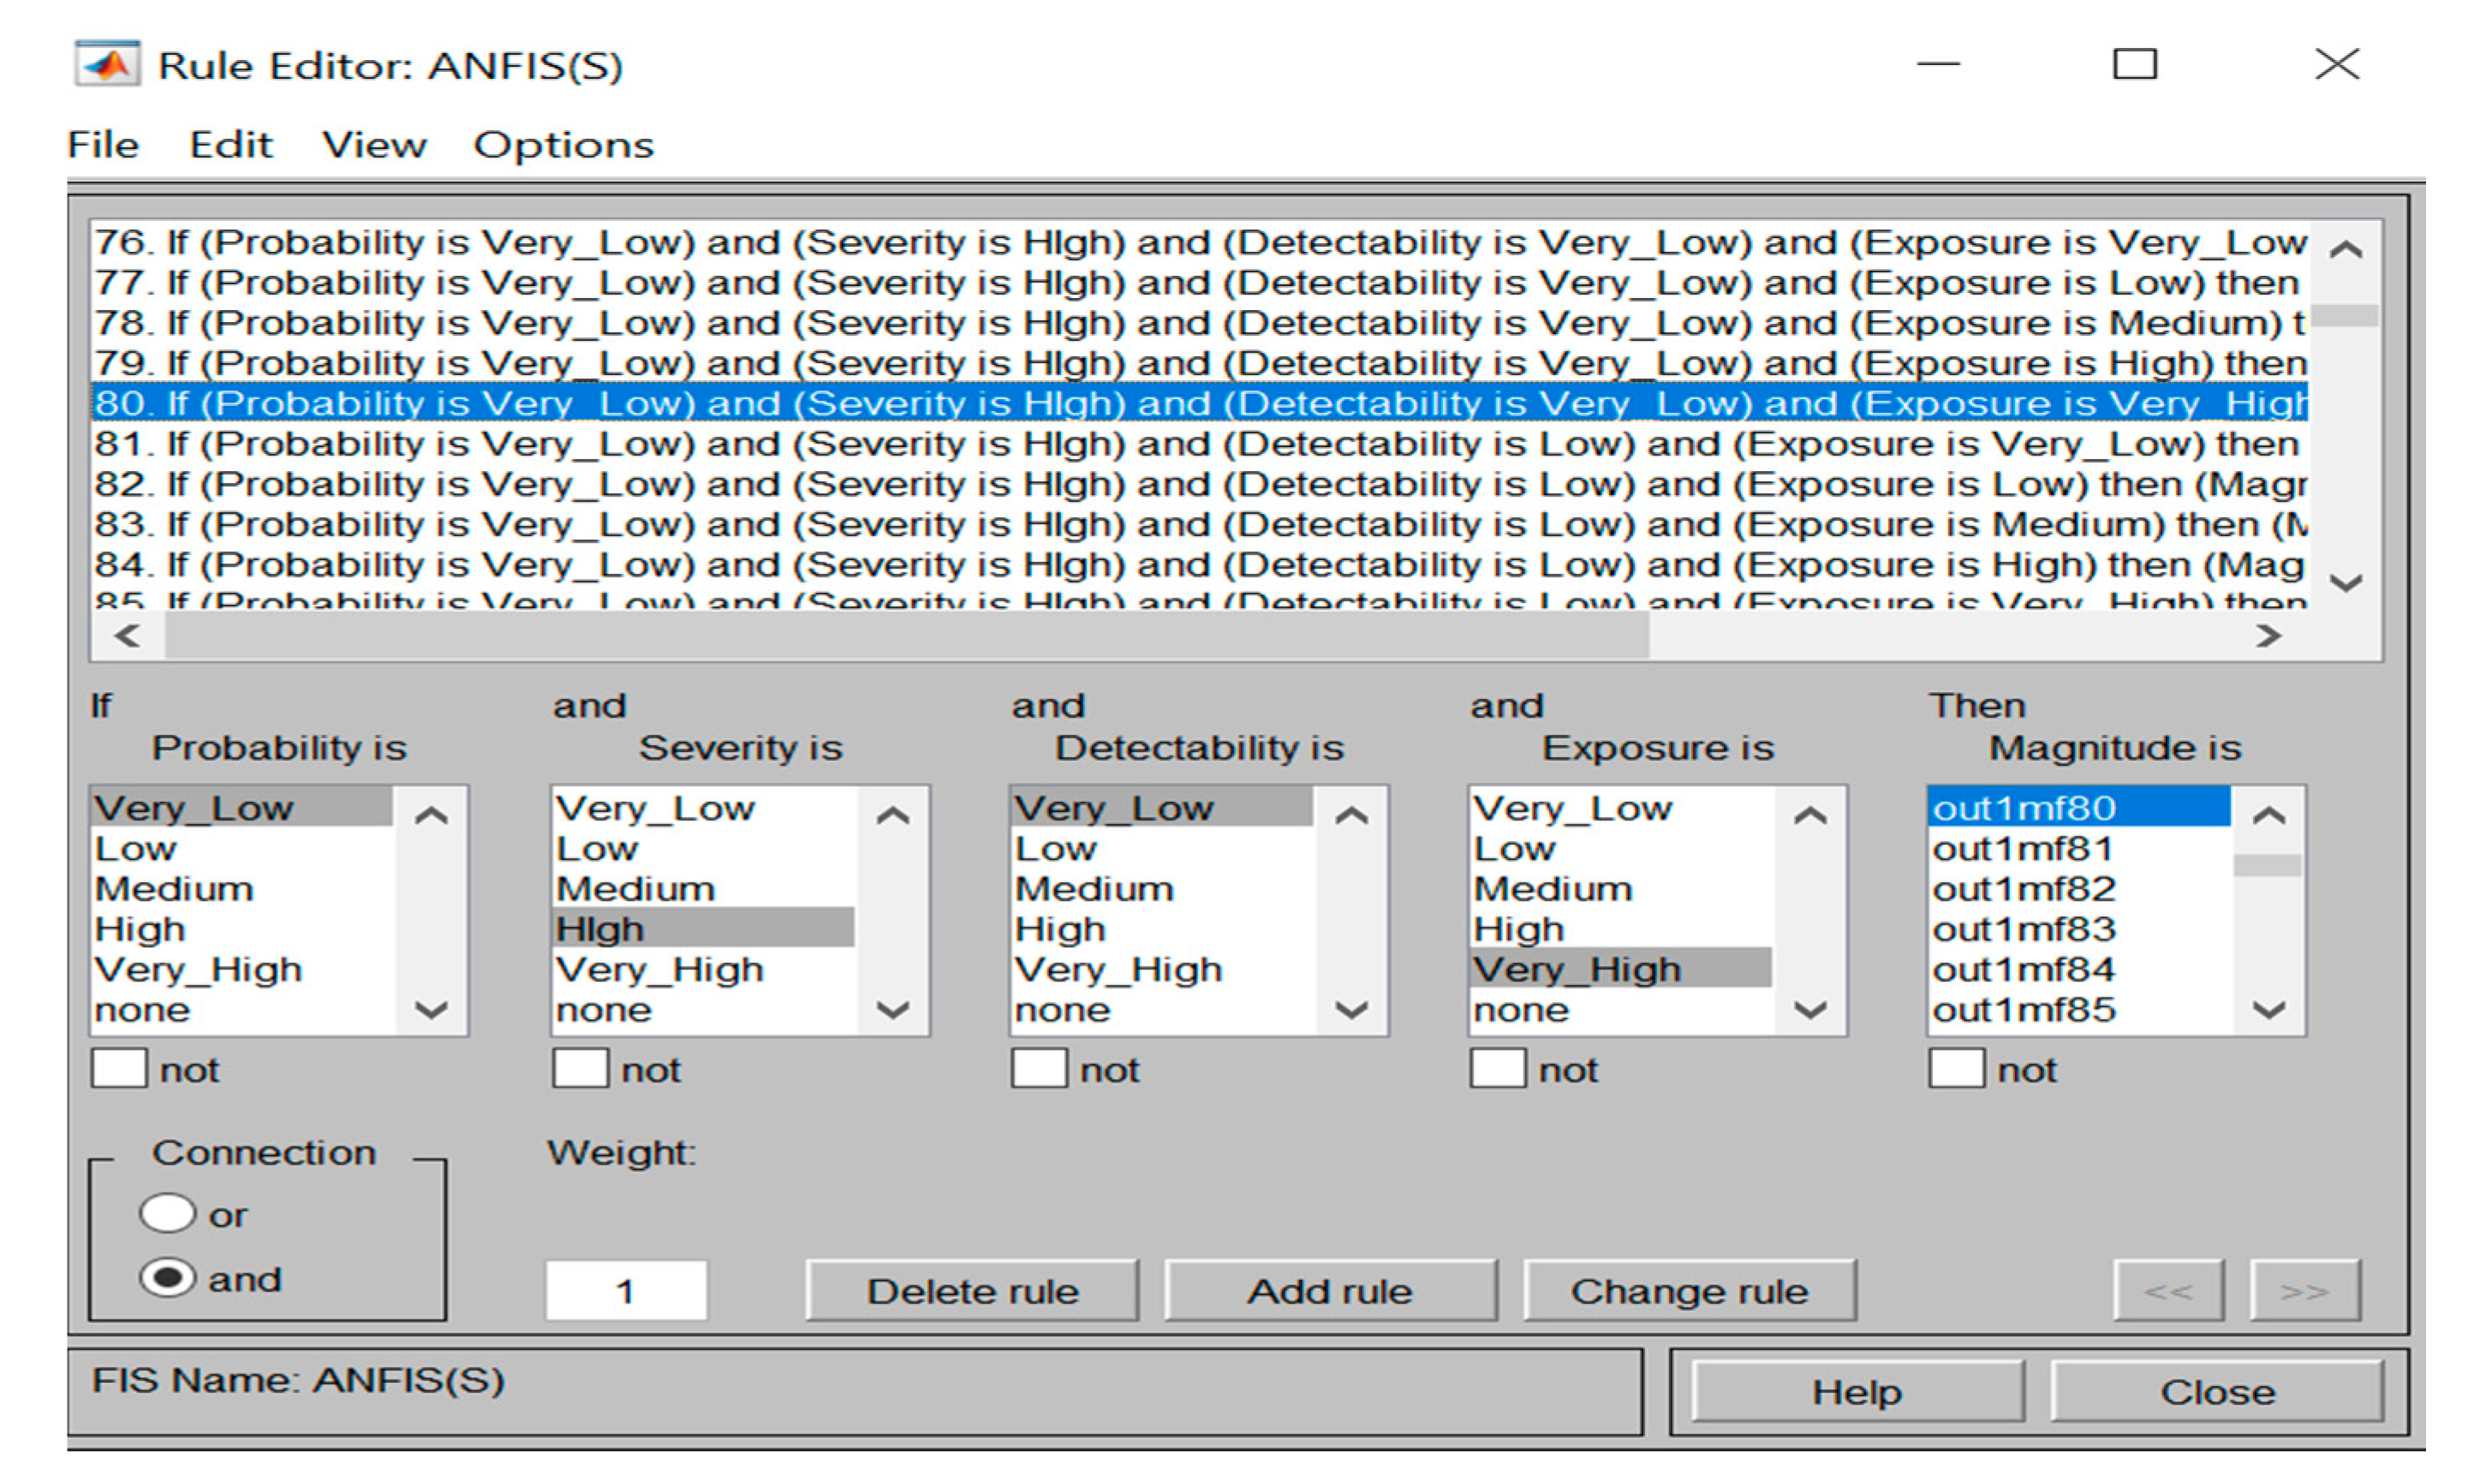
Furthermore, once the 203-training data has been fed to the developed ANFIS Sugeno model, the rules were then automatically created as can be seen from the rule viewer (see
Figure 9 and
Figure 10). Consequently, based on the training data set fed to the ANFIS model, the magnitude of the safety risks for the testing step (87 datasets that were garnered from three construction projects) was predicted, as shown in
Table 10.
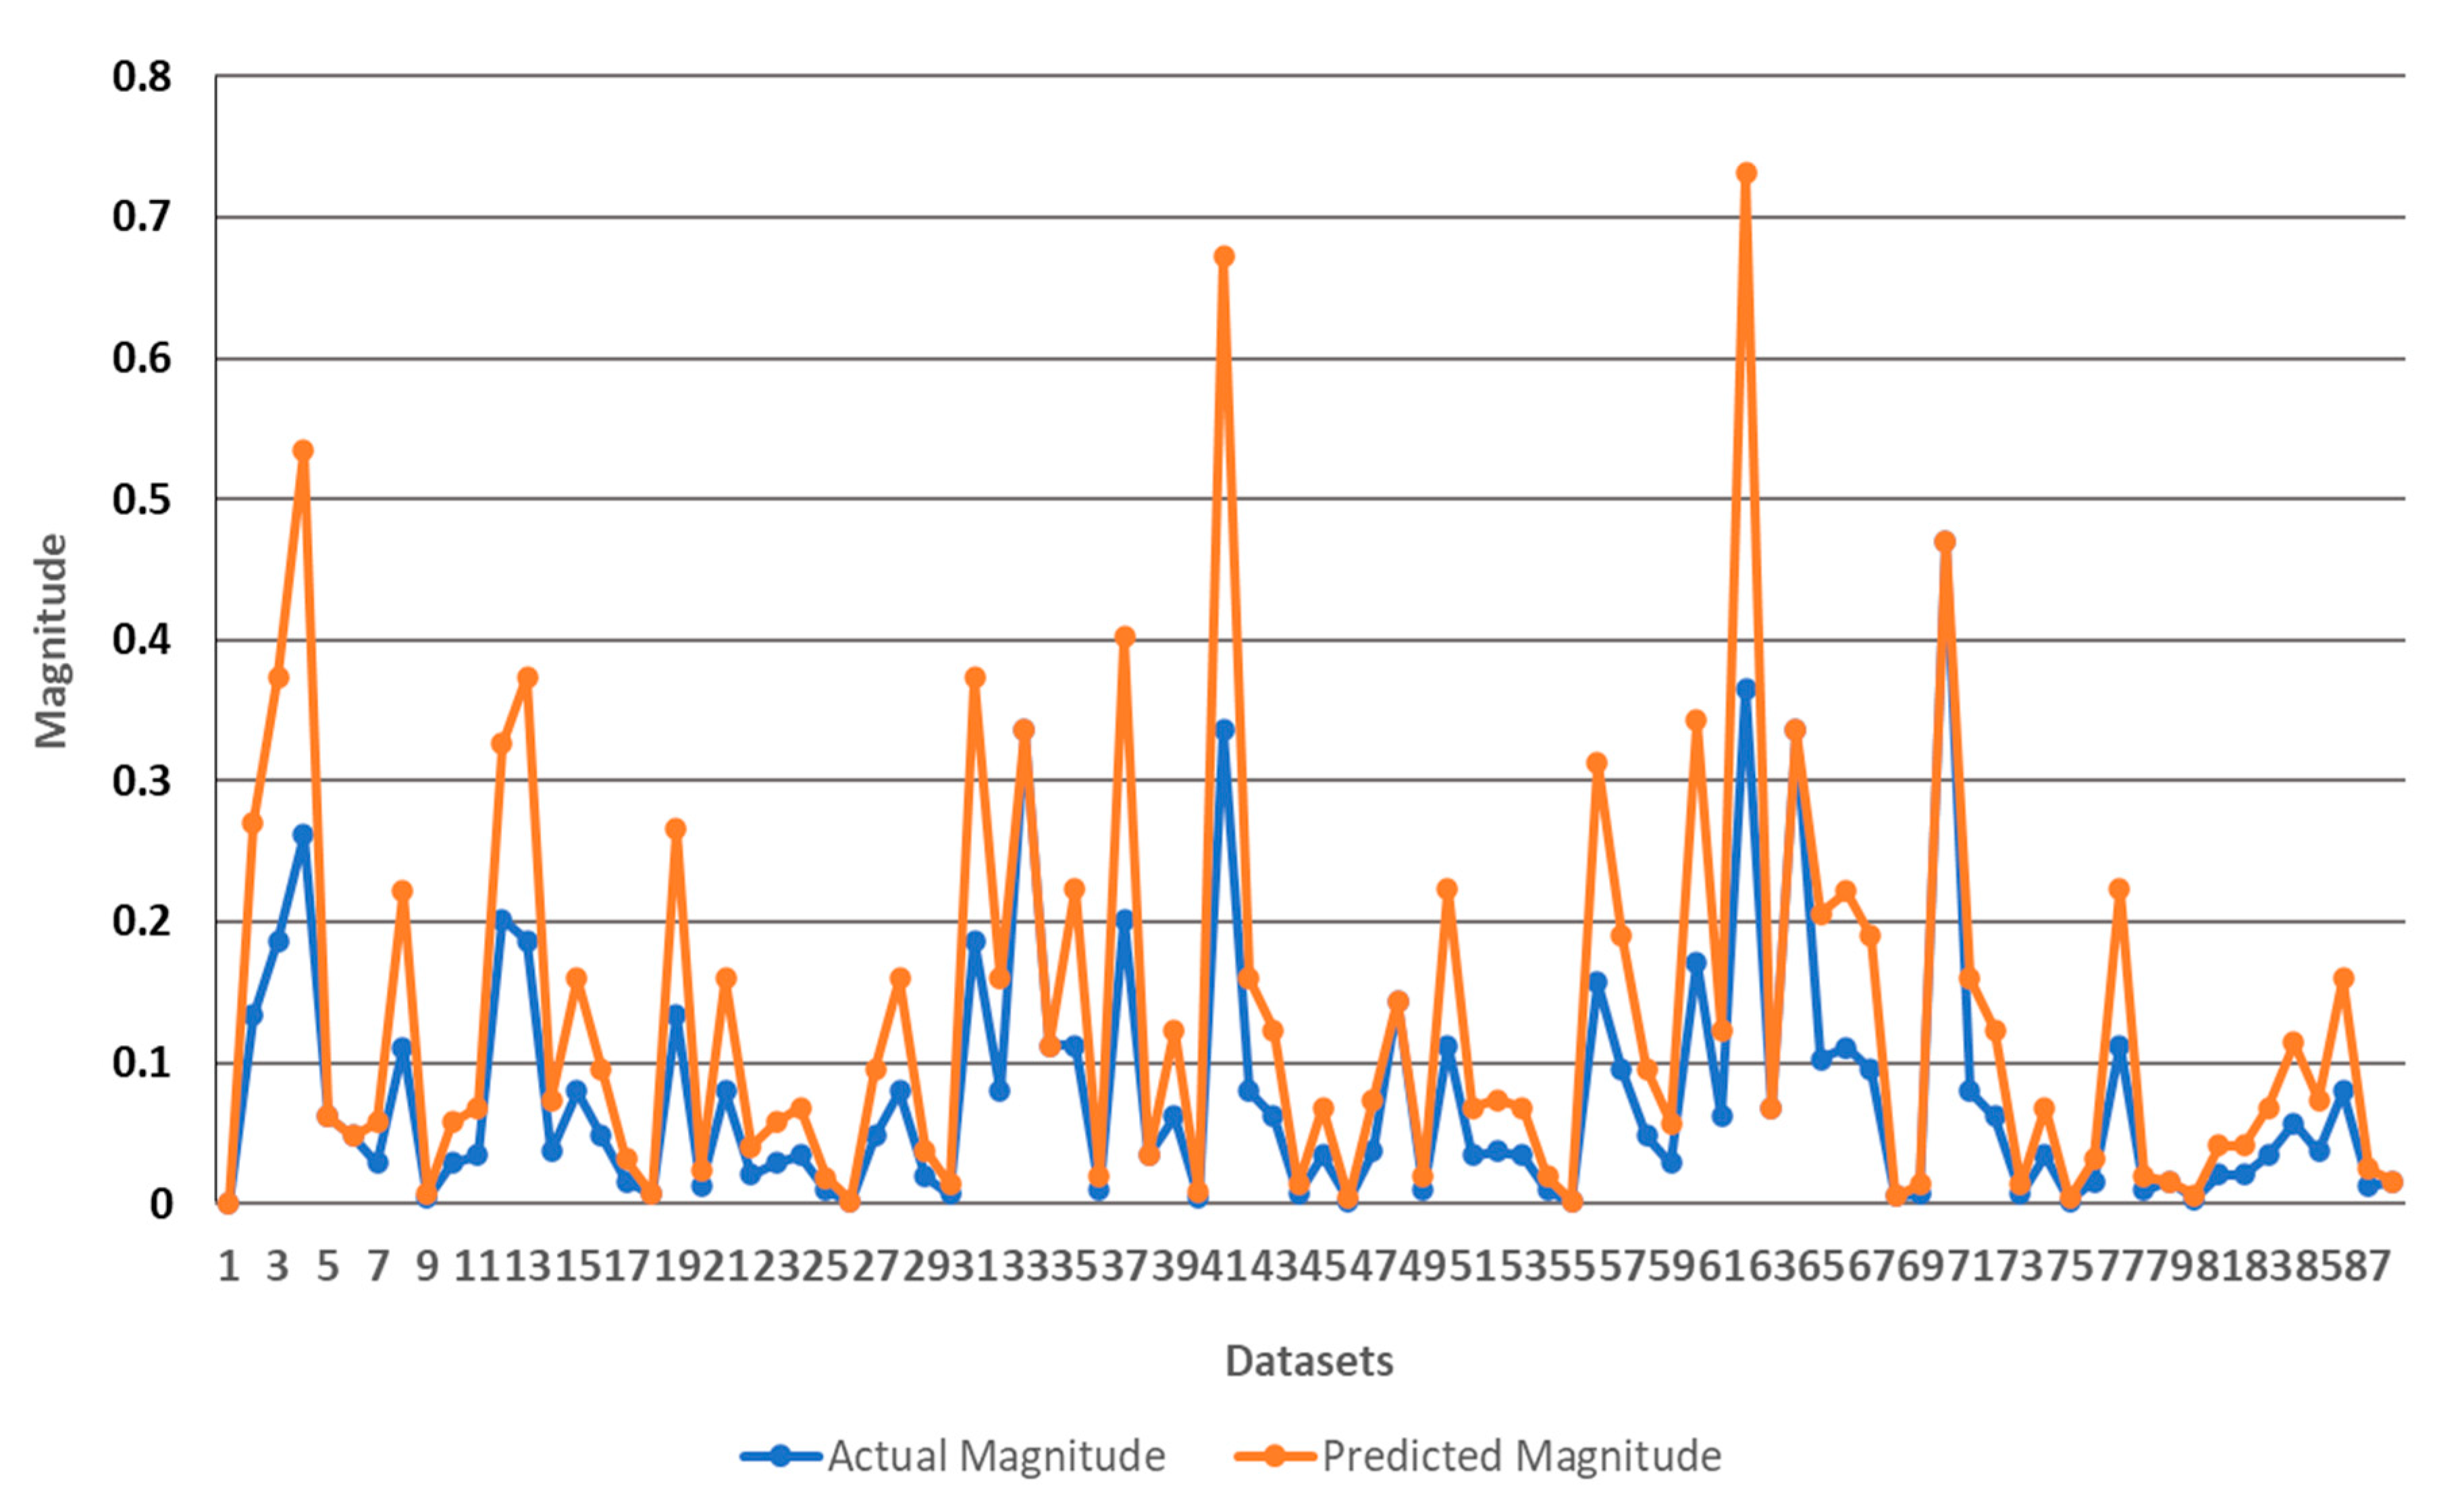
As illustrated in
Table 10, a comparison of 29 datasets (i.e., collected from one construction site) of actual data (i.e., testing data) and predicted value by ANFIS Sugeno is available. Moreover, the efficiency of the optimization model can be seen in
Figure 11, which illustrates the comparison of predicted and recorded risk values of 87 testing data sets. Furthermore, to show the accuracy of the used ANFIS model in the study for assessing the identified safety risks, the results obtained were compared against those of Linear Regression Method (LRM). As in
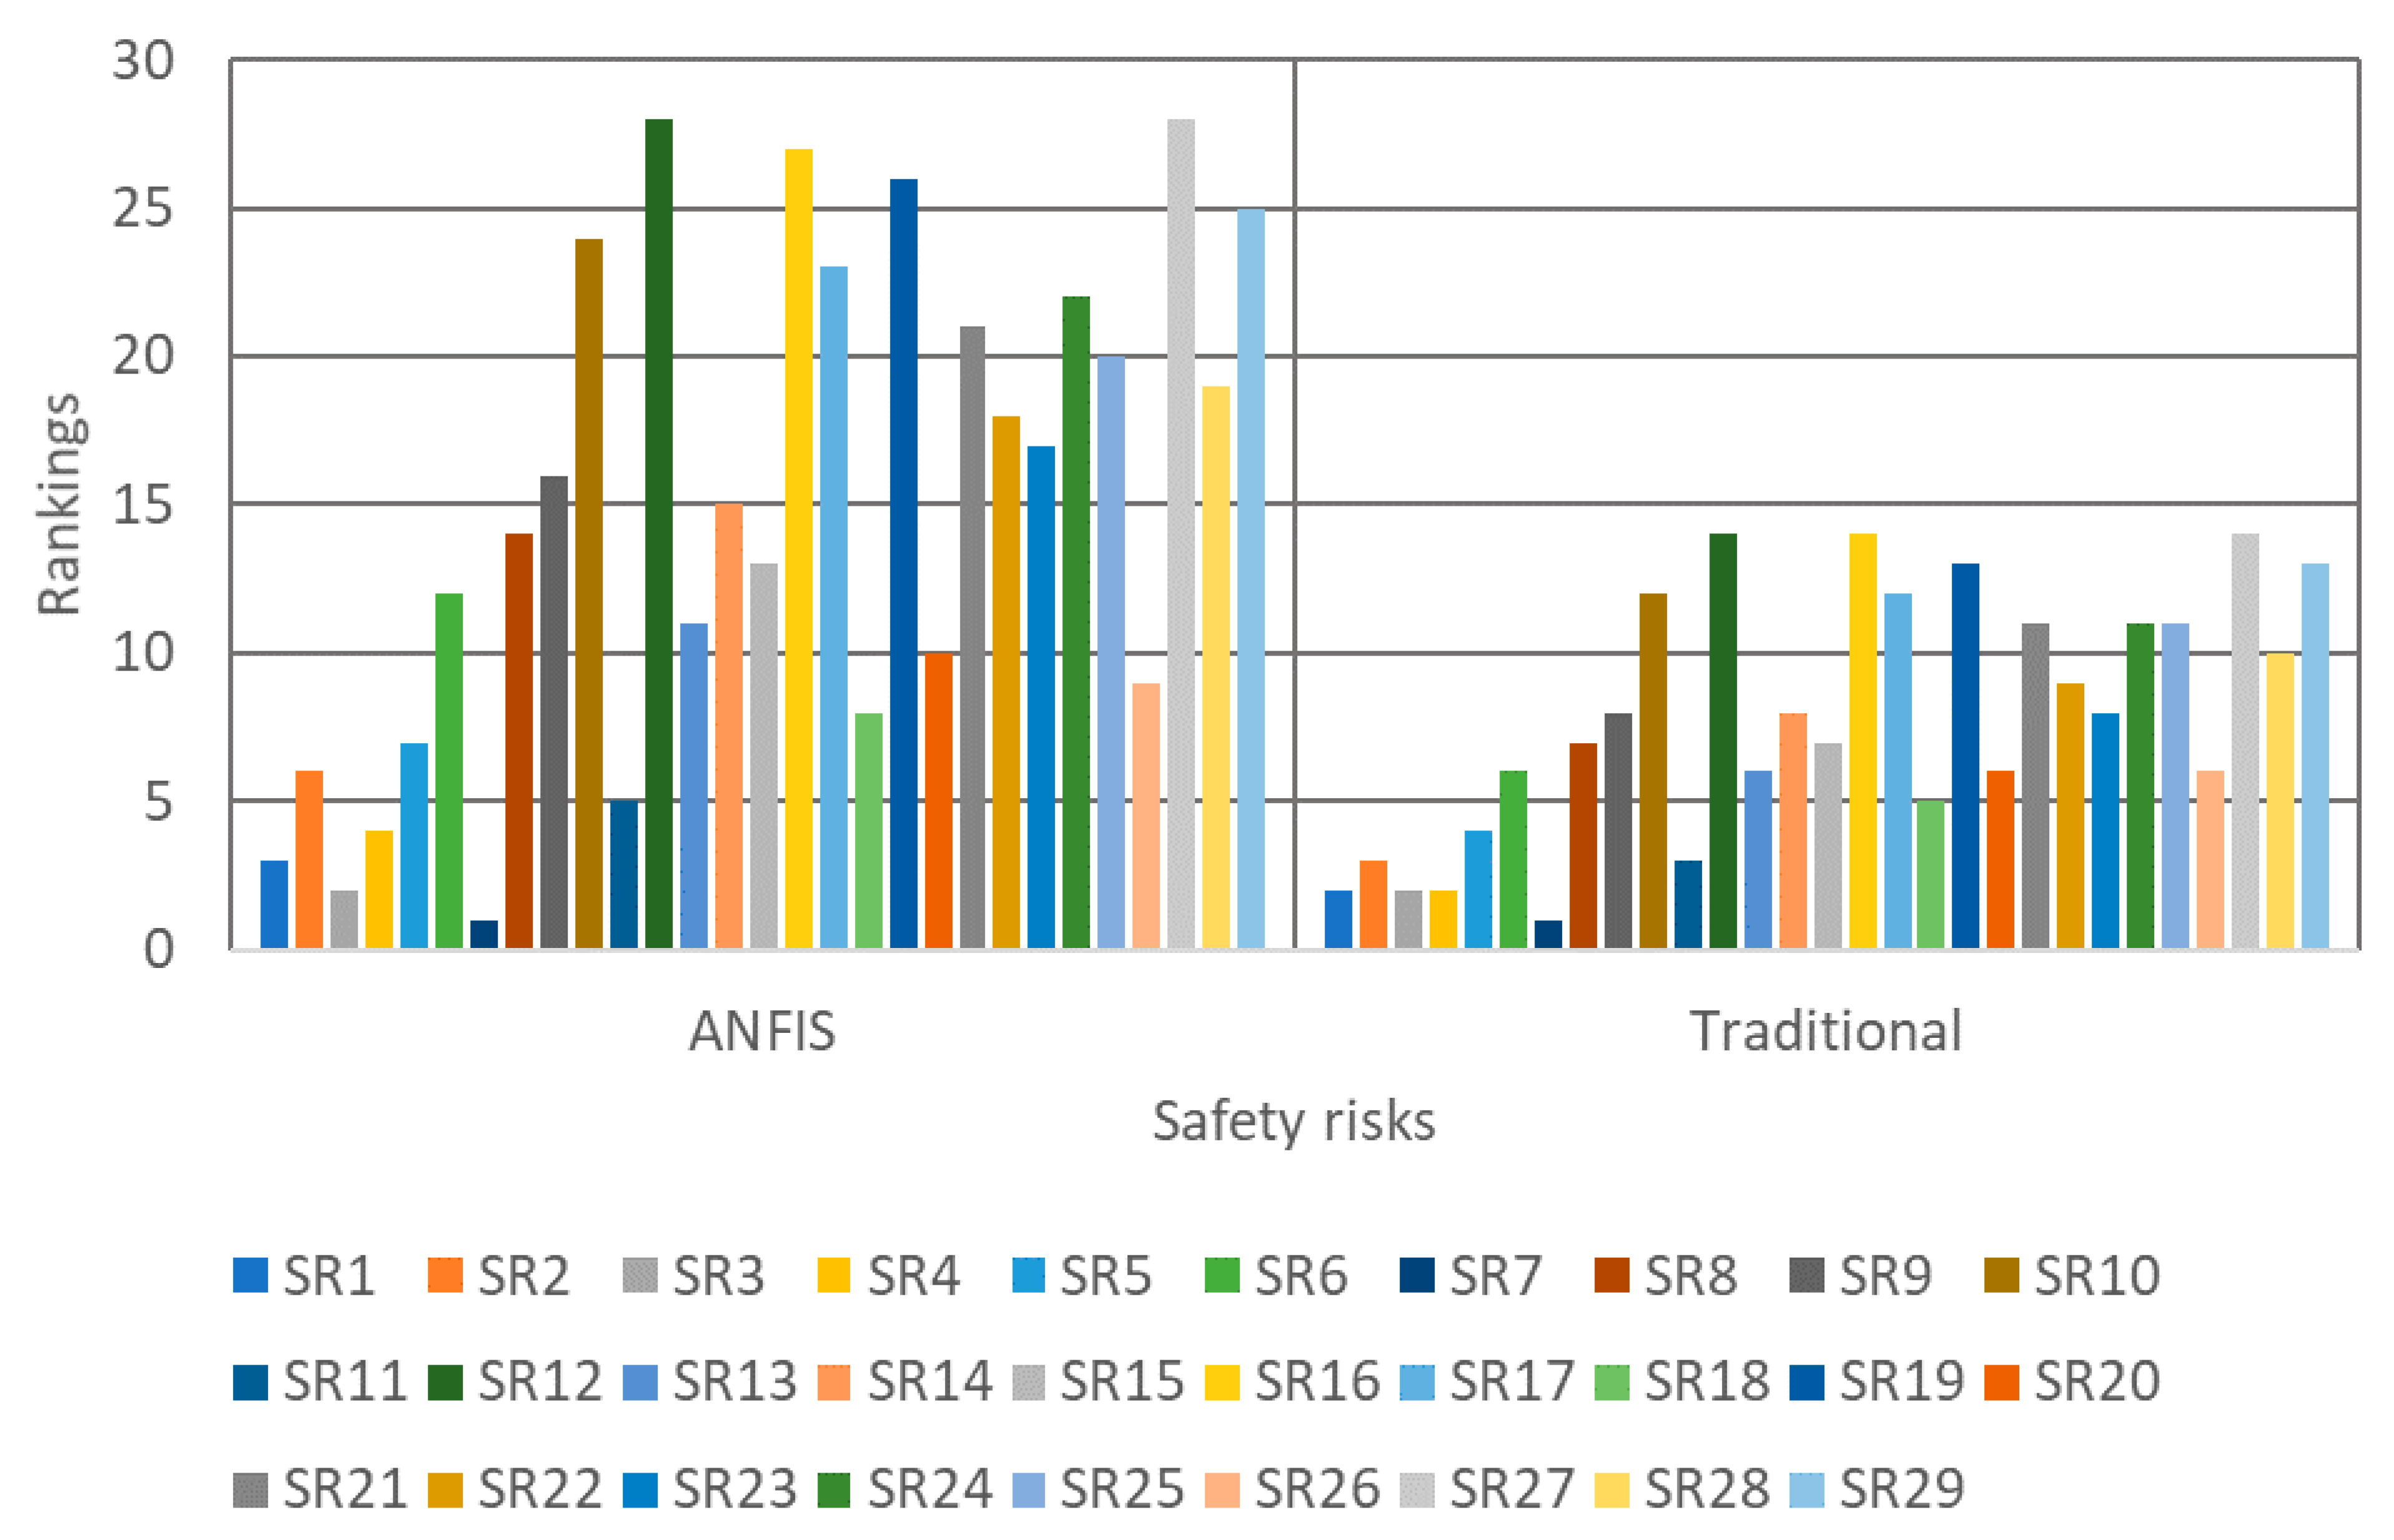
Table 11, the outcomes of ANFIS model are more accurate according to the different performance measures considered. Additionally, a comparative study between the rankings obtained from the proposed EPRAM and the traditional assessment (in which two parameters are used, namely probability and severity) was considered. In doing so, the assessments, which were related to the exposure and detectability parameters, were neglected, and accordingly, the remaining inputs were fed to the proposed ANFIS model.
Figure 12 shows the rankings obtained from both models. As can be observed, many safety risks were placed in the same spots using the parameters considered in traditional assessment method. Hence, the concerned safety professionals cannot take the further prudent mitigative strategies, since the analyzed safety risks cannot be distinguished from each other. To make it more explicit, using the traditional assessment approach (that are rampant in the construction industry), some risks are ranked in the same spots. For instance, as can be observed from
Figure 12, SR1, SR3, and SR4 all are ranked in the same place, for which the same mitigative strategy should be come up with; hence, achieving prompt responses for dealing with the riskier hazards cannot come to fruition. By contrast, the project managers and decision makers can appropriately prioritize the mitigative measures according to the ranking of safety risks. Looking at the aforesaid example, SR3, SR1, and SR4 should sequentially be treated (based on their final rankings). In a nutshell, the obtained diversified rankings through the proposed EPSRAM leads to making the concerned parties understood of the criticality levels of safety risks analyzed (the higher the final ranking of risk, the earlier the relevant responsive measure).
It is notable that based on the predicted RM of each safety risk, the proposed evaluation strategies (mentioned in
Table 6) were taken into account, and accordingly the suitable actions with regard to the risks analyzed along with their final rankings are tabulated in
Table 11.
As inferred from the results, a majority of safety risks identified is of minor or major magnitude, for which the appropriate mitigative measures should be considered by safety decision makers and regulators. Additionally, it was witnessed that the operations associated with twelve risks need to be stopped (since their magnitude falls into the critical level), until the pertinent magnitudes are reduced. Another noticeable observation was related to the ranking of those safety risks identified on the selected construction sites: top five risks are SR7 (being struck by falling objects), SR3 (being trapped), SR1 (being shocked), SR4 (fall from height), and SR11 (spinal disc injury). Even though the order of criticality levels of top-ranked safety risk identified in the study are slightly different from the observations mentioned in previous studies (which is due to consideration of a higher number of risk parameters), the overall picture is to a large extent the same. For instance, Hamid et al. [
14] opined that fall from height, electrocution, and struck by falling objects are the main culprit of fatal-related injuries on Malaysian construction sites. Similarly, the perilousness of being trapped by the machineries was emphasized by Chong and Low [
2]. Likewise, Torghabeh et al. [
64] stated that the safety professionals in Malaysia are concerned with the ergonomic-pertinent injuries, as the majority of respective construction workers suffer from these non-fatal injuries through their careers. The main reason behind this lies in the fact that ergonomic-related injuries are not usually reflected in related databases or archives, since they mostly do not account for any direct fatalities; however, their direct or indirect impacts on workers or their family members can be disastrous.
Having said that, considering the full picture of essential risk parameters reveals the fact that there are many other critical safety risks that have not received attention in previous studies. Damages to the tendons (SR13), stenosing tenosynovitis (SR14), neck stiffness (SR15) as few examples, these safety risks were observed to have been eliminated, since their magnitudes are observed to be critical. That said, these safety risks in the related literature are not referred to. The major reason for their omission lies in the fact that identified risks have been typically explored from two aspects: whether their occurrences were possible or not (i.e., probability), and whether the resulting impacts were noticeable or not (i.e., severity). In fact, the results of previous safety assessment of risks in Malaysian construction sites have overlooked two crucial aspects of a hazard, namely the duration of exposure, as well as the detection of occurrence of a risk by workers. As a result of these disregards, many impactful safety risks have been overlooked. Therefore, moving beyond the boundaries of common parameters considered in traditional assessment approaches is a dire need of the construction industry. Working environments for construction workers can be safer by considering a wide range of hazardous situations and extending common parameters.
Moreover, during the interviews at the initial stage of the research, it was observed that lack of proper supervision by main contractors is a major cause for many highlighted safety risks. Similarly, the existence of loopholes in regulations, and most importantly, the flawed safety management systems within construction firms are behind many safety problems on sites. Furthermore, it was unanimously asserted that through (1) providing appropriate safety training for workers, as well as (2) reducing their exposures to hazardous situations by utilizing modernized equipment, the occurrence of many critical ergonomic-related risks can be contained.
6. Conclusions
Despite the extensive corpus of literature on OHS assessment of construction workers, there has been a dearth of study that incorporates the idea of machine learning into the existing body of knowledge. In addition to this gap, no systematic safety risk assessment investigation to date has been fostered on Malaysia construction projects, where the respective sector is evolving at a brisk pace. To fill these gaps, an innovative EPRAM is developed in this study. Through applying the developed EPRAM to ten construction projects in Kuala Lumpur, this paper contributes to the body of knowledge in several ways, as explained below.
Overcoming the shortcoming existing in the traditional-based assessment methods: To conduct traditional-based assessment methods, large amounts of data on OHS-related issues must be collected. The data are subject to errors in various ways including incomplete archived data, as well as legal issues of sharing the data. Using the fuzzy rule-based system reported in this paper, these shortcomings are resolved.
Developing a conclusive OHS assessment with four essential risk parameters, as opposed to traditional-based assessment approaches, which are based on only two parameters—probability and severity. Applying the proposed EPRAM to a number of construction projects in Malaysia, it was observed that apart from well-known critical safety risks (namely fall from heights, struck by falling objects, electrocution, trapped), there are some types of risks that have not yet been even pointed out. For instance, overexertion-related injuries were witnessed to be of high criticality (such as spinal injury, damages to tendons, neck stiffness, and so forth), demanding more attention from safety professionals. One way to handle these types of risks is through providing appropriate safety training for workers, as well as reducing their exposures to the related hazardous situations by utilizing modernized equipment. There are overlooked in traditional risk assessment methods.
Overcoming the problems associated raw numbers that being used in traditional-based assessment methods by fuzzifying the relative data is another novel feature of this paper. With this, the final output—risk magnitude of risks—are of high accuracy. The results produced were observed to outperform traditional-based safety assessment methods, as well as linear regression methods.
Proposing appropriate evaluation strategies based on predicted magnitude values of risks. That is, through the developed EPRAM model in the study, safety professionals are provided with suitable measures to deal with safety risks based on the newly-defined classifications in the study.
It is hoped that the developed predictive model in the study can guide authorities and professionals towards perceiving better illustration of safety risks identified, by providing them with the obtainment of risk magnitudes, as well as how to evaluate them later on, in an easy and interactive way. This, in turn, will improve the OHS of the workers embroiled in the relative construction activities. On the other side of the coin, when it comes to the practicality aspect, it has to be said that the application of the developed model is intended to be as user-friendly as possible for the concerned parties, including safety inspectors, project managers, construction managers, site supervisors, safety officers, and so forth. That is to say, it can be applied to new construction projects by feeding more data into the proposed prototype; however, more research should be conducted towards its commercialization for wider adaptability. Having said that, developing an innovative mitigative model, which includes the proposal of treatment measures for the risks analyzed and evaluated using the proposed model in this research, seems an undeniable fact for the future studies. Additionally, the integration of Z-numbers with neural networks could be regarded as a potential future stream, and accordingly, the results can be compared with one another.

 ,
, 


