Preventing Work-Related Musculoskeletal Disorders in Manufacturing by Digital Human Modeling


Abstract
:1. Introduction
2. Digital Human Models
3. Applications of DHM
- Creating or recreating a work environment in a virtual space.
- Insertion of a human body model (dummy), which is appropriate in terms of anthropometrical features.
- Simulating body posture during the most frequently performed work tasks.
- Generating workload or discomfort assessments, observing potential inconveniences, e.g., related to the field of view, ranges, etc., and performing the risk assessment of WMSDs.
- Correction of the workstation and its environment aimed at reducing the potential identified threats and removing inconveniences.
4. Case Studies
4.1. Material and Method
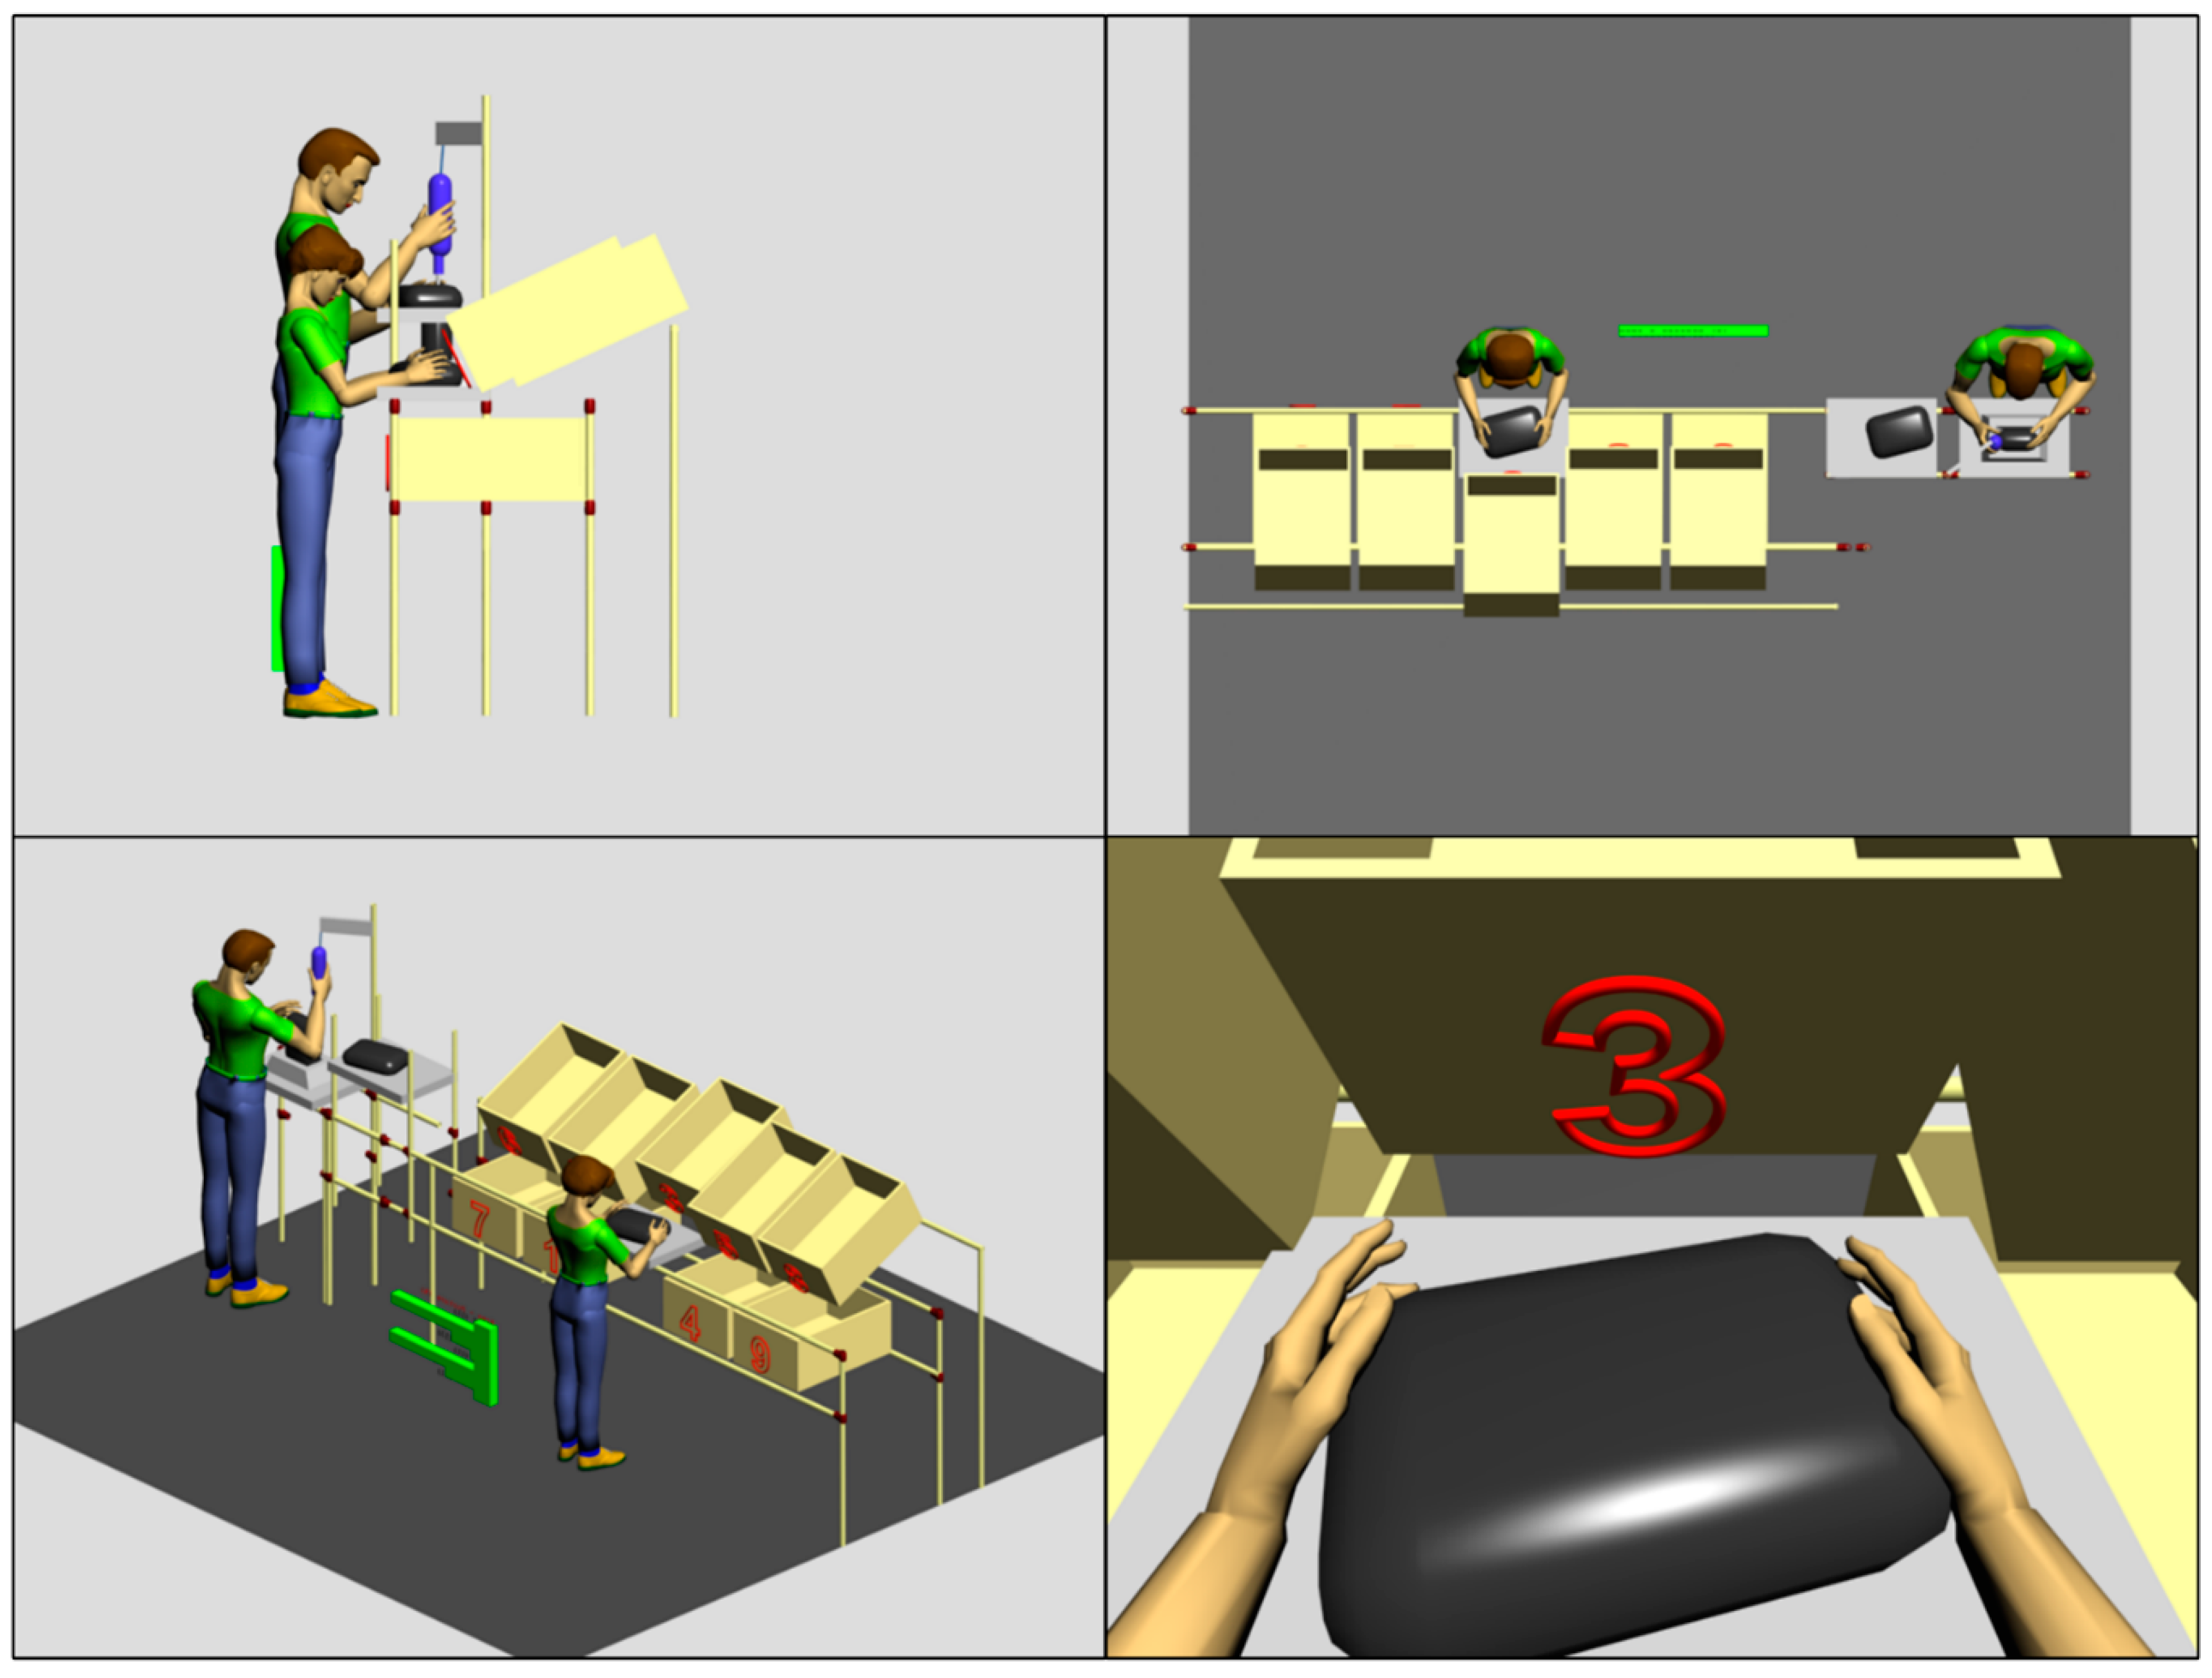
4.1.1. Workstations Characteristics
- (a)
- The station for manual positioning and fixing of elements inside the mirror body.
- (b)
- The station for fixing mirror’s components with a pneumatic screwdriver.
4.1.2. Applied Methodology
4.2. Workstations Analyses, Design Improvements, and Discussion
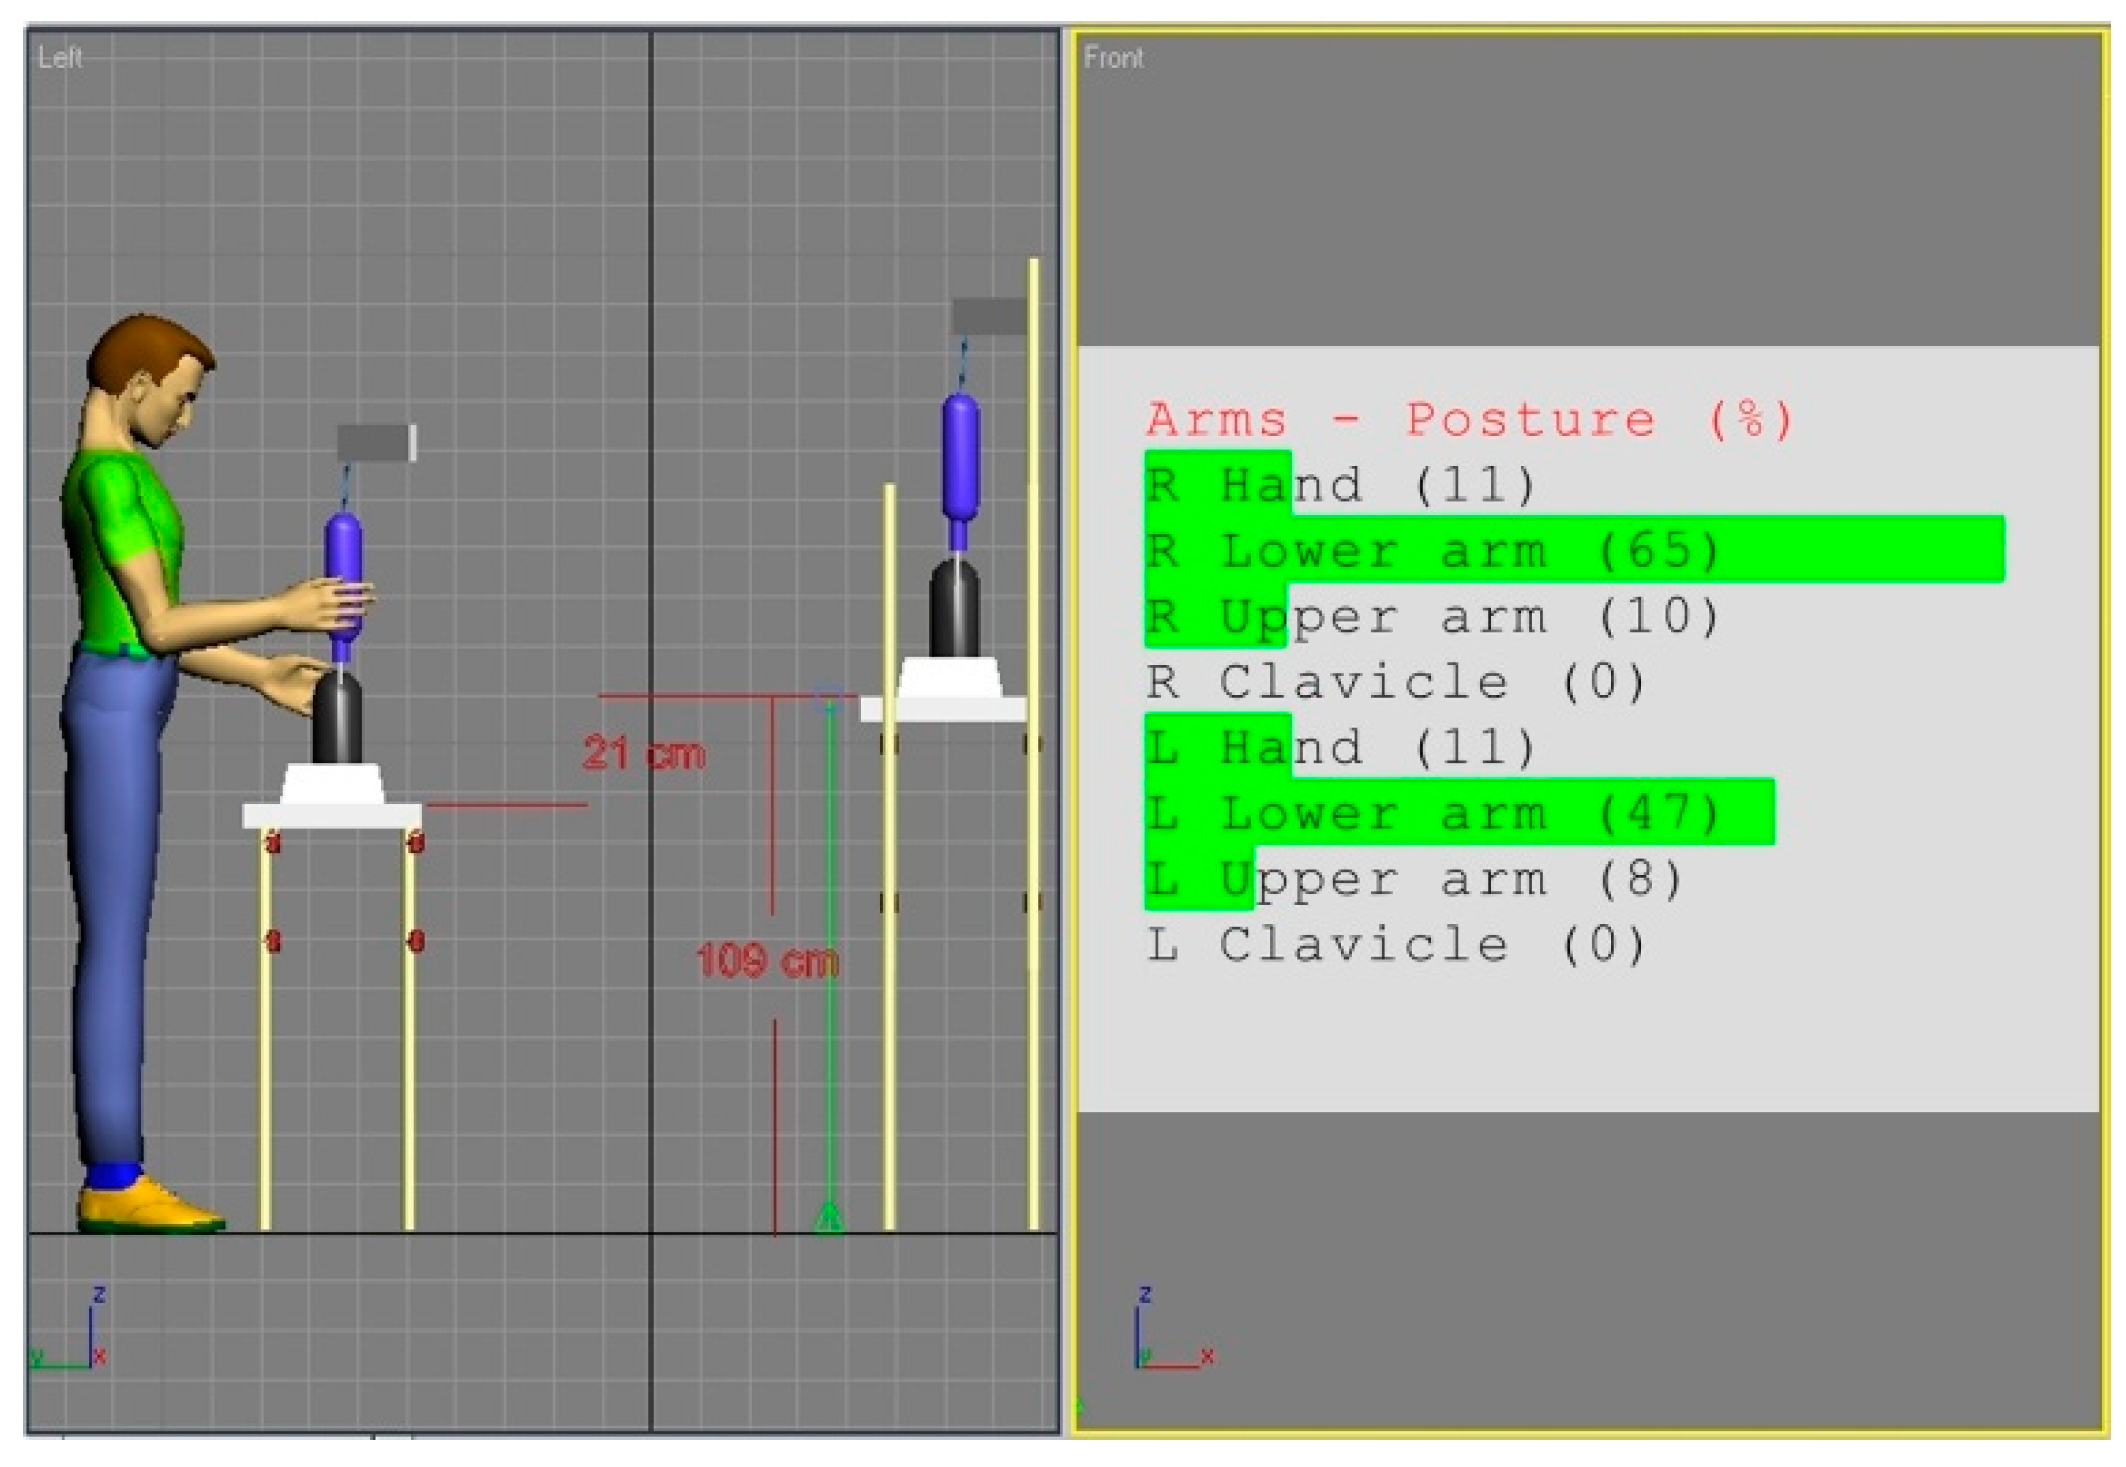
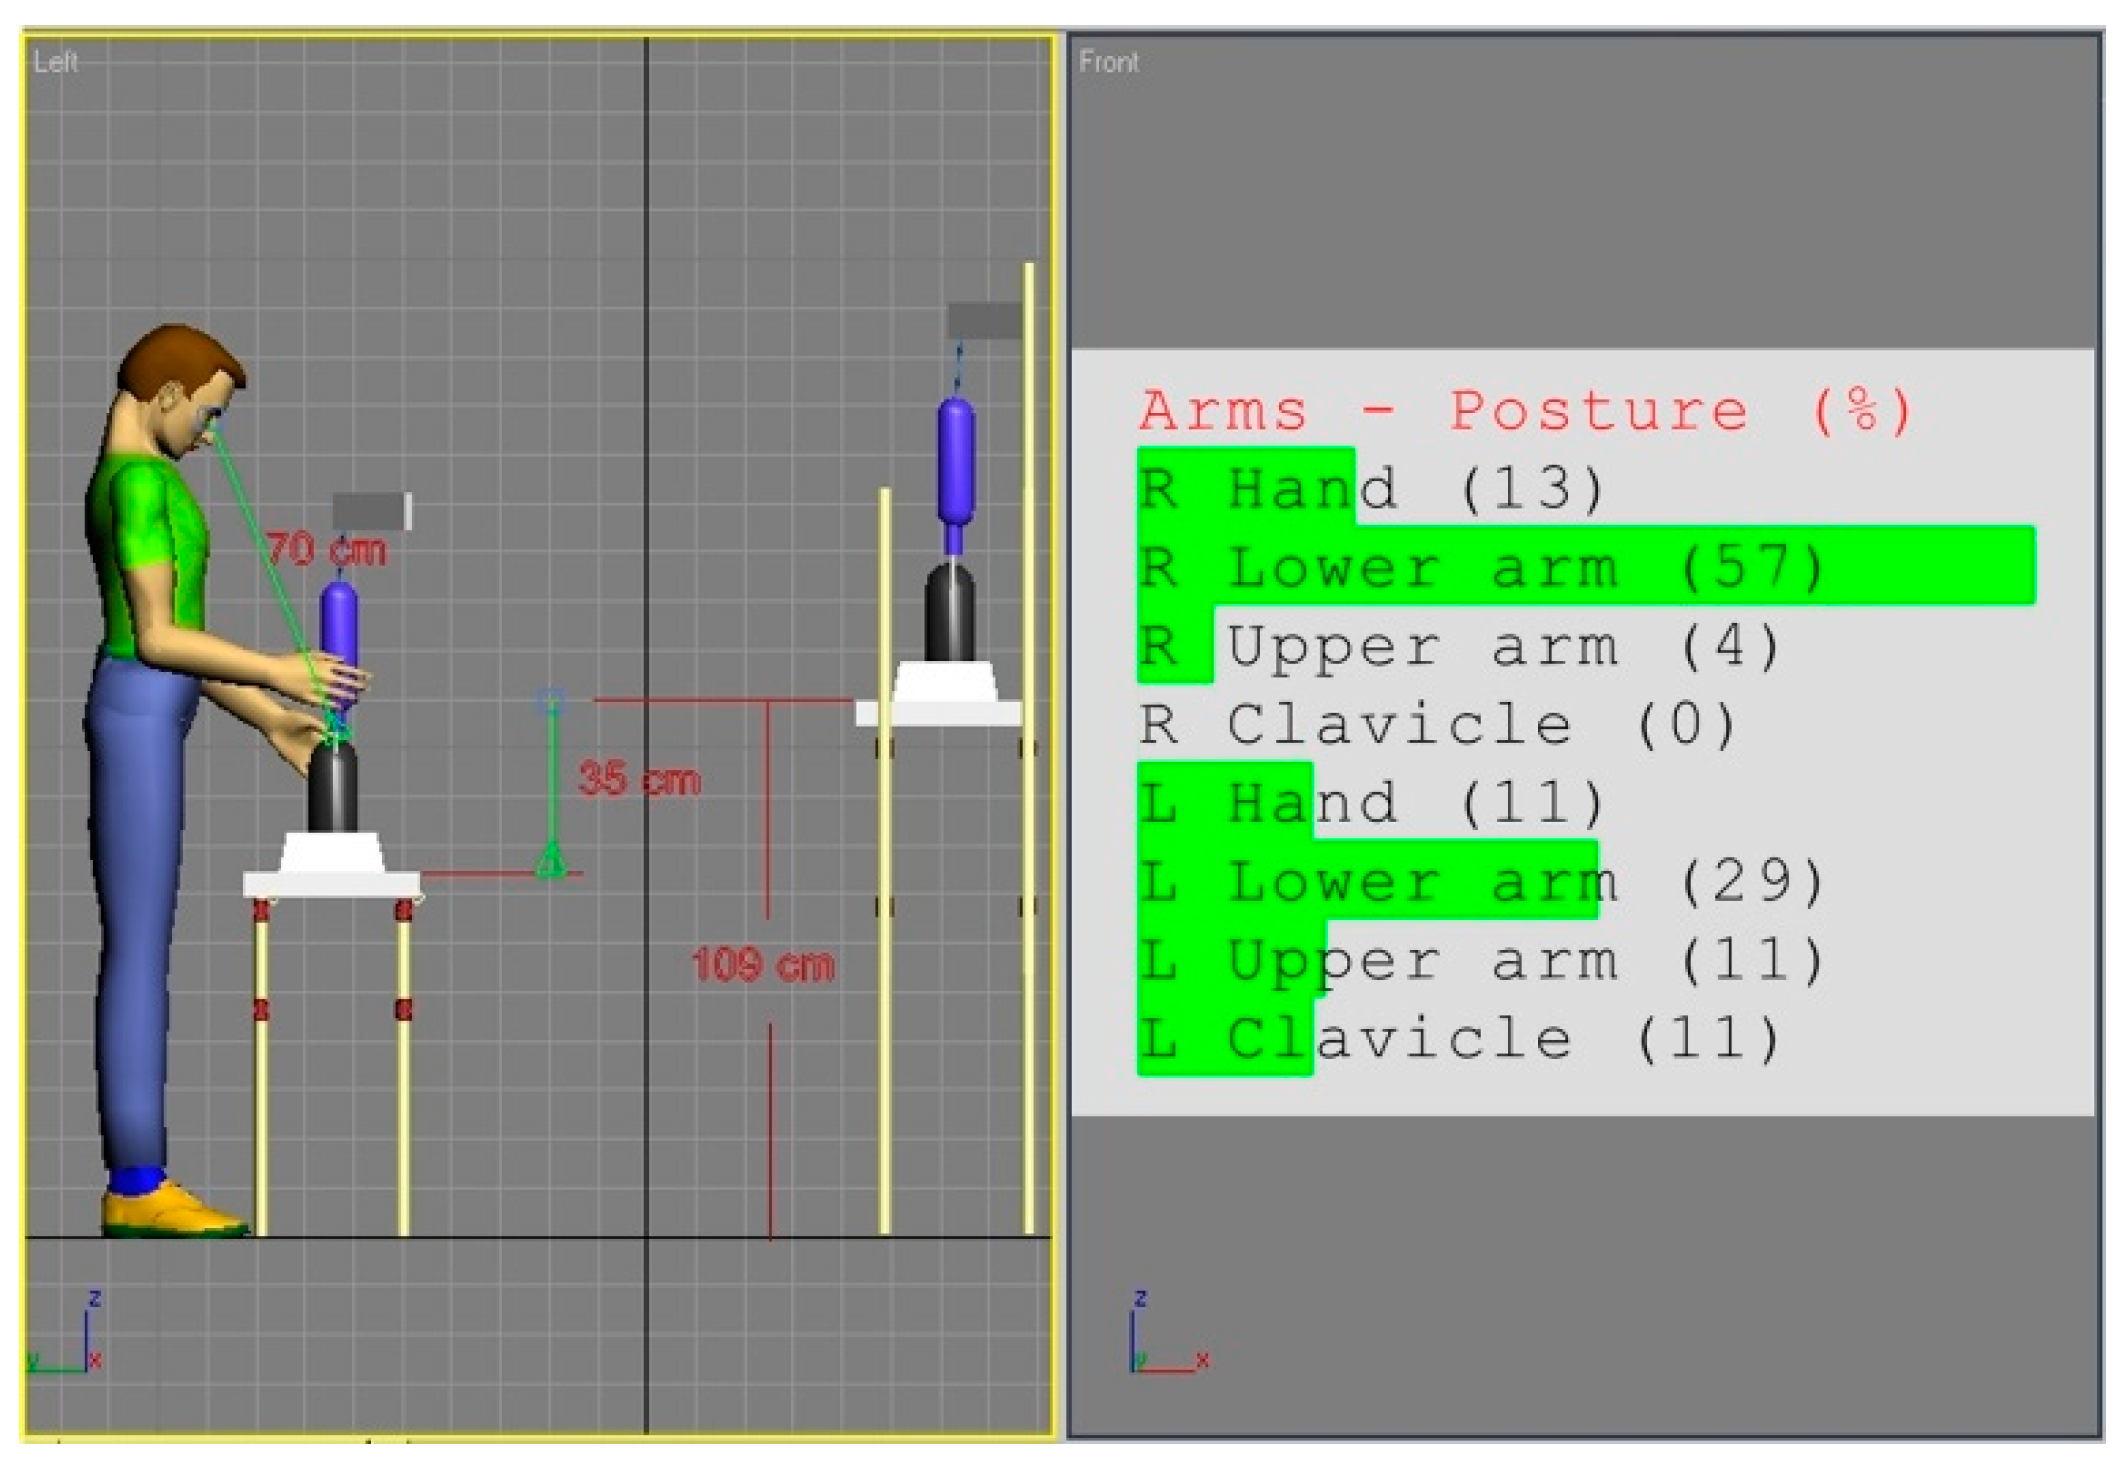
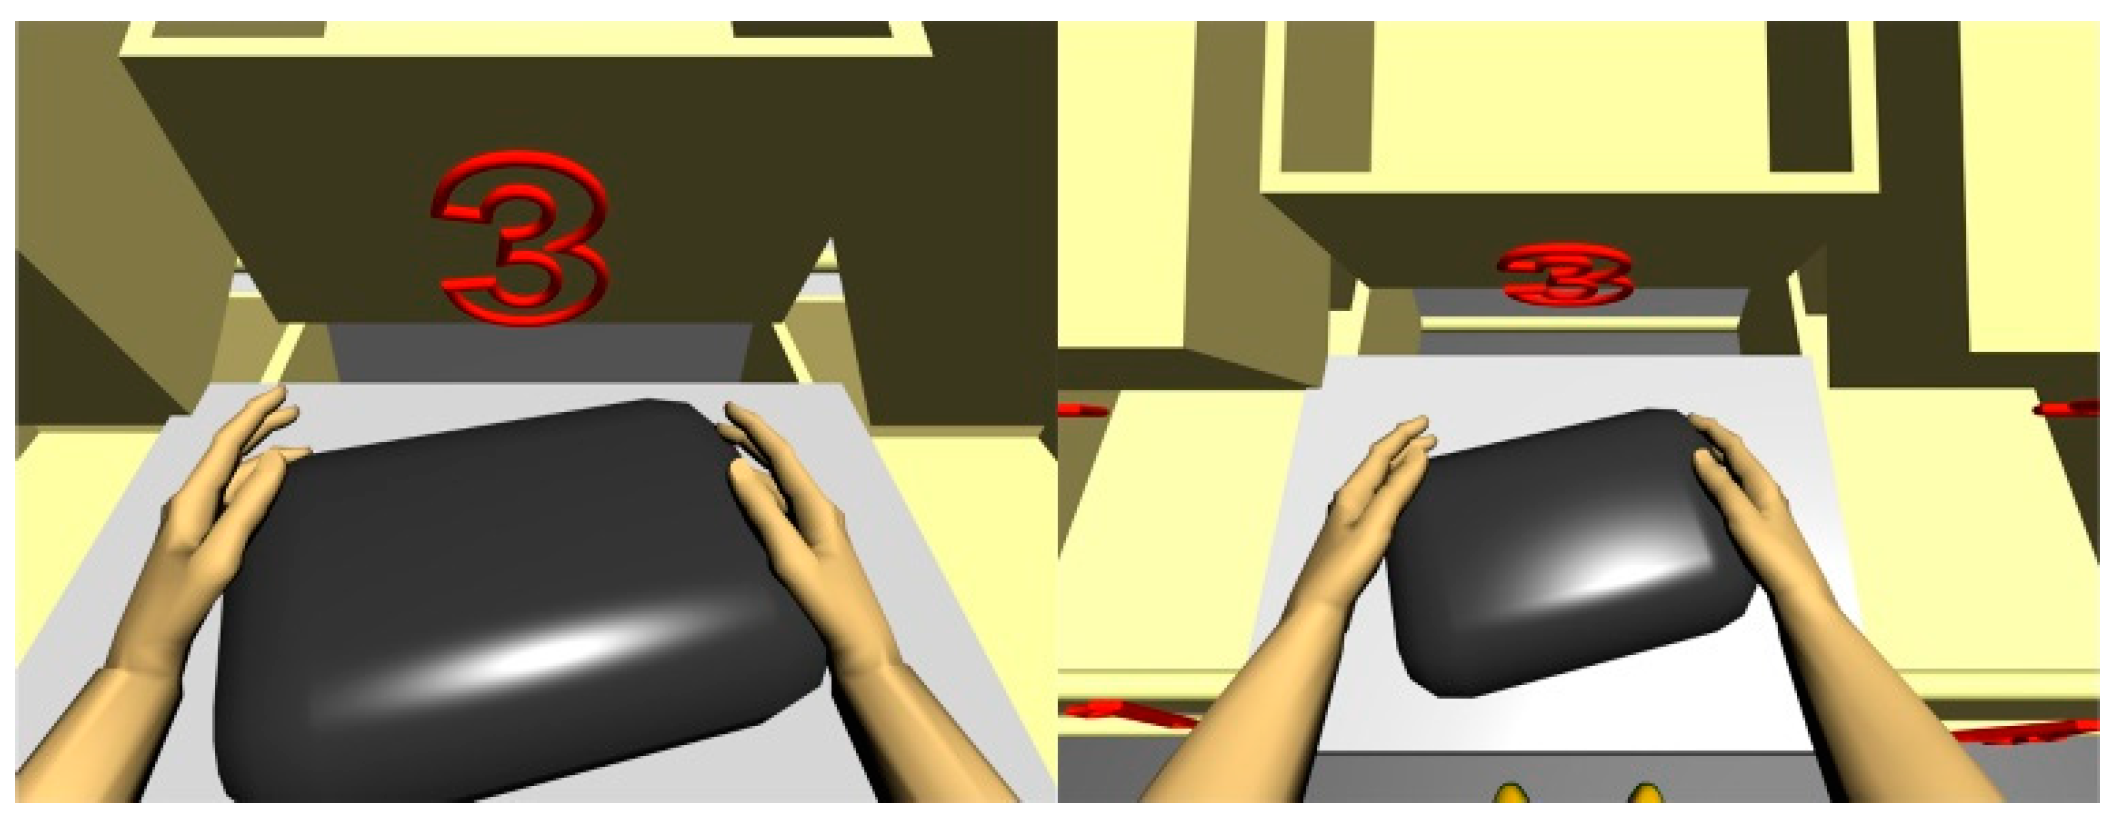
4.2.1. Workstation (a)—Manual Assembly
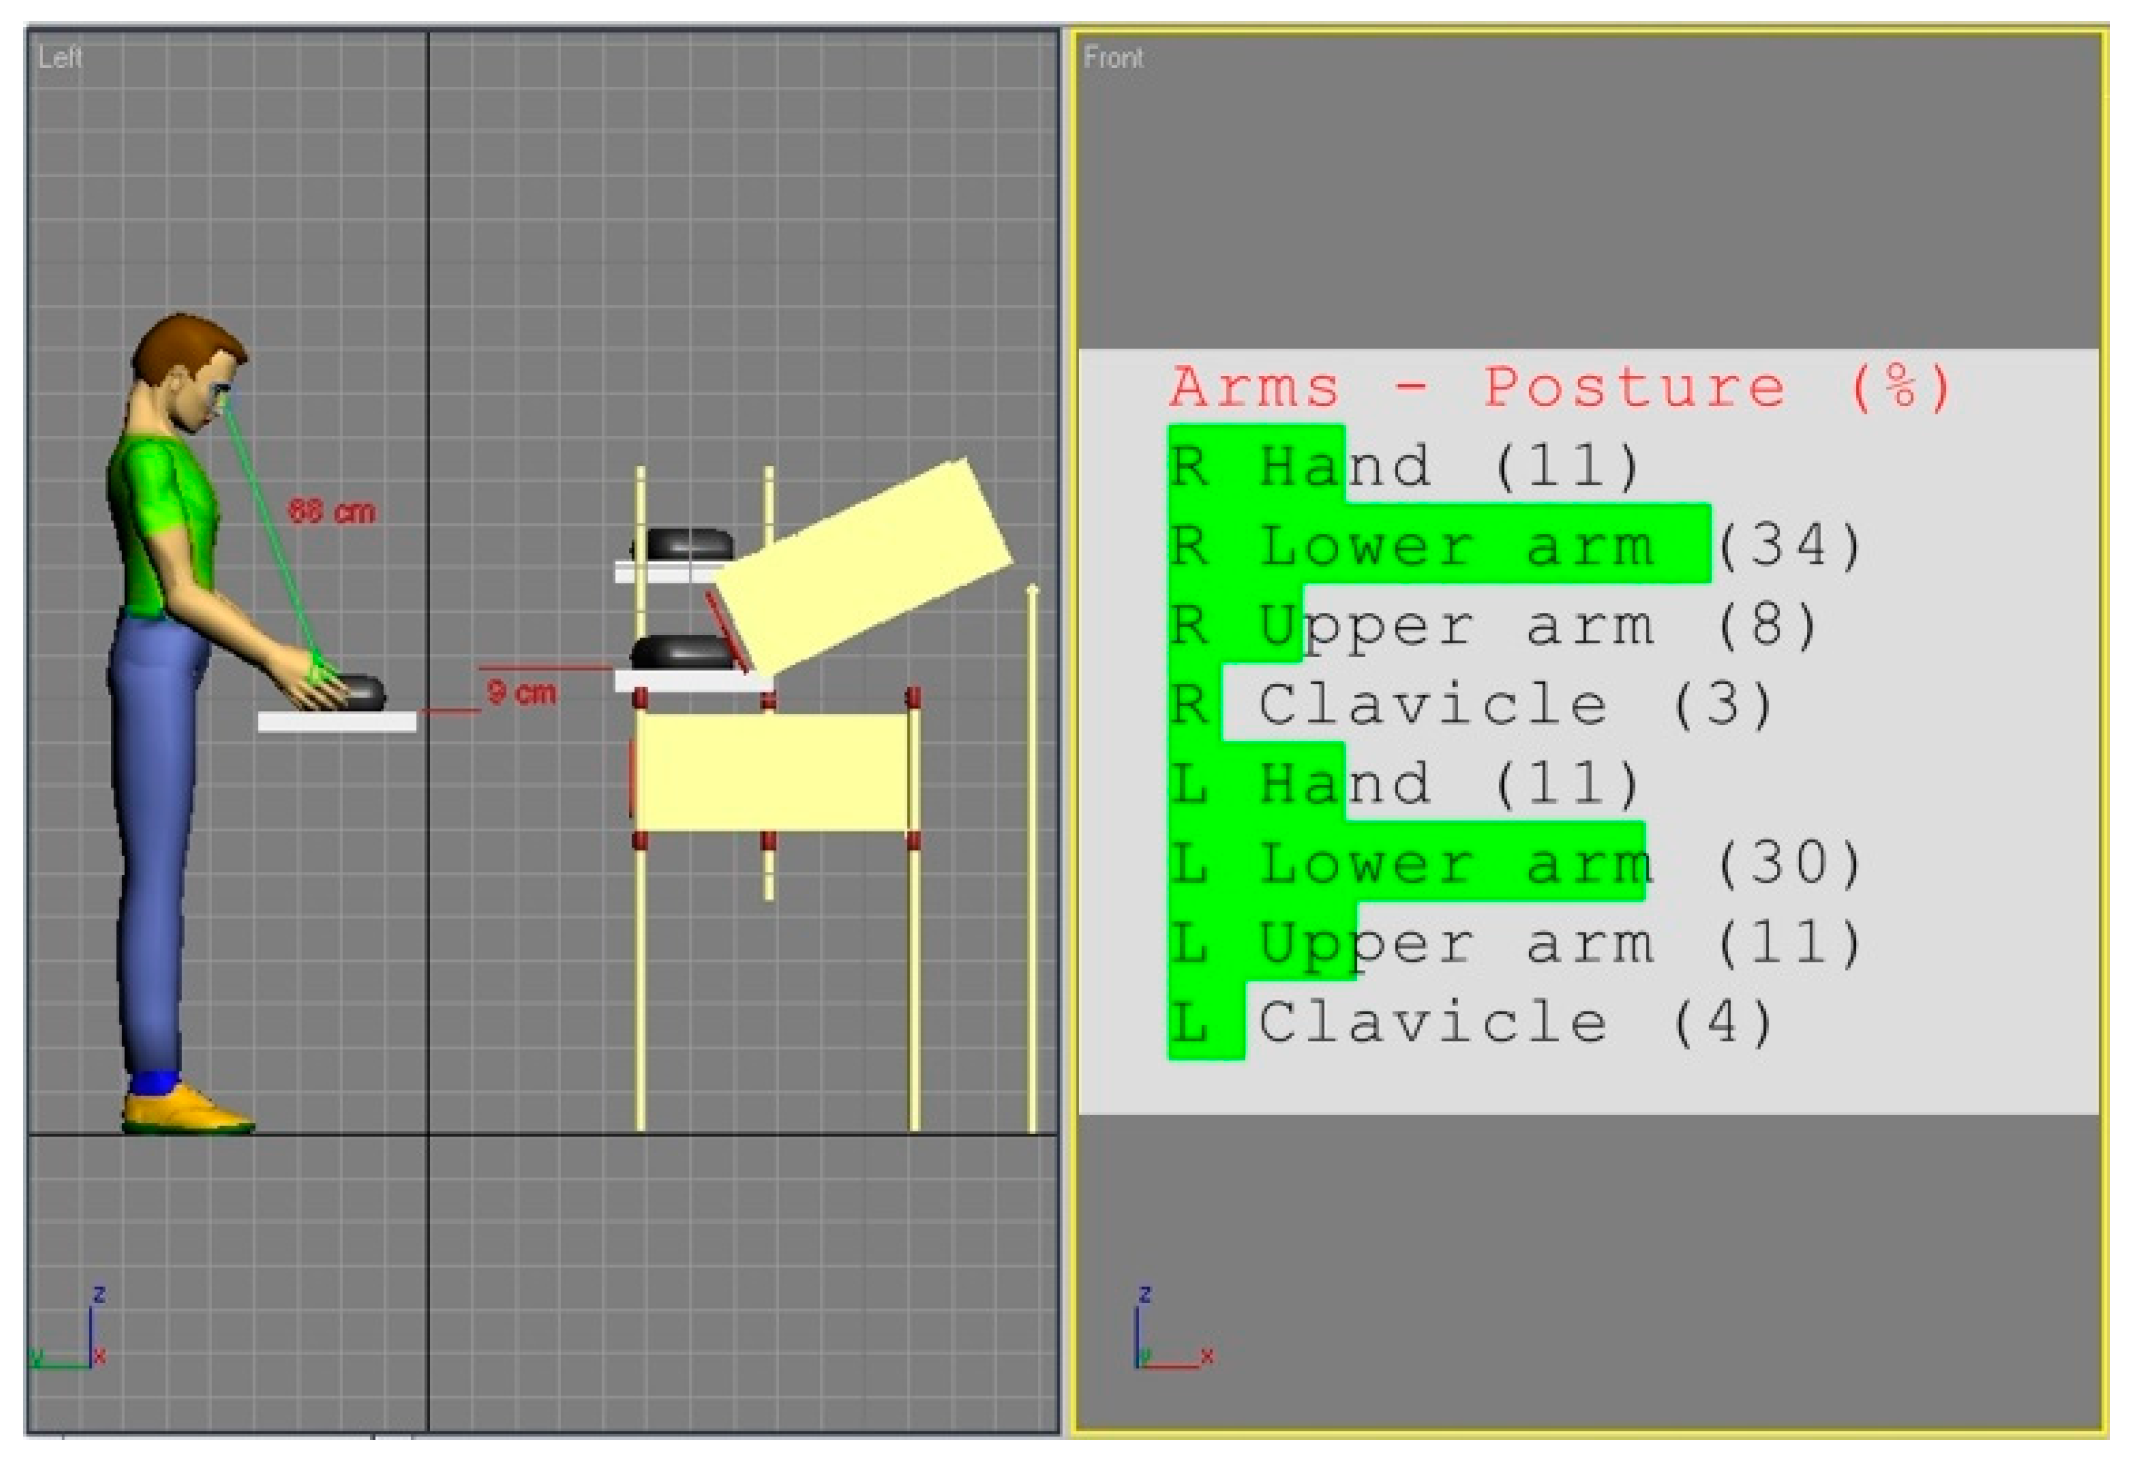
4.2.2. Workstation (b) with a Screwdriver
4.2.3. REBA Sensitivity Analysis
5. Conclusions
Author Contributions
Funding
Conflicts of Interest
References
- Simoneau, S.; St-Vincent, M.; Chicoine, D. Work-Related Musculoskeletal Disorders (WMSDs): A Better Understanding for More Effective Prevention; Institut de Recherche Robert Sauvé: Montréal, QC, Canada, 1996. [Google Scholar]
- De Kok, J.; Vroonhof, P.; Snijders, J.; Roullis, G.; Clarke, M.; Peereboom, K.; van Dorst, P.; Isusi, I. Work-Related Musculoskeletal Disorders: Prevalence, Costs and Demographics in the EU; European Agency for Safety and Health at Work, Publications Office of the European Union: Luxembourg, 2019; ISBN 978-92-9479-145-0. [Google Scholar]
- Hinrichsen, S.; Riediger, D.; Unrau, A. Assistance Systems in Manual Assembly. In Proceedings of the Production Engineering and Management, Bandung, Indonesia, 21–23 September 2016. [Google Scholar]
- Karhu, O.; Kansi, P.; Kuorinka, I. Correcting working postures in industry: A practical method for analysis. Appl. Ergon. 1977, 8, 199–201. [Google Scholar] [CrossRef]
- Gómez-Galán, M.; Pérez-Alonso, J.; Callejón-Ferre, Á.-J.; López-Martínez, J. Musculoskeletal disorders: OWAS review. Ind. Health 2017, 55, 314–337. [Google Scholar] [CrossRef] [PubMed] [Green Version]
- McAtamney, L.; Nigel Corlett, E. RULA: A survey method for the investigation of work-related upper limb disorders. Appl. Ergon. 1993, 24, 91–99. [Google Scholar] [CrossRef]
- Gómez-Galán, M.; Callejón-Ferre, Á.-J.; Pérez-Alonso, J.; Díaz-Pérez, M.; Carrillo-Castrillo, J.-A. Musculoskeletal Risks: RULA Bibliometric Review. Int. J. Environ. Res. Public. Health 2020, 17, 4354. [Google Scholar] [CrossRef] [PubMed]
- Hignett, S.; McAtamney, L. Rapid Entire Body Assessment (REBA). Appl. Ergon. 2000, 31, 201–205. [Google Scholar] [CrossRef]
- Hita-Gutiérrez, M.; Gómez-Galán, M.; Díaz-Pérez, M.; Callejón-Ferre, Á.-J. An Overview of REBA Method Applications in the World. Int. J. Environ. Res. Public. Health 2020, 17, 2635. [Google Scholar] [CrossRef] [Green Version]
- Aarås, A.; Westgaard, R.H.; Stranden, E. Postural angles as an indicator of postural load and muscular injury in occupational work situations. Ergonomics 1988, 31, 915–933. [Google Scholar] [CrossRef]
- Corlett, E.N.; Bishop, R.P. A Technique for Assessing Postural Discomfort. Ergonomics 1976, 19, 175–182. [Google Scholar] [CrossRef]
- Drury, C.G.; Coury, B.G. A methodology for chair evaluation. Appl. Ergon. 1982, 13, 195–202. [Google Scholar] [CrossRef]
- Bhatnager, V.; Drury, C.G.; Schiro, S.G. Posture, Postural Discomfort, and Performance. Hum. Factors 1985, 27, 189–199. [Google Scholar] [CrossRef]
- Kee, D. A method for analytically generating three-dimensional isocomfort workspace based on perceived discomfort. Appl. Ergon. 2002, 33, 51–62. [Google Scholar] [CrossRef]
- Floyd, W.F.; Ward, M.J. Posture in Industry. Int. J. Prod. Res. 1967, 5, 213–224. [Google Scholar] [CrossRef]
- Priya, K.C.; Singh, J.K.; Kumar, A. A Comparative Study of Postural Stress for Ergonomically Compatible Design in Selected Manual Weeding Tool. Int. J. Curr. Microbiol. Appl. Sci. 2018, 7, 136–141. [Google Scholar] [CrossRef]
- Gómez-Galán, M.; Pérez-Alonso, J.; Callejón-Ferre, Á.-J.; Sánchez-Hermosilla-López, J. Assessment of Postural Load during Melon Cultivation in Mediterranean Greenhouses. Sustainability 2018, 10, 2729. [Google Scholar] [CrossRef] [Green Version]
- Bubb, H. Why do we need digital human models. In DHM and Posturography; Scataglini, S., Paul, G., Eds.; Academic Press: Cambridge, MA, USA, 2019; pp. 7–32. ISBN 978-0-12-816713-7. [Google Scholar]
- Bonney, M.C.; Case, K.; Hughes, B.J.; Kennedy, D.N.; Williams, R.W. Using SAMMIE for Computer-Aided Workplace and Work Task Design; SAE International: Warrendale, PA, USA, 1974. [Google Scholar]
- Case, K.; Porter, J.M.; Bonney, M.C. SAMMIE: A Computer Aided Design Tool for Ergonomists. Proc. Hum. Factors Soc. Annu. Meet. 1986. [Google Scholar] [CrossRef]
- Case, K.; Porter, J.M.; Bonney, M.C. SAMMIE: A man and workplace modelling system. In Computer-Aided Ergonomics; Karwowski, W., Genaidy, A.M., Asfour, S., Eds.; Taylor and Francis: London, UK, 1990; pp. 31–56. [Google Scholar]
- Feeney, R.; Summerskill, S.; Porter, M.; Freer, M. Designing for disabled people using a 3D human modelling CAD system. In Ergonomic Software Tools in Product and Workplace Design; Landau, K., Ed.; Verlag ERGON GmbH: Stuttgart, Germany, 2000; pp. 195–203. [Google Scholar]
- Grobelny, J. Including anthropometry into the AutoCAD-microcomputer system for aiding engineering drafting. In Trends in Ergonomics/Human Factors; Aghazadeh, V.F., Ed.; North-Holland: Amsterdam, The Netherlands, 1988; pp. 77–82. [Google Scholar]
- Grobelny, J.; Cysewski, P.; Karwowski, W.; Zurada, J. Apolin: A 3-dimensional ergonomic design and analysis system. In Computer Applications in Ergonomics, Occupational Safety and Health; Mattila, M., Karwowski, W., Eds.; Elsevier: Amsterdam, The Netherlands, 1992; pp. 129–135. [Google Scholar]
- Lippman, R. Anthropos quo vadis? Anthropos human modeling past and future. In Ergonomic Software Tools in Product and Workplace Design; Landau, K., Ed.; Verlag ERGON GmbH: Stuttgart, Germany, 2000; pp. 156–168. [Google Scholar]
- Bauer, W.; Lippman, R.; Rossler, A. Virtual human models in product development. In Ergonomic Software Tools in Product and Workplace Design; Landau, K., Ed.; Verlag ERGON GmbH: Stuttgart, Germany, 2000; pp. 114–120. [Google Scholar]
- IST. Anthropos 5 das Menschmodell der IST GmbH. Manual 2 Interaktionen; IST GmbH: Kallmünz, Germany, 1998. [Google Scholar]
- IST. Anthropos ErgoMAX—User Guide; IST GmbH: Kallmünz, Germany, 2002. [Google Scholar]
- Fleck, J.; Butler, F.E. Validation of the Crash Victim Simulator; NTIS: Springfield, VA, USA, 1981. [Google Scholar]
- Esteves, G.; Ferreira, C.; Veloso, A.; Brandão, F. Development of a Model of the Muscle Skeletal System using Adams. In Its Application to an Ergonomic Study in Automotive Industry; SAE International: Warrendale, PA, USA, 2004; pp. 2004–2169. [Google Scholar]
- Hatami, M.; Wang, D.; Qu, A.; Xiangsen, Z.; Wang, Q.; Baradaran Kazemian, B. Dynamic Simulation of Biomechanical Behaviour of the Pelvis in the Lateral Impact Loads. J. Healthc. Eng. 2018, 2018. [Google Scholar] [CrossRef]
- Maltha, J. Madymo Crash Victim Simulations Handbook; The National Academies of Sciences, Engineering, and Medicine: Washington, DC, USA, 1983. [Google Scholar]
- Schmitt, K.-U.; Niederer, P.F.; Muser, M.H.; Walz, F. Trauma Biomechanics: Accidental Injury in Traffic and Sports, 3rd ed.; Springer-Verlag: Berlin/Heidelberg, Germany, 2010; ISBN 978-3-642-03713-9. [Google Scholar]
- TASS International, Siemens Madymo. Available online: https://tass.plm.automation.siemens.com/madymo (accessed on 7 August 2020).
- Grobelny, J.; Karwowski, W. A Computer Aided System for Ergonomic Design and Analysis for AutoCad User; Landau, K., Ed.; Human Factors Association of Canada: Toronto, ON, Canada, 1994; pp. 302–303. [Google Scholar]
- Grobelny, J.; Karwowski, W. Apolinex: A human model and computer-aided approach for ergonomic workplace design in open CAD environment. In Ergonomic Software Tools in Product and Workplace Design; Landau, K., Ed.; Verlag ERGON GmbH: Stuttgart, Germany, 2000; pp. 121–131. [Google Scholar]
- Grobelny, J.; Michalski, R.; Kukuła, J. Wirtualne manekiny w projektowaniu ergonomicznym stanowisk pracy. In Obciążenie Układu Ruchu. Przyczyny i Skutki; Palucha, R., Jach, K., Michalskiego, R., Eds.; Oficyna Wydawnicza Politechniki Wrocławskiej: Wrocław, Poland, 2006; pp. 61–67. ISBN 83-7085-946-1. [Google Scholar]
- Sengupta, A.K.; Das, B. Human: An autocad based three dimensional anthropometric human model for workstation design. Int. J. Ind. Ergon. 1997, 19, 345–352. [Google Scholar] [CrossRef]
- Chaffin, D.B. Development of computerized human static strength simulation model for job design. Hum. Factors Ergon. Manuf. Serv. Ind. 1997, 7, 305–322. [Google Scholar] [CrossRef]
- Feyen, R.; Liu, Y.; Chaffin, D.; Jimmerson, G.; Joseph, B. Computer-aided ergonomics: A case study of incorporating ergonomics analyses into workplace design. Appl. Ergon. 2000, 31, 291–300. [Google Scholar] [CrossRef]
- Chaffin, D.B. Digital Human Modeling for Workspace Design. Rev. Hum. Factors Ergon. 2008. [Google Scholar] [CrossRef]
- Berlin, C.; Kajaks, T. Time-related ergonomics evaluation for DHMs: A literature review. Int. J. Hum. Factors Model. Simul. 2010, 1, 356. [Google Scholar] [CrossRef]
- Badler, N.; Becket, W.; Webber, B. Simulation and analysis of complex human tasks. Cent. Hum. Model. Simul. 1995, 2596, 225–233. [Google Scholar]
- Siemens Tecnomatix. Human Modeling and Simulation. Available online: https://www.plm.automation.siemens.com/global/en/products/tecnomatix/human-modeling-simulation.html (accessed on 7 August 2020).
- Seidl, A. RAMSIS-A New CAD-Tool for Ergonomic Analysis of Vehicles Developed for the German Automotive Industry; SAE International: Warrendale, PA, USA, 1997. [Google Scholar]
- Bubb, H.; Engstler, F.; Fritzsche, F.; Mergl, C.; Sabbah, O.; Schaefer, P.; Zacher, I. The development of RAMSIS in past and future as an example for the cooperation between industry and university. Int. J. Hum. Factors Model. Simul. 2006, 1, 140. [Google Scholar] [CrossRef]
- Fortin, C.; Gilbert, R.; Beuter, A.; Laurent, F.; Schiettekatte, J.; Carrier, R.; Dechamplam, B. SAFEWORK: A microcomputer-aided workstation design and analysis. New advances and future developments. In Computer Aided Ergonomics; Karwowski, W., Genaidy, A.M., Asfour, S., Eds.; Taylor & Francis: London, UK, 1990; pp. 157–180. [Google Scholar]
- Dassault Systèmes DELMIA 3Dexperience Platform. Available online: https://www.3ds.com/products-services/delmia/products/delmia-3dexperience/ (accessed on 7 August 2020).
- Abdel-Malek, K.; Yang, J.; Kim, J.H.; Marler, T.; Beck, S.; Swan, C.; Frey-Law, L.; Mathai, A.; Murphy, C.; Rahmatallah, S.; et al. Development of the Virtual-Human SantosTM. In Proceedings of the Digital Human Modeling; Duffy, V.G., Ed.; Springer: Berlin/Heidelberg, Germany, 2007; pp. 490–499. [Google Scholar]
- Abdel-Malek, K.; Arora, J.; Bhatt, R.; Farrell, K.; Murphy, C.; Kregel, K. Santos: An integrated human modeling and simulation platform. In DHM and Posturography; Scataglini, S., Paul, G., Eds.; Academic Press: Cambridge, MA, USA, 2019; pp. 63–77. ISBN 978-0-12-816713-7. [Google Scholar]
- Deros, B.M.; Khamis, N.K.; Ismail, A.R.; Jamaluddin, H.; Adam, A.M.; Rosli, S. An Ergonomics Study on Assembly Line Workstation Design. Am. J. Appl. Sci. 2011, 8, 1195–1201. [Google Scholar] [CrossRef] [Green Version]
- Gragg, J.; Yang, J.; Howard, B. Hybrid method for driver accommodation using optimization-based digital human models. Comput. Aided Des. 2012, 44, 29–39. [Google Scholar] [CrossRef]
- Michalski, R.; Grobelny, J. Designing Emergency-Medical-Service Helicopter Interiors Using Virtual Manikins. IEEE Comput. Graph. Appl. 2014, 34, 16–23. [Google Scholar] [CrossRef]
- Roebuck, J.A.; Kroemer, K.H.E.; Thomson, W.G. Engineering Anthropometry Methods; Wiley-Interscience: New York, NY, USA, 1975; ISBN 978-0-471-72975-4. [Google Scholar]
- Kroemer, K.H.E. Engineering Anthropometry. Proc. Hum. Factors Soc. Annu. Meet. 1976, 20, 365–367. [Google Scholar] [CrossRef]
- Garneau, C.J.; Parkinson, M.B. A comparison of methodologies for designing for human variability. J. Eng. Des. 2011, 22, 505–521. [Google Scholar] [CrossRef]
- Grobelny, J. Anthropometric data for a driver’s workplace designing the AutoCAD system. In Computer-Aided Ergonomics; Karwowski, W., Genaidy, A.M., Asfour, S.S., Eds.; Taylor & Francis: London, UK, 1990; pp. 80–89. [Google Scholar]
- Yang, J.; Abdel-Malek, K. Human reach envelope and zone differentiation for ergonomic design. Hum. Factors Ergon. Manuf. Serv. Ind. 2009, 19, 15–34. [Google Scholar] [CrossRef]
- Park, J.; Reed, M.P. Predicting vehicle occupant postures using statistical models. In DHM and Posturography; Scataglini, S., Paul, G., Eds.; Academic Press: Cambridge, MA, USA, 2019; pp. 799–803. ISBN 978-0-12-816713-7. [Google Scholar]
- Sanjog, J.; Karmakar, S.; Patel, T.; Chowdhury, A. Towards virtual ergonomics: Aviation and aerospace. Aircr. Eng. Aerosp. Technol. Int. J. 2015, 87, 266–273. [Google Scholar] [CrossRef]
- Bernard, F.; Zare, M.; Sagot, J.-C.; Paquin, R. Using Digital and Physical Simulation to Focus on Human Factors and Ergonomics in Aviation Maintainability. Hum. Factors 2019. [Google Scholar] [CrossRef] [PubMed]
- Bartnicka, J. Knowledge-based ergonomic assessment of working conditions in surgical ward—A case study. Saf. Sci. 2015, 71, 178–188. [Google Scholar] [CrossRef]
- Şuteu Băncilă, A.M.A.; Buzatu, C. Digital Human Modeling in the Development of Assistive Technologies for Elderly Users. Available online: https://www.scientific.net/AMM.809-810.835 (accessed on 6 August 2020).
- Maurya, C.M.; Karmakar, S.; Das, A.K. Digital human modeling (DHM) for improving work environment for specially-abled and elderly. SN Appl. Sci. 2019, 1, 1326. [Google Scholar] [CrossRef] [Green Version]
- Grobelny, J.; Michalski, R. Waldemar Karwowski Workload Assessment Predictability for Digital Human Models. In Handbook of Digital Human Modeling; Duffy, V., Ed.; CRC Press: Boca Raton, FL, USA, 2008; Volume 20081561, pp. 28-1–28-13. ISBN 978-0-8058-5646-0. [Google Scholar]
- Schall, M.C.; Fethke, N.B.; Roemig, V. Digital Human Modeling in the Occupational Safety and Health Process: An Application in Manufacturing. IISE Trans. Occup. Ergon. Hum. Factors 2018, 6, 64–75. [Google Scholar] [CrossRef] [PubMed]
- Peruzzini, M.; Pellicciari, M.; Gadaleta, M. A comparative study on computer-integrated set-ups to design human-centred manufacturing systems. Robot. Comput.-Integr. Manuf. 2019, 55, 265–278. [Google Scholar] [CrossRef]
- Zhang, Y.; Wu, X.; Gao, J.; Chen, J.; Xv, X. Simulation and Ergonomic Evaluation of Welders’ Standing Posture Using Jack Software. Int. J. Environ. Res. Public. Health 2019, 16, 4354. [Google Scholar] [CrossRef] [Green Version]
- Dukic, T.; Rönnäng, M.; Christmansson, M. Evaluation of ergonomics in a virtual manufacturing process. J. Eng. Des. 2007, 18, 125–137. [Google Scholar] [CrossRef]
- Lämkull, D.; Hanson, L. Roland Örtengren A comparative study of digital human modelling simulation results and their outcomes in reality: A case study within manual assembly of automobiles. Int. J. Ind. Ergon. 2009, 39, 428–441. [Google Scholar] [CrossRef]
- Yang, Q.; Wu, D.L.; Zhu, H.M.; Bao, J.S.; Wei, Z.H. Assembly operation process planning by mapping a virtual assembly simulation to real operation. Comput. Ind. 2013, 64, 869–879. [Google Scholar] [CrossRef]
- Zhu, W.; Fan, X.; Zhang, Y. Applications and research trends of digital human models in the manufacturing industry. Virtual Real. Intell. Hardw. 2019, 1, 558–579. [Google Scholar] [CrossRef]
- Mgbemena, C.E.; Tiwari, A.; Xu, Y.; Prabhu, V.; Hutabarat, W. Ergonomic evaluation on the manufacturing shop floor: A review of hardware and software technologies. CIRP J. Manuf. Sci. Technol. 2020. [Google Scholar] [CrossRef]
- Rizkya, I.; Syahputri, K.; Sari, R.M.; Siregar, I. Evaluation of work posture and quantification of fatigue by Rapid Entire Body Assessment (REBA). IOP Conf. Ser. Mater. Sci. Eng. 2018, 309, 012051. [Google Scholar] [CrossRef] [Green Version]
- Cho, C.-Y.; Hwang, Y.-S.; Cherng, R.-J. Musculoskeletal Symptoms and Associated Risk Factors Among Office Workers With High Workload Computer Use. J. Manipulative Physiol. Ther. 2012, 35, 534–540. [Google Scholar] [CrossRef] [PubMed]
- Roquelaure, Y. Musculoskeletal Disorders and Psychosocial Factors at Work; ETUI, The European Trade Union Institute: Brussels, Belgium, 2018. [Google Scholar]


| Anthropos Posture (% of Range) | Position/Movement (Degrees) | REBA Code | |
|---|---|---|---|
| Upper arm | <11 | Flexion <20 | 1 |
| 11–25 | Flexion 20–45 | 2 | |
| 25–50 | Flexion 45–90 | 3 (+1 if shoulder is raised) | |
| >50 | Flexion 90 | 4 (+1 if shoulder is raised) | |
| Lower arm | 0–50 | Flexion 0–60 | 2 |
| 50–83 | Flexion 60–100 | 1 | |
| >83 | Flexion >100 | 2 | |
| Hand | +/−25 | Extension/flexion +/− 15 | 1 (+1 if wrist deviated or twisted) |
| >25 | Extension/flexion >15 | 2 (+1 if wrist deviated or twisted) |
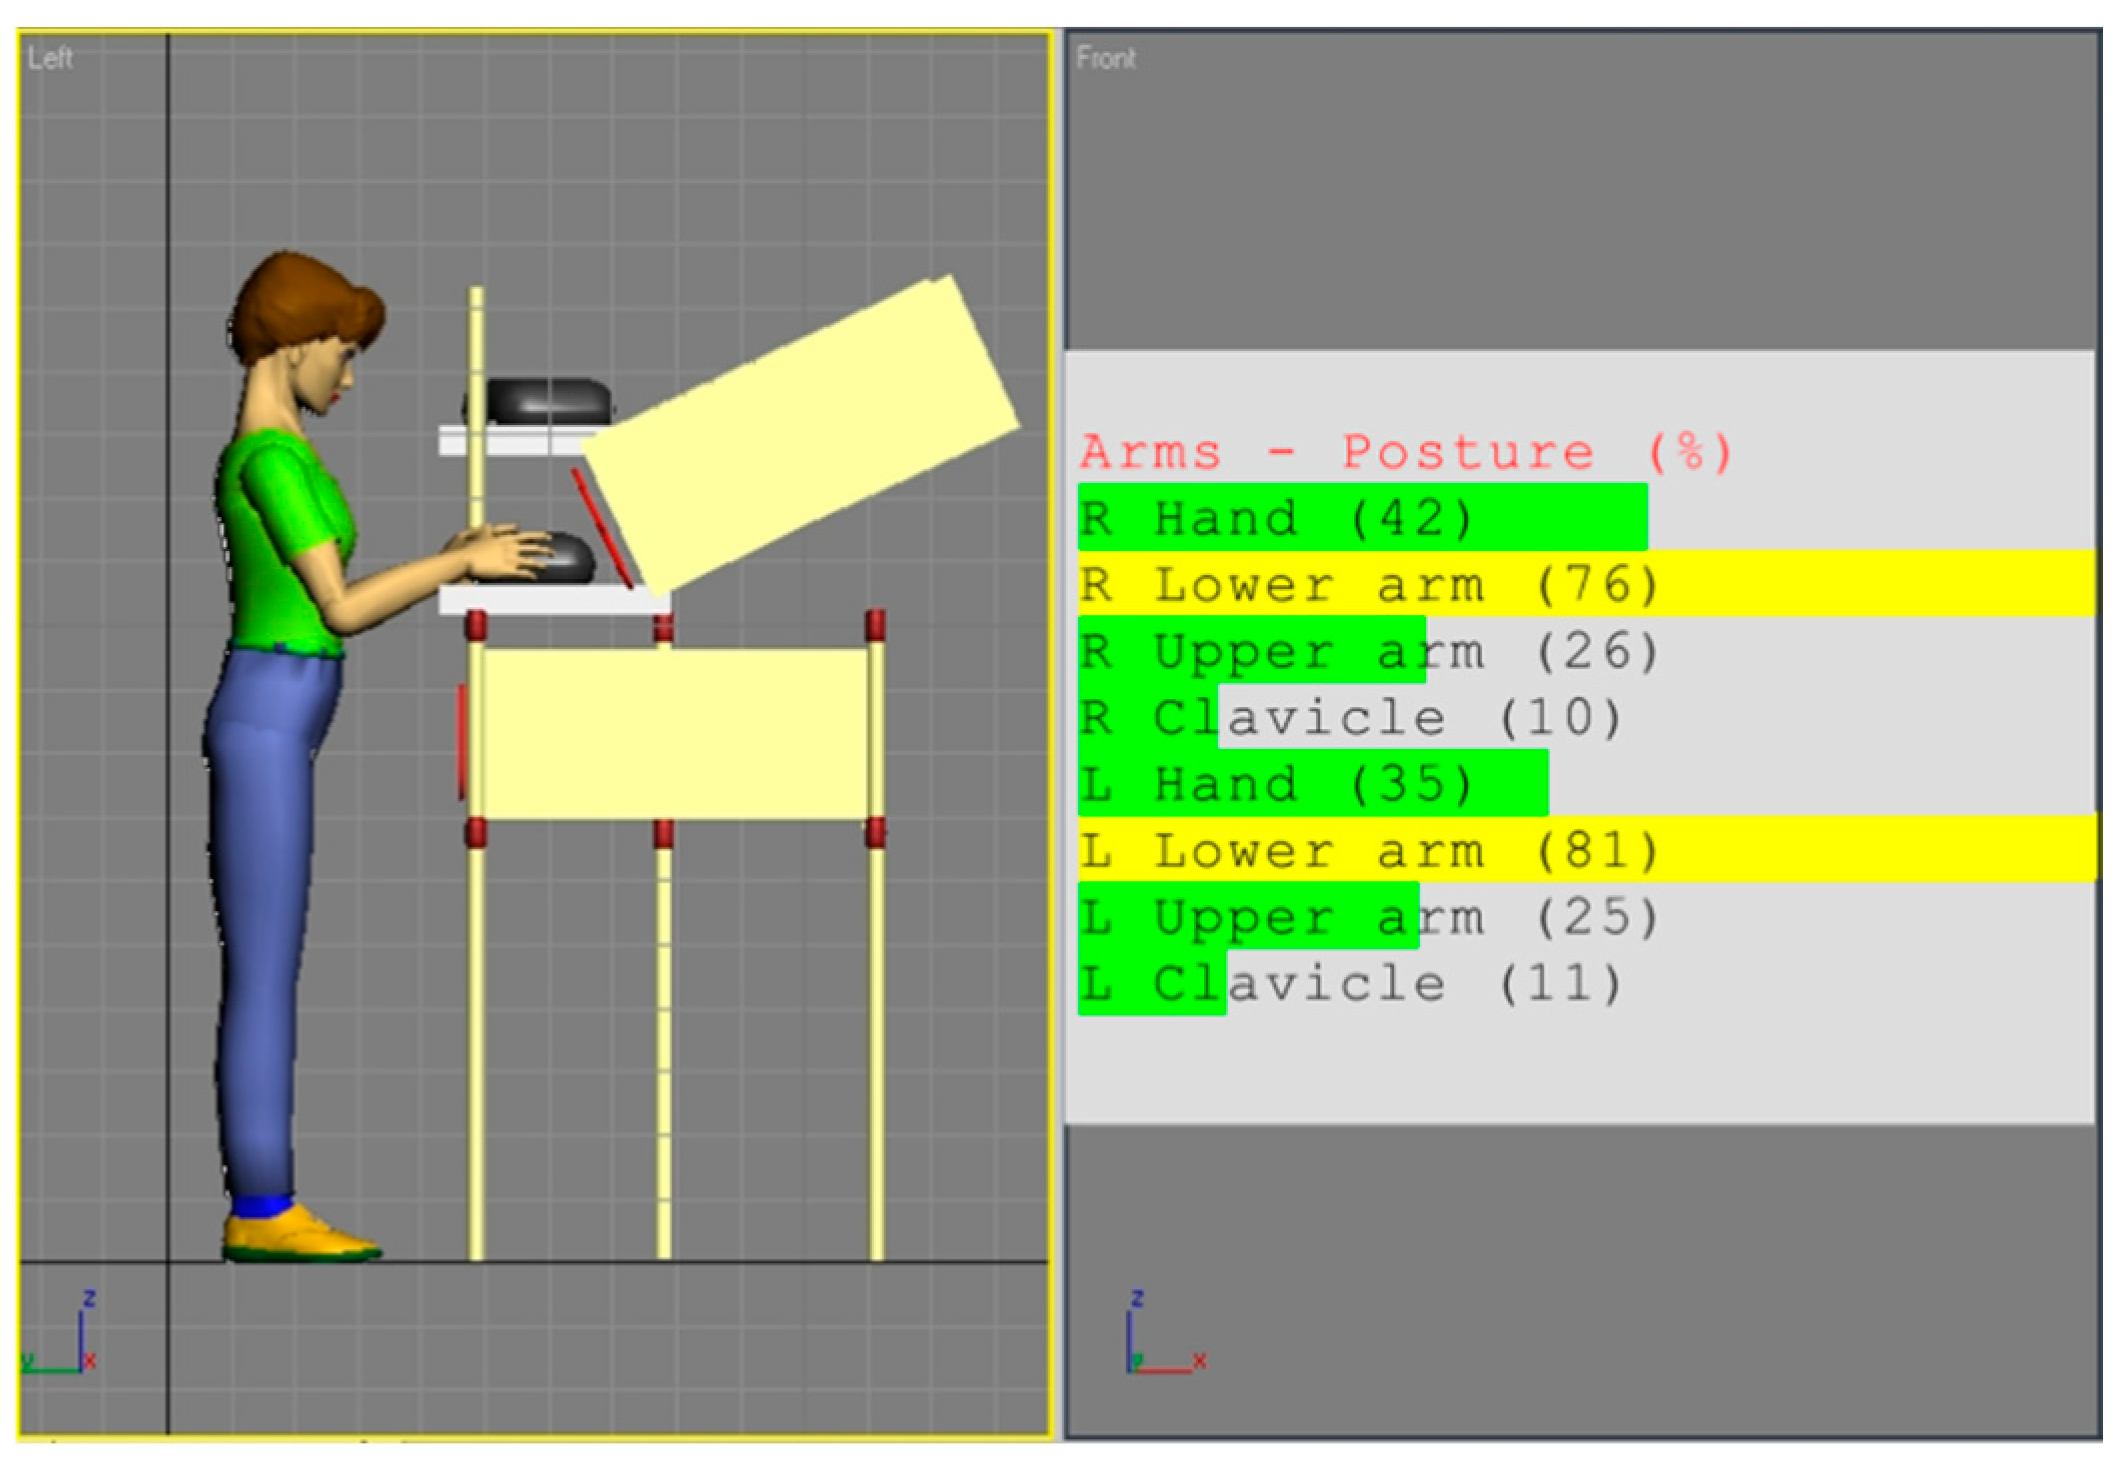
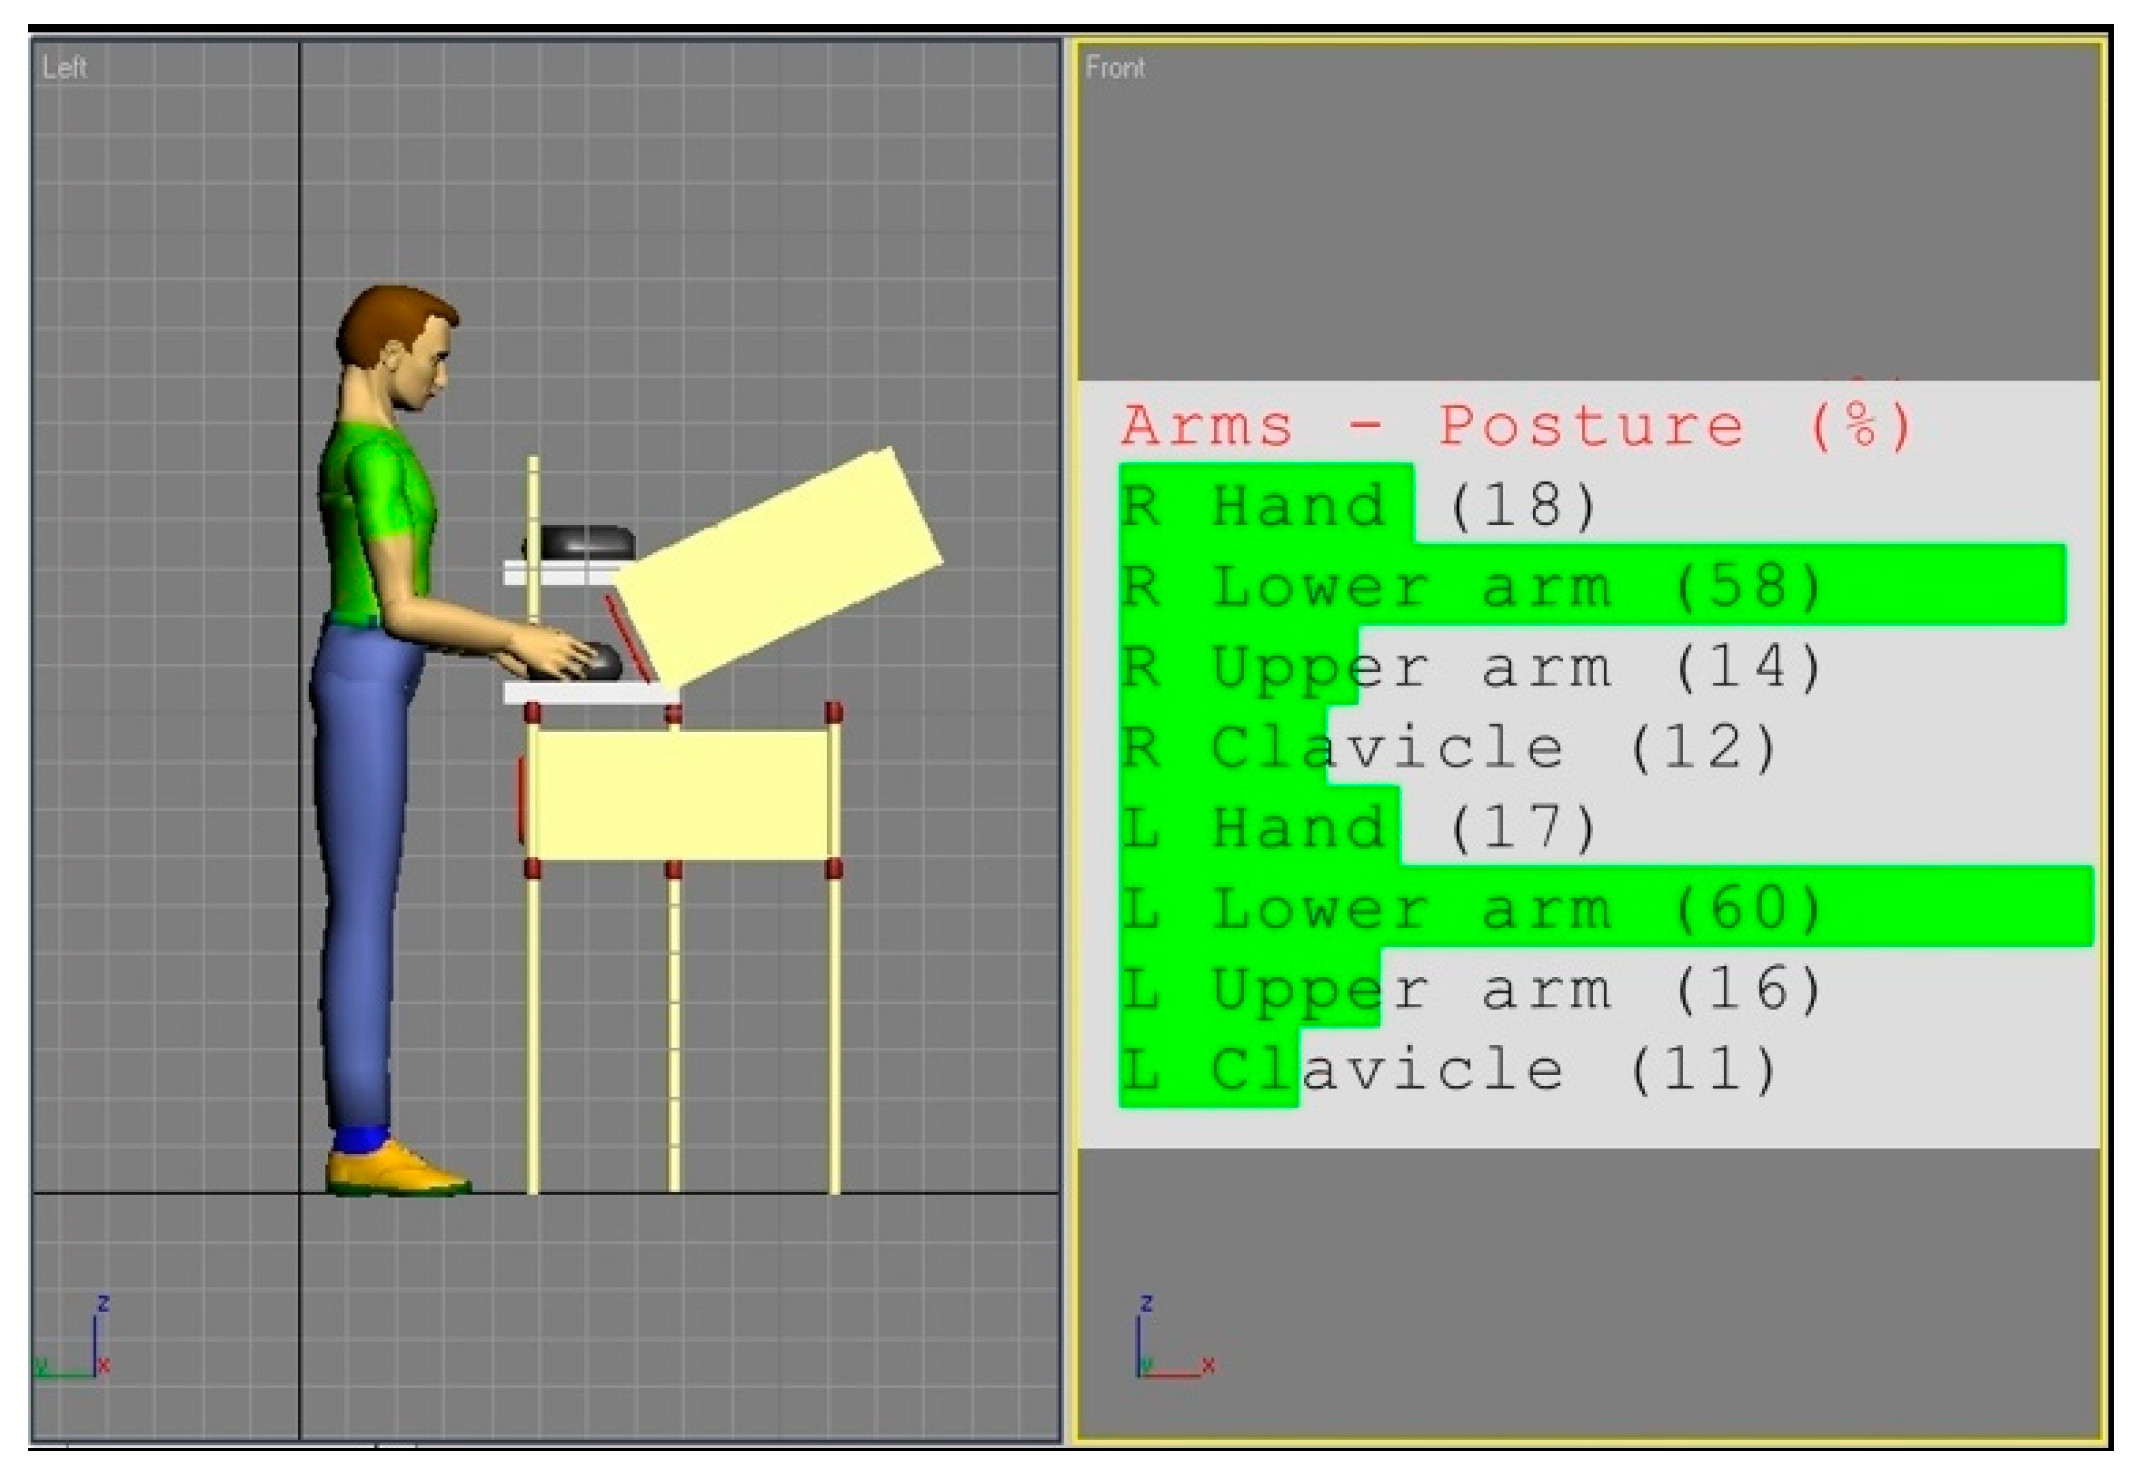
| Body Segment | 5th Percentile | 95th Percentile | ||
|---|---|---|---|---|
| Anthropos Posture (% of Range) | REBA Code | Anthropos Posture (% of Range) | REBA Code | |
| Upper arm | 26 | 3 | 14 | 2 |
| Lower arm | 76 | 1 | 58 | 1 |
| Hand | 42 | 2 | 18 | 1 |
| REBA part B | 4 | 1 | ||
| REBA general (+1 for static work) | 3 | 2 | ||
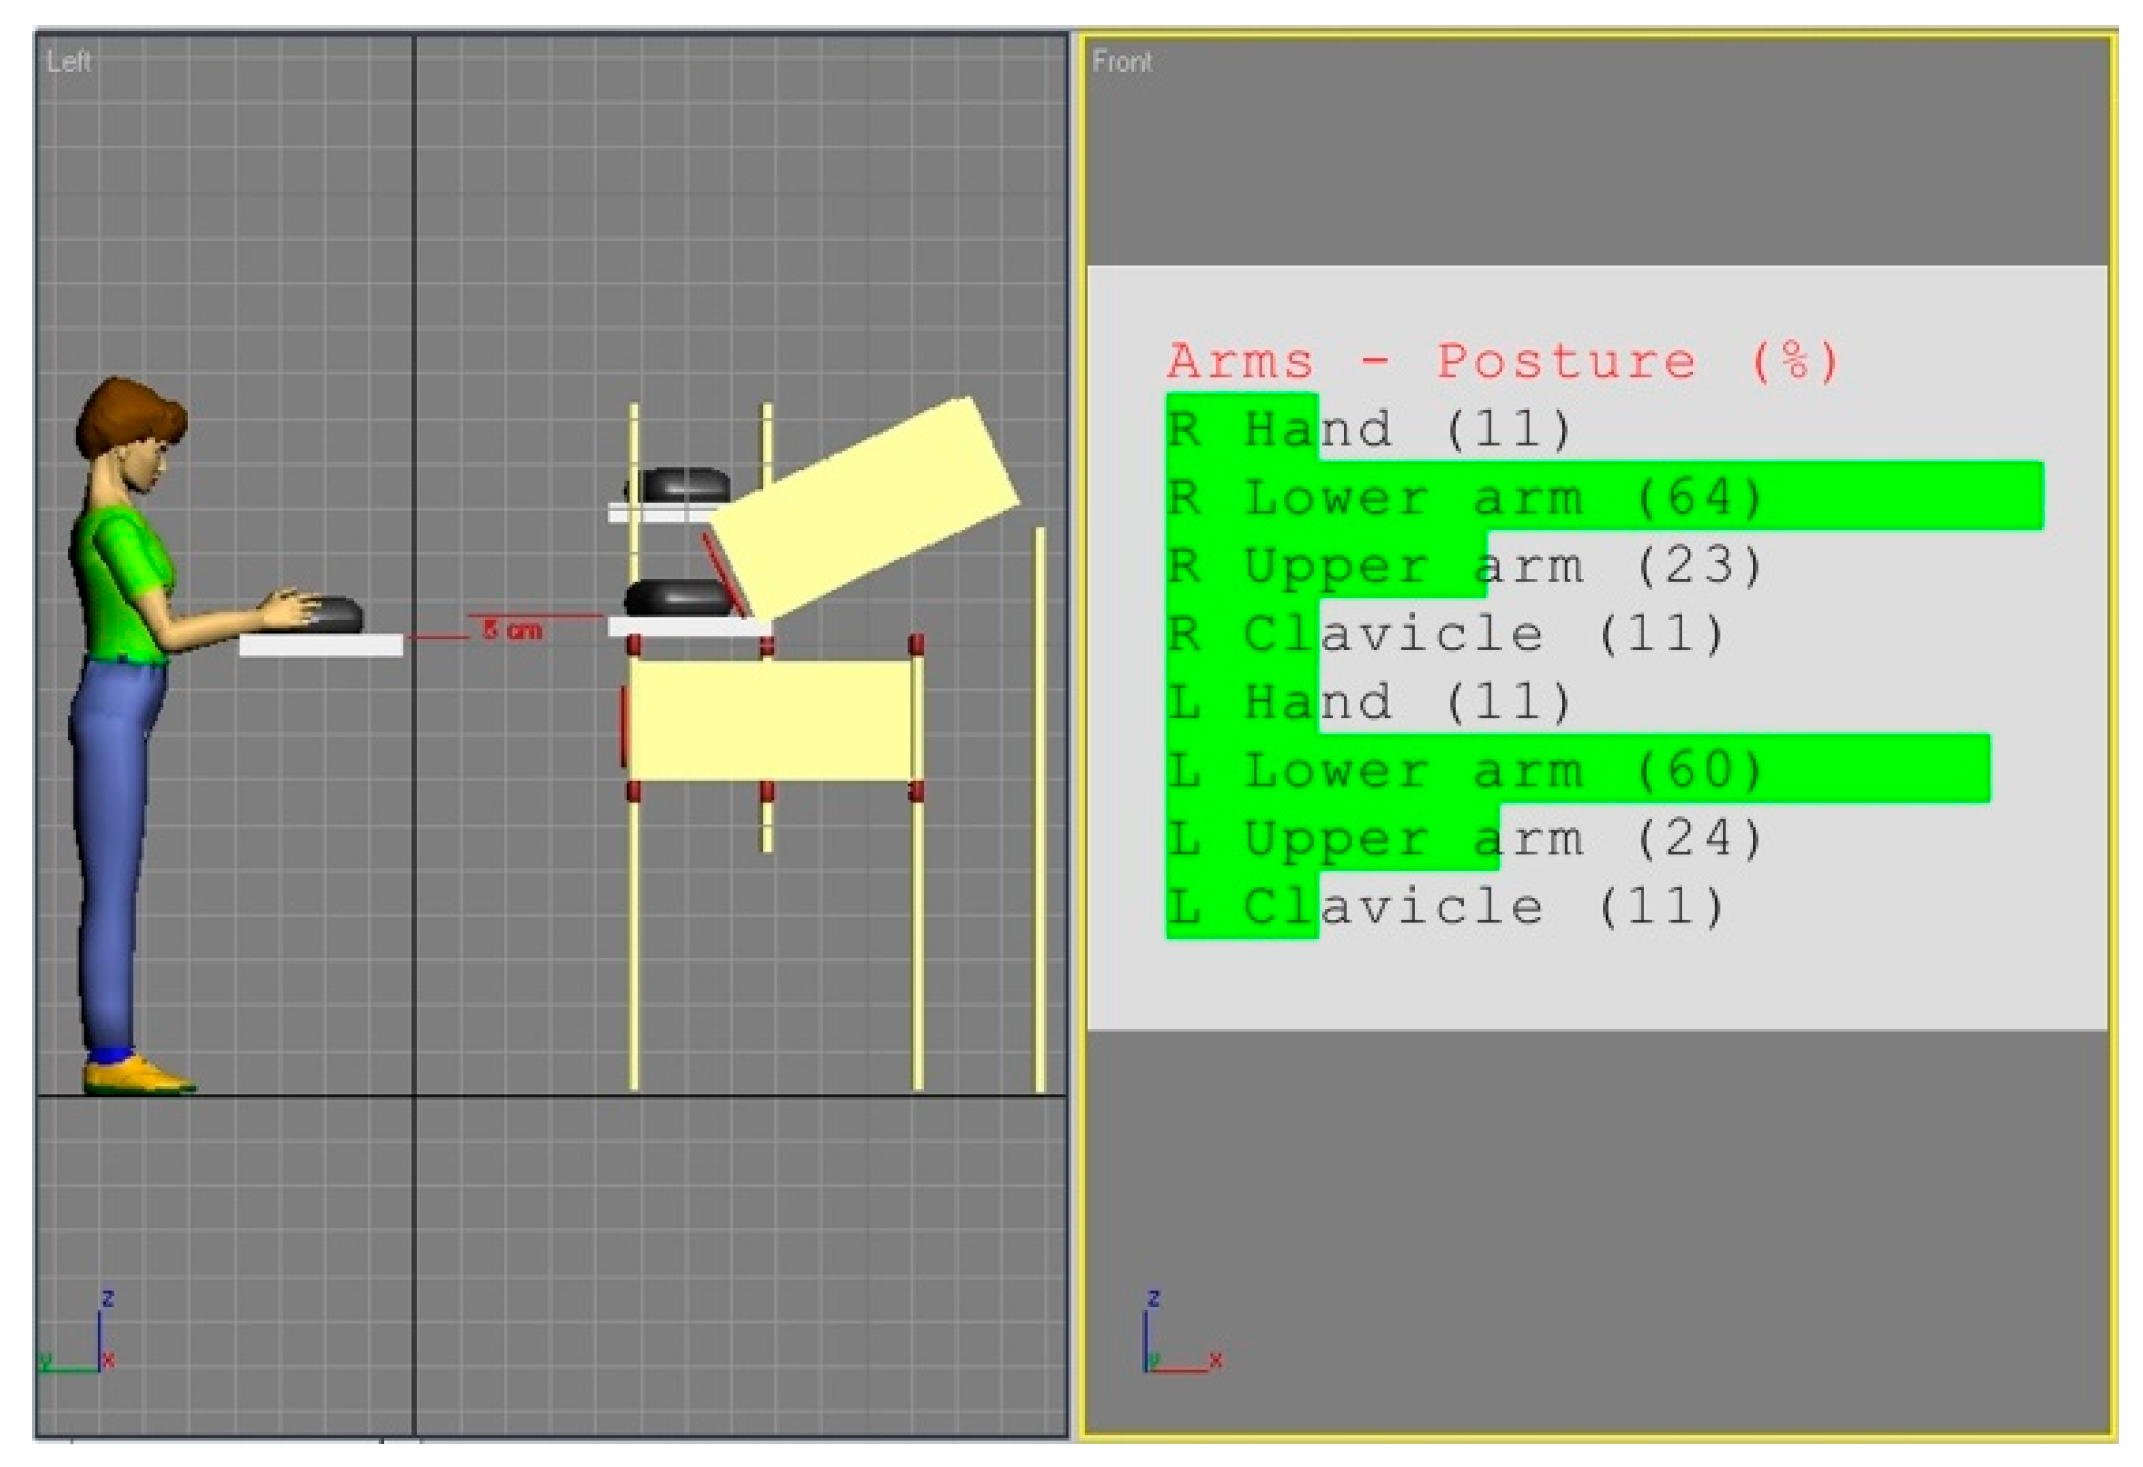
| Body Segment | 5th Percentile | 95th Percentile | ||
|---|---|---|---|---|
| Anthropos Posture (% of Range) | REBA Code | Anthropos Posture (% of Range) | REBA Code | |
| Upper arm | 23 | 2 | 11 | 1 |
| Lower arm | 64 | 1 | 45 | 2 |
| Hand | 11 | 1 | 11 | 1 |
| REBA part B | 1 | 1 | ||
| REBA general (+1 for static work) | 2 | 2 | ||
| Body Segment | 5th Percentile | 95th Percentile | ||
|---|---|---|---|---|
| Anthropos Posture (% of Range) | REBA Code | Anthropos Posture (% of Range) | REBA Code | |
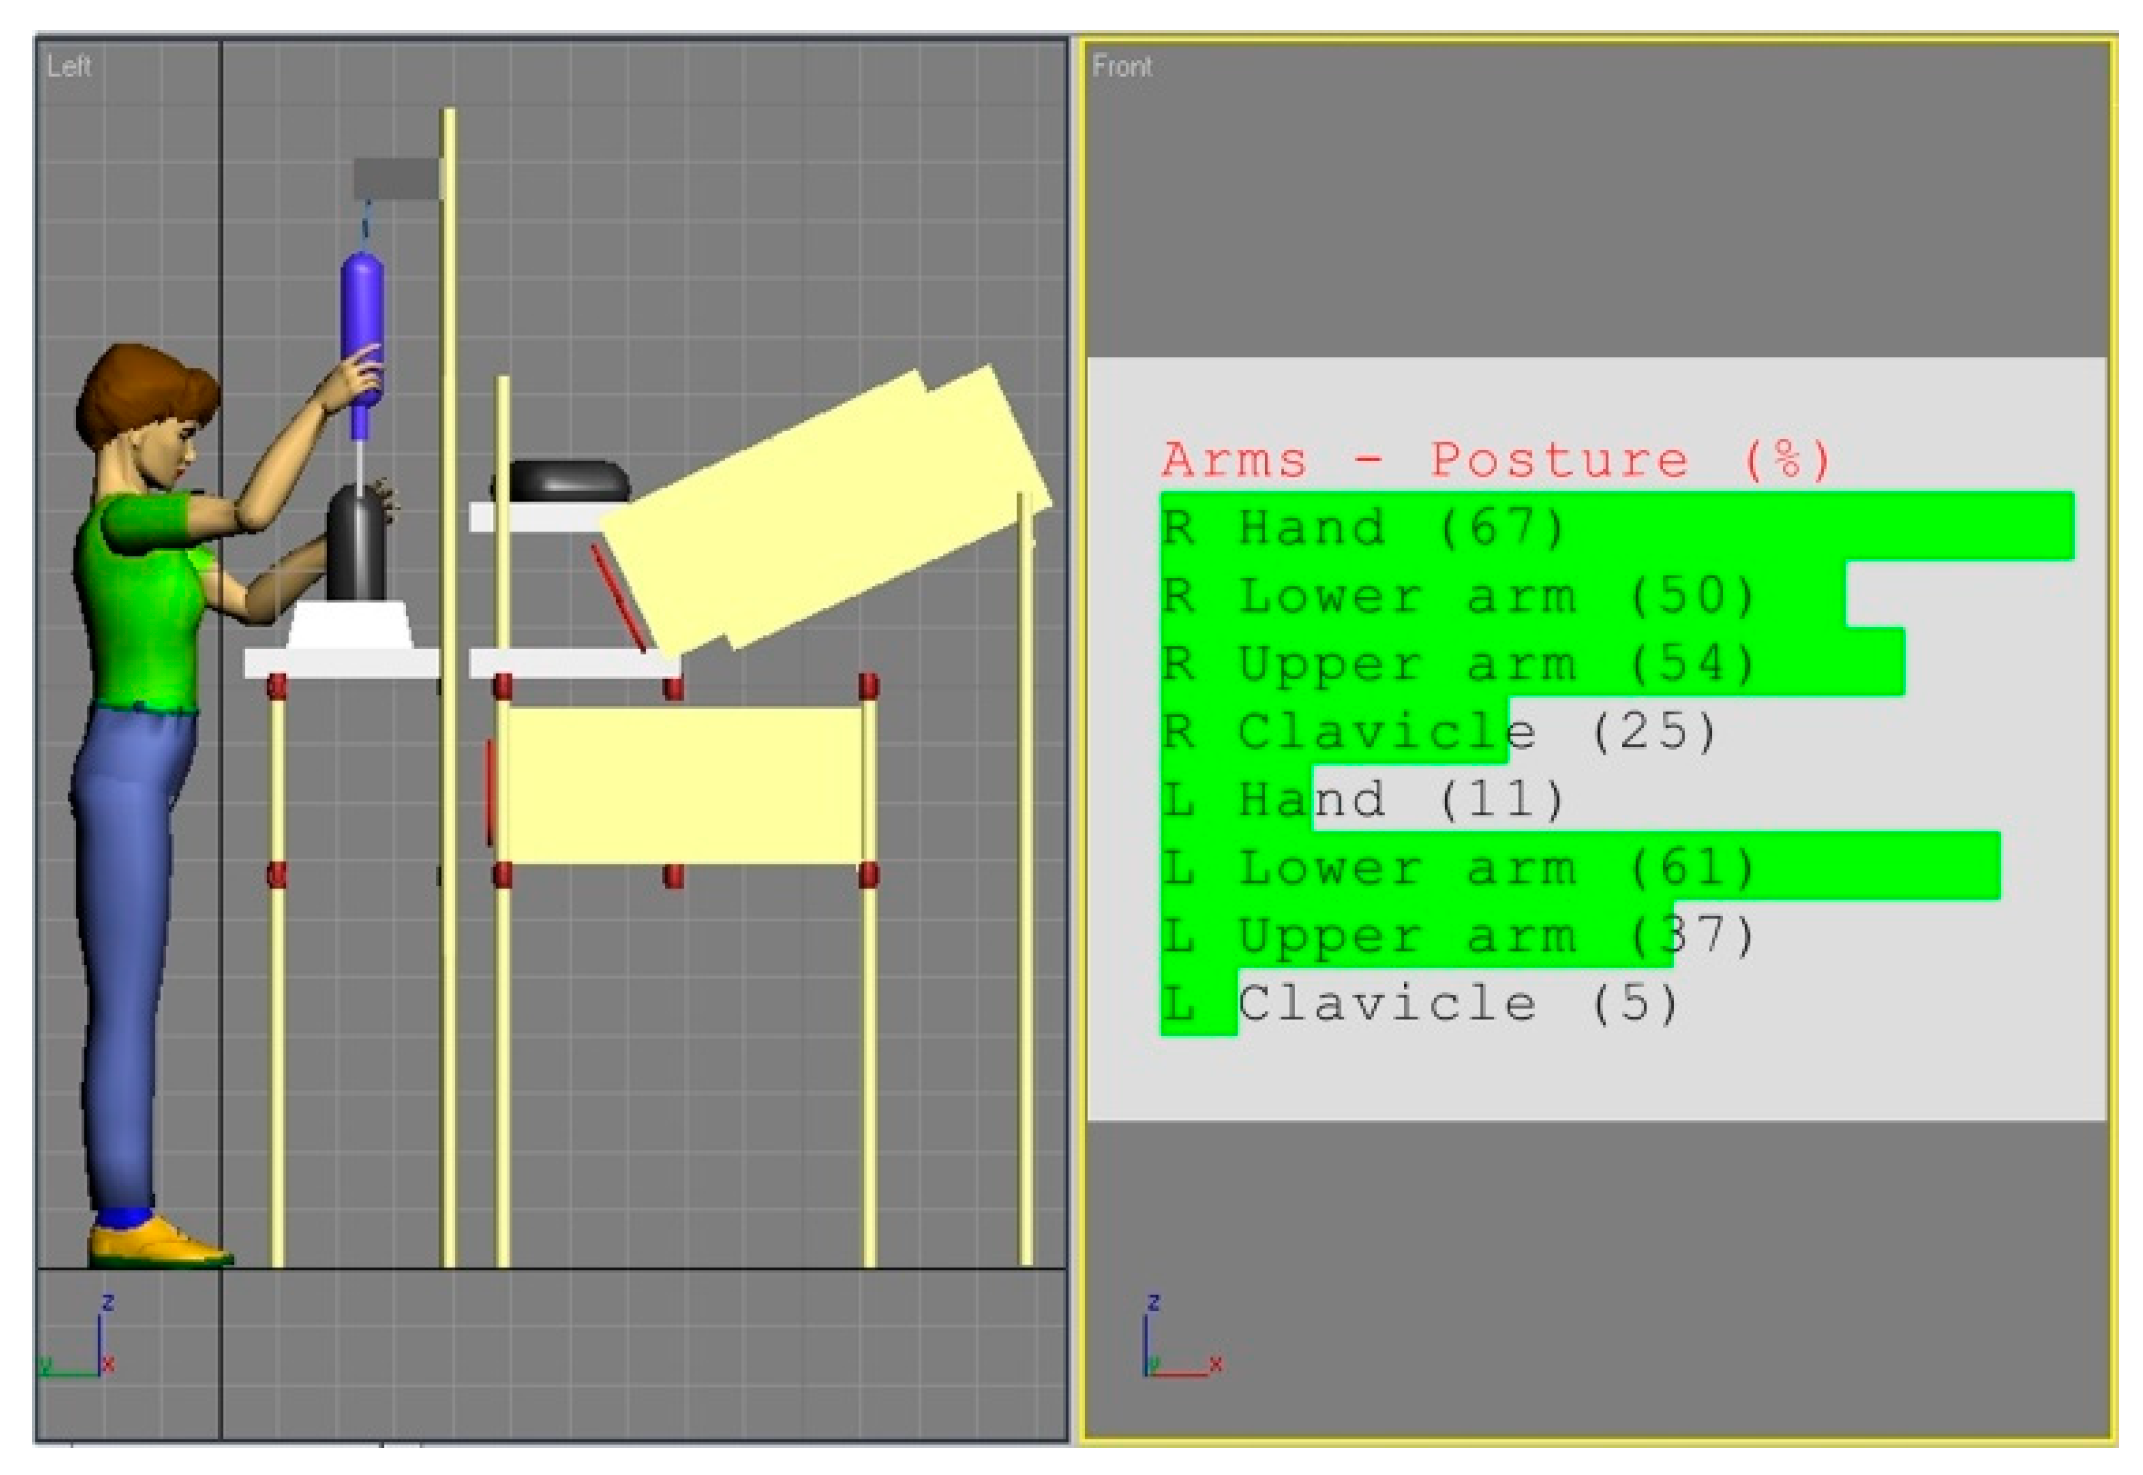
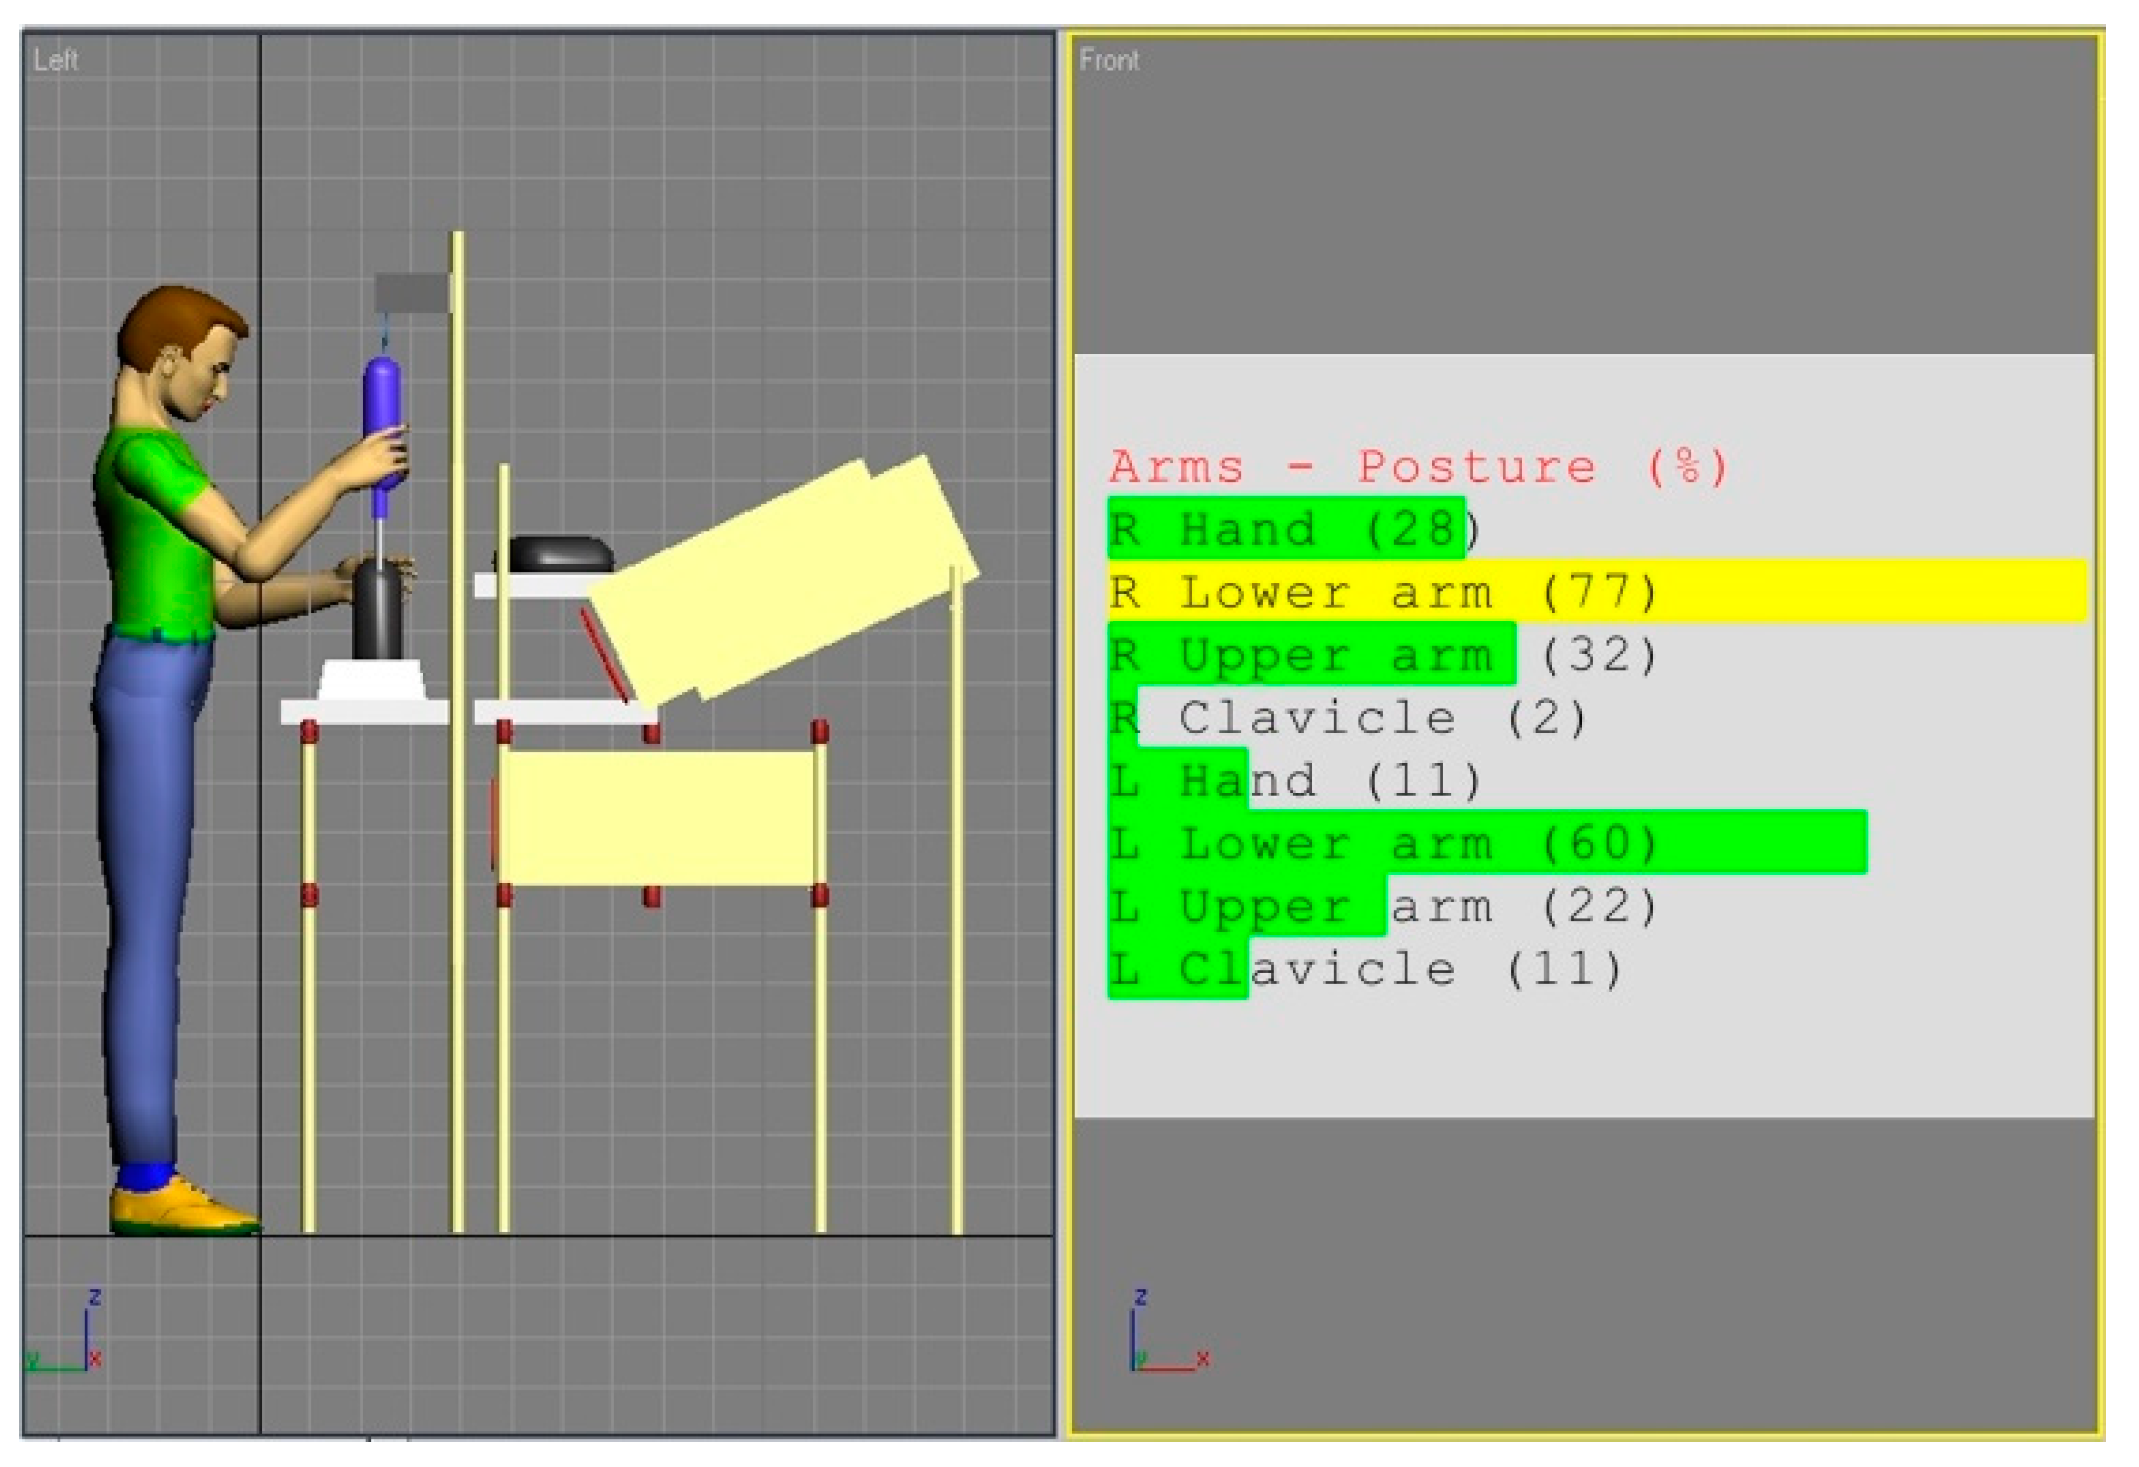
| Upper arm | 54 | 4 (+1) arm raised | 32 | 3 |
| Lower arm | 50 | 1 | 77 | 1 |
| Hand | 67 | 2 | 28 | 2 |
| REBA part B | 7 | 4 | ||
| REBA general (+1 for static work) | 4 | 2 | ||
| Body Segment | 5th Percentile | 95th Percentile | ||
|---|---|---|---|---|
| Anthropos Posture (% of Range) | REBA Code | Anthropos Posture (% of Range) | REBA Code | |
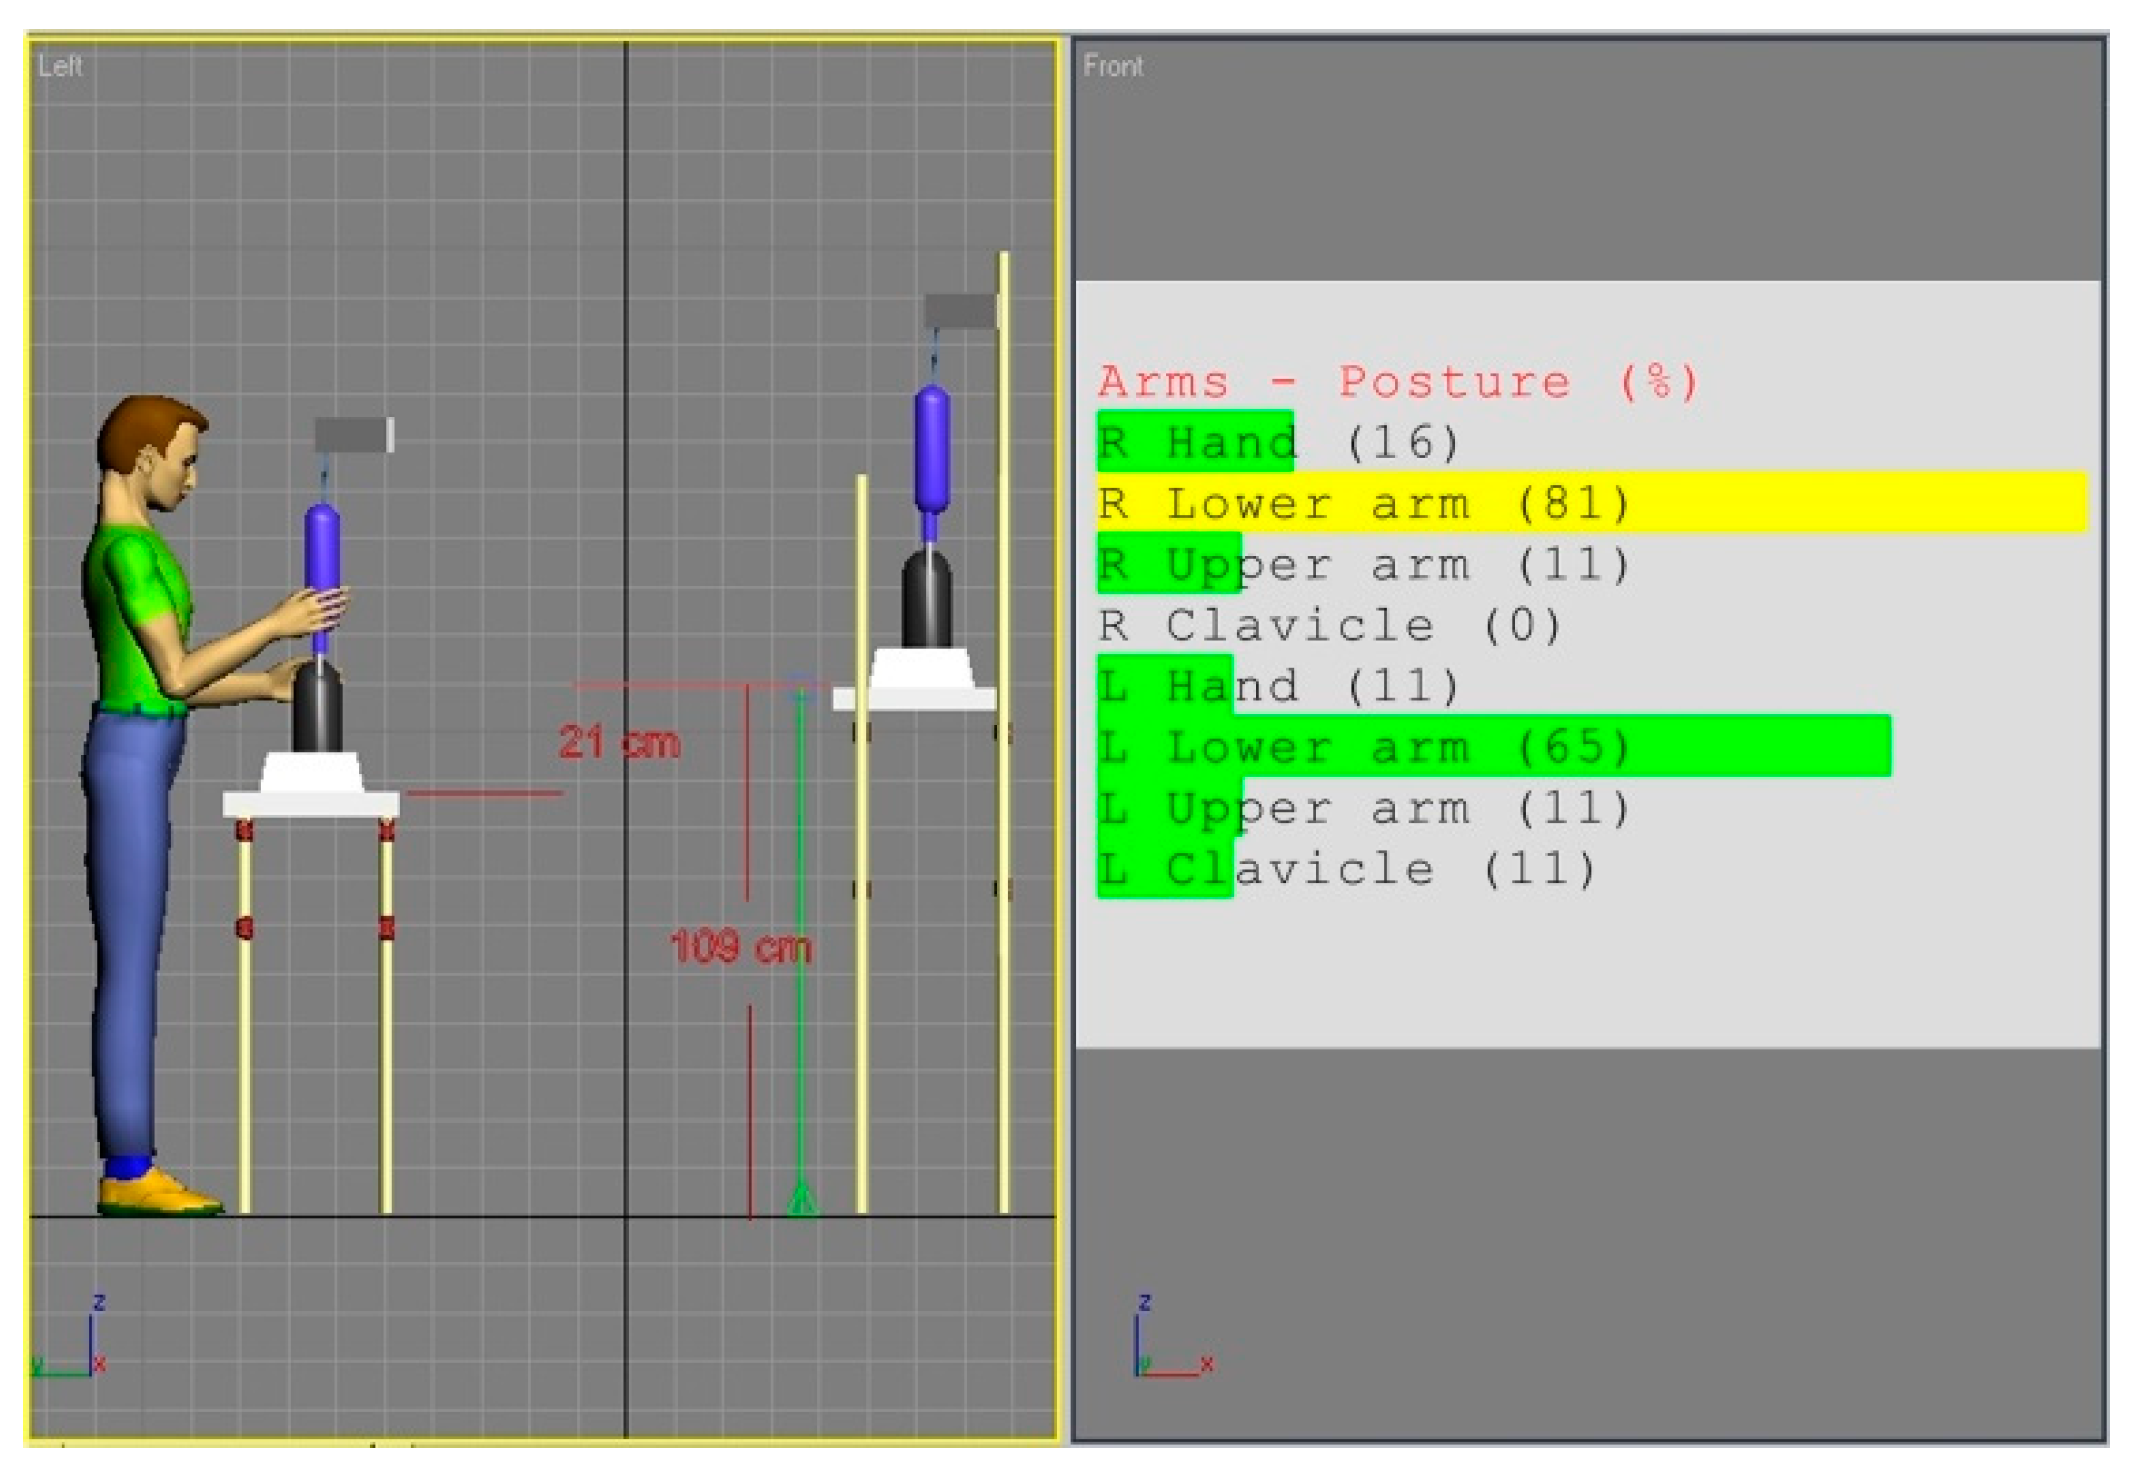
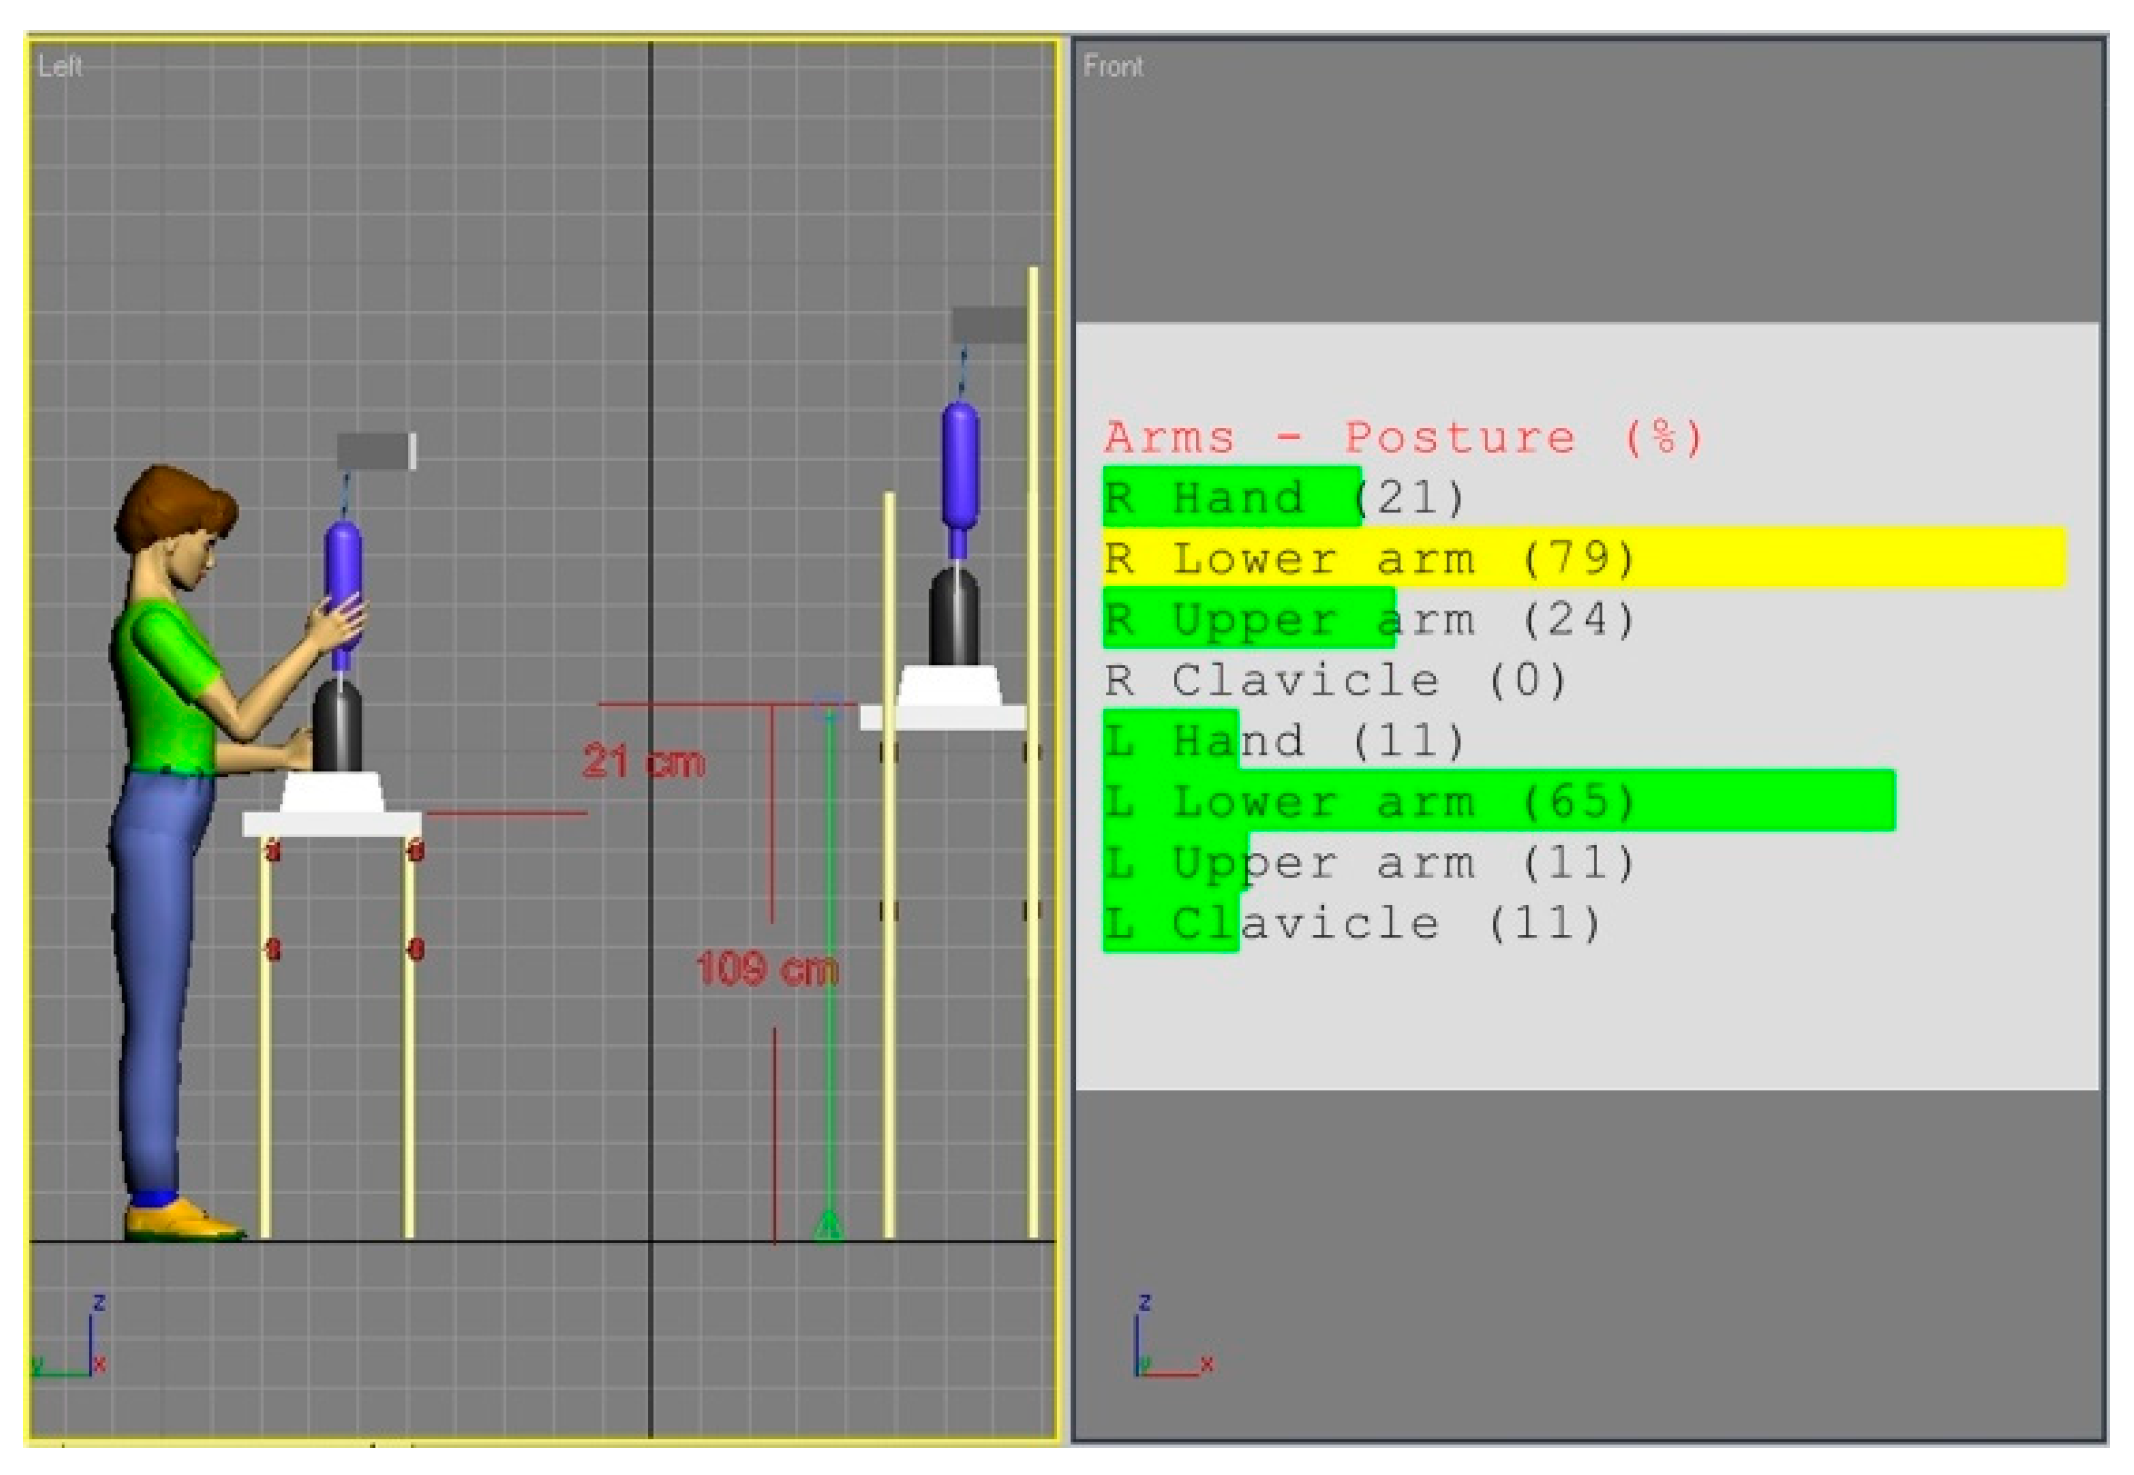
| Upper arm | 24 | 2 | 10 | 1 |
| Lower arm | 79 | 1 | 65 | 1 |
| Hand | 21 | 1 | 11 | 1 |
| REBA part B | 1 | 1 | ||
| REBA GENERAL (+1 for static work) | 2 | 2 | ||
Publisher’s Note: MDPI stays neutral with regard to jurisdictional claims in published maps and institutional affiliations. |
© 2020 by the authors. Licensee MDPI, Basel, Switzerland. This article is an open access article distributed under the terms and conditions of the Creative Commons Attribution (CC BY) license (http://creativecommons.org/licenses/by/4.0/).
Share and Cite
Grobelny, J.; Michalski, R. Preventing Work-Related Musculoskeletal Disorders in Manufacturing by Digital Human Modeling. Int. J. Environ. Res. Public Health 2020, 17, 8676. https://0-doi-org.brum.beds.ac.uk/10.3390/ijerph17228676
Grobelny J, Michalski R. Preventing Work-Related Musculoskeletal Disorders in Manufacturing by Digital Human Modeling. International Journal of Environmental Research and Public Health. 2020; 17(22):8676. https://0-doi-org.brum.beds.ac.uk/10.3390/ijerph17228676
Chicago/Turabian StyleGrobelny, Jerzy, and Rafał Michalski. 2020. "Preventing Work-Related Musculoskeletal Disorders in Manufacturing by Digital Human Modeling" International Journal of Environmental Research and Public Health 17, no. 22: 8676. https://0-doi-org.brum.beds.ac.uk/10.3390/ijerph17228676