Explaining Sex Differences in Motorcyclist Riding Behavior: An Application of Multi-Group Structural Equation Modeling


Abstract
:1. Introduction
1.1. Background
1.2. Literature Review
1.2.1. Theory of Planned Behavior (TPB)
1.2.2. Locus of Control (LC)
1.2.3. Motorcycle Rider Behavior Questionnaire (MRBQ)
1.2.4. Structural Equation Modeling (SEM)
1.3. Objective, Hypothesis, and Contributions of this Research
2. Method
2.1. Participants
2.2. Measures and Instrument
2.3. Data Analysis
2.3.1. Factor Analysis
2.3.2. Multi-Group SEM
3. Results
3.1. Descriptive Statistics
3.2. Factor Analysis Results
3.3. Reliability
3.4. Multi-Group Analysis
3.5. Model Estimate
3.5.1. TPB Model Estimate for Men
3.5.2. TPB Model Estimate for Women
3.5.3. LC Model Estimate for Men
3.5.4. LC Model Estimate for Women
4. Discussion and Conclusions
4.1. Discussion of the TPB
4.2. Discussion of LC
5. Limitations and Future Work
Author Contributions
Funding
Acknowledgments
Conflicts of Interest
References
- Royal Thai Police. Traffic Accident on National Highways in 2020. Available online: https://www.m-society.go.th/ewt_news.php?nid=19593 (accessed on 11 September 2020).
- Tainio, M.K. Burden of disease caused by local transport in Warsaw, Poland. J. Transp. Health 2015, 2, 423–433. [Google Scholar] [CrossRef] [PubMed] [Green Version]
- Olson, P.L.; Dewar, R.E. Human Factors in Traffic Safety; Lawyers & Judges Pub.: Tucson, AZ, USA, 2002. [Google Scholar]
- Shinar, D. Traffic Safety and Human Behavior; Emerald Group Publishing Limited: Bingley, UK, 2007. [Google Scholar]
- Evans, L. Human Behavior and Traffic Safety; Springer: New York, NY, USA, 2012. [Google Scholar]
- Elliott, M.A.; Thomson, J.A. The social cognitive determinants of offending drivers’ speeding behaviour. Accid. Anal. Prev. 2010, 42, 1595–1605. [Google Scholar] [CrossRef] [PubMed]
- Useche, S.A.; Montoro, L.; Alonso, F.; Gil, F.T. Does gender really matter? A structural equation model to explain risky and positive cycling behaviors. Accid. Anal. Prev. 2018, 118, 86–95. [Google Scholar] [CrossRef] [PubMed]
- Martinussen, L.M.; Hakamies-Blomqvist, L.; Møller, M.; Özkan, T.; Lajunen, T. Age, gender, mileage and the DBQ: The validity of the Driver Behavior Questionnaire in different driver groups. Accid. Anal. Prev. 2013, 52, 228–236. [Google Scholar] [CrossRef] [Green Version]
- Reason, J.; Manstead, A.; Stradling, S.; Baxter, J.; Campbell, K. Errors and violations on the roads: A real distinction? Ergonomics 1990, 33, 1315–1332. [Google Scholar] [CrossRef]
- Rosenstock, I.M. Historical Origins of the Health Belief Model. Heal. Educ. Monogr. 1974, 2, 328–335. [Google Scholar] [CrossRef]
- Ajzen, I. The theory of planned behavior. Organ. Behav. Hum. Decis. Process. 1991, 50, 179–211. [Google Scholar] [CrossRef]
- Rotter, J.B. Generalized expectancies for internal versus external control of reinforcement. Psychol. Monogr. Gen. Appl. 1966, 80, 1–28. [Google Scholar] [CrossRef] [Green Version]
- Bamberg, S.; Ajzen, I.; Schmidt, P. Choice of Travel Mode in the Theory of Planned Behavior: The Roles of Past Behavior, Habit, and Reasoned Action. Basic Appl. Soc. Psychol. 2003, 25, 175–187. [Google Scholar] [CrossRef]
- Xiao, Y. Analysis of the influencing factors of the unsafe driving behaviors of online car-hailing drivers in china. PLoS ONE 2020, 15, e0231175. [Google Scholar] [CrossRef]
- Razmara, A.; Aghamolaei, T.; Madani, A.; Hosseini, Z.; Zare, S. Prediction of taxi drivers’ safe-driving behaviors based on the theory of planned behavior: The role of habit. J. Educ. Heal. Promot. 2018, 7, 139. [Google Scholar]
- Bazargan-Hejazi, S.; Teruya, S.; Pan, D.; Lin, J.; Gordon, D.; Krochalk, P.C.; Bazargan, M. The theory of planned behavior (TPB) and texting while driving behavior in college students. Traffic Inj. Prev. 2017, 18, 56–62. [Google Scholar] [CrossRef] [Green Version]
- Li, P.; Shi, J.; Liu, X.; Wang, H. The Theory of Planned Behavior and Competitive Driving in China. Procedia Eng. 2016, 137, 362–371. [Google Scholar] [CrossRef] [Green Version]
- Montag, I.; Comrey, A.L. Internality and externality as correlates of involvement in fatal driving accidents. J. Appl. Psychol. 1987, 72, 339–343. [Google Scholar] [CrossRef] [PubMed]
- Arthur, W.; Doverspike, D. Locus of control and auditory selective attention as predictors of driving accident involvement: A comparative longitudinal investigation. J. Saf. Res. 1992, 23, 73–80. [Google Scholar] [CrossRef]
- Özkan, T.; Lajunen, T. Multidimensional Traffic Locus of Control Scale (T-LOC): Factor structure and relationship to risky driving. Pers. Individ. Differ. 2005, 38, 533–545. [Google Scholar] [CrossRef]
- Warner, H.W.; Özkan, T.; Lajunen, T. Can the traffic locus of control (T-LOC) scale be successfully used to predict Swedish drivers’ speeding behaviour? Accid. Anal. Prev. 2010, 42, 1113–1117. [Google Scholar] [CrossRef]
- Măirean, C.; Havârneanu, G.M.; Popușoi, S.A.; Havârneanu, C.-E. Traffic locus of control scale—Romanian version: Psychometric properties and relations to the driver’s personality, risk perception, and driving behavior. Transp. Res. Part F Traffic Psychol. Behav. 2017, 45, 131–146. [Google Scholar] [CrossRef]
- Champahom, T.; Jomnonkwao, S.; Satiennam, T.; Suesat, N.; Ratanavaraha, V. Modeling of safety helmet use intention among students in urban and rural Thailand based on the theory of planned behavior and Locus of Control. Soc. Sci. J. 2020, 1–22. [Google Scholar] [CrossRef]
- Lajunen, T.; Räsänen, M. Can social psychological models be used to promote bicycle helmet use among teenagers? A comparison of the Health Belief Model, Theory of Planned Behavior and the Locus of Control. J. Saf. Res. 2004, 35, 115–123. [Google Scholar] [CrossRef]
- Totkova, Z. Interconnection Between Driving Style, Traffic Locus of Control, and Impulsivity in Bulgarian Drivers. Behav. Sci. 2020, 10, 58. [Google Scholar] [CrossRef] [PubMed] [Green Version]
- Elliott, M.A.; Baughan, C.J.; Sexton, B.F. Errors and violations in relation to motorcyclists’ crash risk. Accid. Anal. Prev. 2007, 39, 491–499. [Google Scholar] [CrossRef]
- Özkan, T.; Lajunen, T.; Dogruyol, B.; Yıldırım, Z.; Çoymak, A. Motorcycle accidents, rider behaviour, and psychological models. Accid. Anal. Prev. 2012, 49, 124–132. [Google Scholar] [CrossRef] [PubMed]
- Uttra, S.; Jomnonkwao, S.; Watthanaklang, D.; Ratanavaraha, V. Development of Self-Assessment Indicators for Motorcycle Riders in Thailand: Application of the Motorcycle Rider Behavior Questionnaire (MRBQ). Sustainability 2020, 12, 2785. [Google Scholar] [CrossRef] [Green Version]
- Khampirat, B. Structural Equation Modeling; Institute of Social Technology (IST), Suranaree University of Technology: Nakorn Ratchasima, Thailand, 2012. [Google Scholar]
- Ratanavaraha, V.; Jomnonkwao, S.; Watthanaklang, D.; Chonsalasin, D. Factors Affecting Motorcycle Helmet Use: Using Structural Equation Modeling (SEM) for the Theory of the Health Belief Model in Urban and Rural Area; Institute of Engineering, Suranaree University of Technology: Nakhon Ratchasima, Thailand, 2014. [Google Scholar]
- Nguyen, D.V.M.; Ross, V.; Vu, A.T.; Brijs, T.; Wets, G.; Brijs, K. Exploring psychological factors of mobile phone use while riding among motorcyclists in Vietnam. Tran. Res. Part F Traffic Psychol. Behav. 2020, 73, 292–306. [Google Scholar] [CrossRef]
- Golob, T.F. Structural equation modeling for travel behavior research. Trans. Res. Part B Methodol. 2003, 37, 1–25. [Google Scholar] [CrossRef] [Green Version]
- Stevens, J. Applied Multivariate Statistics for the Social Sciences; Lawrence Erlbaum Associates: Mahwah, NJ, USA, 1996. [Google Scholar]
- Dekker, H.; Dijkgraaf, B.; Meijerink, F. Behaviour and attitude. Effect of attitude on behavioural desire with respect to foreign countries and peoples and Germany and Germans in particular. In Culture and Conflict; Aksant Academic: Amsterdam, The Netherlands, 2007; pp. 197–215. [Google Scholar]
- Wilkinson, W.W. The structure of the Levenson locus of control scale in young adults: Comparing item and parcel indicator models. Pers. Individ. Differ. 2007, 43, 1416–1425. [Google Scholar] [CrossRef]
- Transport Scotland. Prolific Illegal Driving Behaviour: A Qualitative Study. Available online: https://www.transport.gov.scot/media/30468/j267570.pdf (accessed on 21 November 2020).
- Gicquel, L.; Ordonneau, P.; Blot, E.; Toillon, C.; Ingrand, P.; Romo, L. Description of Various Factors Contributing to Traffic Accidents in Youth and Measures Proposed to Alleviate Recurrence. Front. Psychiatry 2017, 8. [Google Scholar] [CrossRef] [Green Version]
- Ali, E.; El-Badawy, S.; Shawaly, E.-S. Young Drivers Behavior and Its Influence on Traffic Accidents. J. Traffic Logist. Eng. 2014, 2, 45–51. [Google Scholar] [CrossRef]
- Pino, O.; Pelosi, A.; Baldari, F. Drivers’ behaviour. Risk factors for road accidents and safety implications. A study of 1489 cases in the province of Parma. Psicoterapia Cognitiva e Comportamentale 2013, 19, 141–156. [Google Scholar]
- Kline, R.B. Principles and Practice of Structural Equation Modeling; Guilford Press: New York, NY, USA, 2011. [Google Scholar]
- Nunnally, J.C. Psychometric Theory; McGraw-Hill: New York, NY, USA, 1978. [Google Scholar]
- Hair, J.F.; Black, W.C.; Babin, B.J. Multivariate Data Analysis: A Global Perspective; Prentice Hall: Upper Saddle River, NJ, USA, 2010. [Google Scholar]
- Muthén, L.K.; Muthén, B.O. Mplus User’s Guide: Statistical Analysis with Latent Variables: User’s Guide; Muthén & Muthén: Los Angeles, CA, USA, 2010. [Google Scholar]
- Linda, K.; Muthén, B.O.M. Mplus User’s Guide, 7th ed.; Muthén & Muthén: Los Angeles, CA, USA, 2012. [Google Scholar]
- Hu, L.T.; Bentler, P.M. Cutoff criteria for fit indexes in covariance structure analysis: Conventional criteria versus new alternatives. Struct. Equ. Model. A Multidiscip. J. 1999, 6, 1–55. [Google Scholar] [CrossRef]
- Deb, S.; Ali Ahmed, M. Determining the service quality of the city bus service based on users’ perceptions and expectations. Travel Behav. Soc. 2018, 12, 1–10. [Google Scholar] [CrossRef]
- Lai, W.-T.; Chen, C.-F. Behavioral intentions of public transit passengers—The roles of service quality, perceived value, satisfaction and involvement. Trans. Policy 2011, 18, 318–325. [Google Scholar] [CrossRef]
- Daire Hooper, J.C.; Mullen, M. Structural Equation Modelling: Guidelines for Determining Model Fit. Electron. J. Bus. Res. Methods 2008, 6, 53–61. [Google Scholar]
- Jomnonkwao, S.; Sangphong, O.; Khampirat, B.; Siridhara, S.; Ratanavaraha, V. Public transport promotion policy on campus: Evidence from Suranaree University in Thailand. Public Transp. 2016, 8, 185–203. [Google Scholar] [CrossRef]


| Variables | Men (n = 903) | Women (n = 613) | ||
|---|---|---|---|---|
| Frequency | Percent | Frequency | Percent | |
| Age | Average age = 36.4 years | Average age = 33.2 years | ||
| SD = 9.57 | SD = 9.71 | |||
| Max = 72 years | Max = 70 years | |||
| Min = 20 years | Min = 20 years | |||
| Average income | 23,964 baht/month | 21,721 baht/month | ||
| Education level | ||||
| Other | 1 | 0.11 | - | - |
| Primary school | 67 | 7.42 | 47 | 7.67 |
| Junior high school | 107 | 11.85 | 64 | 10.44 |
| Senior high school | 146 | 16.17 | 80 | 13.05 |
| High vocational certificate | 118 | 13.07 | 50 | 8.16 |
| Bachelor’s degree | 428 | 47.40 | 336 | 54.81 |
| Master’s degree | 22 | 2.44 | 34 | 5.55 |
| Ph.D. | 14 | 1.55 | 2 | 0.33 |
| Occupation | ||||
| Student | 57 | 6.31 | 71 | 11.58 |
| Civil servant/state enterprise employee | 39 | 4.32 | 21 | 3.43 |
| Private companies | 363 | 40.20 | 287 | 46.82 |
| Personal business/trading owner | 169 | 18.72 | 106 | 17.29 |
| Agriculturist | 79 | 8.75 | 19 | 3.10 |
| Contractors | 193 | 21.37 | 92 | 15.01 |
| Housewife | - | - | 17 | 2.77 |
| Other | 3 | 0.33 | - | - |
| Licensed rider | ||||
| Yes | 857 | 94.91 | 528 | 86.13 |
| No | 46 | 5.09 | 85 | 18.87 |
| Code | Latent Variable/Questionnaire | Men (n = 903) | Women (n = 613) | ||||||
|---|---|---|---|---|---|---|---|---|---|
| Mean | SD | Sk | Ku | Mean | SD | Sk | Ku | ||
| Motorcycle Rider Behavior Questionnaire (MRBQ) | |||||||||
| TE | Traffic Error | 1.88 | 0.56 | −0.194 | −1.250 | 1.82 | 0.54 | −0.121 | −1.303 |
| CE | Control Error | 2.33 | 0.51 | −0.805 | 0.881 | 2.21 | 0.54 | −0.740 | 0.394 |
| ST | Stunt frequency | 1.38 | 0.58 | 1.490 | 1.217 | 1.25 | 0.48 | 2.081 | 3.575 |
| SE | Safety Equipment | 1.82 | 0.88 | 1.158 | 1.172 | 1.71 | 0.79 | 1.241 | 1.294 |
| Theory of planned behavior (TPB) (X1–X19) and locus of control (LC) (X12–X20) | |||||||||
| X1 | Road accidents caused by vehicle riding are the most dangerous ones. | 6.60 | 0.63 | −1.581 | 2.268 | 6.62 | 0.60 | −1.588 | 2.512 |
| X2 | Health and the physical body are the most important factors when riding vehicles. | 6.43 | 0.75 | −1.027 | 0.046 | 6.46 | 0.71 | −1.033 | 0.112 |
| X3 | Proper rest is the most important thing for vehicle riding. | 6.22 | 0.74 | −0.597 | −0.277 | 6.33 | 0.71 | −0.937 | 1.182 |
| X4 | You pay attention to safety when riding a vehicle. | 6.29 | 0.74 | −0.677 | −0.353 | 6.41 | 0.74 | −1.033 | 0.374 |
| X5 | If you get into an accident, your health and body will not be the same. | 6.27 | 0.83 | −0.952 | 0.288 | 6.29 | 0.91 | −1.168 | 0.618 |
| X6 | If you do not wear a helmet, you may die if you get into an accident. | 4.68 | 1.17 | 0.303 | 0.193 | 4.98 | 1.31 | 0.007 | −0.465 |
| X7 | If an accident is caused by riding, it may cause death or disability, which require long-term treatment. | 5.33 | 0.93 | 0.206 | −0.347 | 5.55 | 0.98 | 0.090 | −0.908 |
| X8 | Vehicle accidents would highly affect your study/work. | 5.34 | 0.87 | 0.196 | −0.140 | 5.53 | 0.95 | 0.136 | −0.826 |
| X9 | Accidents would affect your life and network, e.g., immediate family, friends, relatives, etc. | 5.37 | 0.90 | 0.269 | −0.618 | 5.61 | 0.97 | −0.013 | −0.940 |
| X10 | Each accident causes death, mental illness, and loss of time and money. | 5.50 | 0.95 | −0.018 | −0.700 | 5.69 | 0.98 | –0.239 | −0.743 |
| X11 | If you violate traffic laws, you may get fined or penalized. | 5.56 | 0.97 | −0.014 | −0.463 | 5.73 | 1.06 | –0.898 | 1.898 |
| X12 | Your family and friends drive carefully and follow traffic laws, so you do as well. | 5.62 | 1.01 | −0.352 | −0.319 | 5.70 | 1.10 | –0.689 | −0.028 |
| X13 | You stay abreast of accident news, so you are afraid of accidents happening to yourself or your friends/family. | 5.92 | 0.97 | –0.565 | −0.343 | 5.89 | 1.02 | −0.548 | −0.577 |
| X14 | You often see campaigns/public relations on safe riding. | 5.92 | 0.99 | −0.943 | 0.920 | 5.89 | 1.11 | −0.925 | 0.401 |
| X15 | Your organization/company pays attention to safe riding/has a safe riding campaign. | 5.59 | 1.18 | −1.235 | 1.982 | 5.58 | 1.25 | −1.091 | 1.287 |
| X16 | You make your own decisions to follow traffic laws independent of others. | 6.25 | 0.84 | −0.780 | −0.419 | 6.22 | 0.80 | −0.594 | −0.690 |
| X17 | Helmet wearing is your own choice. | 6.47 | 0.68 | −0.993 | 0.103 | 6.46 | 0.66 | −1.237 | 2.357 |
| X18 | Accidents are mostly caused by road conditions and the environment, not humans. | 6.15 | 0.83 | −0.666 | 0.018 | 6.24 | 0.78 | −0.669 | −0.333 |
| X19 | You can reduce the risk of accidents by riding safely. | 6.15 | 0.81 | −0.514 | −0.562 | 6.26 | 0.73 | −0.606 | −0.373 |
| X20 | You find that polices are strict with regards to traffic discipline, so you pay attention to safe riding. | 5.58 | 1.15 | −0.323 | −0.268 | 5.62 | 1.19 | −0.435 | −0.598 |
| Variable/Measurement Model/Cronbach’s α | EFA | CFA | ||||||
|---|---|---|---|---|---|---|---|---|
| Communalities | Loading | Loading | Est./S.E. | p-Value | Error Variance | CR | AVE | |
| Motorcycle Rider Behavior Questionnaire (MRBQ) | ||||||||
| Traffic Error (TE) | - | - | 0.843 | 43.557 | <0.001 | 0.289 | 0.688 | 0.588 |
| Control Error (CE) | - | - | 0.624 | 26.840 | <0.001 | 0.611 | ||
| Stunt (ST) | - | - | 0.460 | 16.302 | <0.001 | 0.788 | ||
| Safety Equipment (SE) | - | - | 0.423 | 14.084 | <0.001 | 0.821 | ||
| Attitudes based on Health Motivation (AHM) (Cronbach’s α = 0.806) | ||||||||
| X1 | 0.624 | 0.760 | 0.618 | 26.294 | <0.001 | 0.618 | 0.812 | 0.676 |
| X2 | 0.643 | 0.710 | 0.510 | 19.839 | <0.001 | 0.740 | ||
| X3 | 0.558 | 0.664 | 0.692 | 34.446 | <0.001 | 0.521 | ||
| X4 | 0.741 | 0.828 | 0.873 | 62.415 | <0.001 | 0.237 | ||
| X5 | 0.615 | 0.701 | 0.687 | 34.524 | <0.001 | 0.528 | ||
| Attitudes based on Severity (ASE) (Cronbach’s α = 0.927) | ||||||||
| X6 | 0.744 | 0.804 | 0.838 | 79.116 | <0.001 | 0.298 | 0.930 | 0.827 |
| X7 | 0.722 | 0.841 | 0.793 | 59.012 | <0.001 | 0.371 | ||
| X8 | 0.759 | 0.830 | 0.902 | 86.089 | <0.001 | 0.186 | ||
| X9 | 0.779 | 0.850 | 0.906 | 98.840 | <0.001 | 0.178 | ||
| X10 | 0.843 | 0.900 | 0.874 | 89.500 | <0.001 | 0.237 | ||
| X11 | 0.672 | 0.802 | 0.649 | 32.806 | <0.001 | 0.578 | ||
| Subjective Norm (SN) (Cronbach’s α = 0.856) | ||||||||
| X12 | 0.643 | 0.791 | 0.640 | 36.335 | <0.001 | 0.590 | 0.883 | 0.803 |
| X13 | 0.702 | 0.769 | 0.981 | 111.048 | <0.001 | 0.039 | ||
| X14 | 0.751 | 0.829 | 0.797 | 95.630 | <0.001 | 0.365 | ||
| X15 | 0.685 | 0.816 | 0.793 | 59.077 | <0.001 | 0.371 | ||
| Perceived Behavior Control (PC) (Cronbach’s α = 0.864) | ||||||||
| X16 | 0.756 | 0.856 | 0.674 | 34.408 | <0.001 | 0.545 | 0.862 | 0.775 |
| X17 | 0.614 | 0.769 | 0.624 | 25.119 | <0.001 | 0.611 | ||
| X18 | 0.755 | 0.854 | 0.862 | 71.956 | <0.001 | 0.257 | ||
| X19 | 0.744 | 0.827 | 0.938 | 90.679 | <0.001 | 0.120 | ||
| Motorcycle Rider Behavior Questionnaire (MRBQ) | ||||||||
| TE | - | - | 0.884 | 27.720 | <0.001 | 0.219 | 0.697 | 0.595 |
| CE | - | - | 0.588 | 20.720 | <0.001 | 0.654 | ||
| ST | - | - | 0.449 | 14.149 | <0.001 | 0.798 | ||
| SE | - | - | 0.458 | 11.864 | <0.001 | 0.790 | ||
| Externality (EX) (Cronbach’s α = 0.889) | ||||||||
| X12 | 0.560 | 0.746 | 0.621 | 31.755 | <0.001 | 0.614 | 0.913 | 0.818 |
| X13 | 0.716 | 0.840 | 0.962 | 69.801 | <0.001 | 0.074 | ||
| X14 | 0.774 | 0.880 | 0.797 | 61.343 | <0.001 | 0.364 | ||
| X15 | 0.712 | 0.843 | 0.871 | 71.119 | <0.001 | 0.241 | ||
| X20 | 0.741 | 0.851 | 0.841 | 64.396 | <0.001 | 0.293 | ||
| Internality (IN) (Cronbach’s α = 0.864) | ||||||||
| X16 | 0.744 | 0.853 | 0.671 | 33.708 | <0.001 | 0.550 | 0.859 | 0.769 |
| X17 | 0.603 | 0.768 | 0.598 | 23.304 | <0.001 | 0.643 | ||
| X18 | 0.764 | 0.874 | 0.866 | 67.972 | <0.001 | 0.250 | ||
| X19 | 0.751 | 0.866 | 0.942 | 81.001 | <0.001 | 0.112 |
| Variable/Measurement Model/Cronbach’s α | EFA | CFA | ||||||
|---|---|---|---|---|---|---|---|---|
| Communalities | Loading | Loading | Est./S.E. | p-Value | Error Variance | CR | AVE | |
| Motorcycle Rider Behavior Questionnaire (MRBQ) | ||||||||
| TE | - | - | 0.817 | 37.225 | <0.001 | 0.332 | 0.699 | 0.529 |
| CE | - | - | 0.787 | 32.988 | <0.001 | 0.380 | ||
| ST | - | - | 0.405 | 11.557 | <0.001 | 0.836 | ||
| SE | - | - | 0.360 | 10.865 | <0.001 | 0.870 | ||
| Attitudes based on Health Motivation (AHM) (Cronbach’s α = 0.805) | ||||||||
| X1 | 0.605 | 0.741 | 0.683 | 25.21 | <0.001 | 0.533 | 0.814 | 0.678 |
| X2 | 0.615 | 0.736 | 0.489 | 14.726 | <0.001 | 0.761 | ||
| X3 | 0.673 | 0.746 | 0.726 | 33.042 | <0.001 | 0.473 | ||
| X4 | 0.731 | 0.824 | 0.839 | 47.331 | <0.001 | 0.296 | ||
| X5 | 0.549 | 0.602 | 0.654 | 24.739 | <0.001 | 0.573 | ||
| Attitudes based on Severity (ASE) (Cronbach’s α = 0.932) | ||||||||
| X6 | 0.780 | 0.796 | 0.865 | 79.142 | <0.001 | 0.251 | 0.940 | 0.847 |
| X7 | 0.702 | 0.807 | 0.797 | 52.144 | <0.001 | 0.365 | ||
| X8 | 0.794 | 0.813 | 0.916 | 87.650 | <0.001 | 0.161 | ||
| X9 | 0.832 | 0.881 | 0.932 | 113.294 | <0.001 | 0.131 | ||
| X10 | 0.866 | 0.900 | 0.903 | 102.439 | <0.001 | 0.184 | ||
| X11 | 0.652 | 0.794 | 0.666 | 31.065 | <0.001 | 0.556 | ||
| Subjective Norm (SN) (Cronbach’s α = 0.900) | ||||||||
| X12 | 0.744 | 0.836 | 0.693 | 34.595 | <0.001 | 0.520 | 0.917 | 0.852 |
| X13 | 0.738 | 0.814 | 0.979 | 91.171 | <0.001 | 0.042 | ||
| X14 | 0.807 | 0.872 | 0.832 | 63.628 | <0.001 | 0.308 | ||
| X15 | 0.770 | 0.847 | 0.904 | 59.781 | <0.001 | 0.183 | ||
| Perceived Behavior Control (PC) (Cronbach’s α = 0.842) | ||||||||
| X16 | 0.733 | 0.834 | 0.671 | 26.24 | <0.001 | 0.549 | 0.847 | 0.756 |
| X17 | 0.551 | 0.738 | 0.596 | 17.964 | <0.001 | 0.645 | ||
| X18 | 0.767 | 0.865 | 0.857 | 50.731 | <0.001 | 0.266 | ||
| X19 | 0.711 | 0.801 | 0.900 | 61.327 | <0.001 | 0.190 | ||
| Motorcycle Rider Behavior Questionnaire (MRBQ) | ||||||||
| TE | - | - | 0.945 | 25.861 | <0.001 | 0.107 | 0.671 | 0.562 |
| CE | - | - | 0.651 | 20.518 | <0.001 | 0.576 | ||
| ST | - | - | 0.300 | 7.895 | <0.001 | 0.91 | ||
| SE | - | - | 0.350 | 7.506 | <0.001 | 0.878 | ||
| Externality (EX) (Cronbach’s α = 0.921) | ||||||||
| X12 | 0.708 | 0.841 | 0.739 | 41.011 | <0.001 | 0.453 | 0.936 | 0.860 |
| X13 | 0.747 | 0.861 | 0.948 | 80.874 | <0.001 | 0.101 | ||
| X14 | 0.813 | 0.901 | 0.857 | 76.796 | <0.001 | 0.266 | ||
| X15 | 0.782 | 0.881 | 0.911 | 87.171 | <0.001 | 0.169 | ||
| X20 | 0.780 | 0.875 | 0.845 | 61.173 | <0.001 | 0.285 | ||
| Internality (IN) (Cronbach’s α= 0.842) | ||||||||
| X16 | 0.724 | 0.836 | 0.672 | 27.481 | <0.001 | 0.548 | 0.843 | 0.751 |
| X17 | 0.542 | 0.734 | 0.579 | 17.398 | <0.001 | 0.665 | ||
| X18 | 0.769 | 0.875 | 0.857 | 49.589 | <0.001 | 0.265 | ||
| X19 | 0.710 | 0.842 | 0.896 | 53.640 | <0.001 | 0.197 |
| Code (Men) | TE | CE | ST | SE | AHM | ASE | SN | PC | EX | IN |
| TE | 1.00 | |||||||||
| CE | 0.508 ** | 1.00 | ||||||||
| ST | 0.401 ** | 0.396 ** | 1.00 | |||||||
| SE | 0.336 ** | 0.259 ** | 0.505 ** | 1.00 | ||||||
| AHM | −0.341 ** | −0.351 ** | −0.295 ** | −0.334 ** | 1.00 | |||||
| ASE | −0.323 ** | −0.340 ** | −0.132 ** | −0.017 | 0.224 ** | 1.00 | ||||
| SN | 0.061 | −0.191 ** | 0.051 | −0.049 | 0.224 ** | 0.388 ** | 1.00 | |||
| PC | −0.479 ** | −0.356 ** | −0.208 ** | −0.287 ** | 0.312 ** | 0.196 ** | 0.104 ** | 1.00 | ||
| EX | 0.055 | −0.205 ** | 0.032 | −0.066* | 0.245 ** | 0.414 ** | 0.986 ** | 0.128 ** | 1.00 | |
| IN | −0.479 ** | −0.356 ** | −0.208 ** | −0.287 ** | 0.312 ** | 0.196 ** | 0.104 ** | 1.000 ** | 0.128 ** | 1.00 |
| Code (Women) | TE | CE | ST | SE | AHM | ASE | SN | PC | EX | IN |
| TE | 1.00 | |||||||||
| CE | 0.592 ** | 1.00 | ||||||||
| ST | 0.291 ** | 0.318 ** | 1.00 | |||||||
| SE | 0.224 ** | 0.239 ** | 0.403 ** | 1.00 | ||||||
| AHM | −0.387 ** | −0.350 ** | −0.292 ** | −0.385 ** | 1.00 | |||||
| ASE | −0.384 ** | −0.477 ** | −0.269 ** | −0.099* | 0.366 ** | 1.00 | ||||
| SN | 0.009 | −0.287 ** | −0.009 | −0.122 ** | 0.240 ** | 0.467 ** | 1.00 | |||
| PC | −0.550 ** | −0.371 ** | −0.161 ** | −0.172 ** | 0.295 ** | 0.182 ** | 0.046 | 1.00 | ||
| EX | 0.000 | −0.303 ** | −0.025 | −0.116 ** | 0.258 ** | 0.505 ** | 0.990 ** | 0.072 | 1.00 | |
| IN | −0.550 ** | −0.371 ** | −0.161 ** | −0.172 ** | 0.295 ** | 0.182 ** | 0.046 | 1.000 ** | 0.072 | 1.00 |
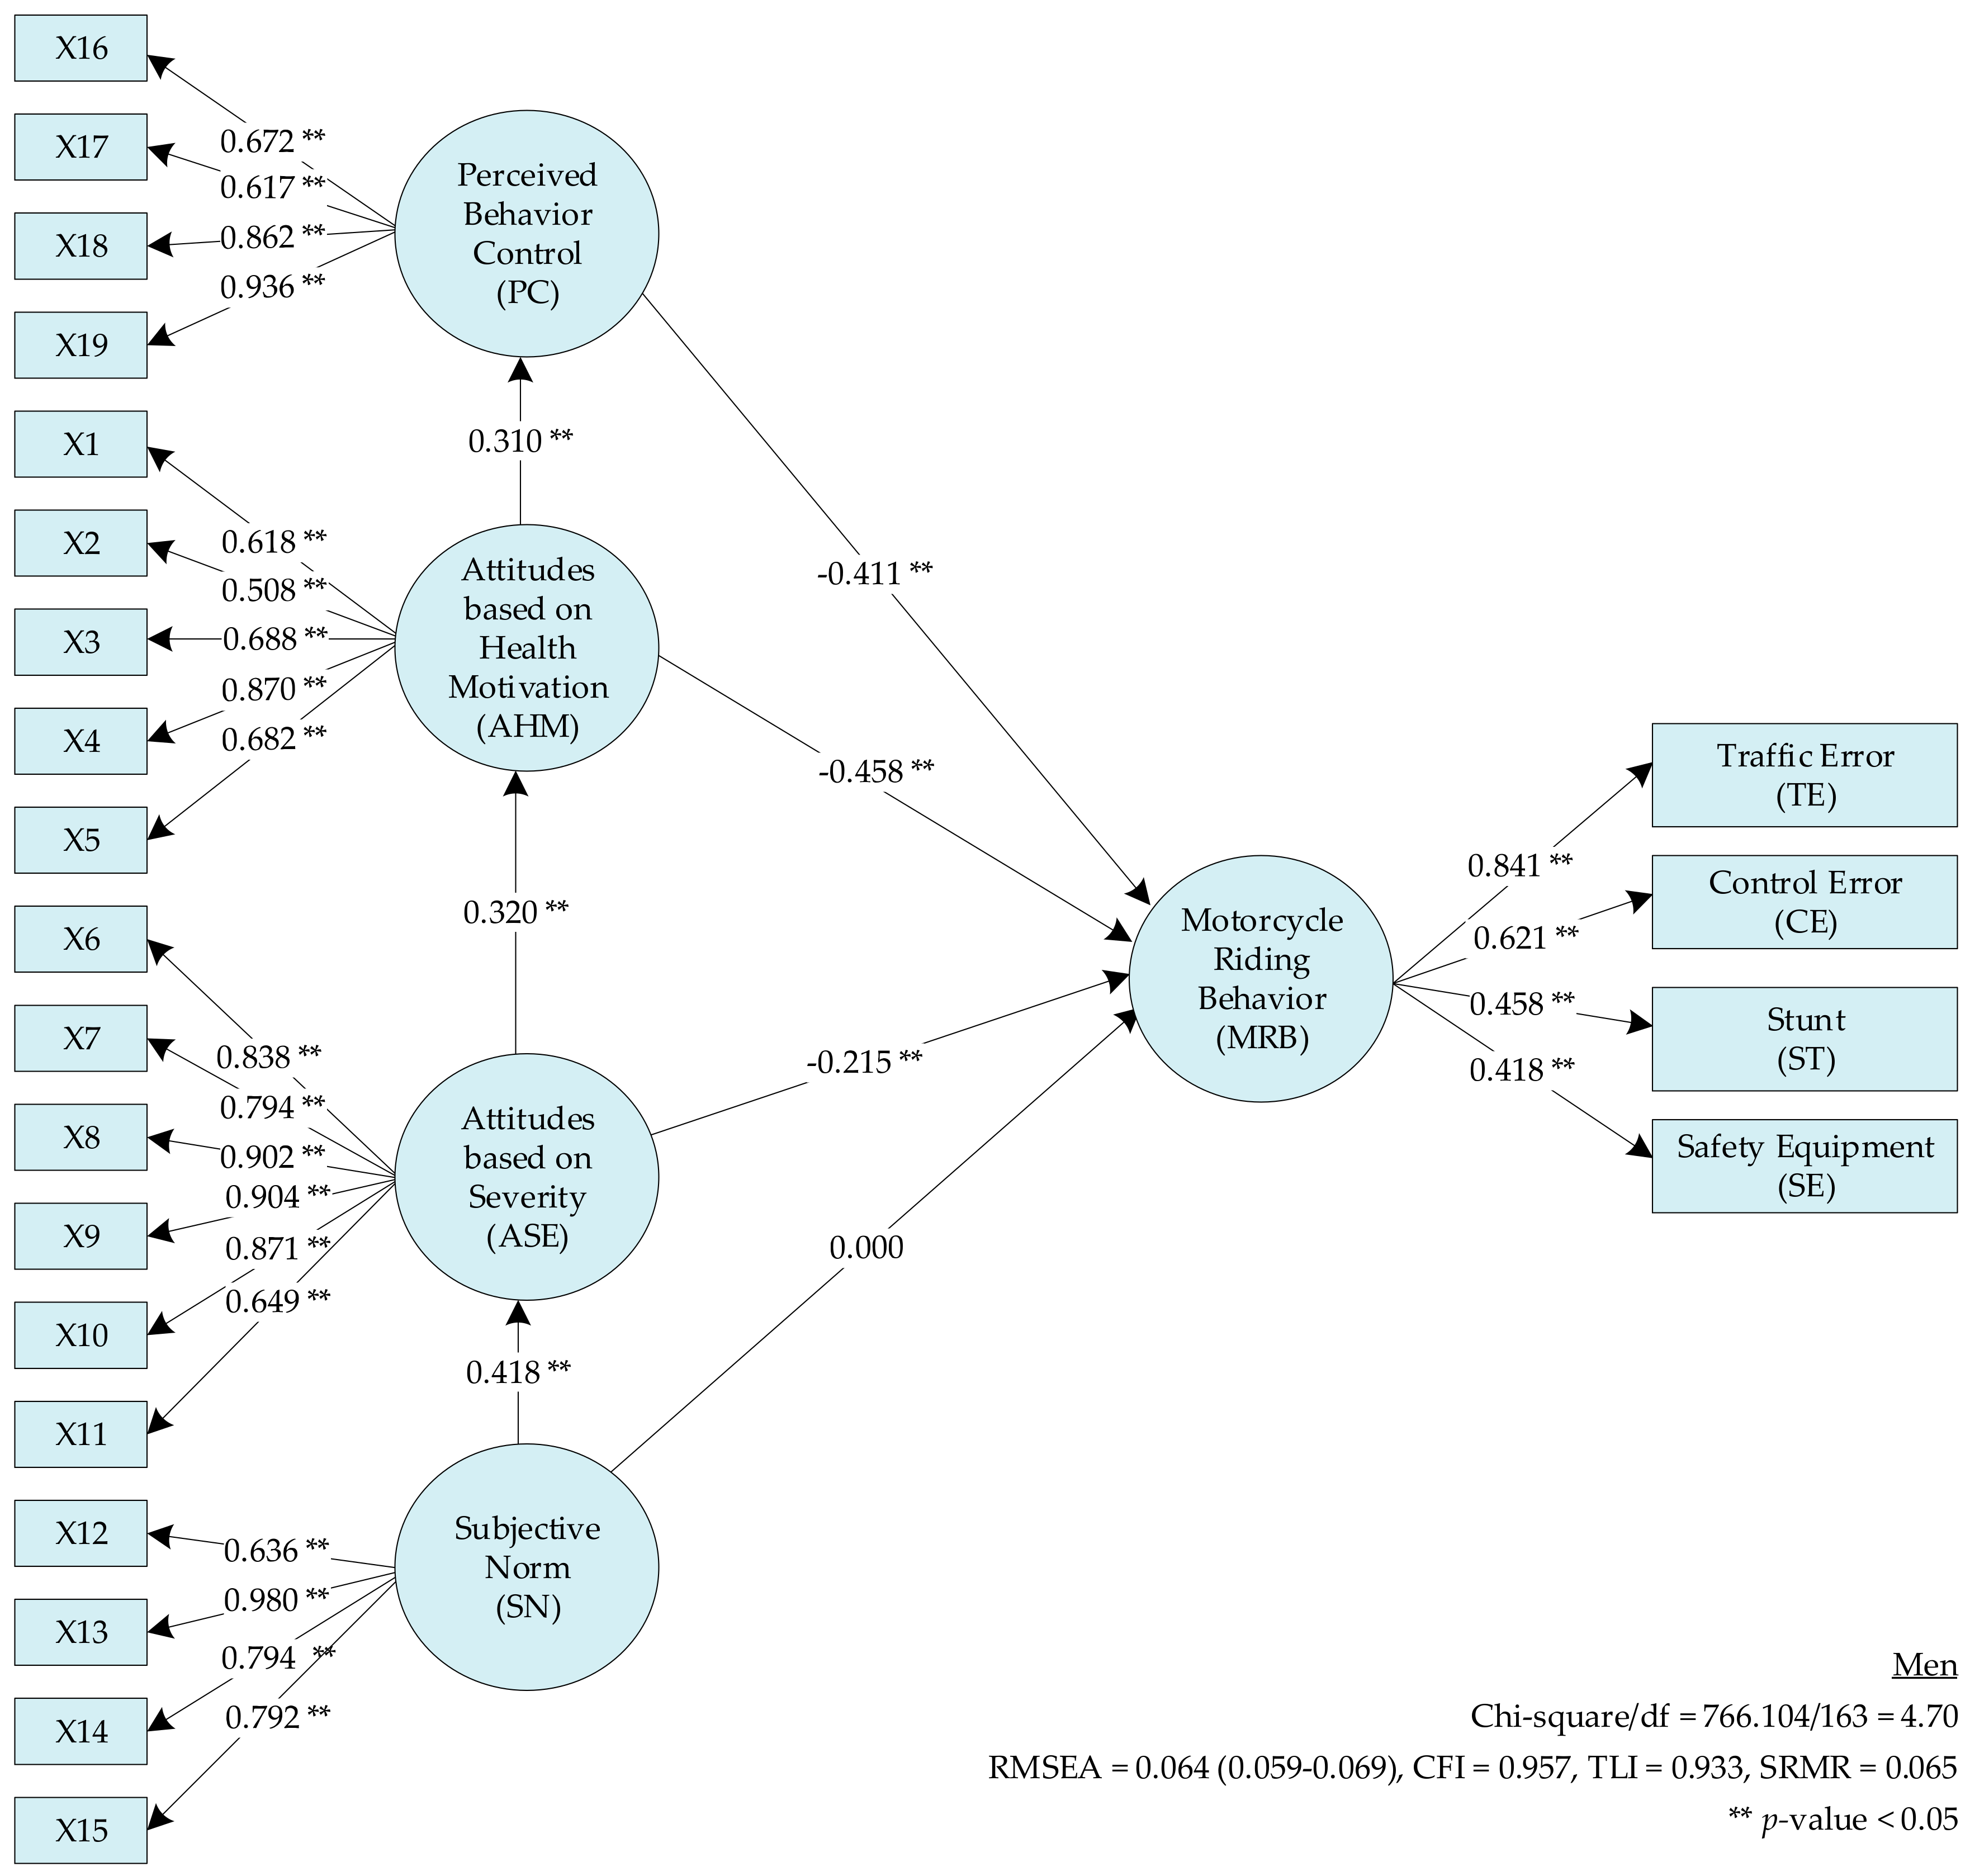
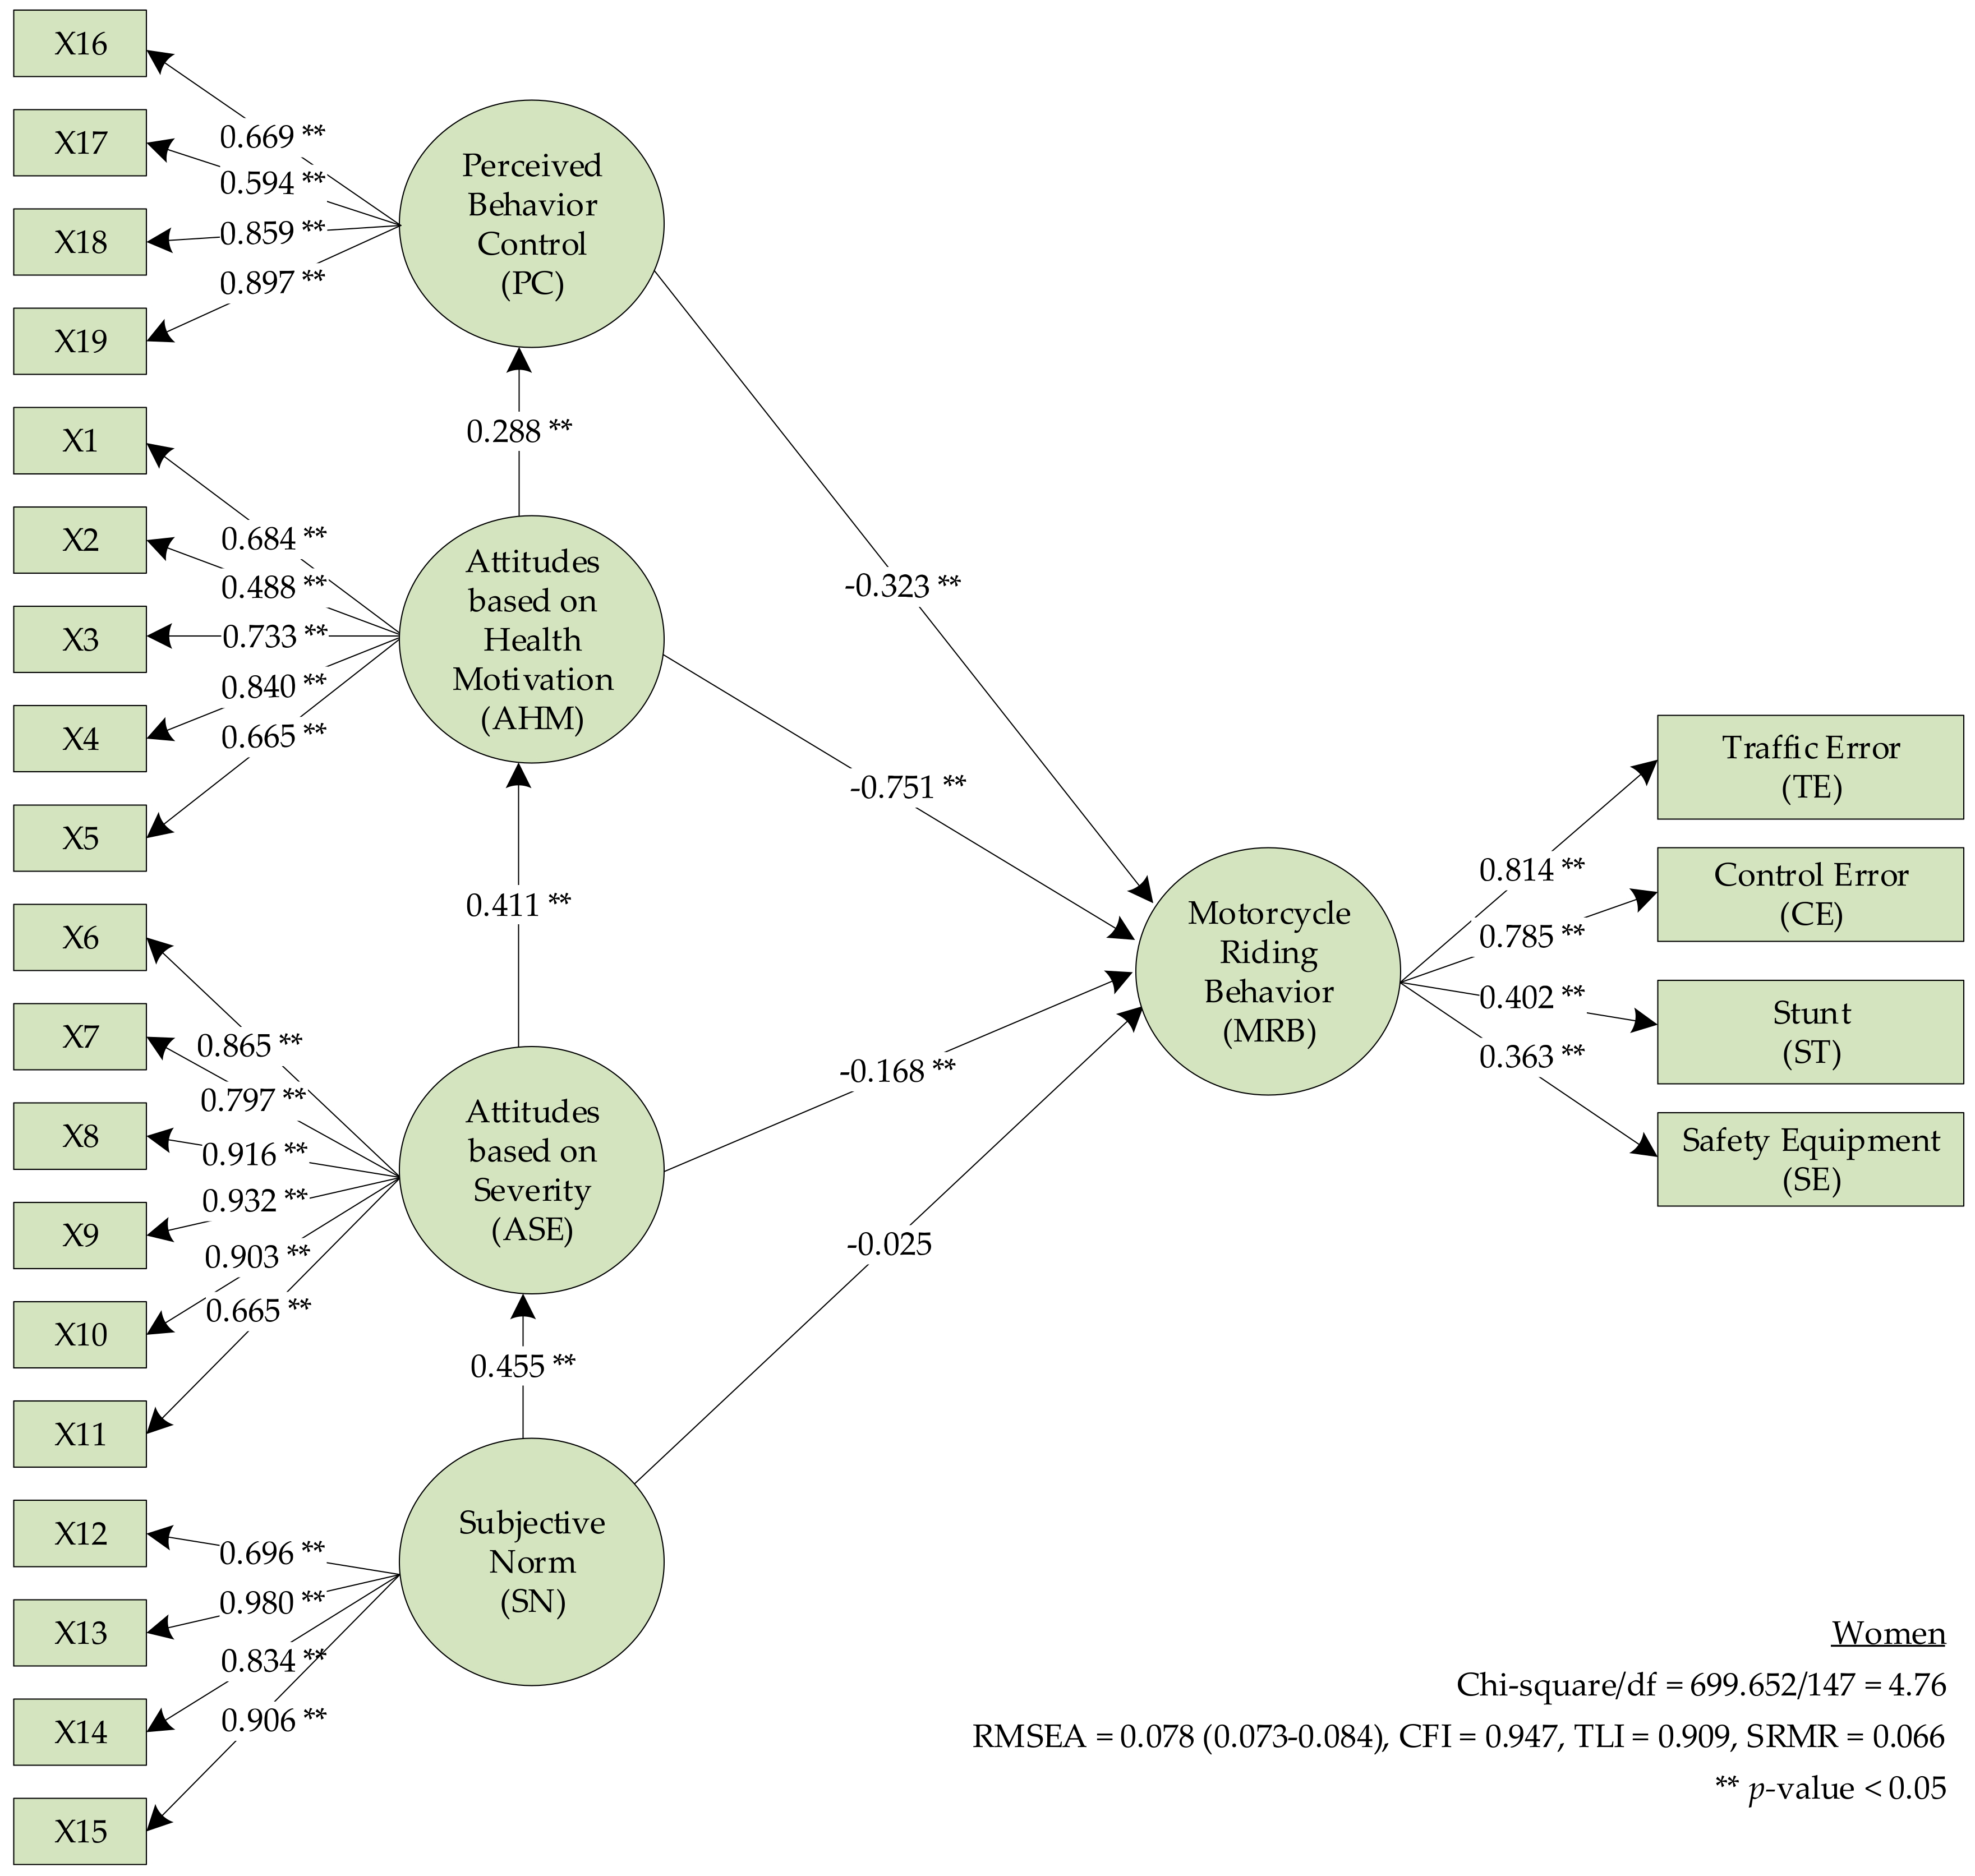
| Theory of Planned Behavior (TPB) | χ2 | df | χ2/df | RMSEA | CFI | TLI | SRMR | Delta-χ2 | Delta-df | p |
|---|---|---|---|---|---|---|---|---|---|---|
| Goodness-of-fit | <5 | <0.08 | >0.8 | >0.7 | <0.08 | |||||
| Theory of planned behavior (TPB) | ||||||||||
| Model 1: Men (n = 903) | 766.104 | 163 | 4.70 | 0.064 (0.059–0.069) | 0.957 | 0.933 | 0.065 | |||
| Model 2: Women (n = 613) | 699.652 | 147 | 4.76 | 0.078 (0.073–0.084) | 0.947 | 0.909 | 0.066 | |||
| TPB Measurement Invariance | ||||||||||
| Model 3: Simultaneous | 1420.039 | 303 | 4.69 | 0.070 (0.066–0.073) | 0.954 | 0.924 | 0.068 | |||
| Model 4: Factor loading, intercept, and structural path held equal groups | 1529.940 | 336 | 4.55 | 0.068 (0.065–0.072) | 0.951 | 0.926 | 0.077 | 109.901 | 33 | 0.0000 |
| Locus of Control (LC) | ||||||||||
| Model 5: Men (n = 903) | 92.597 | 31 | 2.99 | 0.047 (0.036–0.058) | 0.991 | 0.976 | 0.038 | |||
| Model 6: Women (n = 613) | 90.664 | 31 | 2.92 | 0.056 (0.043–0.070) | 0.987 | 0.969 | 0.037 | |||
| LC Measurement invariance | ||||||||||
| Model 7: Simultaneous | 213.265 | 67 | 3.18 | 0.054 (0.046–0.062) | 0.987 | 0.970 | 0.042 | |||
| Model 8: Factor loading, intercept, and structural path held equal groups | 277.877 | 84 | 3.31 | 0.055 (0.048–0.062) | 0.983 | 0.968 | 0.056 | 64.612 | 17 | 0.0000 |
| Variable | Men | Women | ||||||||
|---|---|---|---|---|---|---|---|---|---|---|
| Standardized Estimate | S.E. | Est./S.E. | p-Value | R2 | Standardized Estimate | S.E. | Est./S.E. | p-Value | R2 | |
| Rider behavior use MRBQ by | ||||||||||
| TE | 0.841 | 0.019 | 43.260 | <0.001 | 0.708 | 0.814 | 0.022 | 36.876 | <0.001 | 0.663 |
| CE | 0.621 | 0.023 | 26.990 | <0.001 | 0.386 | 0.785 | 0.024 | 32.918 | <0.001 | 0.617 |
| ST | 0.458 | 0.028 | 16.307 | <0.001 | 0.210 | 0.402 | 0.035 | 11.529 | <0.001 | 0.162 |
| SE | 0.418 | 0.030 | 14.028 | <0.001 | 0.175 | 0.363 | 0.033 | 11.028 | <0.001 | 0.132 |
| Attitudes based on Health Motivation (AHM) by | ||||||||||
| X1 | 0.618 | 0.023 | 26.295 | <0.001 | 0.382 | 0.684 | 0.027 | 25.277 | <0.001 | 0.468 |
| X2 | 0.508 | 0.026 | 19.751 | <0.001 | 0.258 | 0.488 | 0.033 | 14.672 | <0.001 | 0.239 |
| X3 | 0.688 | 0.020 | 34.404 | <0.001 | 0.473 | 0.733 | 0.021 | 34.521 | <0.001 | 0.537 |
| X4 | 0.870 | 0.014 | 61.765 | <0.001 | 0.756 | 0.840 | 0.018 | 47.879 | <0.001 | 0.705 |
| X5 | 0.682 | 0.020 | 34.264 | <0.001 | 0.466 | 0.665 | 0.025 | 26.862 | <0.001 | 0.442 |
| Attitudes based on Severity (ASE) by | ||||||||||
| X6 | 0.838 | 0.011 | 79.202 | <0.001 | 0.703 | 0.865 | 0.011 | 79.094 | <0.001 | 0.748 |
| X7 | 0.794 | 0.013 | 59.357 | <0.001 | 0.631 | 0.797 | 0.015 | 52.117 | <0.001 | 0.635 |
| X8 | 0.902 | 0.010 | 86.630 | <0.001 | 0.814 | 0.916 | 0.010 | 87.518 | <0.001 | 0.839 |
| X9 | 0.904 | 0.009 | 97.035 | <0.001 | 0.818 | 0.932 | 0.009 | 112.354 | <0.001 | 0.868 |
| X10 | 0.871 | 0.010 | 88.353 | <0.001 | 0.759 | 0.903 | 0.008 | 101.576 | <0.001 | 0.815 |
| X11 | 0.649 | 0.020 | 32.868 | <0.001 | 0.422 | 0.665 | 0.022 | 30.911 | <0.001 | 0.442 |
| Subjective Norm (SN) by | ||||||||||
| X12 | 0.636 | 0.018 | 36.069 | <0.001 | 0.405 | 0.696 | 0.020 | 35.504 | <0.001 | 0.485 |
| X13 | 0.980 | 0.009 | 109.981 | <0.001 | 0.960 | 0.980 | 0.011 | 92.916 | <0.001 | 0.961 |
| X14 | 0.794 | 0.008 | 96.966 | <0.001 | 0.631 | 0.834 | 0.013 | 64.417 | <0.001 | 0.695 |
| X15 | 0.792 | 0.013 | 58.866 | <0.001 | 0.628 | 0.906 | 0.015 | 61.312 | <0.001 | 0.821 |
| Perceived Behavior Control (PC) by | ||||||||||
| X16 | 0.672 | 0.020 | 34.183 | <0.001 | 0.451 | 0.669 | 0.026 | 26.019 | <0.001 | 0.447 |
| X17 | 0.617 | 0.025 | 24.818 | <0.001 | 0.381 | 0.594 | 0.033 | 17.914 | <0.001 | 0.352 |
| X18 | 0.862 | 0.012 | 71.733 | <0.001 | 0.744 | 0.859 | 0.017 | 51.543 | <0.001 | 0.738 |
| X19 | 0.936 | 0.010 | 89.163 | <0.001 | 0.876 | 0.897 | 0.020 | 61.319 | <0.001 | 0.805 |
| Variable | Men | Women | ||||||||
|---|---|---|---|---|---|---|---|---|---|---|
| Standardized Estimate | S.E. | Est./S.E. | p-Value | R2 | Standardized Estimate | S.E. | Est./S.E. | p-Value | R2 | |
| Rider behavior use MRBQ by | ||||||||||
| TE | 0.884 | 0.032 | 27.719 | <0.001 | 0.781 | 0.945 | 0.037 | 25.862 | <0.001 | 0.893 |
| CE | 0.588 | 0.028 | 20.720 | <0.001 | 0.346 | 0.561 | 0.032 | 20.518 | <0.001 | 0.424 |
| ST | 0.449 | 0.032 | 14.149 | <0.001 | 0.202 | 0.300 | 0.038 | 7.895 | <0.001 | 0.090 |
| SE | 0.458 | 0.039 | 11.864 | <0.001 | 0.210 | 0.350 | 0.047 | 7.506 | <0.001 | 0.122 |
| Externality (EX) by | ||||||||||
| X12 | 0.621 | 0.020 | 31.756 | <0.001 | 0.386 | 0.739 | 0.018 | 41.011 | <0.001 | 0.547 |
| X13 | 0.962 | 0.014 | 69.801 | <0.001 | 0.926 | 0.948 | 0.012 | 80.874 | <0.001 | 0.899 |
| X14 | 0.797 | 0.013 | 61.343 | <0.001 | 0.636 | 0.857 | 0.011 | 76.796 | <0.001 | 0.734 |
| X15 | 0.871 | 0.012 | 71.118 | <0.001 | 0.759 | 0.911 | 0.010 | 87.172 | <0.001 | 0.831 |
| X20 | 0.841 | 0.013 | 64.395 | <0.001 | 0.707 | 0.845 | 0.014 | 61.173 | <0.001 | 0.715 |
| Internality (IN) by | ||||||||||
| X16 | 0.671 | 0.020 | 33.708 | <0.001 | 0.450 | 0.672 | 0.024 | 27.481 | <0.001 | 0.452 |
| X17 | 0.598 | 0.026 | 23.304 | <0.001 | 0.357 | 0.579 | 0.033 | 17.398 | <0.001 | 0.335 |
| X18 | 0.866 | 0.013 | 67.971 | <0.001 | 0.750 | 0.857 | 0.017 | 49.589 | <0.001 | 0.735 |
| X19 | 0.942 | 0.012 | 81.001 | <0.001 | 0.888 | 0.896 | 0.017 | 53.640 | <0.001 | 0.803 |
| Hypothesis | Men | Women | ||||
|---|---|---|---|---|---|---|
| Standardized Estimates | t-Value | Result | Standardized Estimates | t-Value | Result | |
| Direct effect | ||||||
| Theory of planned (TPB) | ||||||
| H3: PC → MRB | −0.411 | −13.825 ** | Supported | −0.323 | −7.744 ** | Supported |
| H4: AHM → MRB | −0.458 | −11.732 ** | Supported | −0.751 | −9.360 ** | Supported |
| H5: ASE → MRB | −0.215 | −5.835 ** | Supported | −0.168 | −3.023 ** | Supported |
| H6: SN → MRB | 0.000 | −0.012 | - | −0.025 | −0.690 | - |
| Locus of control (LC) | ||||||
| H7: EX → MRB | −0.227 | −5.169 ** | Supported | −0.382 | −7.245 ** | Supported |
| H8: IN → MRB | −0.586 | −19.342 ** | Supported | −0.607 | −7.015 ** | Supported |
| Indirect effect | ||||||
| AHM → PC | 0.310 | 9.613 ** | - | 0.288 | 7.027 ** | - |
| ASE → AHM | 0.320 | 10.129 ** | - | 0.411 | 11.492 ** | - |
| SN → ASE | 0.418 | 15.494 ** | - | 0.455 | 14.891 ** | - |
Publisher’s Note: MDPI stays neutral with regard to jurisdictional claims in published maps and institutional affiliations. |
© 2020 by the authors. Licensee MDPI, Basel, Switzerland. This article is an open access article distributed under the terms and conditions of the Creative Commons Attribution (CC BY) license (http://creativecommons.org/licenses/by/4.0/).
Share and Cite
Uttra, S.; Laddawan, N.; Ratanavaraha, V.; Jomnonkwao, S. Explaining Sex Differences in Motorcyclist Riding Behavior: An Application of Multi-Group Structural Equation Modeling. Int. J. Environ. Res. Public Health 2020, 17, 8797. https://0-doi-org.brum.beds.ac.uk/10.3390/ijerph17238797
Uttra S, Laddawan N, Ratanavaraha V, Jomnonkwao S. Explaining Sex Differences in Motorcyclist Riding Behavior: An Application of Multi-Group Structural Equation Modeling. International Journal of Environmental Research and Public Health. 2020; 17(23):8797. https://0-doi-org.brum.beds.ac.uk/10.3390/ijerph17238797
Chicago/Turabian StyleUttra, Savalee, Napat Laddawan, Vatanavongs Ratanavaraha, and Sajjakaj Jomnonkwao. 2020. "Explaining Sex Differences in Motorcyclist Riding Behavior: An Application of Multi-Group Structural Equation Modeling" International Journal of Environmental Research and Public Health 17, no. 23: 8797. https://0-doi-org.brum.beds.ac.uk/10.3390/ijerph17238797