Associations between Health-Related Physical Fitness and Cardiovascular Disease Risk Factors in Overweight and Obese University Staff

Abstract
:
1. Introduction
2. Materials and Methods
2.1. Participants and Study Design
2.2. Study Variables
2.2.1. Health-Related Physical Fitness Measurement
2.2.2. Cardiovascular Disease Factors Measurement
2.3. Statistical Analysis
3. Results
4. Discussion
5. Conclusions
Author Contributions
Funding
Acknowledgments
Conflicts of Interest
References
- Zhou, M.; Wang, H.; Zhu, J.; Chen, W.; Wang, L.; Liu, S.; Li, Y.; Wang, L.; Liu, Y.; Yin, P.; et al. Cause-specific mortality for 240 causes in China during 1990-2013: A systematic subnational analysis for the Global Burden of Disease Study 2013. Lancet 2016, 387, 251–272. [Google Scholar] [CrossRef]
- Liu, S.; Li, Y.; Zeng, X.; Wang, H.; Yin, P.; Wang, L.; Liu, Y.; Liu, J.; Qi, J.; Ran, S.; et al. Burden of Cardiovascular Diseases in China, 1990-2016: Findings From the 2016 Global Burden of Disease Study. JAMA Cardiol. 2019, 4, 342–352. [Google Scholar] [CrossRef]
- Yu, Q.; Wang, B.; Wang, Y.; Dai, C.L. Level and trend of cardiovascular disease mortality in China from 2002 to 2016. Zhonghua Xin Xue Guan Bing Za Zhi 2019, 47, 479–485. [Google Scholar] [PubMed]
- Shen, C.; Ge, J. Epidemic of Cardiovascular Disease in China: Current Perspective and Prospects for the Future. Circulation 2018, 138, 342–344. [Google Scholar] [CrossRef] [PubMed]
- Joseph, P.; Leong, D.; McKee, M.; Anand, S.S.; Schwalm, J.D.; Teo, K.; Mente, A.; Yusuf, S. Reducing the Global Burden of Cardiovascular Disease, Part 1: The Epidemiology and Risk Factors. Circ. Res. 2017, 121, 677–694. [Google Scholar] [CrossRef] [PubMed]
- Kleber, M.E.; Delgado, G.; Grammer, T.B.; Silbernagel, G.; Huang, J.; Kramer, B.K.; Ritz, E.; Marz, W. Uric Acid and Cardiovascular Events: A Mendelian Randomization Study. J. Am. Soc. Nephrol. 2015, 26, 2831–2838. [Google Scholar] [CrossRef] [PubMed]
- Chiang, K.M.; Tsay, Y.C.; Vincent, N.T.; Yang, H.C.; Huang, Y.T.; Chen, C.H.; Pan, W.H. Is Hyperuricemia, an Early-Onset Metabolic Disorder, Causally Associated with Cardiovascular Disease Events in Han Chinese? J. Clin. Med. 2019, 8, 1202. [Google Scholar] [CrossRef] [Green Version]
- Khan, S.S.; Ning, H.; Wilkins, J.T.; Allen, N.; Carnethon, M.; Berry, J.D.; Sweis, R.N.; Lloyd-Jones, D.M. Association of Body Mass Index With Lifetime Risk of Cardiovascular Disease and Compression of Morbidity. JAMA Cardiol. 2018, 3, 280–287. [Google Scholar] [CrossRef]
- Barry, V.W.; Caputo, J.L.; Kang, M. The Joint Association of Fitness and Fatness on Cardiovascular Disease Mortality: A Meta-Analysis. Prog. Cardiovasc. Dis. 2018, 61, 136–141. [Google Scholar] [CrossRef]
- Abdullah, A.; Wolfe, R.; Stoelwinder, J.U.; de Courten, M.; Stevenson, C.; Walls, H.L.; Peeters, A. The number of years lived with obesity and the risk of all-cause and cause-specific mortality. Int. J. Epidemiol. 2011, 40, 985–996. [Google Scholar] [CrossRef] [Green Version]
- Ortega, F.B.; Lavie, C.J.; Blair, S.N. Obesity and Cardiovascular Disease. Circ. Res. 2016, 118, 1752–1770. [Google Scholar] [CrossRef] [PubMed] [Green Version]
- Penha, J.; Gazolla, F.M.; Carvalho, C.; Madeira, I.R.; Rodrigues-Junior, F.; Machado, E.A.; Sicuro, F.L.; Farinatti, P.; Bouskela, E.; Collett-Solberg, P.F. Physical fitness and activity, metabolic profile, adipokines and endothelial function in children. J. Pediatr. 2019, 95, 531–537. [Google Scholar] [CrossRef] [PubMed]
- Medrano, M.; Arenaza, L.; Migueles, J.H.; Rodriguez-Vigil, B.; Ruiz, J.R.; Labayen, I. Associations of physical activity and fitness with hepatic steatosis, liver enzymes, and insulin resistance in children with overweight/obesity. Pediatr. Diabetes. 2020, 21, 565–574. [Google Scholar] [CrossRef] [PubMed]
- Lima, T.R.; Martins, P.C.; Guerra, P.H.; Silva, D. Muscular strength and cardiovascular risk factors in adults: Systematic review. Phys. Sportsmed. 2020, 1, 1–13. [Google Scholar] [CrossRef]
- Chen, G.C.; Arthur, R.; Iyengar, N.M.; Kamensky, V.; Xue, X.; Wassertheil-Smoller, S.; Allison, M.A.; Shadyab, A.H.; Wild, R.A.; Sun, Y.; et al. Association between regional body fat and cardiovascular disease risk among postmenopausal women with normal body mass index. Eur. Heart J. 2019, 40, 2849–2855. [Google Scholar] [CrossRef]
- Barry, V.W.; Baruth, M.; Beets, M.W.; Durstine, J.L.; Liu, J.; Blair, S.N. Fitness vs. fatness on all-cause mortality: A meta-analysis. Prog. Cardiovasc. Dis. 2014, 56, 382–390. [Google Scholar] [CrossRef]
- Castro-Pinero, J.; Perez-Bey, A.; Segura-Jimenez, V.; Aparicio, V.A.; Gomez-Martinez, S.; Izquierdo-Gomez, R.; Marcos, A.; Ruiz, J.R. Cardiorespiratory Fitness Cutoff Points for Early Detection of Present and Future Cardiovascular Risk in Children: A 2-Year Follow-up Study. Mayo Clin. Proc. 2017, 92, 1753–1762. [Google Scholar] [CrossRef]
- Simons, S.O.; Elliott, A.; Sastry, M.; Hendriks, J.M.; Arzt, M.; Rienstra, M.; Kalman, J.M.; Heidbuchel, H.; Nattel, S.; Wesseling, G.; et al. Chronic obstructive pulmonary disease and atrial fibrillation: An interdisciplinary perspective. Eur. Heart J. 2020. [Google Scholar] [CrossRef]
- Lawman, H.G.; Troiano, R.P.; Perna, F.M.; Wang, C.Y.; Fryar, C.D.; Ogden, C.L. Associations of Relative Handgrip Strength and Cardiovascular Disease Biomarkers in U.S. Adults, 2011-2012. Am. J. Prev. Med. 2016, 50, 677–683. [Google Scholar] [CrossRef]
- Van der Palen, J.; Rea, T.D.; Manolio, T.A.; Lumley, T.; Newman, A.B.; Tracy, R.P.; Enright, P.L.; Psaty, B.M. Respiratory muscle strength and the risk of incident cardiovascular events. Thorax 2004, 59, 1063–1067. [Google Scholar] [CrossRef] [Green Version]
- Garcia-Esquinas, E.; Rodriguez-Artalejo, F. Association between serum uric acid concentrations and grip strength: Is there effect modification by age? Clin. Nutr. 2018, 37, 566–572. [Google Scholar] [CrossRef] [PubMed]
- Chang, K.V.; Hung, C.Y.; Li, C.M.; Lin, Y.H.; Wang, T.G.; Tsai, K.S.; Han, D.S. Reduced flexibility associated with metabolic syndrome in community-dwelling elders. PLoS ONE 2015, 10, e117167. [Google Scholar] [CrossRef] [PubMed] [Green Version]
- Sita, C.; Sachita, S.; Mausumi, B.; Raghunath, M. A study on cardiovascular disease risk factors among faculty members of a tertiary care teaching institute of Kolkata. J. Community Health Manag. 2018, 5, 67–71. [Google Scholar] [CrossRef]
- Cheong, S.M.; Kandiah, M.; Chinna, K.; Chan, Y.M.; Saad, H.A. Prevalence of obesity and factors associated with it in a worksite setting in Malaysia. J. Community Health 2010, 35, 698–705. [Google Scholar] [CrossRef] [PubMed]
- Zhou, B.F. Predictive values of body mass index and waist circumference for risk factors of certain related diseases in Chinese adults--study on optimal cut-off points of body mass index and waist circumference in Chinese adults. Biomed. Environ. Sci. 2002, 15, 83–96. [Google Scholar]
- Yeh, W.C.; Tsao, Y.C.; Li, W.C.; Tzeng, I.S.; Chen, L.S.; Chen, J.Y. Elevated triglyceride-to-HDL cholesterol ratio is an indicator for insulin resistance in middle-aged and elderly Taiwanese population: A cross-sectional study. Lipids Health Dis. 2019, 18, 176. [Google Scholar] [CrossRef] [Green Version]
- Tsushima, Y.; Nishizawa, H.; Tochino, Y.; Nakatsuji, H.; Sekimoto, R.; Nagao, H.; Shirakura, T.; Kato, K.; Imaizumi, K.; Takahashi, H.; et al. Uric acid secretion from adipose tissue and its increase in obesity. J. Biol. Chem. 2013, 288, 27138–27149. [Google Scholar] [CrossRef] [Green Version]
- Nagao, H.; Nishizawa, H.; Tanaka, Y.; Fukata, T.; Mizushima, T.; Furuno, M.; Bamba, T.; Tsushima, Y.; Fujishima, Y.; Kita, S.; et al. Hypoxanthine Secretion from Human Adipose Tissue and its Increase in Hypoxia. Obesity 2018, 26, 1168–1178. [Google Scholar] [CrossRef] [Green Version]
- Yamada, A.; Sato, K.K.; Kinuhata, S.; Uehara, S.; Endo, G.; Hikita, Y.; Fujimoto, W.Y.; Boyko, E.J.; Hayashi, T. Association of Visceral Fat and Liver Fat With Hyperuricemia. Arthritis Care Res. 2016, 68, 553–561. [Google Scholar] [CrossRef]
- Huang, X.; Jiang, X.; Wang, L.; Chen, L.; Wu, Y.; Gao, P.; Hua, F. Visceral adipose accumulation increased the risk of hyperuricemia among middle-aged and elderly adults: A population-based study. J. Transl. Med. 2019, 17, 341. [Google Scholar] [CrossRef] [Green Version]
- Kawamoto, R.; Ninomiya, D.; Kasai, Y.; Kusunoki, T.; Ohtsuka, N.; Kumagi, T.; Abe, M. Serum Uric Acid Is Positively Associated with Handgrip Strength among Japanese Community-Dwelling Elderly Women. PLoS ONE 2016, 11, e151044. [Google Scholar] [CrossRef] [PubMed]
- Xu, Z.R.; Zhang, Q.; Chen, L.F.; Xu, K.Y.; Xia, J.Y.; Li, S.M.; Yang, Y.M. Characteristics of hyperuricemia in older adults in China and possible associations with sarcopenia. Aging Med. 2018, 1, 23–34. [Google Scholar] [CrossRef] [PubMed]
- Wu, Y.; Zhang, D.; Pang, Z.; Jiang, W.; Wang, S.; Tan, Q. Association of serum uric acid level with muscle strength and cognitive function among Chinese aged 50-74 years. Geriatr. Gerontol. Int. 2013, 13, 672–677. [Google Scholar] [CrossRef] [PubMed]
- Dong, X.W.; Tian, H.Y.; He, J.; Wang, C.; Qiu, R.; Chen, Y.M. Elevated Serum Uric Acid Is Associated with Greater Bone Mineral Density and Skeletal Muscle Mass in Middle-Aged and Older Adults. PLoS ONE 2016, 11, e154692. [Google Scholar] [CrossRef] [Green Version]
- Macchi, C.; Molino-Lova, R.; Polcaro, P.; Guarducci, L.; Lauretani, F.; Cecchi, F.; Bandinelli, S.; Guralnik, J.M.; Ferrucci, L. Higher circulating levels of uric acid are prospectively associated with better muscle function in older persons. Mech. Ageing Dev. 2008, 129, 522–527. [Google Scholar] [CrossRef]
- Lee, J.; Hong, Y.S.; Park, S.H.; Kang, K.Y. High serum uric acid level is associated with greater handgrip strength in the aged population. Arthritis Res. Ther. 2019, 21, 73. [Google Scholar] [CrossRef] [Green Version]
- Molino-Lova, R.; Sofi, F.; Pasquini, G.; Vannetti, F.; Del, R.S.; Vassalle, C.; Clerici, M.; Sorbi, S.; Macchi, C. Higher uric acid serum levels are associated with better muscle function in the oldest old: Results from the Mugello Study. Eur. J. Intern. Med. 2017, 41, 39–43. [Google Scholar] [CrossRef]
- Park, C.; Obi, Y.; Streja, E.; Rhee, C.M.; Catabay, C.J.; Vaziri, N.D.; Kovesdy, C.P.; Kalantar-Zadeh, K. Serum uric acid, protein intake and mortality in hemodialysis patients. Nephrol Dial. Transpl. 2017, 32, 1750–1757. [Google Scholar] [CrossRef] [Green Version]
- Alexandrov, N.V.; Eelderink, C.; Singh-Povel, C.M.; Navis, G.J.; Bakker, S.; Corpeleijn, E. Dietary Protein Sources and Muscle Mass over the Life Course: The Lifelines Cohort Study. Nutrients 2018, 10, 1471. [Google Scholar] [CrossRef] [Green Version]
- Aparicio, V.A.; Marin-Jimenez, N.; Coll-Risco, I.; de la Flor-Alemany, M.; Baena-Garcia, L.; Acosta-Manzano, P.; Aranda, P. Doctor, ask your perimenopausal patient about her physical fitness; association of self-reported physical fitness with cardiometabolic and mental health in perimenopausal women: The FLAMENCO project. Menopause 2019, 26, 1146–1153. [Google Scholar] [CrossRef]
- Won, H.Y.; Park, J.B.; Park, E.Y.; Riew, K.D. Effect of hyperglycemia on apoptosis of notochordal cells and intervertebral disc degeneration in diabetic rats. J. Neurosurg Spine 2009, 11, 741–748. [Google Scholar] [CrossRef] [PubMed]
- Wang, J.; Markova, D.; Anderson, D.G.; Zheng, Z.; Shapiro, I.M.; Risbud, M.V. TNF-alpha and IL-1beta promote a disintegrin-like and metalloprotease with thrombospondin type I motif-5-mediated aggrecan degradation through syndecan-4 in intervertebral disc. J. Biol. Chem. 2011, 286, 39738–39749. [Google Scholar] [CrossRef] [PubMed] [Green Version]
- Dagistan, Y.; Cukur, S.; Dagistan, E.; Gezici, A.R. Importance of IL-6, MMP-1, IGF-1, and BAX Levels in Lumbar Herniated Disks and Posterior Longitudinal Ligament in Patients with Sciatic Pain. World Neurosurg. 2015, 84, 1739–1746. [Google Scholar] [CrossRef] [PubMed]
- Gregorio-Arenas, E.; Ruiz-Cabello, P.; Camiletti-Moiron, D.; Moratalla-Cecilia, N.; Aranda, P.; Lopez-Jurado, M.; Llopis, J.; Aparicio, V.A. The associations between physical fitness and cardiometabolic risk and body-size phenotypes in perimenopausal women. Maturitas 2016, 92, 162–167. [Google Scholar] [CrossRef]
- Supriya, R.; Yu, A.P.; Lee, P.H.; Lai, C.W.; Cheng, K.K.; Yau, S.Y.; Chan, L.W.; Yung, B.Y.; Siu, P.M. Yoga training modulates adipokines in adults with high-normal blood pressure and metabolic syndrome. Scand. J. Med. Sci Sports 2018, 28, 1130–1138. [Google Scholar] [CrossRef] [Green Version]
- Konieczna, J.; Abete, I.; Galmes, A.M.; Babio, N.; Colom, A.; Zulet, M.A.; Estruch, R.; Vidal, J.; Toledo, E.; Diaz-Lopez, A.; et al. Body adiposity indicators and cardiometabolic risk: Cross-sectional analysis in participants from the PREDIMED-Plus trial. Clin. Nutr. 2019, 38, 1883–1891. [Google Scholar] [CrossRef]
- Keswell, D.; Tootla, M.; Goedecke, J.H. Associations between body fat distribution, insulin resistance and dyslipidaemia in black and white South African women. Cardiovasc. J. Afr. 2016, 27, 177–183. [Google Scholar] [CrossRef] [Green Version]
- Ormazabal, V.; Nair, S.; Elfeky, O.; Aguayo, C.; Salomon, C.; Zuniga, F.A. Association between insulin resistance and the development of cardiovascular disease. Cardiovasc. Diabetol. 2018, 17, 122. [Google Scholar] [CrossRef]
- Lee, W.J.; Peng, L.N.; Chiou, S.T.; Chen, L.K. Relative Handgrip Strength Is a Simple Indicator of Cardiometabolic Risk among Middle-Aged and Older People: A Nationwide Population-Based Study in Taiwan. PLoS ONE 2016, 11, e160876. [Google Scholar] [CrossRef] [Green Version]
- Lee, M.R.; Jung, S.M.; Kim, H.S.; Kim, Y.B. Association of muscle strength with cardiovascular risk in Korean adults: Findings from the Korea National Health and Nutrition Examination Survey (KNHANES) VI to VII (2014-2016). Medicine 2018, 97, e13240. [Google Scholar] [CrossRef]
- Giudice, J.; Taylor, J.M. Muscle as a paracrine and endocrine organ. Curr. Opin. Pharmacol. 2017, 34, 49–55. [Google Scholar] [CrossRef] [PubMed]
- Bostrom, P.; Wu, J.; Jedrychowski, M.P.; Korde, A.; Ye, L.; Lo, J.C.; Rasbach, K.A.; Bostrom, E.A.; Choi, J.H.; Long, J.Z.; et al. A PGC1-alpha-dependent myokine that drives brown-fat-like development of white fat and thermogenesis. Nature 2012, 481, 463–468. [Google Scholar] [CrossRef] [PubMed]
- Seldin, M.M.; Peterson, J.M.; Byerly, M.S.; Wei, Z.; Wong, G.W. Myonectin (CTRP15), a novel myokine that links skeletal muscle to systemic lipid homeostasis. J. Biol. Chem. 2012, 287, 11968–11980. [Google Scholar] [CrossRef] [PubMed] [Green Version]

| Men | Women | All | |
|---|---|---|---|
| Sample size (n, %) | 231 (67.9%) | 109 (32.1%) | 340 (100%) |
| Age (n, %) | |||
| ≤30 years | 20 (8.7%) | 11 (10.1%) | 31 (9.1%) |
| 31–40 years | 80 (34.6%) | 41 (37.6%) | 121 (35.6%) |
| 41–50 years | 60 (26.0%) | 31 (28.4%) | 91 (26.8%) |
| 51–60 years | 71 (30.7%) | 26 (23.9%) | 97 (28.5%) |
| BMI (n, %) | |||
| 24–27.9 (overweight) | 192 (83.1%) | 92 (84.4%) | 284 (83.5%) |
| ≥ 28.0 (obese) | 39 (16.9%) | 17 (15.6%) | 56 (16.5%) |
| HPF indicators | |||
| Skeletal muscle mass (kg) a | 33.07 ± 2.86 | 24.40 ± 2.49 | 30.29 ± 4.86 |
| Skeletal muscle mass index (kg/m2) a | 11.00 ± 0.62 | 9.17 ± 0.68 | 10.43 ± 1.06 |
| Body fat mass (kg) b | 20.00 (5.80) | 24.10 (5.00) | 21.20 (6.40) |
| Body fat percentage (%)b | 25.00 (5.06) | 35.55 (4.34) | 27.48 (9.64) |
| Grip strength (kg) b | 36.50 (9.40) | 25.60 (5.20) | 33.60 (11.10) |
| Sit-and-reach (cm) b | 4.10 (11.50) | 9.15 (11.80) | 5.90 (11.00) |
| Vital capacity (mL) a | 3957.94 ± 844.10 | 2708.75 ± 624.92 | 3564.65 ± 979.17 |
| Vital capacity index (mL/kg) a | 50.66 ± 10.59 | 39.71 ± 9.54 | 47.40 ± 11.44 |
| CVD risk factors | |||
| UA (umol/L) b | 384.00 (72.00) | 301.50 (65.00) | 363.00 (97.00) |
| TG (mmol/L) b | 1.35 (0.79) | 1.10 (0.65) | 1.27 (0.79) |
| HDL-C (mmol/L) a | 1.32 ± 0.24 | 1.54 ± 0.25 | 1.38 ± 0.42 |
| LDL-C (mmol/L) b | 2.96 (0.74) | 2.65 (0.91) | 2.92 (0.86) |
| TG/HDL-C ratio b | 1.01 (0.70) | 0.70 (0.53) | 0.91 (0.72) |
| GLU (mmol/L) a | 5.03 ± 0.43 | 5.07 ± 0.42 | 5.05 ± 0.51 |
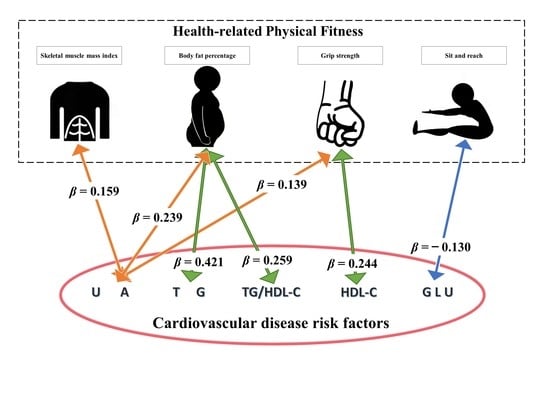
| Dependent Variables a | Independent Variables a | β | β (95%CI) | SE | p | R2 |
|---|---|---|---|---|---|---|
| SMI | 0.159 | (0.001, 0.318) | 0.081 | 0.049 * | ||
| BFP | 0.239 | (0.076, 0.402) | 0.083 | 0.004 * | ||
| UA | GS | 0.139 | (0.018, 0.259) | 0.061 | 0.024 * | 0.363 |
| SRT | 0.027 | (−0.068, 0.122) | 0.048 | 0.579 | ||
| VCI | 0.031 | (−0.086, 0.147) | 0.059 | 0.608 | ||
| SMI | 0.162 | (−0.030, 0.353) | 0.097 | 0.098 | ||
| BFP | 0.421 | (0.226, 0.617) | 0.099 | 0.000 * | ||
| TG | GS | 0.031 | (−0.113, 0.175) | 0.073 | 0.673 | 0.098 |
| SRT | −0.036 | (−0.149, 0.078) | 0.058 | 0.538 | ||
| VCI | 0.047 | (−0.092, 0.187) | 0.071 | 0.507 | ||
| SMI | −0.183 | (−0.370, 0.003) | 0.095 | 0.054 | ||
| BFP | 0.014 | (−0.177, 0.205) | 0.097 | 0.887 | ||
| HDL-C | GS | 0.244 | (0.103, 0.385) | 0.072 | 0.001 * | 0.128 |
| SRT | −0.009 | (−0.121, 0.103) | 0.057 | 0.871 | ||
| VCI | 0.066 | (−0.072, 0.203) | 0.070 | 0.349 | ||
| SMI | 0.045 | (−0.148, 0.238) | 0.054 | 0.646 | ||
| BFP | 0.131 | (−0.068, 0.330) | 0.010 | 0.197 | ||
| LDL-C | GS | −0.009 | (−0.155, 0.136) | 0.005 | 0.900 | 0.063 |
| SRT | 0.097 | (−0.019, 0.212) | 0.004 | 0.102 | ||
| VCI | 0.004 | (−0.138, 0.147) | 0.004 | 0.954 | ||
| SMI | 0.150 | (−0.043, 0.344) | 0.099 | 0.128 | ||
| BFP | 0.259 | (0.061, 0.457) | 0.101 | 0.011 * | ||
| TG/HDL-C | GS | −0.054 | (−0.201, 0.092) | 0.074 | 0.465 | 0.070 |
| SRT | −0.029 | (−0.145, 0.087) | 0.059 | 0.622 | ||
| VCI | −0.008 | (−0.151, 0.134) | 0.072 | 0.909 | ||
| SMI | 0.181 | (−0.007, 0.369) | 0.096 | 0.059 | ||
| BFP | 0.128 | (−0.065, 0.321) | 0.098 | 0.192 | ||
| GLU | GS | 0.035 | (−0.107, 0.177) | 0.072 | 0.630 | 0.083 |
| SRT | −0.130 | (−0.243, −0.017) | 0.057 | 0.024 * | ||
| VCI | −0.052 | (−0.190, 0.086) | 0.070 | 0.461 |
Publisher’s Note: MDPI stays neutral with regard to jurisdictional claims in published maps and institutional affiliations. |
© 2020 by the authors. Licensee MDPI, Basel, Switzerland. This article is an open access article distributed under the terms and conditions of the Creative Commons Attribution (CC BY) license (http://creativecommons.org/licenses/by/4.0/).
Share and Cite
Chen, J.; Zhou, Y.; Pan, X.; Li, X.; Long, J.; Zhang, H.; Zhang, J. Associations between Health-Related Physical Fitness and Cardiovascular Disease Risk Factors in Overweight and Obese University Staff. Int. J. Environ. Res. Public Health 2020, 17, 9031. https://0-doi-org.brum.beds.ac.uk/10.3390/ijerph17239031
Chen J, Zhou Y, Pan X, Li X, Long J, Zhang H, Zhang J. Associations between Health-Related Physical Fitness and Cardiovascular Disease Risk Factors in Overweight and Obese University Staff. International Journal of Environmental Research and Public Health. 2020; 17(23):9031. https://0-doi-org.brum.beds.ac.uk/10.3390/ijerph17239031
Chicago/Turabian StyleChen, Jiangang, Yuan Zhou, Xinliang Pan, Xiaolong Li, Jiamin Long, Hui Zhang, and Jing Zhang. 2020. "Associations between Health-Related Physical Fitness and Cardiovascular Disease Risk Factors in Overweight and Obese University Staff" International Journal of Environmental Research and Public Health 17, no. 23: 9031. https://0-doi-org.brum.beds.ac.uk/10.3390/ijerph17239031