Gender and Age Differences in Loneliness: Evidence for People without and with Disabilities

Department of Applied Economics, University of Malaga, 29071 Malaga, Spain
Int. J. Environ. Res. Public Health 2020, 17(24), 9176; https://0-doi-org.brum.beds.ac.uk/10.3390/ijerph17249176
Submission received: 25 October 2020
/
Revised: 2 December 2020
/
Accepted: 5 December 2020
/
Published: 8 December 2020
(This article belongs to the Special Issue Disability, Ageing, and Social Capital)
Abstract
:This study examines the relationships between loneliness, gender, and age for people without and with disabilities (moderate versus severe) in Germany. Using data taken from the German Socio-Economic Panel (SOEP) for the years 2013 and 2017 and using the UCLA (University of California, Los Angeles) Loneliness Scale, in general we found that males report lower loneliness scores as compared to those for females. Furthermore, we found a strong association between loneliness and the individual’s age, but with differences according to gender and disability status. For example, for males with severe disabilities levels of loneliness decrease with age, whereas for females with severe disabilities the opposite result is found. In addition, we found that participation in leisure activities and having a higher frequency of contacts with family, friends, and social online networks (measured by the relational time index) contribute to reducing loneliness for all individuals. From a public policy perspective, it is necessary to undertake the design, promotion, and implementation of instrumental, emotional, and social support measures for people with disabilities (in particular for females that are severely limited in their daily activities), which can contribute to reducing their loneliness scores and increasing their levels of life satisfaction.
1. Introduction
The deficit in social participation and relationships can lead individuals to report higher levels of loneliness [1,2,3,4]. Social relationships are also crucial to personal health and happiness [5,6,7,8,9]. Loneliness can be defined as the discrepancy between desired and actual quantity and quality of social relations [10]. Furthermore, loneliness is a subjective experience, which is painful, unwanted, aversive, and difficult to tolerate [11,12,13]. It has also been associated with alcohol abuse and suicide, and undermines confidence in the ability to create and maintain social relationships [14,15,16,17,18,19]. Loneliness scores vary by personality, age, gender, regions, cultures, race, socio-economic conditions, and health status, among other factors [20,21,22,23,24,25,26].
According to the literature on loneliness and health status [27,28,29,30,31,32,33,34], loneliness is a strong predictor of mental health problems, depression, heart disease, blood pressure issues, poorer health status, and functional decline, and is a risk factor for mortality and morbidity. In many cases, and in particular among older people, these illnesses and health concerns may lead individuals to experience functional disabilities, thus reducing their levels of social contact, engagement with other peers, and participation in leisure activities [35,36,37,38,39]. People with disabilities are more vulnerable to discrimination, stigmatization, marginalization, and social exclusion, and hence more likely to report higher levels of loneliness than people without disabilities [40,41,42]. The loss of independence, autonomy, self-esteem, and confidence among people with disabilities may seriously affect their loneliness scores. Furthermore, disability rates increase with age and are traditionally higher for females than males, while females also have a longer duration of life lived with a disability [43].
The goal of this study is to analyze the levels of loneliness reported by people without and with disabilities by gender and age in Germany. We use data taken from the German Socio-Economic Panel (SOEP) for the years 2013 and 2017. The use of this dataset allows us to divide people with disabilities into two groups: those people who have a moderate disability, and those with a severe disability that limits their daily activities. In addition, for those two years, the SOEP includes a set of questions that are suitable for creating a validated three-item version of the UCLA Loneliness Scale [44,45,46]. Although there is a plethora of previous studies investigating loneliness, few empirical studies exist that analyze the association between loneliness and disability [38,39,40,41,47,48]. However, none of these studies have examined the loneliness differential by gender and age for people with disabilities. Looking at the existing literature on loneliness, we also found inconsistent results in terms of gender and age differences in loneliness for the general population. For example, several studies [36,49,50] have found that males are more likely than females to report lower levels of loneliness, whereas others found the opposite result [51,52]. In the same vein, the relationship between age and loneliness is unclear. For example, Yang and Victor [22] found that the prevalence of loneliness generally increases with age, but this relationship varies by country, with those individuals living in Northern European countries reporting lower levels of loneliness across the age groups than those in Southern Europe. In contrast, other studies have found a U-shaped relationship between loneliness and age, in which younger and older people report higher levels of loneliness as compared to those in middle age [23,53,54].
Overall, none of these previous empirical studies have analyzed the particular situation of people with moderate and severe disabilities in terms of loneliness in general, and gender and age differences in particular. To our knowledge, this is the first attempt to investigate these issues and shed further light on predictors of loneliness at different development stages of life for males and females with disabilities. Therefore, this study fills an important gap in the existing literature on loneliness and disability, and our results may help design and implement specific public actions and policies to increase the levels of social participation, inclusion, and well-being among people with disabilities.
2. Data and Methods
To carry out this study, we used data taken from the German Socio-Economic Panel (SOEP) for the years 2013 and 2017. This survey was developed and is conducted by the German Institute for Economic Research (DIW Berlin), and funded by the German Federal Government and the State of Berlin. This representative longitudinal dataset of German individuals started in 1984 and has a high level of stability over time (thanks to the use of refreshment samples in 1998, 2000, 2006, 2011, 2012, and 2017). One of the main advantages of the SOEP is the rich and varied information it contains at individual and household levels on income, living conditions, employment, health status, household composition, education, social capital, and satisfaction, among others (for example, see Wagner et al. [55], Goebel et al. [56], and https://www.diw.de/en/soep for additional information on the SOEP data, samples, consent from the respondents, questionnaires, and methodology, among others). Despite the fact that the SOEP dataset has information for the period 1984–2018 (version 35), we only used data from two years (2013 and 2017), because the loneliness measure was only available within those years. In our case, we restricted our sample to individuals aged 16 or over and without missing information. After dropping observations with missing values, our final samples used for the loneliness regressions consisted of 19,763 and 22,806 males and females, respectively.
Similar to other previous studies on loneliness [23,45,57,58], we constructed our loneliness measure following the work of Russell [44], a validated three-item version of the UCLA Loneliness Scale, designed specifically for large datasets. For this purpose, we used three questions included in the SOEP for the years 2013 and 2017:
- (1)
- How often do you miss the company of other people?
- (2)
- How often do you feel left out?
- (3)
- How often do you feel socially isolated?
The possible answers to these three questions and the codification used in this study were: 0 = never; 1 = seldom; 2 = sometimes; 3 = often; 4 = very often. In line with other studies [23,59,60], we constructed our loneliness measure (called “loneliness”) as the mean value of the responses to these three questions, i.e., the loneliness scale takes values from zero (no loneliness) to 4 (high level of loneliness). According to Hughes et al. [45], this three-item version of the UCLA Loneliness Scale is strongly correlated with the full 20-item version of the UCLA Loneliness Scale (and also with depression and perceived stress). In addition, Hawkley et al. [46] found that the German version used in the SOEP exhibits invariance and to correlate similarly with correlates of loneliness, such as self-rated health and frequency of social activity.
As for our disability measure, once again we used two questions from the SOEP for the years 2013 and 2017:
- (1)
- Do you have a health problem that limits you in normal everyday life? Possible answers: Yes, severely; yes, somewhat; no, not at all;
- (2)
- For those individuals responding “yes, severely” or “yes, somewhat” to the first question, the follow up question was: Have you had this health problem for more than half a year? Possible answers: Yes/no.
Those individuals who responded “no, not at all” to the first question were defined as “people without disabilities”. In addition, those individuals who responded “no” to the second question were again considered as “people without disabilities”, whereas those answering “yes” were defined as “people with disabilities”. Within this latter group and following the work of Gannon [61], we differentiated two subgroups of people with disabilities according to their degree of disability: (a) those reporting a health problem for more than half a year that severely limits their normal daily activities; (b) those reporting such a condition but state that it limits them somewhat (i.e., moderately). Therefore, we identified three possible groups by disability status:
- (1)
- People without disabilities;
- (2)
- People with disabilities, moderately limited;
- (3)
- People with disabilities, severely limited.
We used a definition of disability that “is a standard measure used in many OECD countries – it conforms to the newer social model of disability, whereby disability is seen as a consequence of social, attitudinal, and environmental barriers that prevent people from participating in society (Gannon and Munley [62], p. 40)”. The European Disability Strategy 2010–2020 also adopted this new social model to design and implement actions and policies aimed at achieving full economic and social participation of people with disabilities across Europe. Although our disability measure is a self-evaluation and does not refer to an “objective” definition of disability, the questions of the SOEP incorporate the main objective of the World Health Organization definition, which relates disability to limitations on daily activities. In any case, we have to bear in mind that that measuring the degree of disability with any survey is inherently difficult from a methodological point of view and is subject to wide debate among the people involved [63].
As for the econometric process, we ran an ordinary least squares (OLS) model on loneliness, which was performed separately for males and females. We also ran this OLS model for different age groups in order to found any different effect of disability on loneliness. In particular, we split our sample into four age groups: 16–29 years (young people), 30–49 years (lower middle-aged people), 50–64 years (higher middle-aged people), and 64 years and above (older people). To estimate our OLS model of loneliness and following the existing literature, we included the following set of explanatory variables: individual’s disability status (i.e., without disabilities, moderate disability, or severe disability), age (and its square and cube values divided by 1000), years of education, marital status (i.e., single, living without a partner, or living with a partner), existence of children in the household, household size, having German nationality, real household income (in logarithms), employment status (i.e., full-time, part-time, or non-working), relational time index (proposed by Becchetti et al. [64], measuring the individual’s social capital, which is simply the unweighted mean (i.e., all the components have the same weight, thus allowing for perfect substitution between the relational events) of the scores given to the frequency of contacts with family members, friends, and neighbors; use of online social networks; frequency of participation in volunteering, sports, cultural activities, and religious events), region of residence (17 German states/Länder), and year of interview (i.e., 2013 or 2017). We used the statistical package STATA 16 to carry out all descriptive and econometric analyses.
3. Results
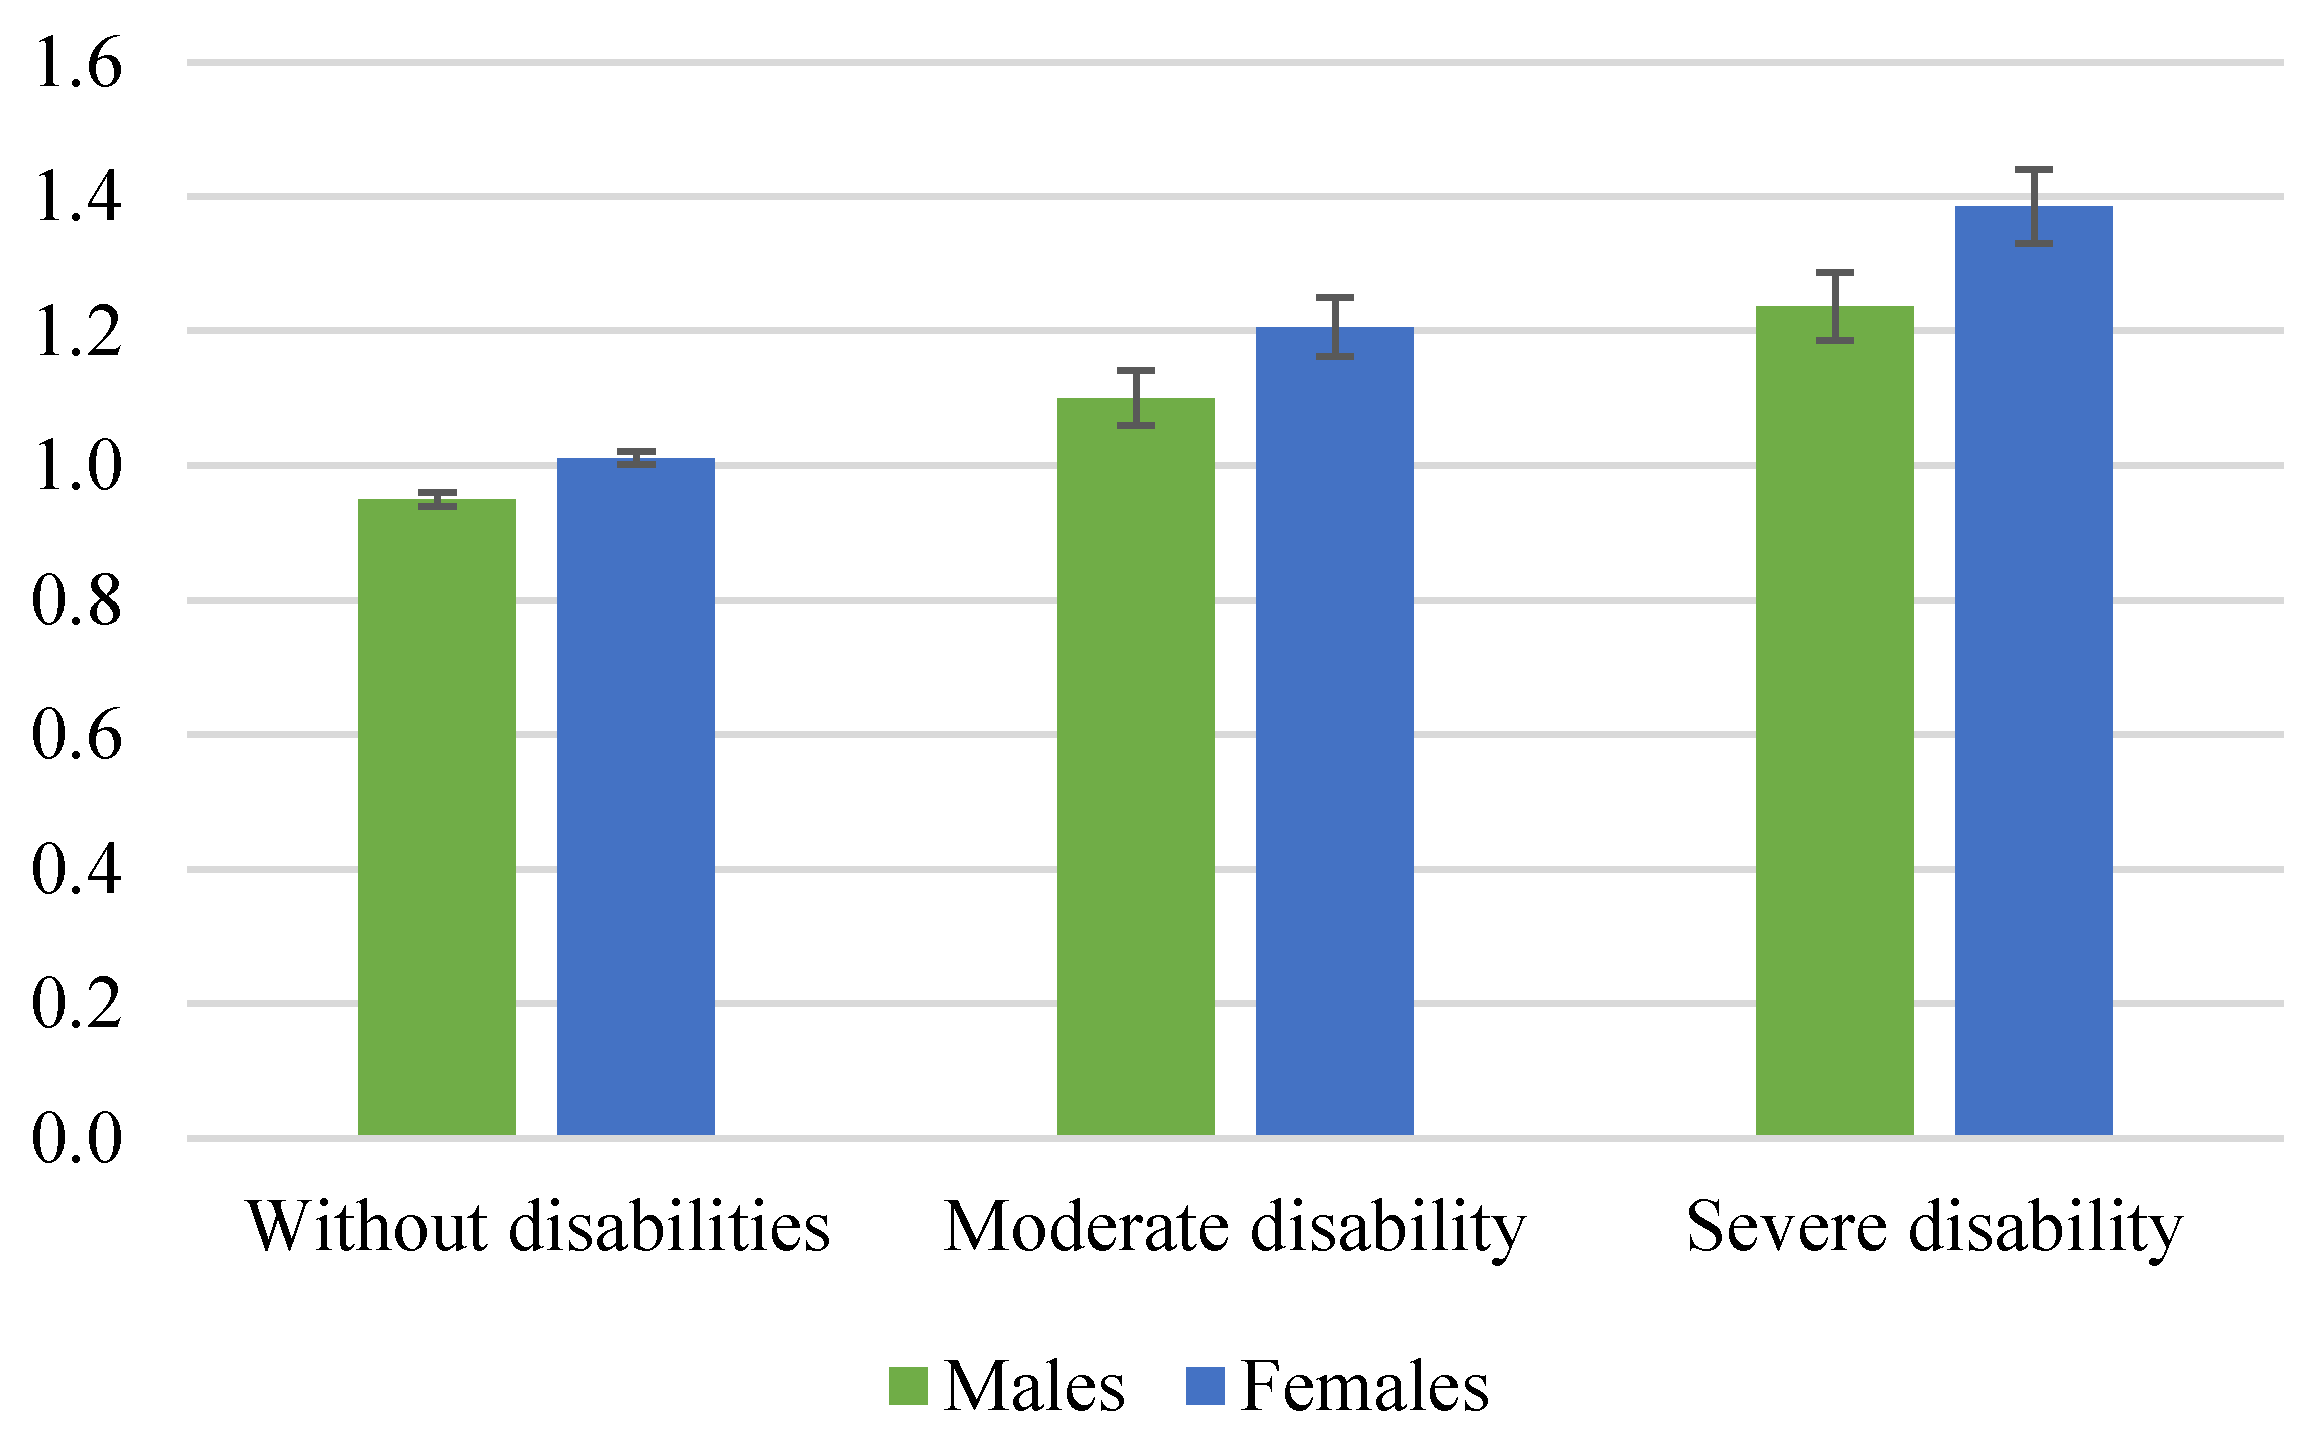
Figure 1 shows the mean loneliness scores for males and females by disability status in Germany. Overall, we found that females were more likely to report higher loneliness scores than males. For example, for males without disabilities, the mean loneliness score was 0.95 points, whereas for their female counterparts, this went up to 1.01 points (i.e., the loneliness differential was 0.06 points, which was statistically significant according to the confidence intervals (p < 0.05)). For people with moderate and severe disabilities, the gender differences in terms of loneliness were 0.106 and 0.149 points in favor of females, respectively (which again are statistically significant). Namely, the loneliness differential between males and females increases as the degree of disability severity increases. In this vein, it is worthwhile comparing the mean loneliness by disability status. Using the mean loneliness scores reported by “males without disabilities” as a reference, for males we detected that the loneliness differences were 0.151 and 0.286 points for males with moderate and severe disabilities, respectively (and statistically significant at a 95% level according to a test of means). For females, these loneliness differentials are even greater (and statistically significant) than those found for males, i.e., 0.195 and 0.375 points for females with a moderate and a severe disability, respectively. For people with disabilities (especially those with severe disabilities), the existence of low self-esteem, confidence, and social skills may contribute to limiting and inhibiting their social interactions, thus increasing their loneliness scores [47].
Looking at the existing literature on loneliness and gender, Pinquart and Sörensen [36] point out that females report greater levels of loneliness than males because they have higher risks for widowhood, living alone, chronic illness, disability, and functional limitations. Moreover, females tend to require more care in later life than males [65], and those aged 65 can live with a disability 6.9 years more than males [66]. Married females may also face a greater risk of loneliness if they take care of a spouse with a disability [41,67]. Finally, we also considered that females tend to admit and recognize their real levels of loneliness more easily than males [68]. In contrast, males have a lower social acceptance of loneliness (because of potential problems of stigmatization) than females, especially during adolescence and young adulthood [68].
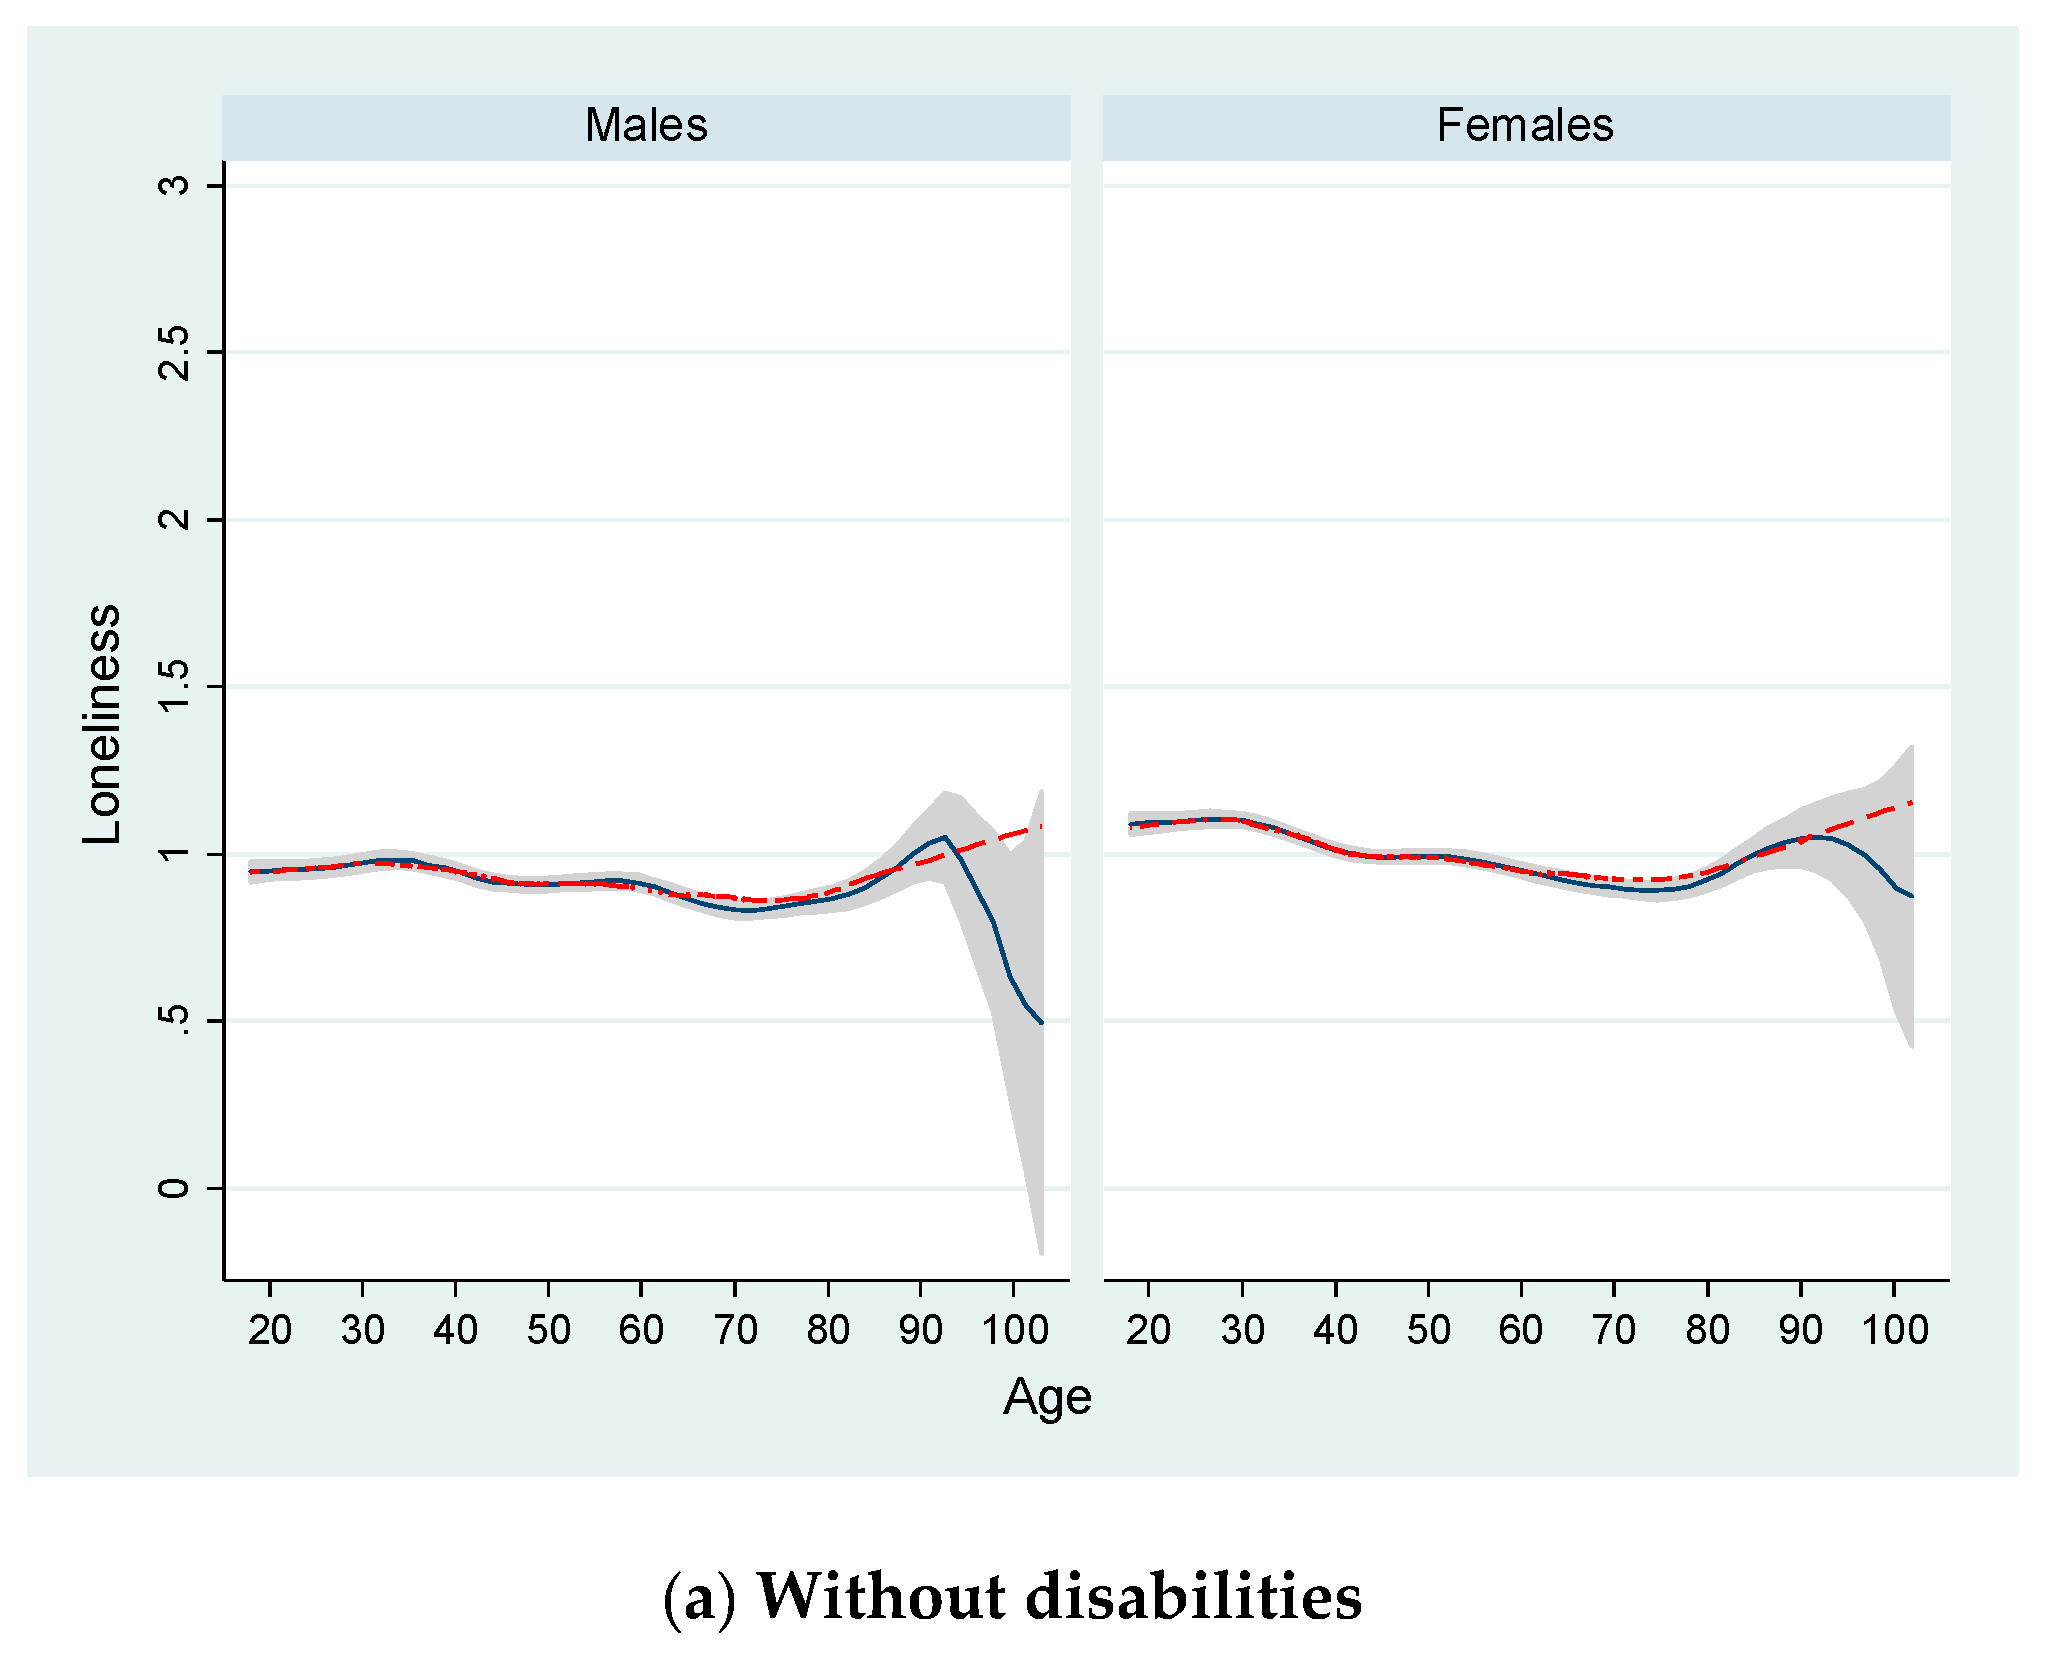
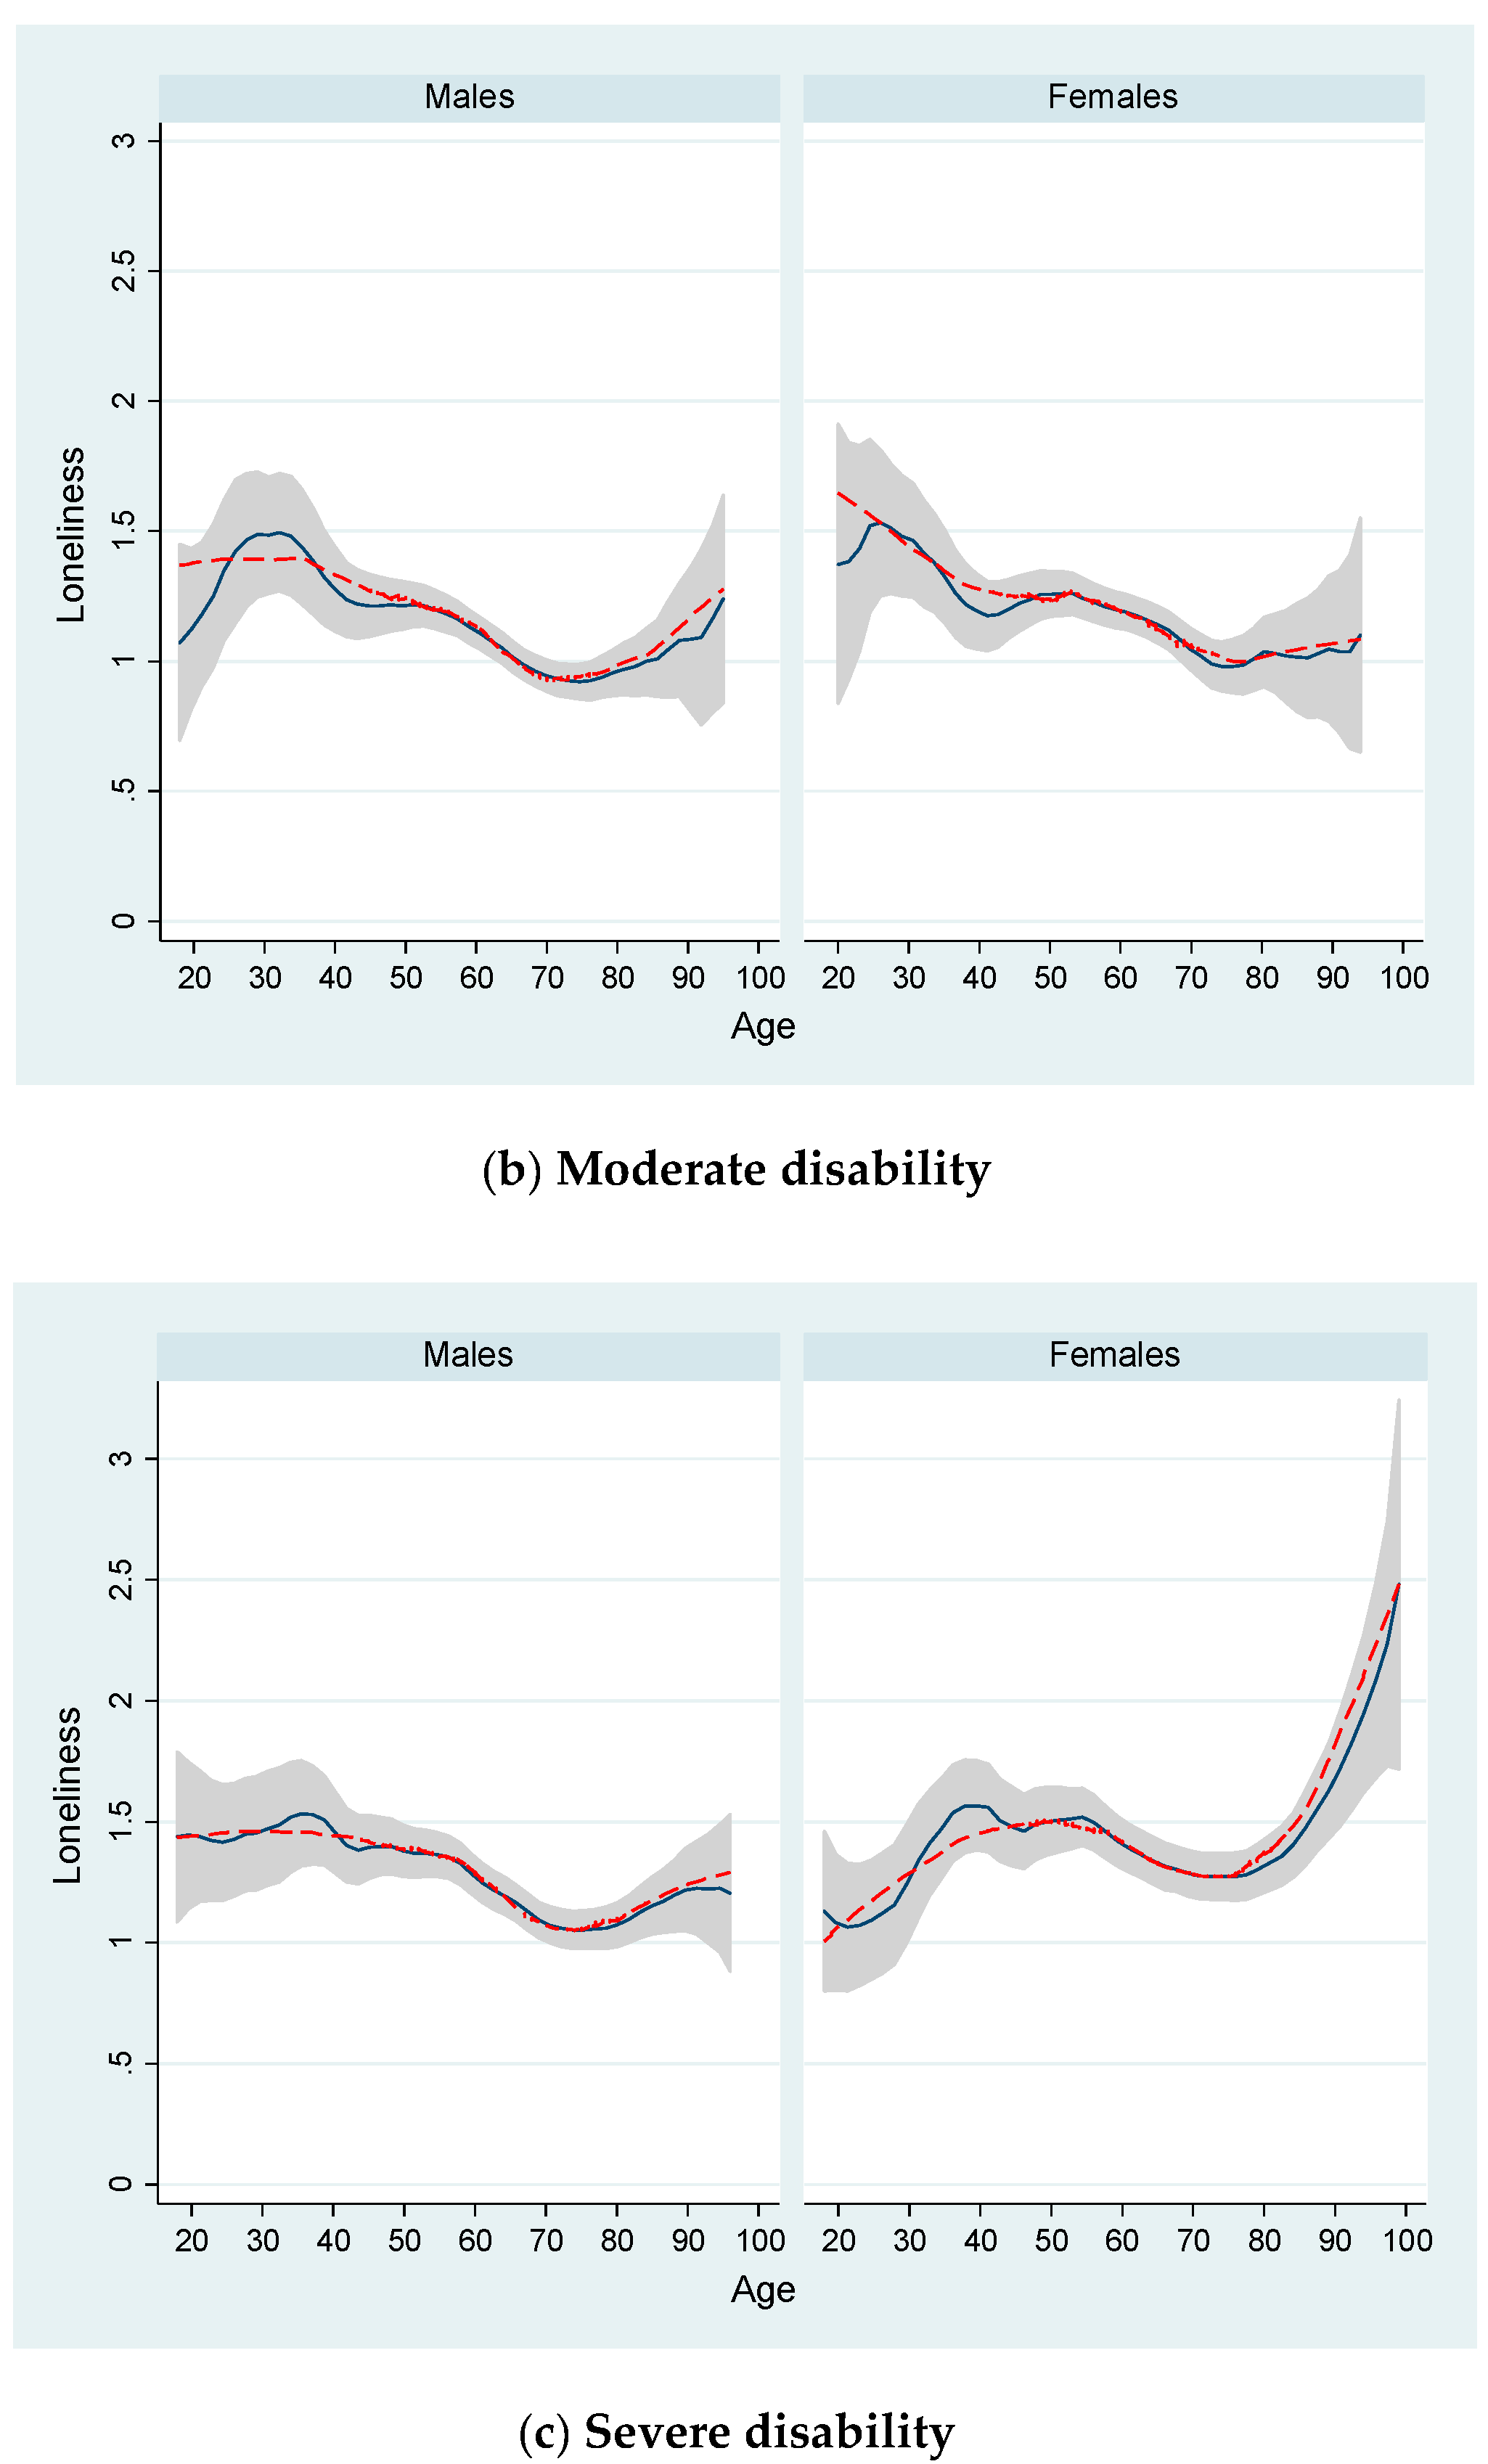
Figure 2 shows the age distribution of loneliness for males and females according to their disability status. For this purpose, and similar to Luhmann and Hawkley [23], we calculated “locally weighted scatterplot smoothing (LOWESS)” and “kernel-weighted local polynomial regression (LPOLY)” functions. These techniques allowed us to display a graph with smoothed values (and with confidence intervals when using LPOLY). For example, these smoothed LOWESS values are obtained by running a regression of yvar = “loneliness” on xvar = “age” by using only the data for (xi, yi) and a few other data points near this point. In LOWESS, the regression is weighted so that the central point (xi, yi) gets the highest weight and points that are farther away (based on the distance |xj − xi|) receive less weight [69]. In addition, LOWESS tends to follow the data (because of its locality), whereas LPOLY fits a local pth-order polynomial and is global, i.e., what happens on the extreme left of a scatterplot can affect the fitted values on the extreme [69].
For people without disabilities, we found very similar age distributions for males and females. Around the age of 30 and 35 for both females and males, we found a steady decrease in the levels of loneliness until around the age of 74. From this age onwards for both males and females, loneliness increases continuously (according to LOWESS) or reaches a peak around the age of 95 (according to LPOLY), although the size of the confidence interval is larger due to the low number of observations at those ages. Looking at the age distribution for people with a moderate disability, we found a well-defined and non-linear loneliness pattern, with a peak around the ages of 26 and 32 for females and males, respectively (according to LOWESS). There was a clear downward trend from these ages until around the ages of 70 (males) and 74 (females), which then increased uninterruptedly from this point (although at a much lower rate among females). As for people with a severe disability, we detected significant age differences in terms of loneliness between males and females. For males and according to LOWESS, we found a steady trend from the youngest ages to middle adulthood (around age 55), following a negative trend until the age of 74 and an increase from there. In contrast, and again using LOWESS as a reference, for females with severe disabilities we observed an age distribution characterized by a peak at around the age of 55 and a trough at the age of 74. Furthermore, the observed loneliness scores reported by females with severe disabilities increased at a stronger rate from this age as compared to those found for their male counterparts.
Turning to the econometric analysis, firstly Appendix A Table A1 shows the mean values and standard deviation of the explanatory variables used to estimate our loneliness regression by gender (males and females) and disability status (without disabilities, with a moderate disability, and with a severe disability). In line with other previous studies on disability, in general we found people with disabilities were older, less educated, living in households with a lower number of members and children, with lower household income, and a “relational time index” as compared to people without disabilities. These differences were even stronger when we compared people with severe disabilities to their non-disabled counterparts and those with moderate disabilities. Table 1 includes the results obtained after our loneliness model estimations, which are broken down by gender and including individual disability status as a regressor, among other factors. This table also shows the mean values and standard deviations for all explanatory variables used in the corresponding regression. Overall, our regression results corroborate the need to take into account the individual’s degree of disability in this type of study. For the male sample, we found that the coefficients on “moderate disability” and “severe disability” were positive and statistically significant at the 5% level as compared to the reference category (i.e., people without disabilities). In addition, the magnitude of the coefficient for “severe disability” was greater than that found for “moderate disability” (0.237 versus 0.150 points). For the female sample, we obtained the same outcome, but the magnitude of the coefficient for “severe disability” was double that of the magnitude of the coefficient for “moderate disability” (0.343 versus 0.174 points). These results are consistent with other previous empirical studies on loneliness [38,40,47,70]. Looking at the mean values, we found slightly lower percentages for females with moderate and severe disabilities compared to those found for their male counterparts.
To better fit the loneliness distribution by age shown in Figure 2 (with peaks and dips), we included in our model a functional form for age based on a cubic polynomial. For males and females, we found positive and significant coefficients for “age” and “age3/1000)”, and a negative and significant coefficient for “age2”. Namely, we found higher loneliness scores during adolescence or early adulthood, followed by a decrease across middle adulthood, and once again an increase at older ages, consistent with other existing studies [23]. We also found that those individuals with higher levels of education and household income, having a German nationality, existence of children living in the same household, and having a full-time or part-time job were more likely to report lower loneliness scores as compared to the reference person. In contrast, being single (in particular among males) or living without the partner within the same household contributed to increasing loneliness. Similar to other previous studies [39,71,72,73,74], we found that the higher the “relational time index” (i.e., the frequency of contacts with family members, friends, and neighbors; use of online social networks; frequency of participation in volunteering, sports, cultural activities, and religious events), the lower the loneliness score is. In addition, we found that the effect of this variable on loneliness is stronger for females as compared to that found for males (−0.117 versus −0.059 points).
Finally, Table 2 shows the econometric results after re-estimating our loneliness model for four different age groups: 16–29 years (young people), 30–49 (lower-middle-aged people), 50–65 (higher-middle-aged people), and 65+ (older people). Although these specific age groups may seem somewhat arbitrary, Luhmann and Hawkley [23] pointed out that this classification approach allows consideration of development stages and may provide comparable results to those found in previous studies [26,53,54]. In our case, we additionally divided the second age group (30 to 65 years) defined by Luhmann and Hawkley [23] into two subgroups (30–49 and 50–65 years) in order to reflect the age distributions shown in Figure 2 in a better way (and similar to Nicolaisen and Thorsen [50]), especially for those individuals with severe disabilities. Table 2 shows the strength of the relationships between the variable degree of disability (and others) and the sense of loneliness for several age groups and gender groups. Namely, the strengths of these relationships amongst these groups were different. For example, for males aged 16–29 the magnitude of the coefficient for “moderate disability” was 0.222 points (and the mean value for the variable “loneliness” equaled 1.208) as compared to the reference category (i.e., without disabilities), which was a relatively greater value than those found for the other age groups (e.g., 0.084 points people aged 66 or older, and a mean value for “loneliness” equaling 0.929). Although this pattern was also found for females with moderate disabilities, the magnitudes of the coefficients were greater (according to a test of equality of coefficients) than those found for males with moderate disabilities for the younger (0.422 versus 0.222 points) and older groups (0.128 versus 0.084 points). These findings are in line with previous general population studies [75].
For people with severe disabilities, we detected differing effects of disability on loneliness by gender for each age group. For males, once again we found that loneliness was more prevalent in younger ages (the coefficient was 0.508 points and was significant at 5% with respect to the reference category) and decreased with age, with males aged 66 or over reporting the lowest loneliness scores (the coefficient was 0.179 points). In contrast, we found opposite results for females with severe disabilities, i.e., age correlated positively and significantly with loneliness. For example, the coefficient for “severe disability” for the oldest group was 0.38 points, whereas for the youngest one it was negative but not significant at conventional levels as compared to the reference category (−0.092 points). Furthermore, in general we found greater coefficients for females than males for “severe disability” in all age groups, except the youngest group (16–29 years).
According to the literature on loneliness, in general these differences by age between males and females can be explained by a set of developmental and socio-cultural mechanisms [26]. For example, young people are more aware of individual differences and may experience higher loneliness scores because they are more susceptible to experiencing instability from social networks, peer exclusion and victimization, physical and personality changes, family tensions, individualism, and unfulfilled expectations [76,77,78,79]. These factors may be even more relevant among adolescents with disabilities due to the fact that they are more likely to experience social exclusion, bullying, discrimination, lower educational and recreational opportunities, stigmatization, and marginalization than their non-disabled counterparts [80,81,82,83]. These factors highlight in the existing literature may partly explain our results found for males with moderate or severe disabilities and females with moderate disabilities located in the youngest age group (16–29 years).
Looking at middle-aged adults, work status, income, divorce, and caregiving responsibilities were mentioned as main predictors of loneliness [23]. In our case, all regressions for each age group shown in Table 2 included employment status and household income (not reported but available upon request), among other covariates. Consistent with Luhmann and Hawkley [23], we found a significant effect of household income on loneliness for all age groups, but this effect was stronger for middle-aged males and females (30–49 and 50–65). Examining employment status, we found a similar outcome, and with a high percentage of middle-aged adults having a full or part time job (e.g., 89.1 and 70.1% of males and females aged 30–49 were employed, respectively). According to Luhmann and Hawkley [23], income and employment status contribute to protecting one against loneliness, with mid-adulthood being a period wherein “making, investing, and saving money are more important life goals than during early or late adulthood (p. 955)”.
Finally, older people are more vulnerable to suffering from losses of their spouse, family, friends, social status, and poorer health conditions [84,85,86,87]. These losses may lead older people to experience episodes of anxiety and fear and be more vulnerable to loneliness [88]. According to our results, this vulnerability to loneliness is especially relevant for females with severe disabilities aged 66 or over. As reported by Dahlberg et al. [89], there are important gender differences in the prevalence and predictors of loneliness at older ages. They found that mobility problems and mobility reductions were strong predictors of loneliness, but only among females. In our case, we can assume that older females with severe disabilities are more likely to suffer from these mobility problems and other health limitations as compared to younger females. For example, Perissinotto et al. [32] found a 78% higher risk of experiencing limited physical ability among lonely adults aged 60 years or over. These mobility problems can become important limitations and obstacles to participating in leisure activities and maintaining social contacts, and thereby reporting higher loneliness scores [39,57,90]. This reduction in leisure and social activities is compensated for by more time devoted to more frequent contacts with healthcare providers [91]. However, in our case this limitation in health outcomes seems to be less painful in terms of loneliness among males with severe disabilities at older ages. In contrast, Dahlberg et al. [89] also found that only for males do the level of social contacts and social contact reduction predict loneliness. In our case, the frequency of social contacts with family members, friends, neighbors, and use of social online network was captured by the variable “relational time index” (with a negative and significant coefficient, as shown in Table 1). In any case, we have to bear in mind that “loneliness is not only a health issue among older adults but also among middle-aged adults … and might be related to their specific life phases and the reduction of social networks as they age (Jessen et al. [9], p. 1328)”.
4. Conclusions
In this study, we analyzed the gender and age differences in the levels of loneliness reported by people without and with moderate and severe disabilities in Germany. Using data from the SOEP for the years 2013 and 2017, we used a three-item UCLA Loneliness Scale and estimated OLS models of loneliness separately for males and females, which included a set of explanatory variables measuring socio-economic characteristics at individual and household levels. In addition, we re-estimated our model by breaking down the sample into four different age groups (i.e., 16–29 years, 30–49 years, 50–65 years, 65+ years) to take into account the different development stages of life and the specific effects of disability status on loneliness in each stage. The results showed that overall females were more likely than males to report higher levels of loneliness. Although similar results were also found for people without and with a moderate or severe disability, we obtained greater loneliness differentials by gender as the degree of severity increased. Consistent with the previous literature on loneliness and disability, we found that people with disabilities experienced higher levels of loneliness, in particular if the individual had a severe disability, as compared to people without disabilities. However, we identified significant gender differences in terms of loneliness between males and females with severe disabilities, with trends being much stronger for the latter. As for age, we also found clear and differing patterns by gender and disability status. We found a negative linear relationship between loneliness and age for males with moderate or severe disabilities. Namely, we found the highest levels of loneliness among males with disabilities aged 16–29, especially for those with severe limiting disabilities. A similar result was found for females with moderate disabilities. On the contrary, we found a positive relationship between loneliness and age for females with severe disabilities, i.e., those 66 or over reported the highest loneliness scores as compared to those for younger groups.
From a public policy perspective, it is important to combat and reduce loneliness among people with disabilities at the early developmental stages of life. Our results have shown that adolescents with moderate and severe disabilities (except females with severe disabilities) experience higher levels of loneliness as compared to their non-disabled counterpart. According to Maxey and Beckert [83], adolescents with disabilities have lower levels of social skills connected with their disability, which makes it more difficult to establish and keep meaningful connections with other developing peers. For those adolescents with severe disabilities, the situation is even worse, because social interactions among peers and friendship reciprocation are rare or almost null for this population group [92]. Looking at the middle-aged and older adults, our results have shown a significant gender differential at these ages. For example, females aged 66 or over report higher levels of loneliness than their male counterparts. Widowhood, living alone, chronic illness, disability, and functional limitations among older females have been pointed out by the existing literature as the main predictors of loneliness to explain these results. Overall, we have to take into account that individuals in different age groups may also experience loneliness differently, with different impacts of the factors associated with loneliness [50], and each group may require different public interventions [93]. Once again, we have to increase our knowledge on the differences in loneliness scores by gender in order to design and develop public targeted interventions to reduce and prevent loneliness in each case (and also age group). Accessibility has become a crucial and major issue among people with disabilities, wherein the existence of “enabling” environments is a key element to promote and improve their participation into society. Barriers in schools, work environments, physical and built environments, within institutional and government policies, and services and assistance have been traditionally pointed out by the existing literature, and contribute to reducing social interactions and increasing loneliness among people with disabilities. For instance, there still exist many barriers (i.e., physical, attitudinal, and environmental) that limit full access of people with disabilities to leisure environments [94]. In this vein, Pagan [95] found that the participation in the leisure events “social gatherings” and “cultural events” has the strongest effect on the level of life satisfaction reported by people with disabilities, and concluded that it is necessary to create inclusive leisure environments that increase social acceptance and boost their physical and emotional health.
Apart from taking into consideration the gender differences detected in our study in terms of loneliness, the type and degree of disability (as our results show for moderate and severe disabilities) must also be taken into consideration by policy makers, governments, healthcare providers, and disability organizations to reduce the levels of loneliness reported by people with disabilities. In our case, an important limitation of this study is the lack of information in the SOEP data on the type of disability that an individual has. For example, we might expect higher levels of loneliness for those individuals who have intellectual disabilities (e.g., Down syndrome, developmental delay, and Fragile X syndrome) as compared to those with physical disabilities (hearing loss, speech problems, and vision impairments). The availability of new datasets that include this type of information allows us to measure, compare, and take different actions according to the type of disability that each individual has. As for potential future areas of research, we could explore the effects of disability among adolescents on the levels of loneliness reported by their parents or other persons living in the same household. It would also be of interest to carry out some longitudinal analyses (using two or more waves) of loneliness in order to identity different disability trajectories over time, and their impacts on loneliness. However, one of the main concerns in analyzing the particular situations relating to various disability groups is the size of the available sample use to construct loneliness and disability measures. In datasets for the whole population, the sample sizes for people with disabilities are traditionally low, whereas in those datasets aimed at examining the specific situation of people with disabilities, the sample sizes are greater. However, these datasets are less frequent, and in many cases quite old. Finally, additional studies on participation in leisure activities among people with disabilities would be very useful in order to understand the main determinants of their levels of loneliness by age, type of disability, and intensity of participation.
Funding
This research received no external funding.
Conflicts of Interest
The author declares no conflict of interest.
Appendix A

Table A1.
Mean values and standard deviations (between parentheses) of explanatory variables used in Table 1 by disability status and gender.
Table A1.
Mean values and standard deviations (between parentheses) of explanatory variables used in Table 1 by disability status and gender.
| Without Disabilities | Moderate Disability | Severe Disability | ||||
|---|---|---|---|---|---|---|
| Males | Females | Males | Females | Males | Females | |
| Age | 49.90 (16.99) | 49.58 (16.73) | 61.21 (12.40) | 59.16 (11.88) | 64.65 (14.17) | 64.89 (14.05) |
| Age2/1000 | 2.78 (1.75) | 2.74 (1.74) | 3.90 (1.46) | 3.64 (1.38) | 4.38 (1.75) | 4.41 (1.75) |
| Age3/1000 | 167.9 (150.4) | 164.4 (151.1) | 256.6 (137.6) | 231.5 (128.3) | 307.6 (173.9) | 310.2 (175.4) |
| Years of education | 12.72 (2.85) | 12.48 (2.73) | 11.79 (2.38) | 11.93 (2.50) | 11.80 (2.51) | 11.30 (2.32) |
| Marital status: | ||||||
| Single | 0.17 | 0.13 | 0.07 | 0.08 | 0.11 | 0.09 |
| Living without partner | 0.08 | 0.17 | 0.13 | 0.25 | 0.16 | 0.34 |
| Living with partner | 0.75 | 0.69 | 0.80 | 0.67 | 0.73 | 0.57 |
| Existence children in household | 0.59 | 0.65 | 0.22 | 0.20 | 0.17 | 0.13 |
| Household size | 2.77 (1.36) | 2.72 (1.35) | 2.25 (0.98) | 2.12 (0.99) | 2.15 (1.03) | 1.91 (0.92) |
| German | 0.92 | 0.91 | 0.95 | 0.97 | 0.95 | 0.97 |
| Log (real household income) | 5.44 (0.55) | 5.35 (0.55) | 5.33 (0.49) | 5.27 (0.53) | 5.25 (0.50) | 5.18 (0.53) |
| Employment status: | ||||||
| Full-time | 0.60 | 0.27 | 0.32 | 0.16 | 0.13 | 0.06 |
| Part-time | 0.04 | 0.26 | 0.04 | 0.16 | 0.03 | 0.06 |
| Non-working | 0.36 | 0.47 | 0.64 | 0.67 | 0.85 | 0.88 |
| Relational Time Index (RTI) | 1.52 (0.56) | 1.54 (0.55) | 1.41 (0.57) | 1.49 (0.57) | 1.27 (0.57) | 1.34 (0.60) |
| Region of residence: | ||||||
| Schleswig-Holstein | 0.05 | 0.05 | 0.04 | 0.05 | 0.05 | 0.06 |
| Hamburg | 0.02 | 0.02 | 0.01 | 0.01 | 0.02 | 0.02 |
| Lower Saxony | 0.10 | 0.10 | 0.10 | 0.09 | 0.10 | 0.09 |
| Bremen | 0.01 | 0.01 | 0.00 | 0.00 | 0.00 | 0.01 |
| North-Rhine-Westfalia | 0.20 | 0.20 | 0.22 | 0.21 | 0.22 | 0.23 |
| Hessen | 0.07 | 0.07 | 0.08 | 0.06 | 0.07 | 0.07 |
| Rheinland-Pfalz | 0.05 | 0.05 | 0.05 | 0.05 | 0.04 | 0.04 |
| Baden-Wuerttemberg | 0.12 | 0.12 | 0.09 | 0.10 | 0.11 | 0.12 |
| Bavaria | 0.16 | 0.16 | 0.16 | 0.14 | 0.14 | 0.14 |
| Saarland | 0.01 | 0.01 | 0.01 | 0.01 | 0.01 | 0.01 |
| Berlin | 0.04 | 0.04 | 0.04 | 0.06 | 0.05 | 0.04 |
| Brandenburg | 0.04 | 0.04 | 0.03 | 0.04 | 0.05 | 0.06 |
| Mecklenburg-Vorpommern | 0.02 | 0.02 | 0.03 | 0.03 | 0.02 | 0.03 |
| Saxony | 0.07 | 0.07 | 0.06 | 0.06 | 0.06 | 0.05 |
| Saxony-Anhalt | 0.04 | 0.04 | 0.03 | 0.03 | 0.03 | 0.02 |
| Thuringia | 0.04 | 0.04 | 0.04 | 0.04 | 0.05 | 0.05 |
| Year of interview: | ||||||
| 2013 | 0.41 | 0.41 | 0.48 | 0.44 | 0.49 | 0.48 |
| 2017 | 0.59 | 0.59 | 0.52 | 0.56 | 0.51 | 0.52 |
| Number of observations | 17,110 | 20,269 | 1401 | 1377 | 1252 | 1160 |
References
- Russell, D.; Peplau, L.; Ferguson, M. Developing a measure of loneliness. J. Personal. Assess. 1978, 42, 290–294. [Google Scholar] [CrossRef] [PubMed]
- Rubenstein, C.; Shaver, P. Loneliness in two northeastern cities. In The Anatomy of Loneliness; Hartog, J., Audy, R., Cohen, Y.A., Eds.; International Universities Press: New York, NY, USA, 1980. [Google Scholar]
- Newall, N.; Chipperfield, J.; Clifton, R.; Perry, R.; Swift, A. Causal beliefs, social participation, and loneliness among older adults: A longitudinal study. J. Soc. Pers. Relatsh. 2009, 26, 273–290. [Google Scholar] [CrossRef]
- Kearns, A.; Whitley, E.; Tannahill, C.; Ellaway, A. Loneliness, social relations and health and well-being in deprived communities. Psychol. Health Med. 2015, 20, 332–344. [Google Scholar] [CrossRef] [PubMed]
- Phillips, D. Social Participation and Happiness. Am. J. Sociol. 1967, 72, 479–483. [Google Scholar] [CrossRef]
- Graney, M. Happiness and Social Participation in Aging. J. Gerontol. 1975, 30, 701–706. [Google Scholar] [CrossRef]
- Peplau, L. Loneliness Research: Basic Concepts and Findings. In Social Support: Theory, Research and Applications; Sarason, I.G., Sarason, B.R., Eds.; NATO ASI Series (D: Behavioural and Social Sciences); Springer: Dordrecht, The Netherlands, 1985; Volume 24, pp. 269–286. [Google Scholar]
- Saygin, Y.; Akdeniz, S.; Deniz, M. Loneliness and interpersonal problem solving as predictors of subjective wellbeing. Int. J. Inf. Educ. Technol. 2015, 5, 32–35. [Google Scholar]
- Jessen, M.; Pallesen, A.; Kriegbaum, M.; Kristiansen, M. The association between loneliness and health—A survey-based study among middle-aged and older adults in Denmark. Aging Ment. Health 2018, 22, 1338–1343. [Google Scholar] [CrossRef]
- Peplau, L.; Perlman, D. Loneliness: A Sourcebook of Current Theory, Research and Therapy; Wiley: New York, NY, USA, 1982. [Google Scholar]
- Perlman, D.; Peplau, L. Loneliness research: A survey of empirical findings. In Preventing the Harmful Consequences of Severe and Persistent Loneliness; Peplau, L.A., Goldston, S.E., Eds.; DHHS publication no. ADM 84-112; US Government Printing Office: Washington, DC, USA, 1984; pp. 13–46. [Google Scholar]
- Cacioppo, S.; Grippo, A.; London, S.; Goossens, L.; Cacioppo, J. Loneliness: Clinical import and interventions. Perspect. Psychol. Sci. 2015, 10, 238–249. [Google Scholar] [CrossRef] [Green Version]
- Shiovitz-Ezra, S.; Shemesh, J.; McDonnell, M. Pathways from Ageism to Loneliness. In Contemporary Perspectives on Ageism; Ayalon, L., Tesch-Römer, C., Eds.; International Perspectives on Aging; Springer: Cham, Switzerland, 2018; Volume 19, pp. 131–147. [Google Scholar]
- Wenz, F. Seasonal suicide attempts and forms of loneliness. Psychol. Rep. 1977, 40, 807–810. [Google Scholar] [CrossRef]
- Sadava, S.; Thompson, M. Loneliness, social drinking, and vulnerability to alcohol problems. Can. J. Behav. Sci. 1986, 18, 133–139. [Google Scholar] [CrossRef]
- Canham, S.; Mauro, P.; Kaufmann, C.; Sixsmith, A. Association of alcohol use and loneliness frequency among middle-aged and older adult drinkers. J. Aging Health 2016, 28, 268–284. [Google Scholar] [CrossRef] [PubMed] [Green Version]
- Niu, L.; Jia, C.; Ma, Z.; Wang, G.; Yu, Z.; Zhou, L. The validity of proxy-based data on loneliness in suicide research: A case-control psychological autopsy study in rural China. BMC Psychiatry 2018, 18, 116. [Google Scholar] [CrossRef] [PubMed] [Green Version]
- Copel, L. Loneliness. J. Psychosoc. Nurs. 1988, 26, 14–19. [Google Scholar]
- Akerlind, I.; Hornquist, J. Loneliness and alcohol abuse: A review of evidence of an interplay. Soc. Sci. Med. 1992, 34, 405–414. [Google Scholar] [CrossRef]
- Allen, R.; Oshagan, H. The UCLA loneliness scale: Invariance of social structural characteristics. Personal. Individ. Differ. 1995, 19, 185–195. [Google Scholar] [CrossRef]
- Alpass, F.; Neville, S. Loneliness, health and depression in older males. Aging Ment. Health 2003, 7, 212–216. [Google Scholar] [CrossRef]
- Yang, K.; Victor, C. Age and loneliness in 25 European nations. Ageing Soc. 2011, 31, 368–1388. [Google Scholar] [CrossRef]
- Luhmann, M.; Hawkley, L. Age differences in loneliness from late adolescence to oldest old age. Dev. Psychol. 2016, 52, 943–959. [Google Scholar] [CrossRef]
- Maes, M.; Qualter, P.; Vanhalst, J.; Van den Noortgate, W.; Goossens, L. Gender differences in loneliness across the lifespan: A meta-analysis. Eur. J. Personal. 2019, 33, 642–654. [Google Scholar] [CrossRef]
- Mund, M.; Neyer, F. Loneliness effects on personality. Int. J. Behav. Dev. 2020, in press. [Google Scholar] [CrossRef]
- Barreto, M.; Victor, M.; Hammond, C.; Eccles, A.; Richins, M.; Qualter, P. Loneliness around the world: Age, gender, and cultural differences in loneliness. Personal. Individ. Prefer. 2020, in press. [Google Scholar] [CrossRef]
- Cacioppo, J.; Hughes, M.; Waite, L.; Hawkley, L.; Thisted, R. Loneliness as a specific risk factor for depressive symptoms: Cross-sectional and longitudinal analyses. Psychol. Aging 2006, 21, 140–151. [Google Scholar] [CrossRef] [PubMed]
- Cohen-Mansfield, J.; Shmotkin, D.; Goldberg, S. Loneliness in old age: Longitudinal changes and their determinants in an Israeli sample. Int. Psychogeriatr. 2009, 21, 1160–1170. [Google Scholar] [CrossRef] [PubMed]
- Hawkley, L.; Cacioppo, J. Loneliness matters: A theoretical and empirical review of consequences and mechanisms. Ann. Behav. Med. 2010, 40, 218–227. [Google Scholar] [CrossRef] [Green Version]
- Heikkinen, R.; Kauppinen, M. Mental well-being: A 16-year follow-up among older residents in Jyvaskyla. Arch. Gerontol. Geriatr. 2011, 52, 33–39. [Google Scholar] [CrossRef]
- Luo, Y.; Hawkley, L.; Waite, L.; Cacioppo, J. Loneliness, health, and mortality in old age: A national longitudinal study. Soc. Sci. Med. 2012, 74, 907–914. [Google Scholar] [CrossRef] [Green Version]
- Perissinotto, C.; Stijacic, I.; Covinsky, K. Loneliness in older persons: A predictor of functional decline and death. Arch. Intern. Med. 2012, 172, 1078–1084. [Google Scholar] [CrossRef] [Green Version]
- McHugh, J.; Brian, A. Executive functioning independently predicts self-rated health and improvement in self-rated health over time among community-dwelling older adults. Aging Ment. Health 2016, 20, 415–422. [Google Scholar] [CrossRef] [Green Version]
- Valtorta, N.; Kanaan, M.; Gilbody, S.; Ronzi, S.; Hanratty, B. Loneliness and social isolation as risk factors for coronary heart disease and stroke: Systematic review and meta-analysis of longitudinal observational studies. Heart 2016, 102, 1009–1016. [Google Scholar] [CrossRef] [Green Version]
- Verbrugge, L.; Jette, A. The disablement process. Soc. Sci. Med. 1994, 38, 1–14. [Google Scholar] [CrossRef] [Green Version]
- Pinquart, M.; Sörensen, S. Gender differences in self-concept and psychological well-being in old age: A meta-analysis. J. Gerontol. Ser. B Psychol. Sci. Soc. Sci. 2001, 56, P195–P213. [Google Scholar] [CrossRef] [PubMed]
- Hacihasanoglu, R.; Yildirim, A.; Karakurt, P. Loneliness in elderly individuals, level of dependence in activities of daily living (ADL) and influential factors. Arch. Gerontol. Geriatr. 2012, 54, 61–66. [Google Scholar] [CrossRef] [PubMed]
- Pagan, R. How important are holiday trips in preventing loneliness? Evidence for people without and with self-reported moderate and severe disabilities. Curr. Issues Tour. 2020, 23, 1394–1406. [Google Scholar] [CrossRef]
- Pagan, R. Leisure activities and loneliness among people with disabilities. In Handbook of Sustainable Development and Leisure Services; Lubowiecki-Vikuk, A., de Sousa, B.M.B., Derčan, B., Leal-Filho, W., Eds.; World Sustainability Series; Springer: Basel, Switzerland, 2020; ISBN 978-3-030-59819-8. [Google Scholar]
- Paul, C.; Ayis, S.; Ebrahim, S. Psychological distress, loneliness and disability in old age. Psychol. Health Med. 2006, 11, 221–232. [Google Scholar] [CrossRef]
- Korporaal, M.; van Groenou, B.; van Tilburg, T. Effects of own and spousal disability on loneliness among older adults. J. Aging Health 2008, 20, 306–325. [Google Scholar] [CrossRef]
- Hall, S. The social inclusion of people with disabilities: A qualitative meta-analysis. J. Ethnogr. Qual. Res. 2009, 3, 162–173. [Google Scholar]
- Leveille, S.; Resnick, H.; Balfour, J. Gender differences in disability: Evidence and underlying reasons. Aging 2000, 12, 106–112. [Google Scholar] [CrossRef]
- Russell, D. UCLA loneliness Scale (Version 3): Reliability, validity, and factor structure. J. Personal. Assess. 1996, 66, 20–40. [Google Scholar] [CrossRef]
- Hughes, M.; Waite, L.; Hawkley, L.; Cacioppo, J. A short scale for measuring loneliness in large surveys: Results from two population-based studies. Res. Aging 2004, 26, 655–672. [Google Scholar] [CrossRef]
- Hawkley, L.; Duvoisin, R.; Ackva, J.; Murdoch, J.; Luhmann, M. Loneliness in Older Adults in the USA and Germany: Measurement Invariance and Validation; Working Paper Series; NORC at the University of Chicago: Boston, MA, USA, 2015. [Google Scholar]
- Macdonald, J.; Deacon, L.; Nixon, J.; Akintola, A.; Gillingham, A.; Kent, J.; Ellis, G.; Mathews, D.; Ismail, A.; Sullivan, S.; et al. The invisible enemy: Disability, loneliness and isolation. Disabil. Soc. 2018, 33, 1138–1159. [Google Scholar] [CrossRef]
- Guilcher, S.; Craven, C.; Basset-Gunter, R.; Cimino, S.; Hitzig, S. An examination of objective social disconnectedness and perceived social isolation among persons with spinal cord injury/dysfunction: A descriptive cross-sectional study. Disabil. Rehabil. 2019. [Google Scholar] [CrossRef] [PubMed]
- Koenig, L.; Abrams, R. Adolescent loneliness and adjustment: A focus on gender differences. In Loneliness in Childhood and Adolescence; Rotenberg, K.J., Hymel, S., Eds.; Cambridge University Press: New York, NY, USA, 1999; pp. 296–322. [Google Scholar]
- Nicolaisen, M.; Thorsen, K. Who are lonely? Loneliness in different age groups (18–81 years old), using two measures of loneliness. Int. J. Aging Hum. Dev. 2014, 78, 229–257. [Google Scholar] [CrossRef] [PubMed]
- Romero, L.; Epkins, C. Girls’ cognitions of hypothetical friends: Are they related to depression, loneliness, social anxiety and perceived similarity? J. Soc. Pers. Relatsh. 2008, 25, 311–332. [Google Scholar] [CrossRef]
- Vanhalst, J.; Klimstra, T.; Luyckx, K.; Scholte, R.; Engels, R.; Goossens, L. The interplay of loneliness and depressive symptoms across adolescence: Exploring the role of personality traits. J. Youth Adolesc. 2012, 41, 776–787. [Google Scholar] [CrossRef] [PubMed]
- Victor, C.; Yang, K. The prevalence of loneliness among adults: A case study of the United Kingdom. J. Psychol. 2012, 146, 85–104. [Google Scholar] [CrossRef] [PubMed]
- Lasgaard, M.; Friis, K.; Shevlin, M. ‘‘Where are all the lonely people?’’ A population-based study of high-risk groups across the life span. Soc. Psychiatry Psychiatr. Epidemiol. 2016, 51, 1373–1384. [Google Scholar] [CrossRef] [PubMed]
- Wagner, G.; Frick, J.; Schupp, J. The German Socio-Economic Panel Study (SOEP) –Scope, Evolution and Enhancements, Schmollers Jahrbuch. J. Appl. Soc. Sci. Stud. 2007, 127, 139–169. [Google Scholar]
- Goebel, J.; Grabka, M.; Liebig, S.; Kroh, M.; Richter, D.; Schröder, C.; Schupp, J. The German socio-economic panel (SOEP). Jahrbücher Natl. Stat. 2018, 239, 345–360. [Google Scholar] [CrossRef] [Green Version]
- Pikhartova, J.; Bowling, A.; Victor, C. Is loneliness in later life a self-fulfilling prophecy? Aging Ment. Health 2016, 20, 543–549. [Google Scholar] [CrossRef] [Green Version]
- Hawkley, L.; Kocherginsky, M. Transitions in loneliness among older adults: A 5-year follow-up in the national social life, health, and aging project. Res. Aging 2018, 40, 365–387. [Google Scholar] [CrossRef]
- Balandin, S. Assessing the loneliness of older people with cerebral palsy. Disabil. Rehabil. 2006, 28, 469–479. [Google Scholar] [CrossRef] [PubMed]
- Hsieh, N.; Hawkley, L. Loneliness in the older adult marriage: Associations with dyadic aversion, indifference, and ambivalence. J. Soc. Pers. Relat. 2018, 35, 1319–1338. [Google Scholar] [CrossRef] [PubMed]
- Gannon, B. A dynamic analysis of disability and labour force participation in Ireland 1995–2000. Health Econ. 2005, 14, 925–938. [Google Scholar] [CrossRef]
- Gannon, B.; Munley, M. Age and disability: Explaining the wage differential. Soc. Sci. Med. 2009, 69, 47–55. [Google Scholar] [CrossRef] [PubMed]
- Nolan, B.; Watson, D.; Williams, J.; Noonan, P.; O’Connor, A.; Browne, J. Designing and Piloting an Irish Disability Research Instrument Based on WHO ICF; National Disability Authority: Dublin, Ireland, 2003. [Google Scholar]
- Becchetti, L.; Pelloni, A.; Rossetti, F. Relational goods, sociability and happiness. Kyklos 2008, 61, 343–363. [Google Scholar] [CrossRef] [Green Version]
- Hobbs, F.; Damon, B. 65+ in the United States; U.S. Government Printing Office: Washington, DC, USA, 1996.
- Katz, S.; Branch, L.; Branson, M.; Papisdero, J.; Beck, J.; Greer, D. Active life expectancy. N. Engl. J. Med. 1983, 309, 1218–1224. [Google Scholar] [CrossRef]
- Owen, S.; Diehl, M.; Blake, C.; Perkowski, P.; Williams, J. Effects of age, sex, and self-concept clarity on older adults’ psychological well-being. In Proceedings of the 51st Scientific Meeting of the Gerontological Society of America, Philadelphia, PA, USA, 20–24 November 1998. [Google Scholar]
- Borys, S.; Perlman, D. Gender differences in loneliness. Personal. Soc. Psychol. Bull. 1985, 11, 63–75. [Google Scholar] [CrossRef]
- STATA. User´s Guide; Stata Press: College Station, TX, USA, 2016. [Google Scholar]
- Gascon, H. Self-esteem and loneliness in adults with mild intellectual disabilities working in sheltered workshops versus a regular work environment. Br. J. Dev. Disabil. 2009, 55, 145–155. [Google Scholar] [CrossRef]
- Mullins, L.; Johnson, P.; Anderson, L. Loneliness of the Elderly: Impact of family and friends. J. Soc. Behav. Personal. 1987, 2, 225–238. [Google Scholar]
- Drennan, J.; Treacy, M.; Butler, M.; Byrne, A.; Fealy, G.; Frazer, K.; Irving, K. The experience of social and emotional loneliness of older people in Ireland. Ageing Soc. 2008, 28, 1113–1132. [Google Scholar] [CrossRef] [Green Version]
- Shankar, A.; McMunn, A.; Demakakos, P.; Hamer, M.; Steptoe, A. Social isolation and loneliness: Prospective associations with functional status in older adults. Health Psychol. 2017, 36, 179–187. [Google Scholar] [CrossRef] [PubMed] [Green Version]
- The, T.; Tey, N. Effects of selected leisure activities on preventing loneliness among older Chinese. SSM Popul. Health 2019, 9, 1–8. [Google Scholar]
- Schultz, N.; Moore, D. Loneliness: Differenced across three age levels. J. Soc. Personal. Relatsh. 1988, 5, 275–284. [Google Scholar] [CrossRef]
- Kochenderfer-Ladd, B.; Wardrop, J. Chronicity and instability of children’s peer victimization experiences as predictors of loneliness and social satisfaction trajectories. Child Dev. 2001, 72, 134–151. [Google Scholar] [CrossRef]
- Gifford-Smith, M.; Brownell, C. Childhood peer relationships: Social acceptance, friendships and peer net-works. J. Sch. Psychol. 2003, 41, 235–284. [Google Scholar] [CrossRef]
- Crone, E.; Dahl, R. Understanding adolescence as a period of social–affective engagement and goal flexibility. Nat. Rev. Neurosci. 2012, 13, 636–650. [Google Scholar] [CrossRef]
- Qualter, P.; Vanhalst, J.; Harris, R.; Van Roekel, E.; Lodd, G.; Bangee, M.; Maes, M.; Verhargen, M. Loneliness across the lifespan. Perspect. Psychol. Sci. 2015, 10, 250–264. [Google Scholar] [CrossRef]
- Szivos-Bach, S. Social comparisons, stigma and mainstreaming: The self-esteem of young adults with a mild mental handicap. Ment. Handicap Res. 1993, 6, 217–236. [Google Scholar] [CrossRef]
- Salmon, N. ‘We just stick together’: How disabled teens negotiate stigma to create lasting friendship. J. Intellect. Disabil. Res. 2013, 57, 347–358. [Google Scholar] [CrossRef]
- Rose, C.; Stormont, M.; Wang, Z.; Simpson, C.; Preast, J.; Green, A. Bullying and students with disabilities: Examination of disability status and educational placement. Sch. Psychol. Rev. 2015, 44, 425–444. [Google Scholar] [CrossRef]
- Maxey, M.; Beckert, T. Adolescents with disabilities. Adolesc. Res. Rev. 2017, 2, 59–75. [Google Scholar] [CrossRef] [Green Version]
- Victor, C.; Scambler, S.; Bowling, A.; Bond, J. The prevalence of, and risk factors for, loneliness in later life: A survey of older people in Great Britain. Ageing Soc. 2005, 25, 357–375. [Google Scholar] [CrossRef] [Green Version]
- Smith, J. Toward a better understanding of loneliness in community-dwelling older adults. J. Psychol. 2012, 146, 293–311. [Google Scholar] [CrossRef] [PubMed]
- Queen, T.; Stawski, R.; Ryan, L.; Smith, J. Loneliness in a day: Activity engagement, time alone, and experienced emotions. Psychol. Aging 2014, 29, 297–305. [Google Scholar] [CrossRef] [Green Version]
- Larsson, K.; Wallroth, V.; Schröder, A. “You never get used to loneliness”-older adults’ experiences of loneliness when applying for going on a senior summer camp. J. Gerontol. Soc. Work 2019, 62, 892–911. [Google Scholar] [CrossRef]
- Taube, E.; Jakobsson, U.; Midlöv, P.; Kristensson, J. Being in a bubble: The experience of loneliness among frail older people. J. Adv. Nurs. 2016, 72, 631–640. [Google Scholar] [CrossRef]
- Dahlberg, L.; Agahi, N.; Lennartsson, C. Lonelier than ever? Loneliness of older people over two decades. Arch. Gerontol. Geriatr. 2018, 75, 96–103. [Google Scholar] [CrossRef]
- Nielsen, C.; Modvig, J. Funktionsevne. In Klinisk Socialmedicin og Rehabilitering; Jensen, B.T., Modvig, J., Nielsen, C., Eds.; FADL: Copenhagen, Denmark, 2011; pp. 22–32. (In Denish) [Google Scholar]
- Caputo, J.; Simon, R. Physical limitation and emotional wellbeing: Gender and marital status variations. J. Health Soc. Behav. 2013, 54, 241–257. [Google Scholar] [CrossRef] [Green Version]
- Petrina, N.; Carter, M.; Stephenson, J. The nature of friendship in children with autism spectrum disorders: A systematic review. Res. Autism Spectr. Disord. 2014, 8, 111–126. [Google Scholar] [CrossRef]
- Hawkely, L.; Buecker, S.; Kaiser, T.; Luhmann, M. Loneliness from young adulthood to old age: Explaining age differences in loneliness. Int. J. Behav. Dev. 2020. [Google Scholar] [CrossRef]
- Smith, R. Leisure of disabled tourists: Barriers to participation. Ann. Tour. Res. 1987, 14, 376–379. [Google Scholar] [CrossRef]
- Pagan, R. Are relational goods important for people with disabilities? Appl. Res. Qual. Life 2016, 11, 1117–1135. [Google Scholar] [CrossRef]
Figure 1.
Mean loneliness scores by disability status for German males and females. Note: Weighted data. Individuals aged 16 or over. Confidence intervals (p < 0.05) are shown. Number of observations: 20,841 males (18,131 without disabilities, 1415 with a moderate disability, and 1295 with a severe disability); 26,445 females (23,800 without disabilities, 1425 with a moderate disability, and 1220 with a severe disability). Source: SOEP data for the years 2013 and 2017.

Figure 2.
Mean loneliness distribution by age and disability status for German males and females. Note: Individuals aged 16 or over. LOWESS (red dashed lines) and LPOLY (black lines with confidence intervals (p < 0.05) in grey) smoothing functions shown. For the number of observations used to obtain these results, see the notes in Figure 1. Source: SOEP data for the years 2013 and 2017.


Table 1.
Loneliness regressions for German males and females.
| MALES | FEMALES | |||
|---|---|---|---|---|
| Mean (SD) | Coefficient (SE) | Mean (SD) | Coefficient (SE) | |
| Disability status: | ||||
| Without disabilities (reference) | 0.866 | - | 0.889 | - |
| Moderate disability | 0.071 | 0.150 *** (0.0214) | 0.060 | 0.174 *** (0.023) |
| Severe disability | 0.063 | 0.237 *** (0.026) | 0.051 | 0.343 *** (0.028) |
| Age | 51.635 (17.13) | 0.087 *** (0.009) | 50.935 (16.82) | 0.055 *** (0.008) |
| Age2/1000 | 2.959 (1.80) | −1.605 *** (0.168) | 2.877 (1.77) | −1.106 *** (0.165) |
| Age3/1000 | 183.071 (156.18) | 0.009 *** (0.001) | 175.879 (155.18) | 0.006 *** (0.001) |
| Years of education | 12.598 (2.82) | −0.006 *** (0.002) | 12.382 (2.71) | −0.005 ** (0.002) |
| Marital status: | ||||
| Single | 0.159 | 0.181 *** (0.019) | 0.129 | 0.097 *** (0.019) |
| Living without partner | 0.090 | 0.211 *** (0.021) | 0.186 | 0.172 *** (0.016) |
| Living with partner (reference) | 0.751 | - | 0.685 | - |
| Existence of children in the household | 0.541 | −0.020 ** (0.009) | 0.593 | −0.018 * (0.009) |
| Household size | 2.697 (1.33) | 0.009 (0.007) | 2.644 (1.34) | −0.011 (0.007) |
| German | 0.923 | −0.115 *** (0.023) | 0.919 | −0.096 *** (0.021) |
| Log (real household income) | 5.416 (0.55) | −0.108 *** (0.012) | 5.338 (0.55) | −0.114 *** (0.011) |
| Employment status: | ||||
| Full-time | 0.552 | −0.152 *** (0.017) | 0.251 | −0.147 *** (0.015) |
| Part-time | 0.040 | −0.137 *** (0.026) | 0.244 | −0.135 *** (0.014) |
| Non-working (reference) | 0.407 | - | 0.505 | - |
| Relational Time Index (RTI) | 1.493 (0.56) | −0.059 *** (0.010) | 1.529 (0.56) | −0.117 *** (0.010) |
| Regional dummies | Yes | Yes | ||
| Year dummies | Yes | Yes | ||
| Constant | - | 0.491 *** (0.152) | - | 1.284 *** (0.143) |
| Number observations | 19,763 | 22,806 | ||
| R-squared | 0.065 | 0.068 | ||
Note: Individuals aged 16 or over. The standard errors (SE) are robust. * Significant at p < 0.1; ** significant at p < 0.05; *** significant at p < 0.01%. Source: Author’s calculations using the SOEP data for the years 2013 and 2017.
Table 2.
Loneliness regression values by different age groups for German males and females.
| MALES | ||||||||
|---|---|---|---|---|---|---|---|---|
| 16–29 | 30–49 | 50–65 | +65 | |||||
| Mean (SD) | Coefficient (SE) | Mean (SD) | Coefficient (SE) | Mean (SD) | Coefficient (SE) | Mean (SD) | Coefficient (SE) | |
| Disability status: | ||||||||
| Without disabilities (reference) | 0.978 | - | 0.946 | - | 0.820 | - | 0.756 | - |
| Moderate disability | 0.010 | 0.222 ** (0.041) | 0.032 | 0.201 *** (0.060) | 0.106 | 0.164 *** (0.033) | 0.112 | 0.084 *** (0.032) |
| Severe disability | 0.012 | 0.508 *** (0.146) | 0.022 | 0.216 *** (0.077) | 0.074 | 0.252 *** (0.044) | 0.132 | 0.179 *** (0.035) |
| Constant | - | 9.029 (5.963) | - | 1.378 (3.696) | - | 26.59 (21.72) | - | 16.68 (13.00) |
| Number observations | 2490 | 6488 | 6074 | 4711 | ||||
| R-squared | 0.039 | 0.088 | 0.089 | 0.067 | ||||
| FEMALES | ||||||||
| 16–29 | 30–49 | 50–65 | +65 | |||||
| Mean (SD) | Coefficient (SE) | Mean (SD) | Coefficient (SE) | Mean (SD) | Coefficient (SE) | Mean (SD) | Coefficient (SE) | |
| Disability status: | ||||||||
| Without disabilities (reference) | 0.983 | - | 0.955 | - | 0.833 | - | 0.805 | - |
| Moderate disability | 0.008 | 0.422 ** (0.209) | 0.029 | 0.160 *** (0.056) | 0.105 | 0.186 *** (0.032) | 0.078 | 0.128 *** (0.039) |
| Severe disability | 0.009 | −0.092 (0.157) | 0.016 | 0.260 *** (0.078) | 0.062 | 0.334 *** (0.047) | 0.117 | 0.380 *** (0.039) |
| Constant | - | 4.826 (6.504) | - | 2.051 (3.419) | - | −9.316 (22.31) | - | 27.33 ** (11.50) |
| Number observations | 2631 | 8331 | 6960 | 4884 | ||||
| R-squared | 0.038 | 0.071 | 0.096 | 0.083 | ||||
Note: All regressions include the rest of the explanatory variables shown in Table 2. The standard errors (SE) are robust. ** Significant at p < 0.05; *** significant at p < 0.01%. Source: Author’s calculations using the SOEP values for the years 2013 and 2017.
Publisher’s Note: MDPI stays neutral with regard to jurisdictional claims in published maps and institutional affiliations. |
© 2020 by the author. Licensee MDPI, Basel, Switzerland. This article is an open access article distributed under the terms and conditions of the Creative Commons Attribution (CC BY) license (http://creativecommons.org/licenses/by/4.0/).
Share and Cite
MDPI and ACS Style
Pagan, R. Gender and Age Differences in Loneliness: Evidence for People without and with Disabilities. Int. J. Environ. Res. Public Health 2020, 17, 9176. https://0-doi-org.brum.beds.ac.uk/10.3390/ijerph17249176
AMA Style
Pagan R. Gender and Age Differences in Loneliness: Evidence for People without and with Disabilities. International Journal of Environmental Research and Public Health. 2020; 17(24):9176. https://0-doi-org.brum.beds.ac.uk/10.3390/ijerph17249176
Chicago/Turabian StylePagan, Ricardo. 2020. "Gender and Age Differences in Loneliness: Evidence for People without and with Disabilities" International Journal of Environmental Research and Public Health 17, no. 24: 9176. https://0-doi-org.brum.beds.ac.uk/10.3390/ijerph17249176
Note that from the first issue of 2016, this journal uses article numbers instead of page numbers. See further details here.