Body Composition in International Sprint Swimmers: Are There Any Relations with Performance?

 , , , , , and
Abstract
:1. Introduction
2. Materials and Methods
2.1. Research Sample
2.2. Measurement Procedure
2.2.1. Body Composition Variables
2.2.2. Swimming Performance Variable
2.3. Statistical Procedures
3. Results
4. Discussion
5. Conclusions
Author Contributions
Funding
Conflicts of Interest
References
- Balyi, I. Sport System Building and Long-Term Athlete Development in British Columbia; SportsMed BC: Burnaby, BC, Canada, 2001. [Google Scholar]
- Ford, P.; Croix, M.D.S.; Lloyd, R.; Meyers, R.; Moosavi, M.; Oliver, J.; Till, K.; Williams, C. The Long-Term athlete development model: Physiological evidence and application. J. Sports Sci. 2011, 29, 389–402. [Google Scholar] [CrossRef] [PubMed]
- Vavrek, J.; Machin, R.D.; Tanaka, H. Progression of athletic performance in age-group swimmers in the past 50 years. Int. J. Perf. Anal. Sport 2012, 12, 608–613. [Google Scholar] [CrossRef]
- Norton, K.; Olds, T. Morphological evolution of athletes over the 20th century: Causes and consequences. Sports Med. 2001, 31, 763–783. [Google Scholar] [CrossRef] [PubMed]
- Ackland, T.R.; Lohman, T.G.; Sundgot-Borgen, J.; Maughan, R.J.; Meyer, N.L.; Stewart, A.D.; Müller, W. Current status of body composition assessment in sport: Review and position statement on behalf of the ad hoc research working group on body composition health and performance, under the auspices of the I.O.C. Medical Commission. Sports Med. 2012, 42, 227–249. [Google Scholar] [CrossRef] [PubMed]
- Copic, N.; Dopsaj, M.; Ivanovic, J.; Nesic, G.; Jaric, S. Body composition and muscle strength predictors of jumping performance: Differences between elite female volleyball competitors and nontrained individuals. J. Strength Cond. Res. 2014, 28, 2709–2716. [Google Scholar] [CrossRef] [PubMed]
- Dopsaj, M.; Markovic, M.; Kasum, G.; Jovanovic, S.; Koropanovski, G.; Vukovic, M.; Mudric, M. Discrimination of different body structure indexes of elite athletes in combat sports measured by multi frequency bioimpedance method. Int. J. Morphol. 2017, 35, 199–207. [Google Scholar] [CrossRef] [Green Version]
- Bankovic, V.; Dopsaj, M.; Terzic, Z.; Nesic, G. Descriptive body composition profile in female olympic volleyball medalists defined using multichannel bioimpedance measurement: Rio 2016 team case study. Int. J. Morphol. 2018, 36, 699–708. [Google Scholar] [CrossRef] [Green Version]
- Dopsaj, M.; Mijalkovski, Z.; Vasilovski, N.; Ćopić, N.; Brzaković, M.; Marković, M. Morphological parameters and handgrip muscle force contractile characteristics in the first selection level in water polo: Differences between U15 waterpolo players and control group. Hum. Sport Med. 2018, 18, 5–15. [Google Scholar] [CrossRef]
- Carbuhn, A.F.; Fernandez, T.E.; Bragg, A.F.; Green, J.S.; Crouse, S.F. Sport and training influence bone and body composition in women collegiate athletes. J. Strength Cond. Res. 2010, 24, 1710–1717. [Google Scholar] [CrossRef]
- Roelofs, E.; Emith-Ryan, A.; Trexler, E.; Hirsch, K. Seasonal effects on body composition, muscle characteristics, and performance of collegiate swimmers and divers. J. Athl. Train. 2017, 52, 45–50. [Google Scholar] [CrossRef] [Green Version]
- Meleski, B.; Malina, R. Changes in body composition and physique of elite university-level female swimmers during a competitive season. J. Sports Sci. 1985, 3, 33–40. [Google Scholar] [CrossRef]
- Pelayo, P.; Sidney, M.; Kherif, T.; Chollet, D.; Tourny, C. Stroking characteristics in freestyle swimming and relationship with anthropometric characteristics. J. Appl. Biomech. 1996, 12, 197–206. [Google Scholar] [CrossRef] [Green Version]
- Siders, W.A.; Lukaski, H.C.; Bolonchuk, W.W. Relationship among swimming performance, body composition and somatotype in competitive collegiate swimmers. J. Sport Med. Phys. Fit. 1993, 33, 166–171. [Google Scholar]
- Cortesi, M.; Gatta, G.; Michielon, G.; Di Michele, R.; Bartolomei, S.; Scurati, R. Passive drag in young swimmers: Efects of body composition, morphology and gliding position. Int. J. Environ. Res. Public Health 2020, 17, 2002. [Google Scholar] [CrossRef] [Green Version]
- Brauer, J.A.G.; Popov, O.I.; Bulgakova, N.J. Trajectory of development morfofunctionals pointers as criteria of identification of the sports talent in swimming. Fit. Perform. J. 2007, 6, 382–387. [Google Scholar] [CrossRef]
- Zamparo, P.; Cortesi, M.; Gatta, G. The energy cost of swimming and its determinants. Eur. J. Appl. Physiol. 2019, 120, 41–66. [Google Scholar] [CrossRef] [PubMed]
- Li, T.Z.; Zhan, J.M. Hydrodynamic body shape analysis and their impact on swimming performance. Acta Bioeng. Biomech. 2015, 17, 3–11. [Google Scholar] [PubMed]
- Gatta, G.; Cortesi, M.; Fantozzi, S.; Zamparo, P. Planimetric frontal area in the four swimming strikes: Implication for drag, energetics and speed. Hum. Mov. Sci. 2015, 39, 41–54. [Google Scholar] [CrossRef] [PubMed]
- Gatta, G.; Cortesi, M.; Zamparo, P. The relationship between power generated by thrust and power to overcome drag in elite short distance swimmers. PLoS ONE 2016, 11, e0162387. [Google Scholar] [CrossRef] [PubMed]
- Ratamess, N.A. Body Composition. In NSCA’s Guide to Tests and Assessments, National Strength and Conditioning Association; Miller, T.T., Ed.; Human Kinetics: Champaign, IL, USA, 2012; pp. 31–42. [Google Scholar]
- Gibson, A.L.; Holmes, J.C.; Desautels, R.L.; Edmonds, L.B.; Nuudi, L. Ability of new octapolar bioimpedance spectroscopy analyzers to predict 4-component-model percentage body fat in Hispanic, black, and white adults. Am. J. Clin. Nutr. 2008, 87, 332–338. [Google Scholar] [CrossRef] [Green Version]
- Sillanpää, E.; Cheng, S.; Häkkinen, K.; Finni, T.; Walker, S.; Pesola, A.; Ahtiainen, J.; Stenroth, L.; Selänne, H.; Sipilä, S. Body composition in 18- to 88-year-old adults-comparison of multifrequency bioimpedance and dual-energy X-ray absorptiometry. Obesity 2014, 22, 101–109. [Google Scholar] [CrossRef]
- Esco, M.R.; Snarr, R.L.; Leatherwood, M.D.; Chamberlian, N.A.; Redding, M.L.; Flatt, A.A.; Moon, J.R.; Williford, H.N. Comparison of total and segmental body composition using DXA and multifrequency bioimpedance in collegiate female athletes. J. Strength Cond. Res. 2015, 29, 918–925. [Google Scholar] [CrossRef] [PubMed]
- Stager, J.; Cordain, L. Relationship of body composition to swimming performance in female swimmers. J. Swim. Res. 1984, 1, 21–26. [Google Scholar]
- Thomas, J.R.; Silverman, S.; Nelson, J. Research Methods in Physical Activity; Human Kinetics: Champaign, IL, USA, 2015. [Google Scholar]
- InBody 720. The Precision Body Composition Analyzer, Instruction Manual, 1996–2008; Biospace Co. Ltd.: Seoul, Korea, 2008. [Google Scholar]
- Formetti, W.C.; Pivarnik, J.M.; Foley, J.M.; Fiechtner, J.J. Reliability and validity of body composition measures in female athletes. J. Appl. Phys. 1999, 87, 1114–1122. [Google Scholar]
- Dopsaj, M.; Kukić, F.; Đorđević-Nikić, M.; Koropanovski, N.; Radovanović, D.; Miljuš, D.; Subošić, D.; Tomanić, M.; Dopsaj, V. Indicators of absolutely and relative changes in skeletal muscle mass during adulthood and ageing. Int. J. Environ. Res. Public Health 2020, 17, 5977. [Google Scholar] [CrossRef] [PubMed]
- Santos, D.A.; Dawson, J.A.; Matias, C.N.; Rocha, P.M.; Minderico, C.S.; Allison, D.B.; Sardinha, L.B.; Silva, A.M. Reference values for body composition and anthropometric measurements in athletes. PLoS ONE 2014, 9, e97846. [Google Scholar] [CrossRef] [Green Version]
- Available online: https://www.swimrankings.net/ (accessed on 6 October 2020).
- Zatsiorsky, V. Спoртивная Метрлoгия (Sports Metrology); Physical Education and Sport: Moscow, Russia, 1982. (In Russian) [Google Scholar]
- Majstorović, N.; Dopsaj, M.; Grbić, V.; Savić, Z.; Vićentijević, A.; Aničić, Z.; Zadražnik, M.; Toskić, L.; Nešić, G. Isometric strength in volleyball players of different age: A multidimensional model. Appl. Sci. 2020, 10, 4107. [Google Scholar] [CrossRef]
- Hair, J.; Anderson, R.; Tatham, R.; Black, W. Multivariate Data Analysis, 5th ed.; Prentice-Hall. Inc.: Upper Saddle River, NJ, USA, 1988. [Google Scholar]
- Carter, L.J.E.; Ackland, T.R. Kinanthropometry in Aquatic Sport: A Study of World Class Athletes; Sport Sciences Monograph Series; Human Kinetics: Champaign, IL, USA, 1994; Volume 5. [Google Scholar]
- Mameletzi, D.; Siatras, T.; Tsalis, G.; Kellis, S. The relationship between lean body mass and isokinetic peak torque of knee extensors and flexors in young male and female swimmers. Isokinet. Exerc. Sci. 2003, 11, 159–163. [Google Scholar] [CrossRef]
- Strass, D. Effects of maximal strength training on sprint performance of competitive swimmers. In Swimming Science V (International Series on Sport Sciences, Vol. 18); Ungerechts, B.E.B., Wilke, K., Reischle, K., Eds.; Spon Press: London, UK, 1998; pp. 149–156. [Google Scholar]
- Barbosa, T.M.; Fernandes, R.; Keskinen, K.L.; Colaço, P.; Cardoso, C.; Vilas-Boas, J.P. Evaluation of the energy expenditure in competitive swimming strokes. Int. J. Sports Med. 2006, 27, 894–899. [Google Scholar] [CrossRef] [PubMed] [Green Version]
- West, D.J.; Owen, N.J.; Cunningham, D.J.; Cook, C.J.; Kiduff, L.P. Strength and power predictors of swimming starts in international sprint swimmers. J. Strength Cond. Res. 2011, 25, 950–955. [Google Scholar] [CrossRef] [PubMed]
- Morouço, P.G.; Marihno, D.A.; Amaro, N.M.; Peréz-Turpin, J.A.; Marques, M.C. Effects of dry-land strength training on swimming performance: A brief review. J. Hum. Sport Exerc. 2012, 7, 553–559. [Google Scholar] [CrossRef] [Green Version]
- Barbosa, T.; Bragada, J.; Reis, V.; Marinho, D.; Carvalho, C.; Silva, A. Energetics and biomechanics as determining factors of swimming performance: Updating the state of the art. J. Sci. Med. Sports 2010, 13, 262–269. [Google Scholar] [CrossRef] [PubMed]
- Morouço, P.; Neiva, H.; González-Badillo, J.J.; Garrido, N.; Marhinho, D.A.; Marques, M.C. Associations between dry land strength and power measurements with swimming performance in elite athletes: A Pilot study. J. Hum. Kinet. Spec. Issue 2011, 105–112. [Google Scholar] [CrossRef] [PubMed]
- Morouço, P.; Keskinen, K.L.; Vilas-Boas, J.P.; Fernandes, R.J. Relationship between tethered forces and the four swimming techniques perfromance. J. Appl. Biomech. 2011, 27, 161–169. [Google Scholar] [CrossRef] [Green Version]
- Morais, J.E.; Silva, A.J.; Marinho, D.A.; Marques, M.C.; Barbosa, T.M. Effects of a specific concurrent water and dry-land training ovar a season in young swimmers’ performance. Int. J. Perf. Anal. Sport 2016, 16, 760–775. [Google Scholar]
- Dopsaj, M.; Milosevic, M.; Matkovic, I.; Arlov, D.; Blagojevic, M. The relation between sprint ability in free-style swimming and force characteristics of different muscle groups. In Biomechanics and Medicine in Swimming VIII; Keskinen, K.L., Komi, P.V., Hollander, A.P., Eds.; Department of Biology of Physical Activity, University of Jyväskylä; Gummerus Printing: Jyväskylä, Finland, 1999; pp. 203–208. [Google Scholar]
- Morales, E.; Arellano, R.; Famia, P.; Mercades, J. Regression analysis model applied to age-group swimmers: Study of stroke rate, stroke length and stroke index. In Biomechanics and Medicine in Swimming XI; Kjendlie, P.-L., Stallman, R.K., Cabri, J., Eds.; Norwegian School of Sport Sciences: Oslo, Norway, 2010; pp. 129–132. [Google Scholar]
- Kjendle, P.-L.; Stallman, R. Morphology and swimming performance. In World Book of Swimming: From Science to Performance; Seifert, L., Chollet, D., Mujika, I., Eds.; Nova Science Publishers, Inc.: Hauppauge, NY, USA, 2011; pp. 203–211. [Google Scholar]
- Lowensteyn, I.; Signorile, J.F.; Giltz, K. The effect of varying body composition on swimming performance. J. Strength Cond. Res. 1994, 8, 149–154. [Google Scholar]
- Takagi, H.; Nakashima, M.; Sato, Y.; Matsuuchi, K.; Sanders, R.H. Numerical and experimental investigations of human swimming motions. J. Sports Sci. 2016, 34, 1564–1580. [Google Scholar] [CrossRef] [Green Version]
- Knechtle, B.; Dalamitros, A.A.; Barbosa, T.M.; Sousa, C.V.; Rosemann, T.; Nikolaidis, P.T. Sex diferences in swimming disciplines—Can women outperform men in swimming? Int. J. Environ. Res. Public Health 2020, 17, 3651. [Google Scholar] [CrossRef]


| Variables | Male | |||||||||||||
|---|---|---|---|---|---|---|---|---|---|---|---|---|---|---|
| BH | BM | BMI | BF | SMM | FFM | PBF | PSMM | PFFM | FMI | SMMI | FFMI | IBC | PFI | |
| Mean | 186.3 | 82.4 | 23.73 | 8.12 | 43.13 | 74.29 | 9.82 | 52.36 | 90.18 | 2.35 | 12.41 | 21.38 | 2.80 | 2.18 |
| Std. Dev. | 5.4 | 6.5 | 1.35 | 3.08 | 3.55 | 6.25 | 3.35 | 1.83 | 3.35 | 0.88 | 0.63 | 1.17 | 1.25 | 1.08 |
| cV% | 2.90 | 7.83 | 5.69 | 37.07 | 8.23 | 8.41 | 33.81 | 3.50 | 3.71 | 36.17 | 5.08 | 5.47 | 43.21 | 47.25 |
| SEM | 0.78 | 0.95 | 0.20 | 0.37 | 0.52 | 0.92 | 0.41 | 0.27 | 0.49 | 0.09 | 0.09 | 0.17 | 4.29 | 4.59 |
| SEM (%) | 0.42 | 1.15 | 0.84 | 4.56 | 1.21 | 1.24 | 4.18 | 0.52 | 0.54 | 3.83 | 0.73 | 0.80 | 4.29 | 4.59 |
| Min | 178.4 | 71.8 | 21.42 | 2.4 | 36.2 | 63.1 | 2.99 | 48.44 | 81.14 | 0.68 | 10.95 | 18.85 | 1.34 | 0.89 |
| Max | 201.5 | 96.9 | 27.13 | 17.8 | 54.0 | 93.1 | 18.86 | 55.79 | 97.01 | 4.79 | 13.92 | 23.86 | 7.66 | 6.46 |
| KSZ | 0.942 | 0.770 | 0.542 | 1.066 | 0.756 | 0.678 | 0.777 | 0.632 | 0.765 | 1.128 | 0.554 | 0.428 | 1.384 | 1.380 |
| KS p | 0.338 | 0.594 | 0.931 | 0.206 | 0.616 | 0.747 | 0.581 | 0.820 | 0.603 | 0.157 | 0.919 | 0.993 | 0.051 | 0.052 |
| Female | ||||||||||||||
| Mean | 173.4 | 62.8 | 20.88 | 9.87 | 29.52 | 52.93 | 15.79 | 47.01 | 84.27 | 3.31 | 9.80 | 17.56 | 1.48 | 1.21 |
| Std. Dev. | 5.8 | 4.9 | 1.13 | 3.01 | 2.30 | 5.18 | 4.84 | 2.93 | 4.83 | 1.11 | 0.58 | 0.99 | 0.48 | 0.51 |
| cV% | 3.36 | 7.79 | 5.41 | 30.50 | 7.79 | 9.79 | 30.65 | 6.23 | 5.73 | 33.53 | 5.92 | 5.64 | 32.43 | 38.84 |
| SEM | 0.97 | 0.82 | 0.19 | 0.40 | 0.50 | 0.86 | 0.78 | 0.49 | 0.81 | 0.16 | 0.10 | 0.17 | 0.07 | 0.07 |
| SEM (%) | 0.56 | 1.31 | 0.91 | 4.05 | 1.69 | 1.62 | 4.94 | 1.04 | 0.96 | 4.83 | 1.02 | 0.97 | 4.73 | 5.79 |
| Min. | 163.0 | 53.8 | 19.25 | 4.4 | 22.3 | 41.0 | 7.50 | 39.05 | 70.09 | 1.47 | 8.39 | 15.24 | 0.73 | 0.46 |
| Max. | 184.4 | 73.3 | 23.94 | 17.5 | 35.0 | 62.4 | 29.91 | 52.14 | 92.48 | 6.51 | 11.22 | 20.24 | 2.61 | 2.45 |
| KSZ | 0.642 | 0.861 | 1.052 | 0.781 | 0.600 | 0.630 | 0.706 | 0.737 | 0.710 | 0.861 | 0.597 | 0.589 | 1.456 | 1.289 |
| KS p | 0.804 | 0.448 | 0.218 | 0.575 | 0.864 | 0.823 | 0.702 | .649 | 0.695 | 0.449 | 0.868 | 0.879 | 0.037 | 0.072 |
| Body Composition Variables | FINA Score Pearsons Correlation Coefficient | Fisher r-to-z Transformation | p | ||
|---|---|---|---|---|---|
| Male | Female | ||||
| BH (cm) | r value | 0.187 | 0.535 | −1.76 | 0.078 |
| p significance | 0.212 | 0.001 | |||
| BM (kg) | r value | 0.215 | 0.396 | −0.87 | 0.384 |
| p significance | 0.151 | 0.017 | |||
| BMI (kg·m−2) | r value | 0.087 | −0.085 | 0.75 | 0.453 |
| p significance | 0.566 | 0.621 | |||
| BF (kg) | r value | −0.148 | −0.566 | 2.13 | 0.033 |
| p significance | 0.326 | 0.000 | |||
| SMM (kg) | r value | 0.350 | 0.730 | −2.43 | 0.015 |
| p significance | 0.017 | 0.000 | |||
| FFM (kg) | r value | 0.294 | 0.702 | −2.61 | 0.009 |
| p significance | 0.047 | 0.000 | |||
| PBF (%) | r value | −0.224 | −0.695 | 2.72 | 0.007 |
| p significance | 0.135 | 0.000 | |||
| PSMM (%) | r value | 0.353 | 0.732 | −2.44 | 0.015 |
| p significance | 0.016 | 0.000 | |||
| PFFM (%) | r value | 0.223 | 0.697 | −2.74 | 0.006 |
| p significance | 0.136 | 0.000 | |||
| FMI (kg·m−2) | r value | −0.170 | −0.642 | 2.55 | 0.011 |
| p significance | 0.260 | 0.000 | |||
| SMMI (kg·m−2) | r value | 0.323 | 0.684 | −2.17 | 0.030 |
| p significance | 0.029 | 0.000 | |||
| FFMI (kg·m−2) | r value | 0.228 | 0.621 | −2.14 | 0.032 |
| p significance | 0.127 | 0.000 | |||
| IBC (Arbitraly Unit) | r value | 0.391 | 0.687 | −1.85 | 0.064 |
| p significance | 0.007 | 0.000 | |||
| PFI (kg) | r value | 0.392 | 0.655 | −1.60 | 0.110 |
| p significance | 0.007 | 0.000 | |||
| Model | Dependent Variable | Predictors (Variable, t And p Values) | R | R2 | Adj. R2 | SEE | ANOVA | |
|---|---|---|---|---|---|---|---|---|
| F Relation | p Value | |||||||
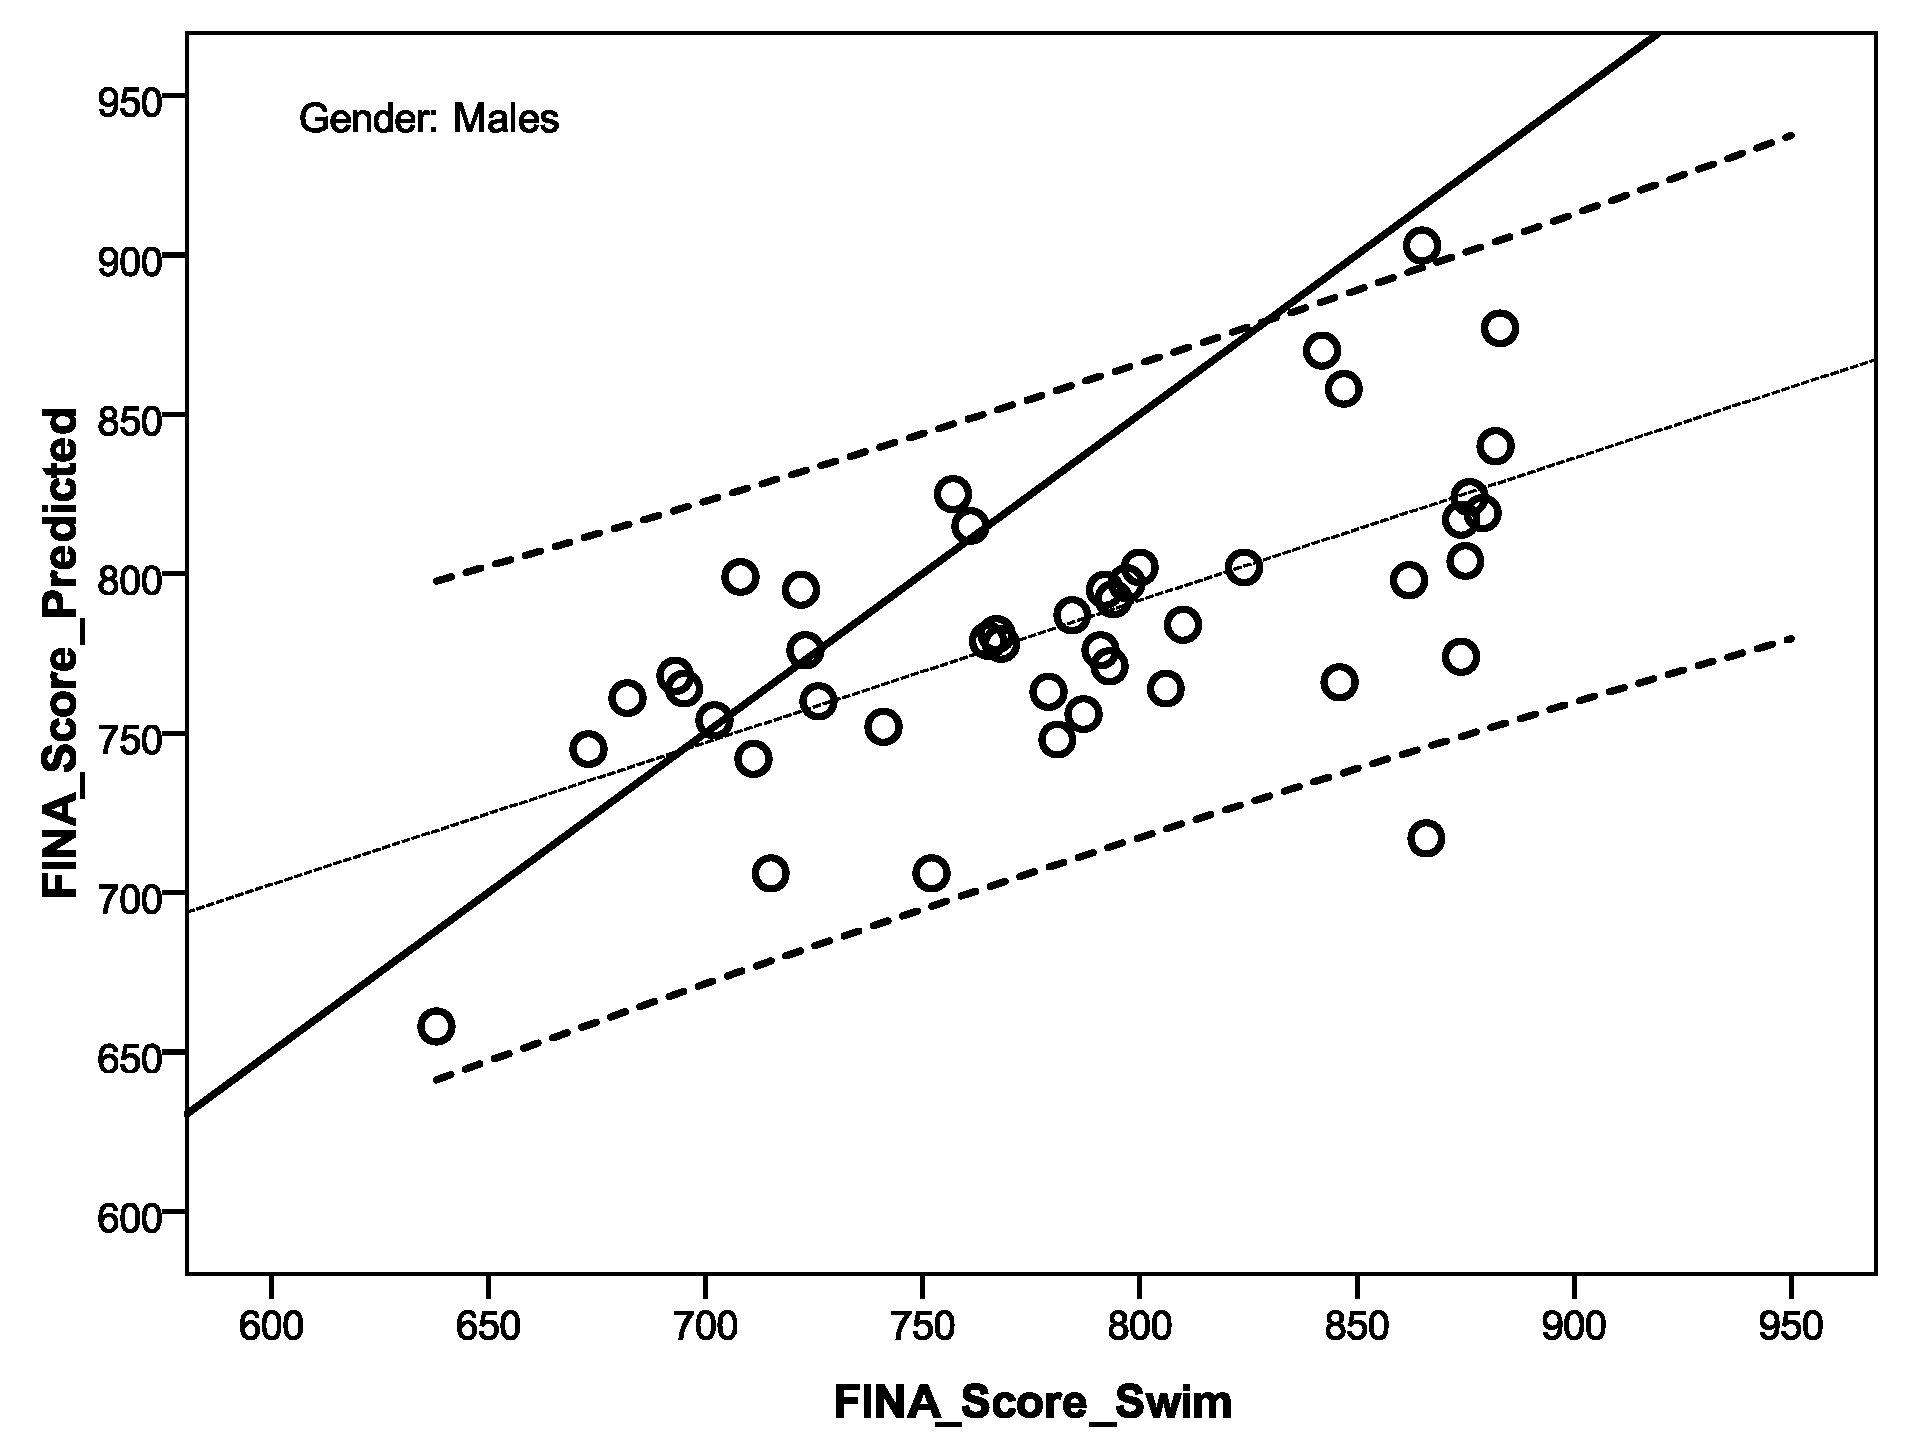
| Male | FINA_Score | PFI (1.58, 0.123), BM (2.28, 0.028), PSMM (2.03, 0.049), BH (−2.20, 0.034), IBC (−1.56, 0.126), SMMI (−1.72, 0.093) | 0.662 | 0.438 | 0.351 | 57.48 | 5.06 | 0.001 |
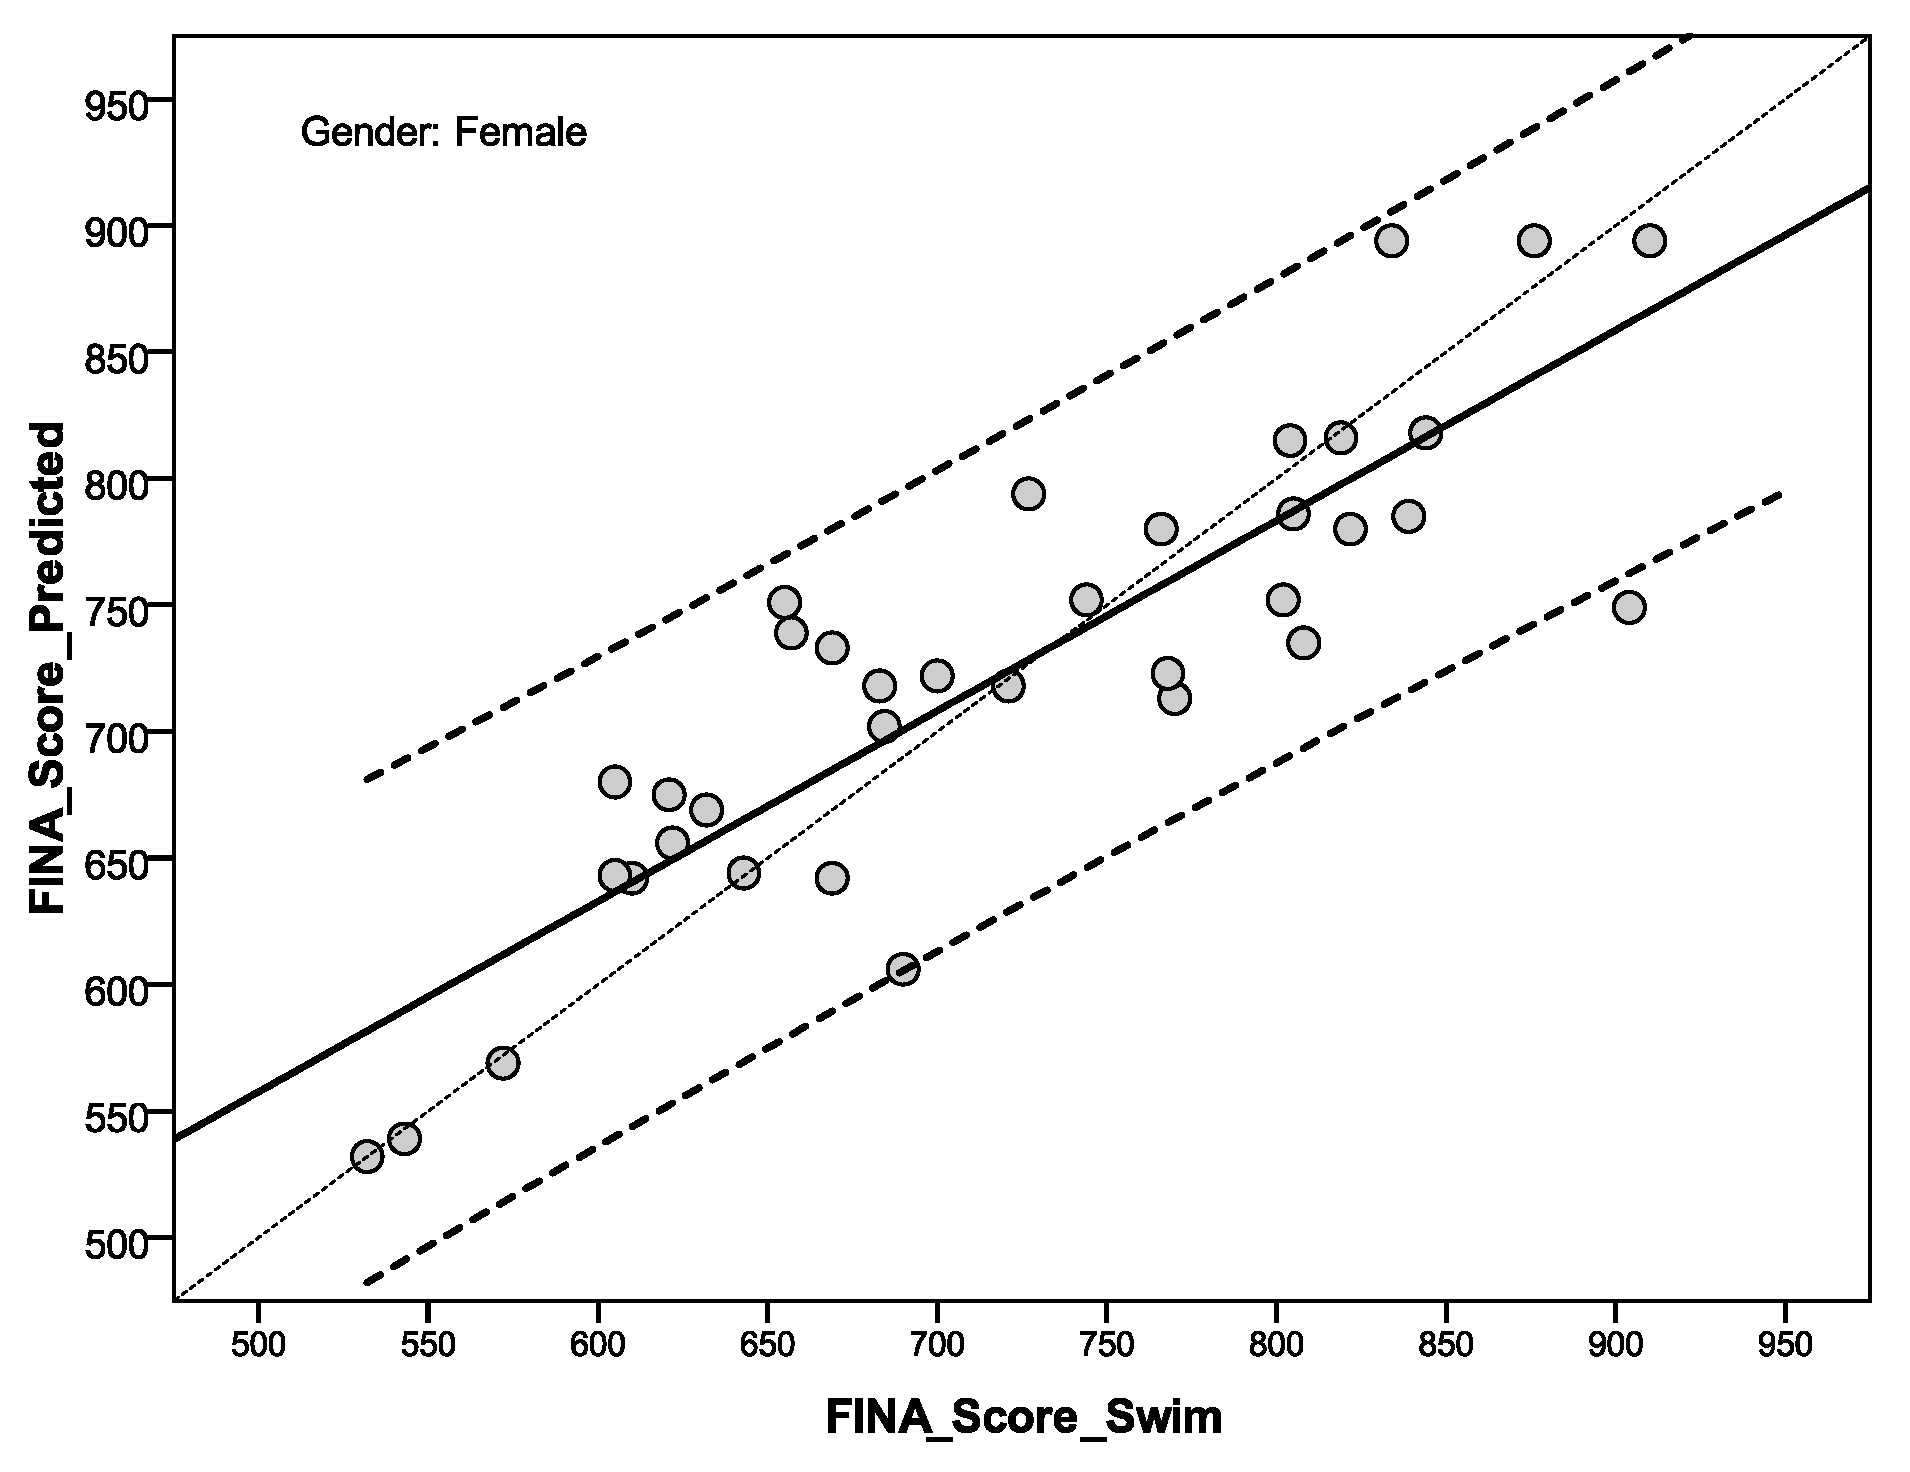
| Female | FINA_Score | PFI (2.66, 0.013), BM (2.19, 0.037), BMI (−2.28, 0.030), FFMI (2.50, 0.019), PSMM (2.88, 0.008), IBC (−2.60, 0.015), PBF (3.00, 0.006) | 0.895 | 0.801 | 0.751 | 55.99 | 16.10 | 0.000 |
| Multiple equation models of athletes’ performance prediction by body composition characteristics for male and female swimmers | ||||||||
| Male | FINA score_M = 5884.616 − (BH × 65.548) + (BM × 74.835) + (PSMM × 116.793) − (SMMI × 411.608) − (IBC × 268.620) + (PFI • 316.588) | |||||||
| Female | FINA score_F = −12241.319 + (BM × 6.225) − (BMI × 716.712) + (PBF × 272.470) + (PSMM × 111.570) + (FFMI × 1051.171) − (IBC × 2253.208) + (PFI × 2359.262) | |||||||
Publisher’s Note: MDPI stays neutral with regard to jurisdictional claims in published maps and institutional affiliations. |
© 2020 by the authors. Licensee MDPI, Basel, Switzerland. This article is an open access article distributed under the terms and conditions of the Creative Commons Attribution (CC BY) license (http://creativecommons.org/licenses/by/4.0/).
Share and Cite
Dopsaj, M.; Zuoziene, I.J.; Milić, R.; Cherepov, E.; Erlikh, V.; Masiulis, N.; di Nino, A.; Vodičar, J. Body Composition in International Sprint Swimmers: Are There Any Relations with Performance? Int. J. Environ. Res. Public Health 2020, 17, 9464. https://0-doi-org.brum.beds.ac.uk/10.3390/ijerph17249464
Dopsaj M, Zuoziene IJ, Milić R, Cherepov E, Erlikh V, Masiulis N, di Nino A, Vodičar J. Body Composition in International Sprint Swimmers: Are There Any Relations with Performance? International Journal of Environmental Research and Public Health. 2020; 17(24):9464. https://0-doi-org.brum.beds.ac.uk/10.3390/ijerph17249464
Chicago/Turabian StyleDopsaj, Milivoj, Ilona Judita Zuoziene, Radoje Milić, Evgeni Cherepov, Vadim Erlikh, Nerijus Masiulis, Andrea di Nino, and Janez Vodičar. 2020. "Body Composition in International Sprint Swimmers: Are There Any Relations with Performance?" International Journal of Environmental Research and Public Health 17, no. 24: 9464. https://0-doi-org.brum.beds.ac.uk/10.3390/ijerph17249464