Determining the Shear Strength and Permeability of Soils for Engineering of New Paddy Field Construction in a Hilly Mountainous Region of Southwestern China

 ,
,
Abstract
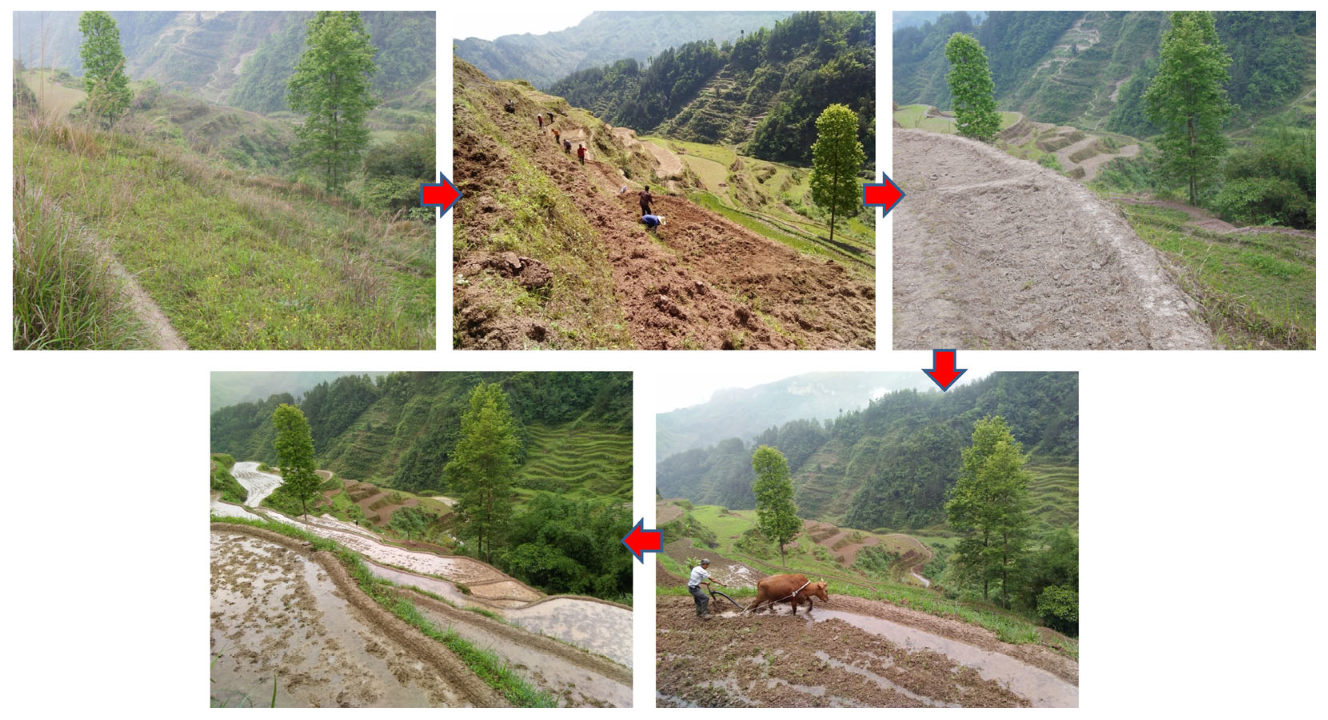
:1. Introduction
2. Materials and Methods
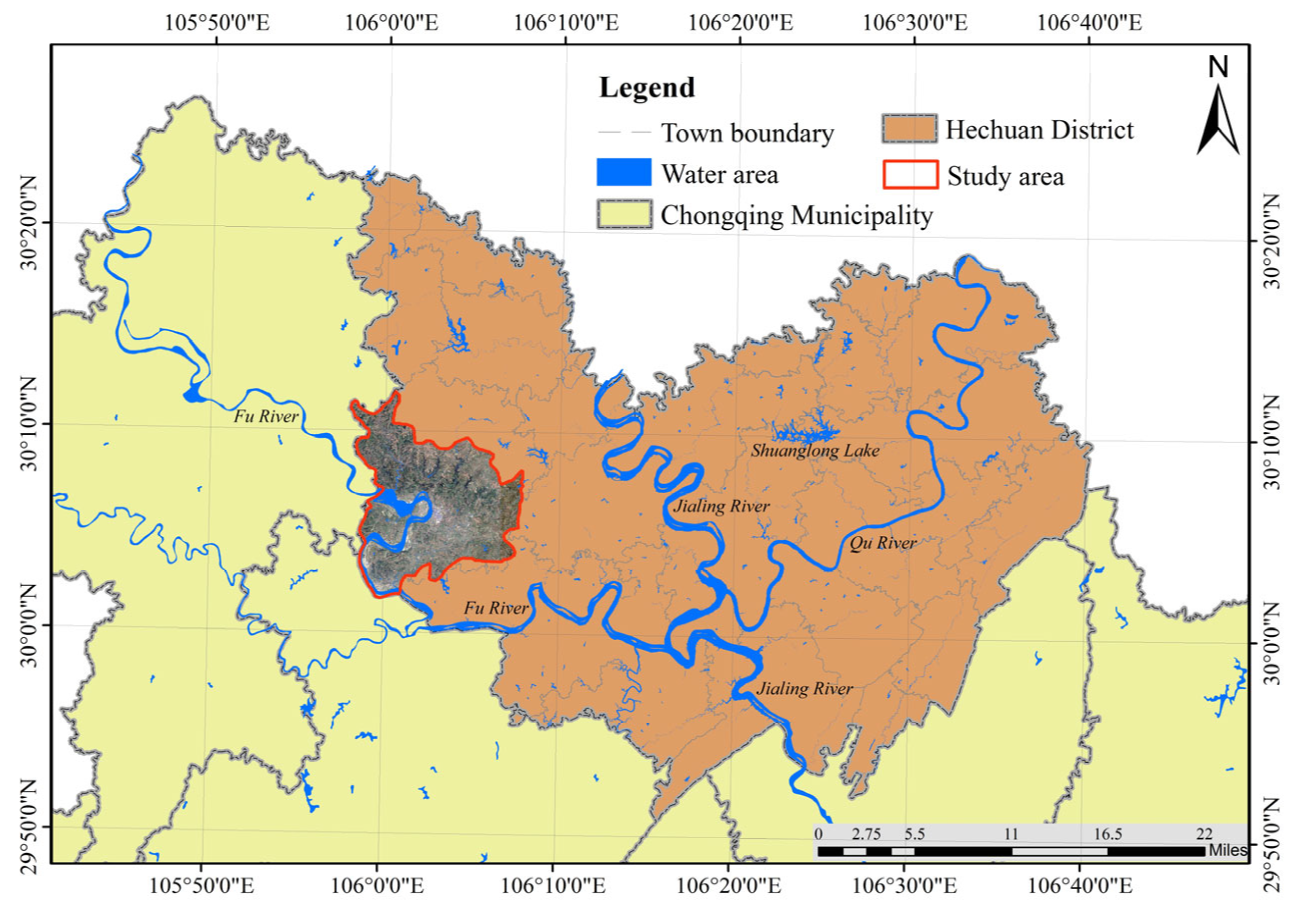
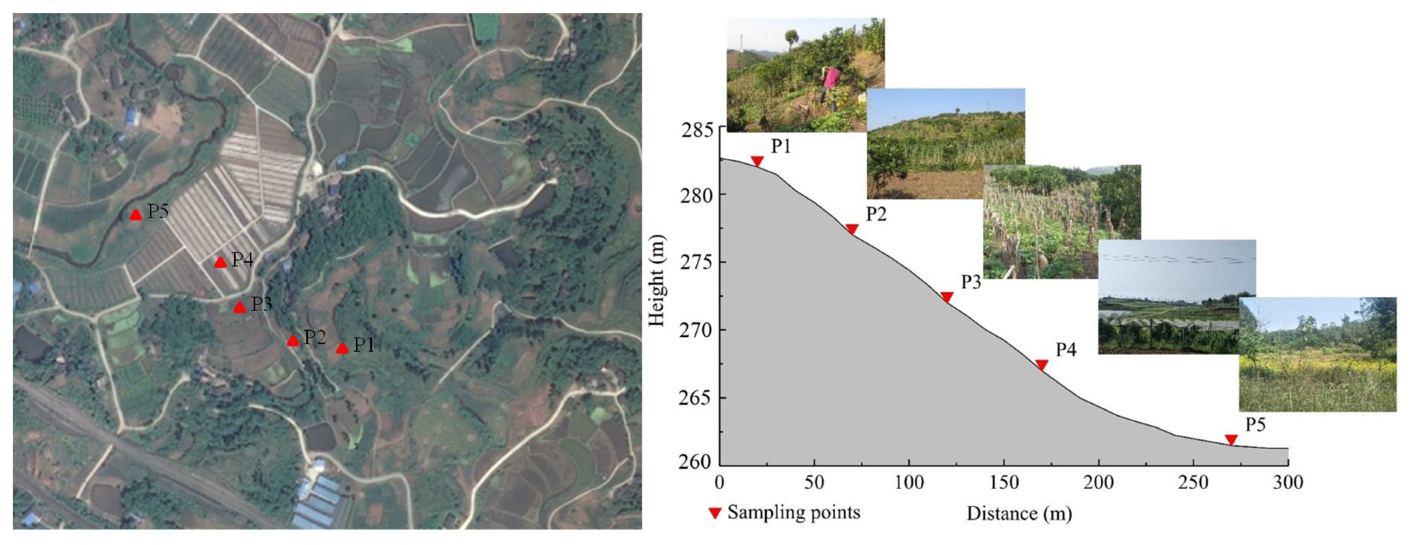
2.1. Study Area and Distribution of Sample Points
2.2. Sampling and Physical Properties of the Test Soils
2.3. The Determination of Permeability Coefficient and Shear Strength Characteristics
3. Results
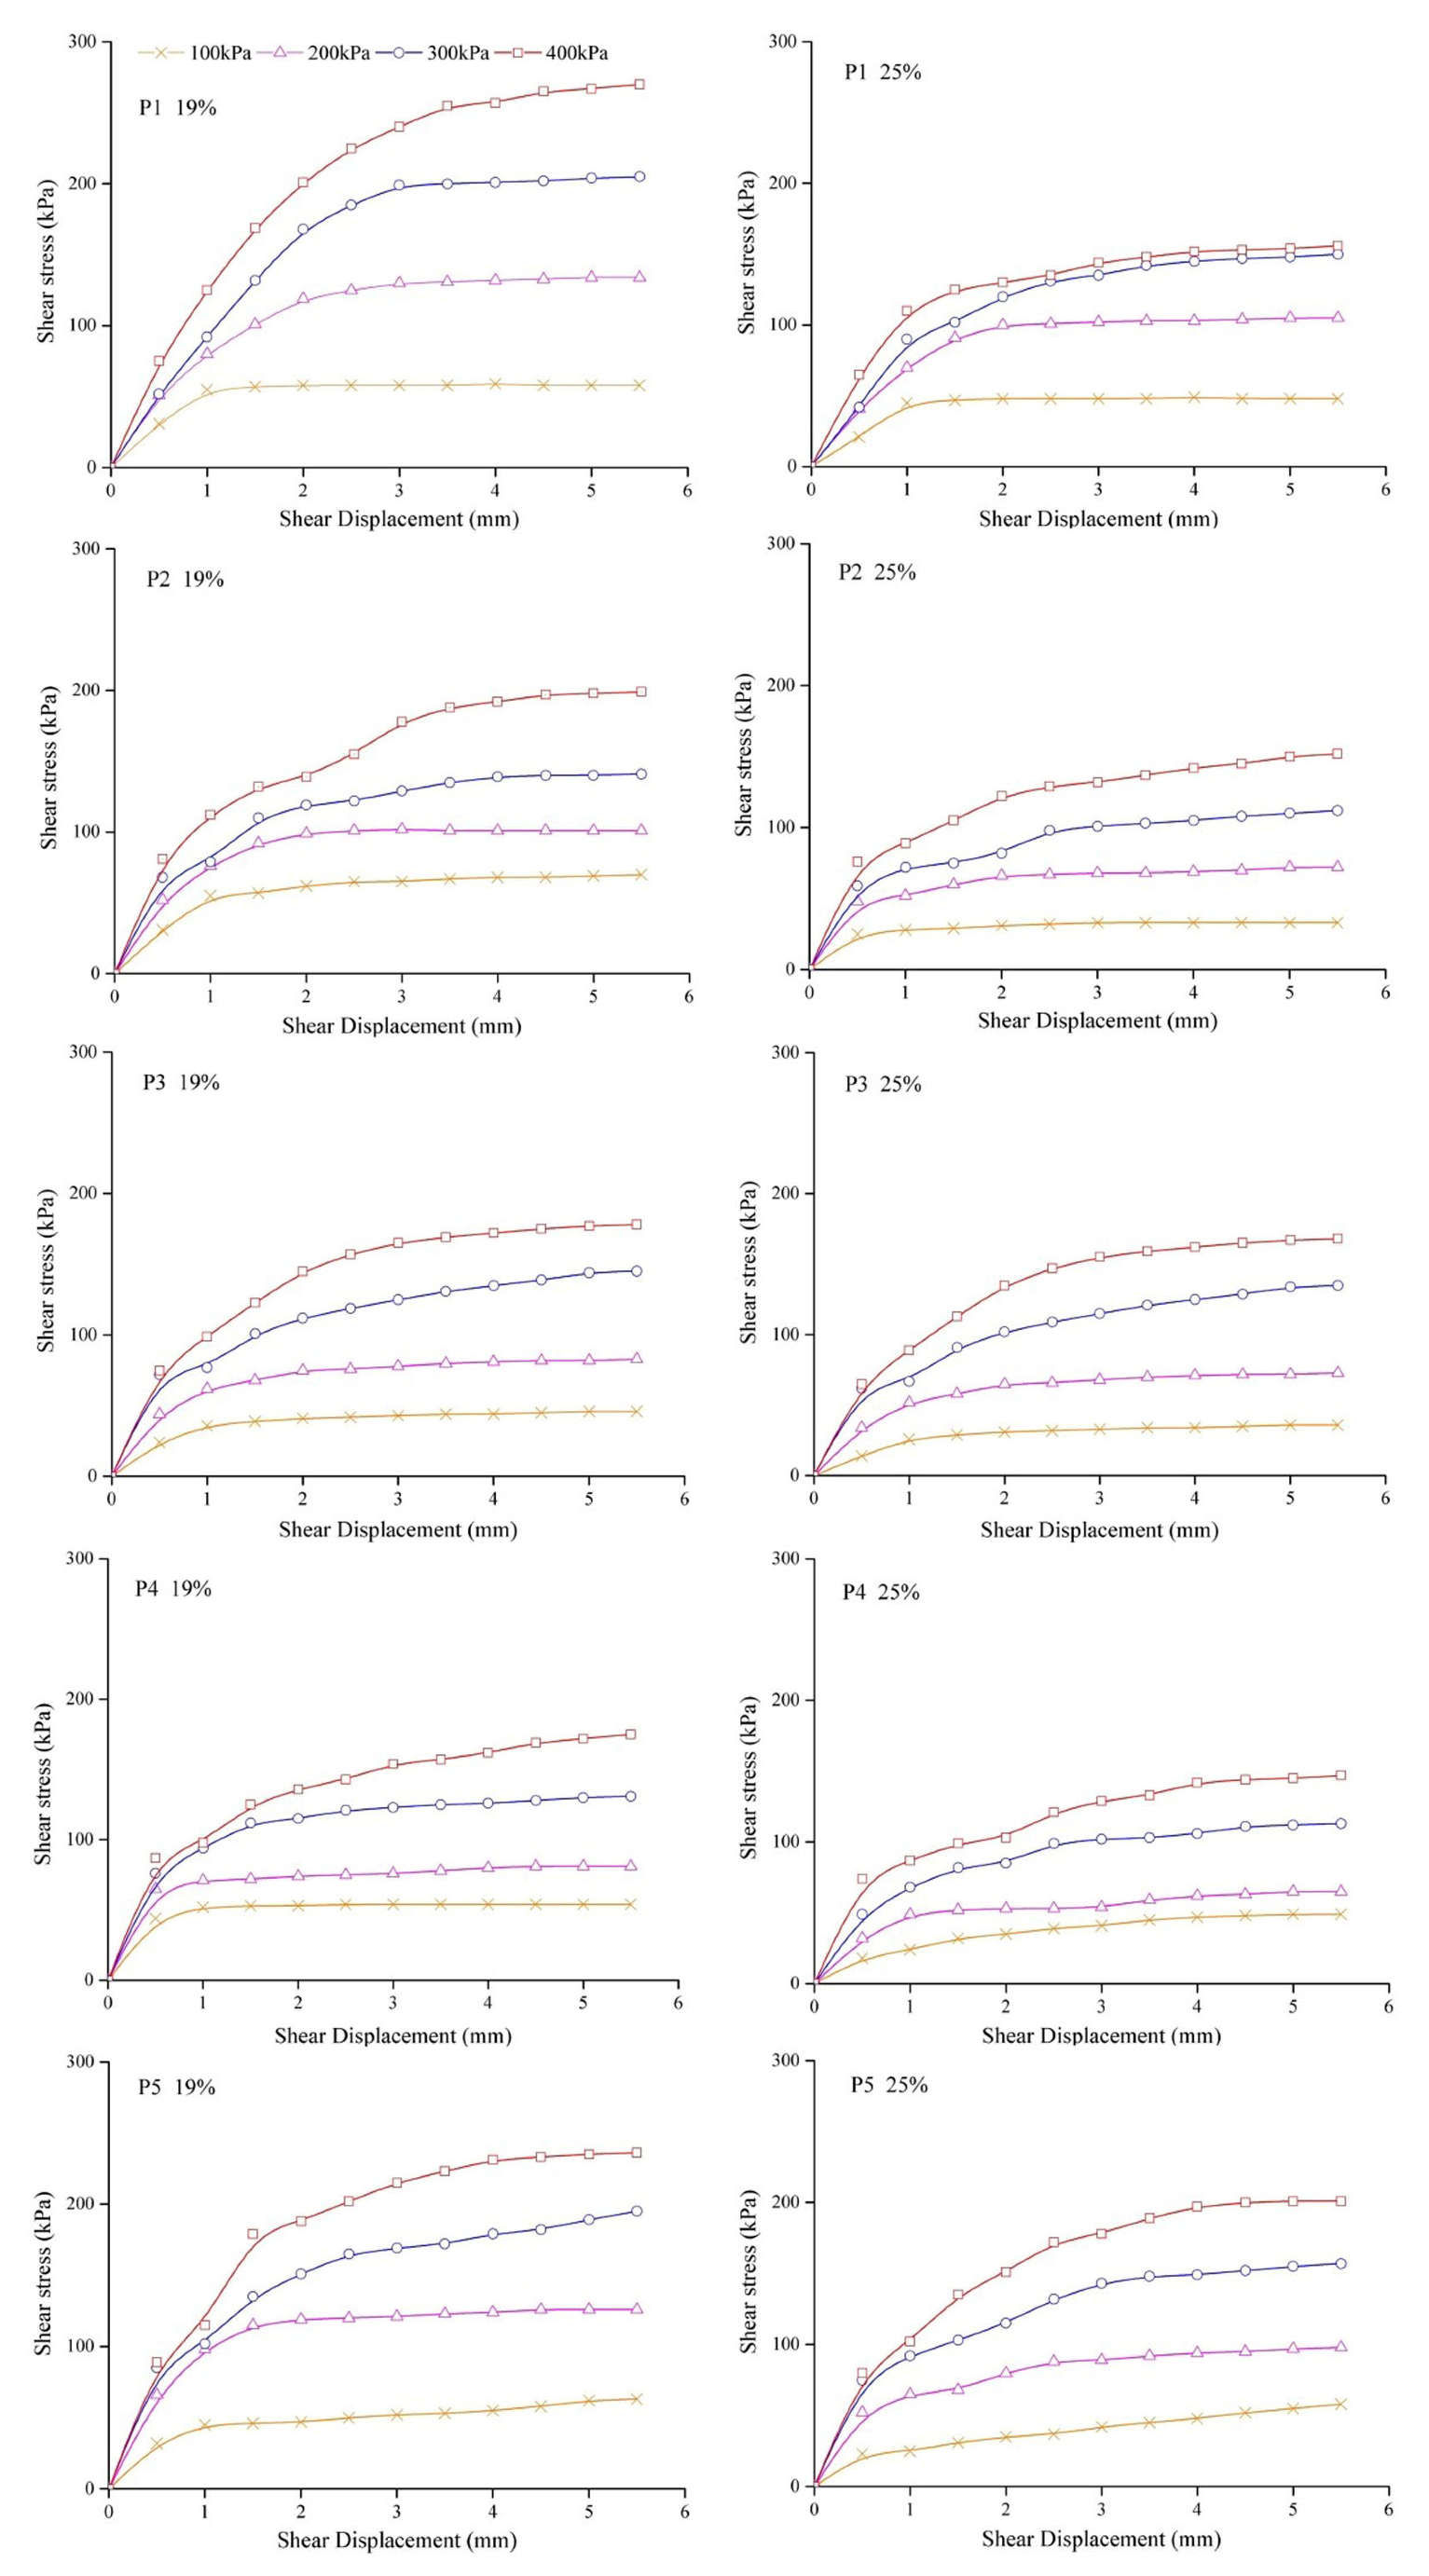
3.1. The Relationship between the Shear Stress and Displacement
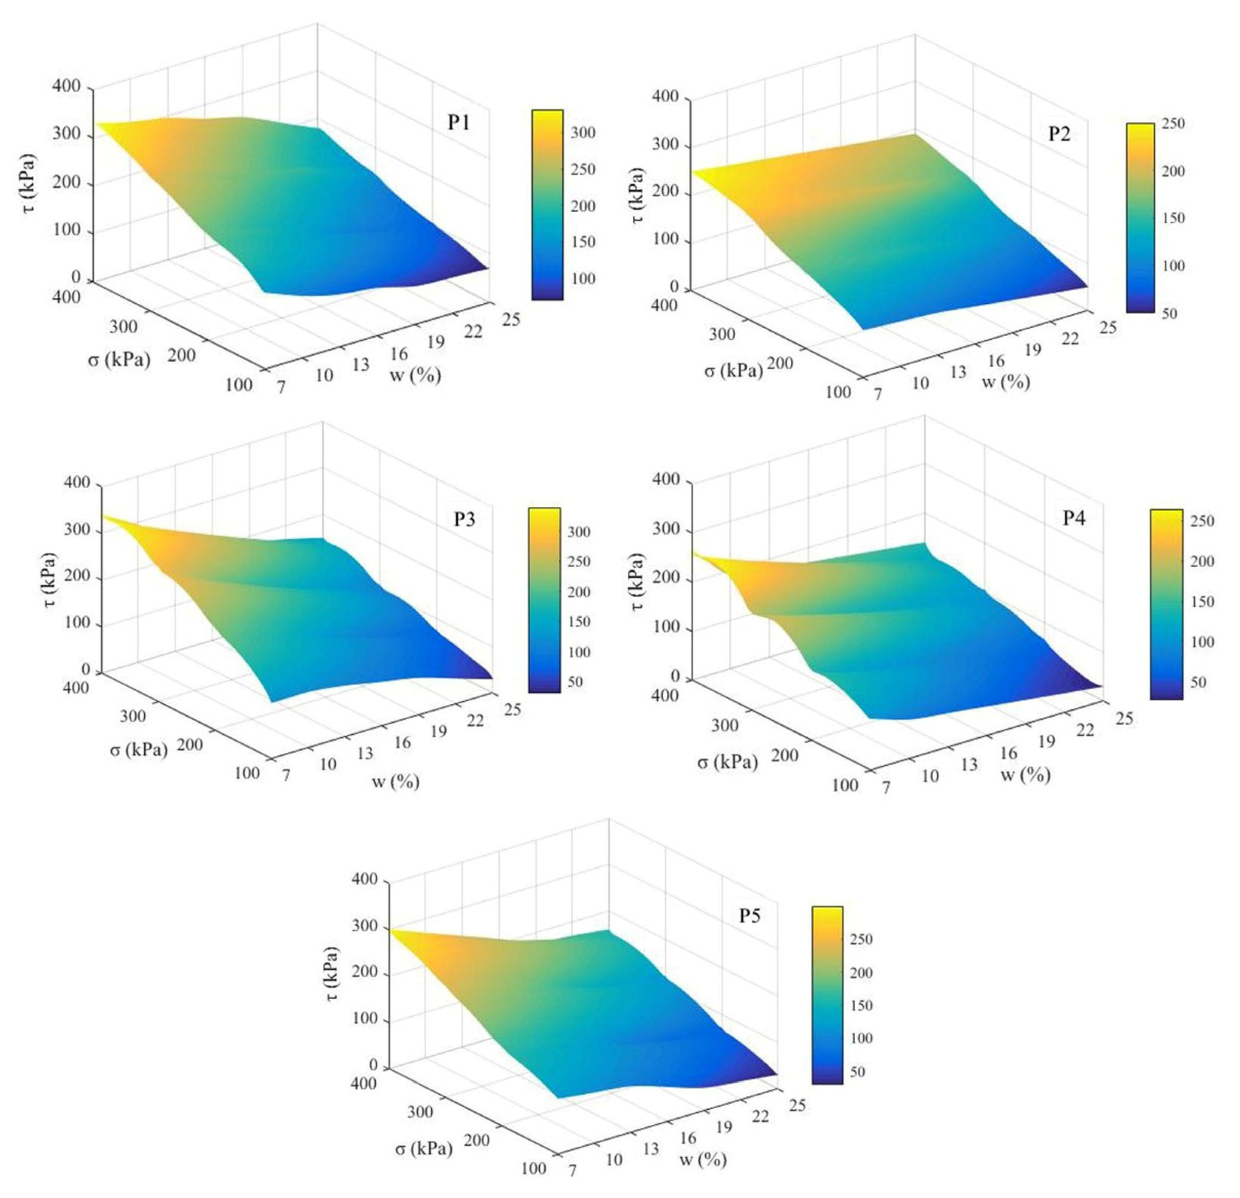
3.2. Effect of Water Content and Vertical Pressure on Shear Strength
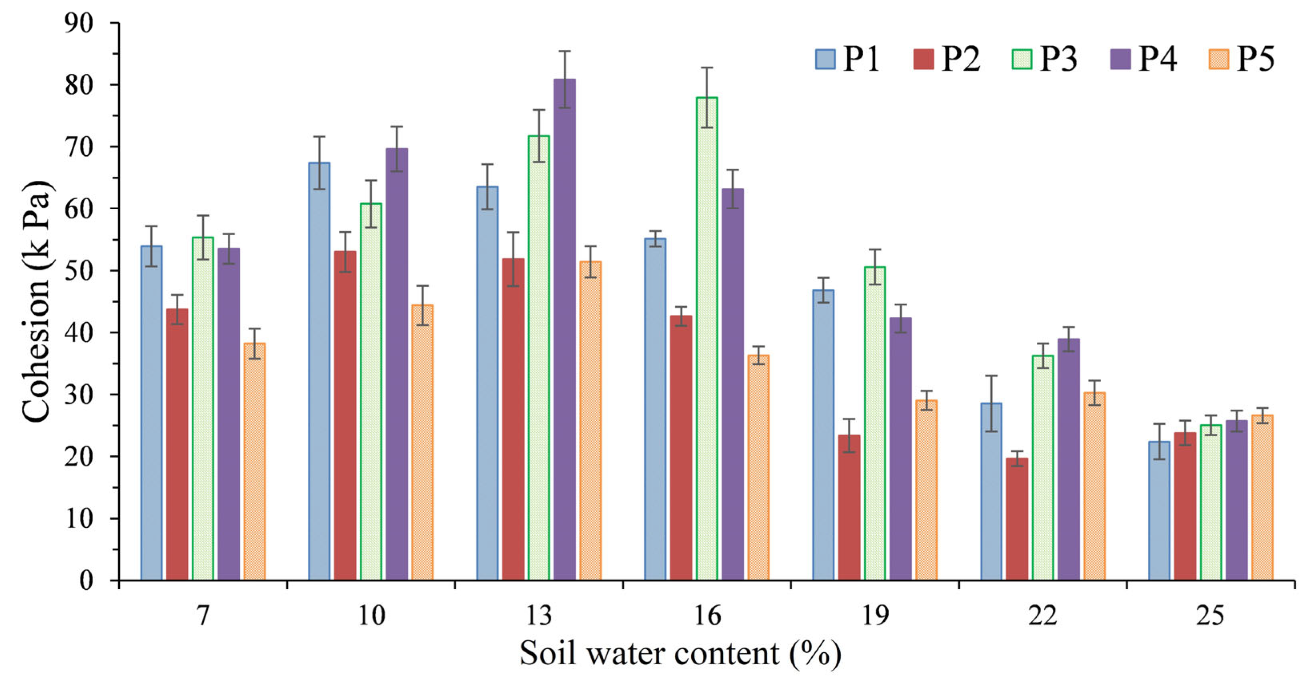
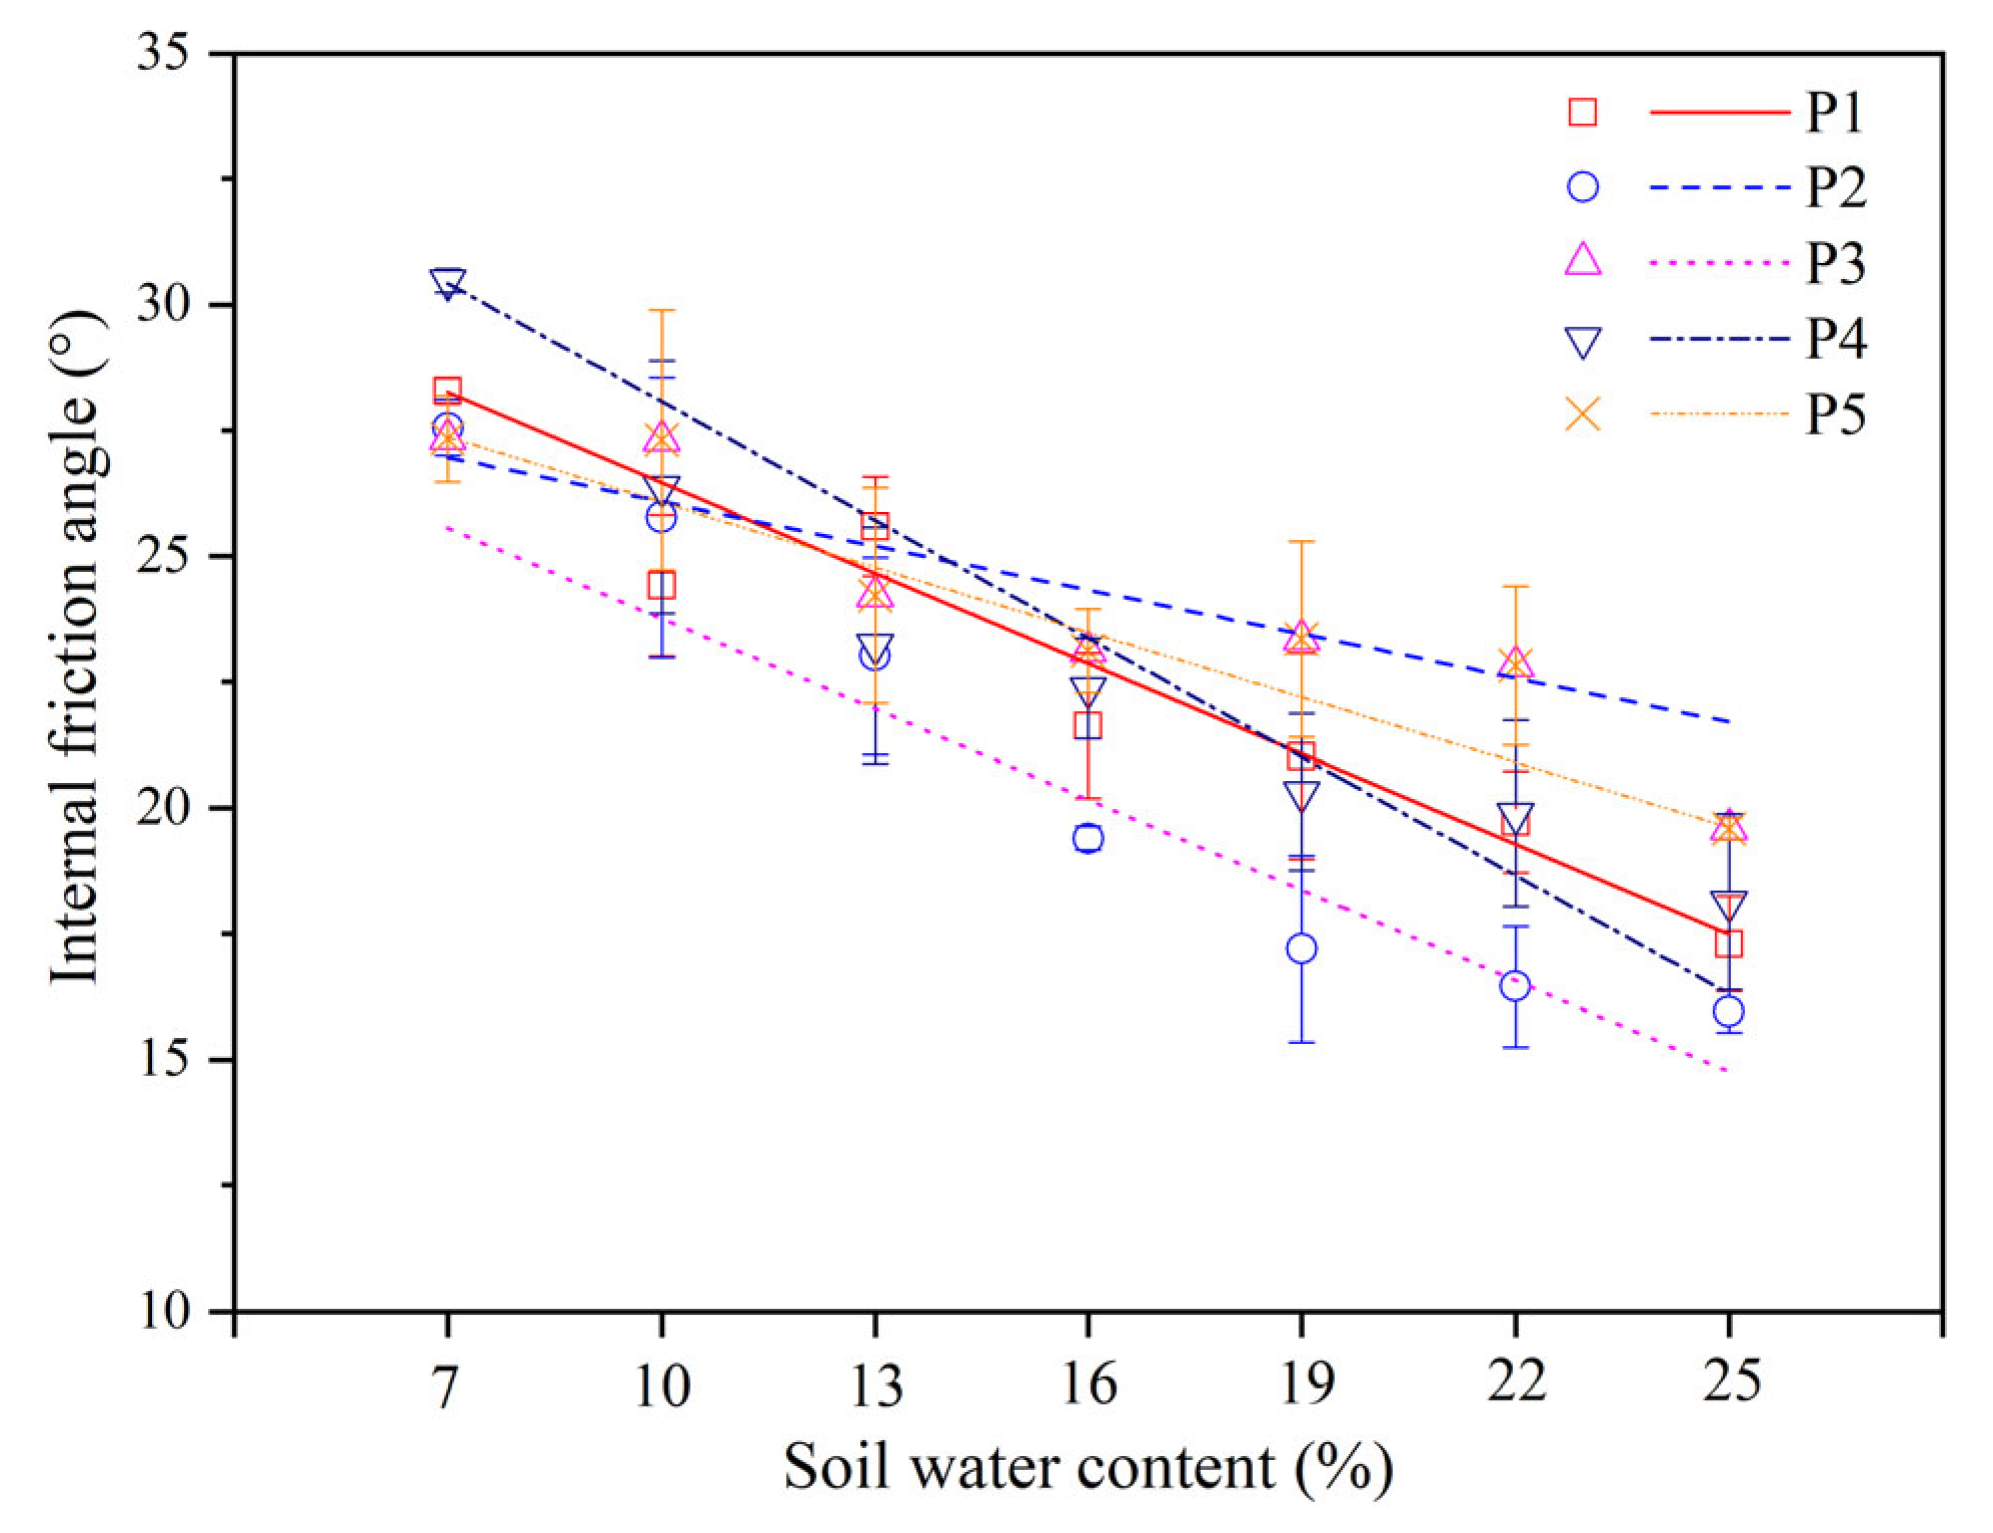
3.3. Water Sensitivity Characteristics of the Shear Strength Parameters
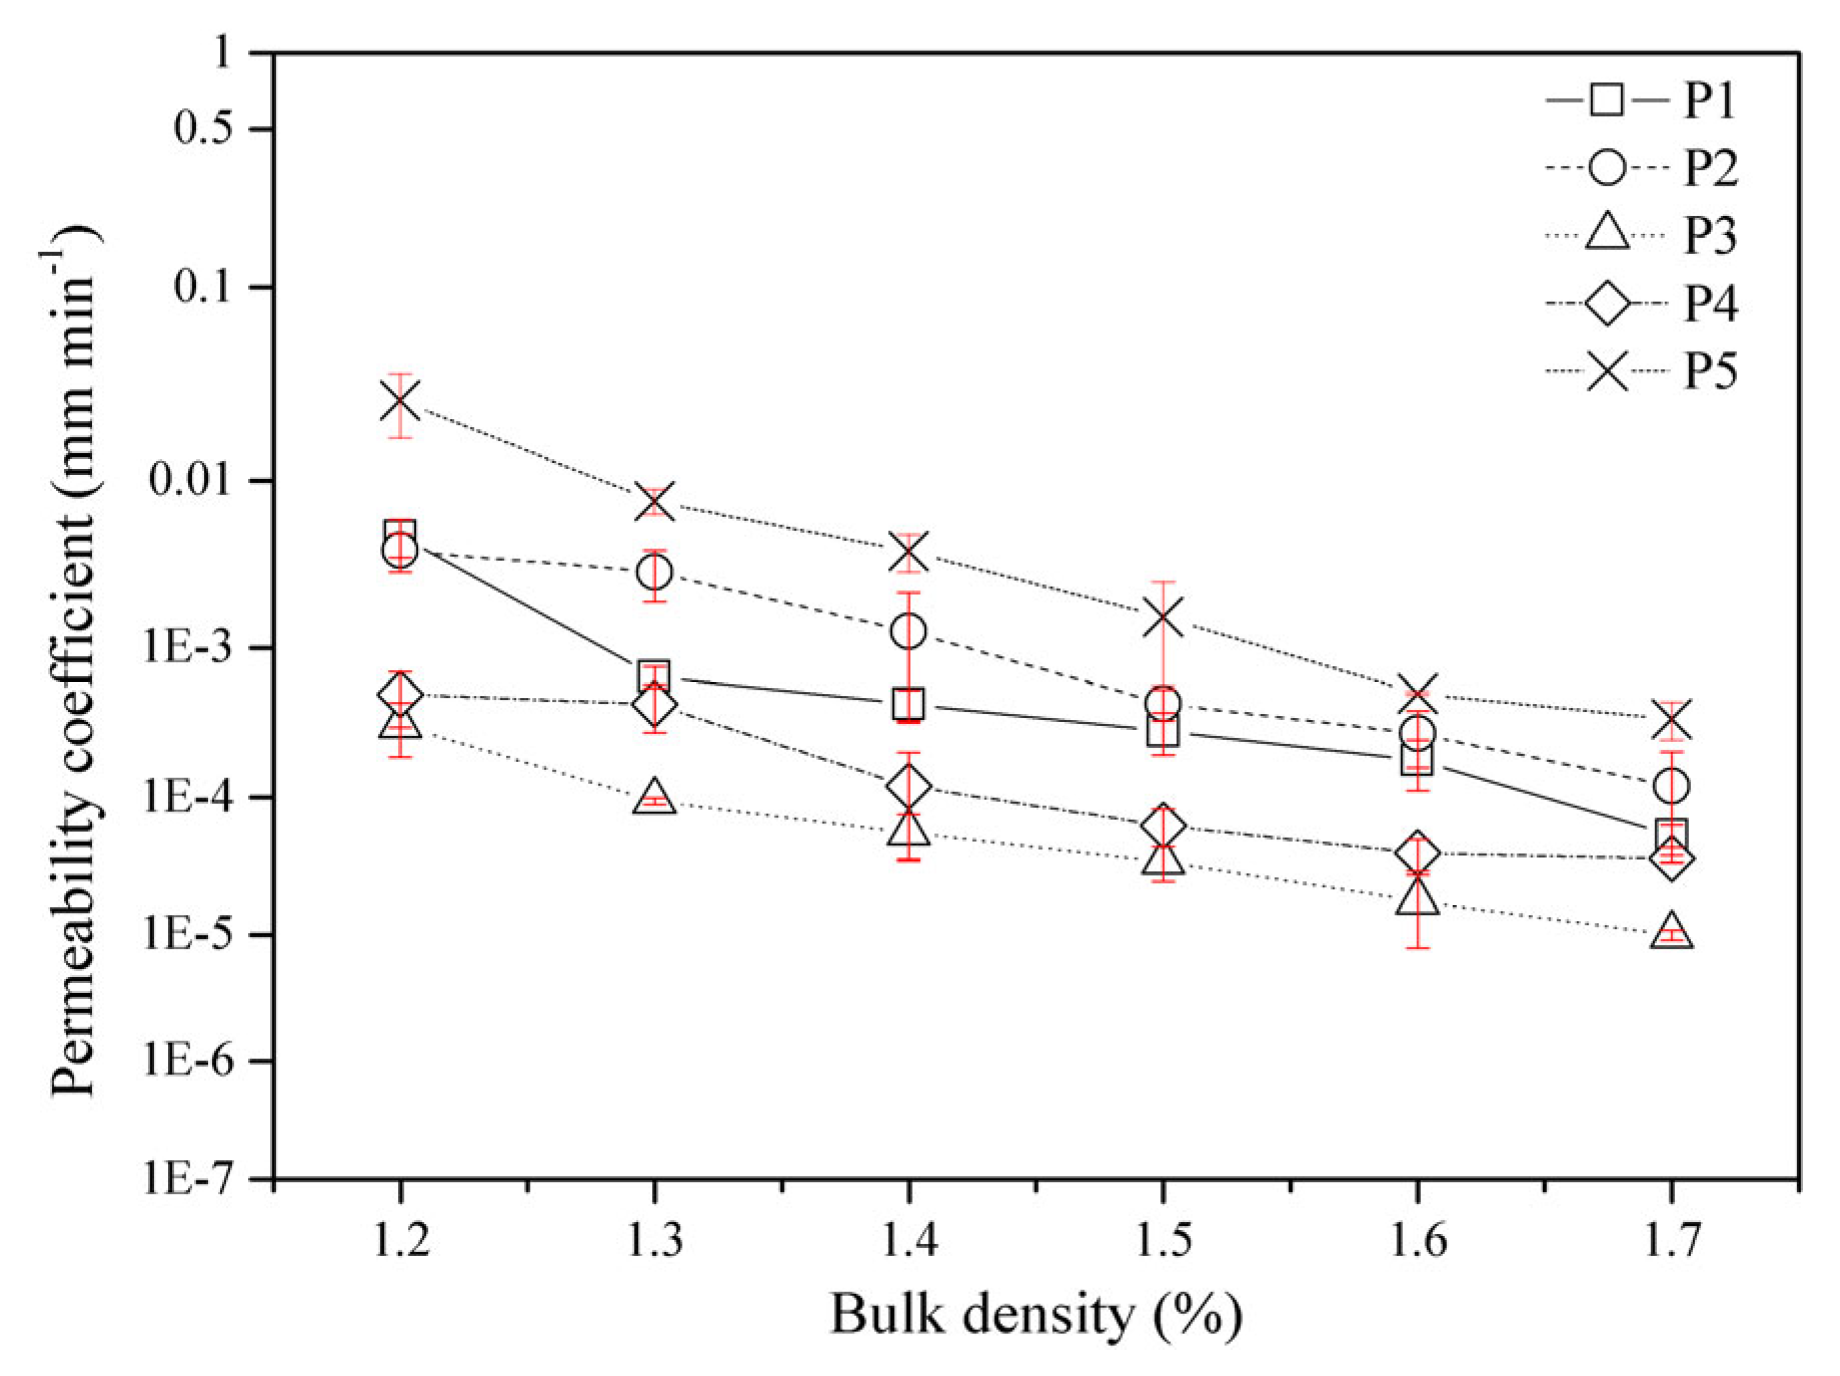
3.4. Permeability Characteristic of the Test Soils
4. Discussion
4.1. The Shear Strength of the Test Soils Decreases Obviously with Increasing Water Content
4.2. The Permeability of Paddy Field Soils Has an Important Influence on the Construction and Operational Processes of Engineering Projects
5. Conclusions
Author Contributions
Funding
Conflicts of Interest
Appendix A

| Sampling Points | Slope Position | Soil Depth (cm) | Soil Moisture Regime | Soil Structure | Plant Root | Animal Activity | Impact of Human Activities | Intrusions |
|---|---|---|---|---|---|---|---|---|
| P1 | Top of hill | 0–15 | Slightly wet | Blocky structure | A few coarse roots, many medium roots | Few earthworms | Mechanical ploughing and planting | Rubbles |
| P2 | shoulder of hill | 0–25 | wet | Aggregate structure | Few coarse roots, fine roots. | Ant colony | Artificial farming | Stones and rubbles |
| P3 | Waist of hill | 0–72 | wet | Granular structure | Few fine roots | - | Mechanical ploughing and planting | - |
| P4 | Foot of hill | 0–90 | Slightly wet | Blocky structure | A few medium roots | - | Mechanical ploughing and planting | Rubbles |
| P5 | Valley of hill | >100 | wet | Blocky structure | Many fine roots | Few earthworms, centipedes | Slight disturbance of vegetation | Stones and rubbles |
References
- Chen, L.M.; Zhang, G.L.; Effland, W.R. Soil characteristic response times and pedogenic thresholds during the 1000-year evolution of a paddy soil chronosequence. Soil Sci. Soc. Am. J. 2011, 75, 1807–1820. [Google Scholar] [CrossRef]
- Goswami, S.B.; Mondal, R.; Mandi, S.K. Crop residue management options in rice-rice system: A review. Arch. Agron. Soil Sci. 2019, 9. [Google Scholar] [CrossRef]
- Kögel-Knabner, I.; Amelung, W.; Cao, Z.H.; Fiedler, S.; Frenzel, P.; Jahn, R.; Kalbitz, K.; Kölbl, A.; Kölbl, M. Biogeochemistry of paddy soils. Geoderma 2010, 157, 1–14. [Google Scholar] [CrossRef]
- Mueller-Niggemann, C.; Utami, S.R.; Marxen, A.; Mangelsdorf, K.; Bauersachs, T.; Schwark, L. Distribution of tetraether lipids in agricultural soils—Differentiation between paddy and upland management. Biogeosciences 2016, 13, 1647–1666. [Google Scholar] [CrossRef] [Green Version]
- Timsina, J.; Connor, D.J. Productivity and management of rice-wheat cropping systems: Issues and challenges. Field Crops Res. 2001, 69, 93–132. [Google Scholar] [CrossRef]
- Xue, B.; Huang, L.; Huang, Y.N.; Zhou, F.L.; Li, F.; Kubar, K.A.; Li, X.K.; Lu, J.W.; Zhu, J. Roles of soil organic carbon and iron oxides on aggregate formation and stability in two paddy soils. Soil Tillage Res. 2019, 187, 161–171. [Google Scholar] [CrossRef]
- FAO (Food and Agricultural Organization of the United Nations). OECD–FAO Agricultural Outlook; OECD: Paris, France, 2009; pp. 2011–2030. [Google Scholar]
- Wang, W.; Lai, D.Y.F.; Wang, C.; Pan, T.; Zeng, C. Effects of rice straw incorporation on active soil organic carbon pools in a subtropical paddy field. Soil Tillage Res. 2015, 152, 8–16. [Google Scholar] [CrossRef]
- Cui, J.; Li, Z.X.; Liu, Z.T.; Ge, B.M.; Fang, C.M.; Zhou, C.L.; Tang, B.P. Physical and chemical stabilization of soil organic carbon along a 500-year cultivated soil chronosequence originating from estuarine wetlands: Temporal patterns and land use effects. Agric. Ecosyst. Environ. 2014, 196, 10–20. [Google Scholar] [CrossRef]
- Bräuer, T.; Grootes, P.M.; Nadeau, M.J. Origin of subsoil carbon in a Chinese paddy soil chronosequence. Radiocarbon 2013, 55, 1058–1070. [Google Scholar] [CrossRef] [Green Version]
- Cao, Z.H. Origin and Evolution of Irrigated Rice Fields and Related Ancient and Present Paddy Soil’s Auality in China; Science Press: Beijing, China, 2015. (In Chinese) [Google Scholar]
- Rachman, A.; Anderson, S.H.; Gantzer, C.J.; Thompson, A.L. Influence of long-term cropping systems on soil physical properties related to soil erodibility. Soil Sci. Soc. Am. J. 2003, 67, 637–644. [Google Scholar] [CrossRef]
- Wei, Y.J.; Wu, X.L.; Xia, J.W.; Miller, G.A.; Cai, C.F.; Guo, Z.L.; Hassanikhah, A. The effect of water content on the shear strength characteristics of granitic soils in South China. Soil Tillage Res. 2019, 187, 50–59. [Google Scholar] [CrossRef]
- Wuddivira, M.N.; Stone, R.J.; Ekwue, E.I. Influence of cohesive and disruptive forces on strength and erodibility of tropical soils. Soil Tillage Res. 2013, 133, 40–48. [Google Scholar] [CrossRef]
- Zhang, B.; Dang, J. Soil Mechanics and Foundation China; Water Resources and Hydropower Press: Beijing, China, 2006. (In Chinese) [Google Scholar]
- Horn, R. Stress-strain effects in structured unsaturated soils on coupled mechanical and hydraulic processes. Geoderma 2003, 116, 77–88. [Google Scholar] [CrossRef]
- Rahardjo, H.; Ong, B.H.; Leong, E.C. Shear strength of a compacted residual soil from consolidated drained and constant water content triaxial tests. Can. Geotech. J. 2004, 41, 421–436. [Google Scholar] [CrossRef]
- Hoyos, L.R.; Velosa, C.L.; Puppala, A.J. Residual shear strength of unsaturated soils via suction-controlled ring shear testing. Eng. Geol. 2014, 172, 1–11. [Google Scholar] [CrossRef]
- Rahardjo, H.; Satyanaga, A.; Leong, E.C.; Ng, Y.S.; Pang, H.T.C. Variability of residual soil properties. Eng. Geol. 2012, 141, 124–140. [Google Scholar] [CrossRef]
- Fasinmirin, J.T.; Olorunfemi, I.E.; Olakuleyin, F. Strength and hydraulics characteristics variations within a tropical Alfisol in Southwestern Nigeria under different land use management. Soil Tillage Res. 2018, 182, 45–56. [Google Scholar] [CrossRef]
- Li, Q.K. Paddy Soils of China; Science Press: Beijing, China, 1992. (In Chinese) [Google Scholar]
- Han, Z.; Wang, X.Y.; Song, D.D.; Li, X.X.; Huang, P.; Ma, M.H. Response of soil erosion and sediment sorting to the transport mechanism on a steep rocky slope. Earth Surf. Process. Landf. 2019, 44, 2467–2478. [Google Scholar] [CrossRef]
- Wei, C.F.; Ni, J.P.; Gao, M.; Xie, D.T.; Hasegawa, S. Anthropic pedogenesis of purple rock fragments in Sichuan Basin, China. Catena 2006, 68, 51–58. [Google Scholar] [CrossRef]
- Dane, J.; Topp, G. Methods of Soil Analysis Part 4 Physical Methods; SSSA Book Series No. 5; SSSA: Madison, WI, USA, 2002. [Google Scholar]
- Zhong, S.Q.; Zhong, M.; Wei, C.F.; Zhang, W.H.; Hu, F.N. Shear strength features of soils developed from purple clay rock and containing less than two-millimeter rock fragments. J. Mt. Sci. 2016, 13, 1464–1480. [Google Scholar] [CrossRef]
- Guo, N.; Zhao, J. The signature of shear-induced anisotropy in granular media. Comput. Geotech. 2013, 47, 1–15. [Google Scholar] [CrossRef]
- Alonso, E.E.; Pereira, J.M.; Vaunat, J.; Olivella, S. A microstructurally based effective stress for unsaturated soils. Geotechnique 2010, 60, 913–925. [Google Scholar] [CrossRef] [Green Version]
- Sadek, M.A.; Chen, Y.; Liu, J. Simulating shear behavior of a sandy soil under different soil conditions. J. Terramech. 2011, 48, 451–458. [Google Scholar] [CrossRef]
- Wei, J.; Shi, B.L.; Li, J.L.; Li, S.S.; He, X.B. Shear strength of purple soil bunds under different soil water contents and dry densities: A case study in the Three Gorges Reservoir Area, China. Catena 2018, 166, 124–133. [Google Scholar] [CrossRef]
- Vannoppen, W.; Vanmaercke, M.; De Baets, S.; Poesen, J. A review of the mechanical effects of plant roots on concentrated flow erosion rates. Earth Sci. Rev. 2015, 150, 666–678. [Google Scholar] [CrossRef] [Green Version]
- Al-Shayea, N.A. The combined effect of clay and moisture content on the behavior of remolded unsaturated soils. Eng. Geol. 2001, 62, 319–342. [Google Scholar] [CrossRef]
- Hu, F.N.; Liu, J.F.; Xu, C.Y.; Wang, Z.L.; Liu, G.; Li, H.; Zhao, S.W. Soil internal forces initiate aggregate breakdown and splash erosion. Geoderma 2018, 320, 43–51. [Google Scholar] [CrossRef]
- Hu, F.N.; Xu, C.Y.; Li, H.; Li, S.; Yu, Z.H.; Li, Y.; He, X.H. Particles interaction forces and their effects on soil aggregates breakdown. Soil Tillage Res. 2015, 147, 1–9. [Google Scholar] [CrossRef]
- Hu, F.N.; Wei, C.F.; Xu, C.Y.; Wei, N.Q.; Zhong, M.; Zhong, S.Q. Water sensitivity of shear strength of purple paddy soils. Trans. CSAE 2013, 29, 107–114. (In Chinese) [Google Scholar] [CrossRef]
- Mitchell, J.K.; Soga, K. Fundamentals of Soil Behavior; John Wiley & Sons: Hoboken, NJ, USA, 2005. [Google Scholar]
- Kwan, A.K.H.; Fung, W.W.S. Roles of water film thickness and SP dosage in rheology and cohesiveness of mortar. Cem. Concr. Compos. 2012, 34, 121–130. [Google Scholar] [CrossRef]


| Sampling Points | Field Types | Soil Texture | Field Area (hm2) /Proportion (%) | Bulk Density (g cm−3)* | Rock Fragment Content (%)* | Particles Distribution (%) | Liquid Limit (%)* | Plastic Limit (%)* | Plasticity Index (%)* | ||
|---|---|---|---|---|---|---|---|---|---|---|---|
| >0.02 mm* | 0.02–0.002 mm* | <0.002 mm* | |||||||||
| P1 | Vegetable field | Loam | 2.29/19.26% | 1.34 ± 0.03 | 5.63 ± 0.08 | 41.91 ± 2.53 | 47.93 ± 2.45 | 10.17 ± 0.08 | 42.74 ± 0.03 | 30.71 ± 2.63 | 12.03 ± 0.11 |
| P2 | Gentle slope dryland | 2.69/22.62% | 1.23 ± 0.02 | 7.56 ± 0.98 | 40.89 ± 0.95 | 49.51 ± 1.15 | 9.60 ± 0.20 | 41.56 ± 0.21 | 31.28 ± 0.89 | 10.28 ± 0.02 | |
| P3 | Corn field | 2.48/20.86% | 1.56 ± 0.05 | 2.14 ± 0.11 | 42.83 ± 0.01 | 34.49 ± 0.65 | 22.68 ± 0.64 | 46.28 ± 2.12 | 29.31 ± 1.45 | 16.97 ± 0.33 | |
| P4 | Grapery | 2.26/19.01% | 1.48 ± 0.03 | 6.05 ± 0.32 | 45.78 ± 0.24 | 33.45 ± 0.85 | 20.77 ± 2.11 | 44.23 ± 2.31 | 30.02 ± 1.33 | 14.21 ± 0.22 | |
| P5 | Abandoned land | 2.17/18.25% | 1.36 ± 0.02 | 13.39 ± 1.12 | 41.04 ± 4.81 | 49.54 ± 4.51 | 9.42 ± 0.30 | 40.78 ± 5.23 | 31.52 ± 1.25 | 12.26 ± 0.18 | |
| Sampling Points | Fitting Equation | Adj-R2 | F value | Prob>F |
|---|---|---|---|---|
| P1 | Φ = −0.60w + 32.44 | 0.98 | 255.60 | 1.74 × 10⁻⁵ |
| P2 | Φ = −0.29w + 29.00 | 0.99 | 478.40 | 3.70 × 10⁻⁶ |
| P3 | Φ = −0.60w + 29.76 | 0.87 | 40.87 | 1.39 × 10⁻³ |
| P4 | Φ =−0.78w + 35.91 | 0.97 | 203.37 | 3.05 × 10⁻⁵ |
| P5 | Φ = −0.43w + 30.37 | 0.97 | 217.42 | 2.59 × 10⁻⁵ |
| Sampling Points | Fitting Equation | |
|---|---|---|
| 7%≤w≤13% | 13%≤w≤25% | |
| P1 | ||
| P2 | ||
| P3 | ||
| P4 | ||
| P5 | ||
© 2020 by the authors. Licensee MDPI, Basel, Switzerland. This article is an open access article distributed under the terms and conditions of the Creative Commons Attribution (CC BY) license (http://creativecommons.org/licenses/by/4.0/).
Share and Cite
Han, Z.; Li, J.; Gao, P.; Huang, B.; Ni, J.; Wei, C. Determining the Shear Strength and Permeability of Soils for Engineering of New Paddy Field Construction in a Hilly Mountainous Region of Southwestern China. Int. J. Environ. Res. Public Health 2020, 17, 1555. https://0-doi-org.brum.beds.ac.uk/10.3390/ijerph17051555
Han Z, Li J, Gao P, Huang B, Ni J, Wei C. Determining the Shear Strength and Permeability of Soils for Engineering of New Paddy Field Construction in a Hilly Mountainous Region of Southwestern China. International Journal of Environmental Research and Public Health. 2020; 17(5):1555. https://0-doi-org.brum.beds.ac.uk/10.3390/ijerph17051555
Chicago/Turabian StyleHan, Zhen, Jiangwen Li, Pengfei Gao, Bangwei Huang, Jiupai Ni, and Chaofu Wei. 2020. "Determining the Shear Strength and Permeability of Soils for Engineering of New Paddy Field Construction in a Hilly Mountainous Region of Southwestern China" International Journal of Environmental Research and Public Health 17, no. 5: 1555. https://0-doi-org.brum.beds.ac.uk/10.3390/ijerph17051555