Assessing Drinking Water Quality at the Point of Collection and within Household Storage Containers in the Hilly Rural Areas of Mid and Far-Western Nepal


Abstract
:1. Introduction
2. Method
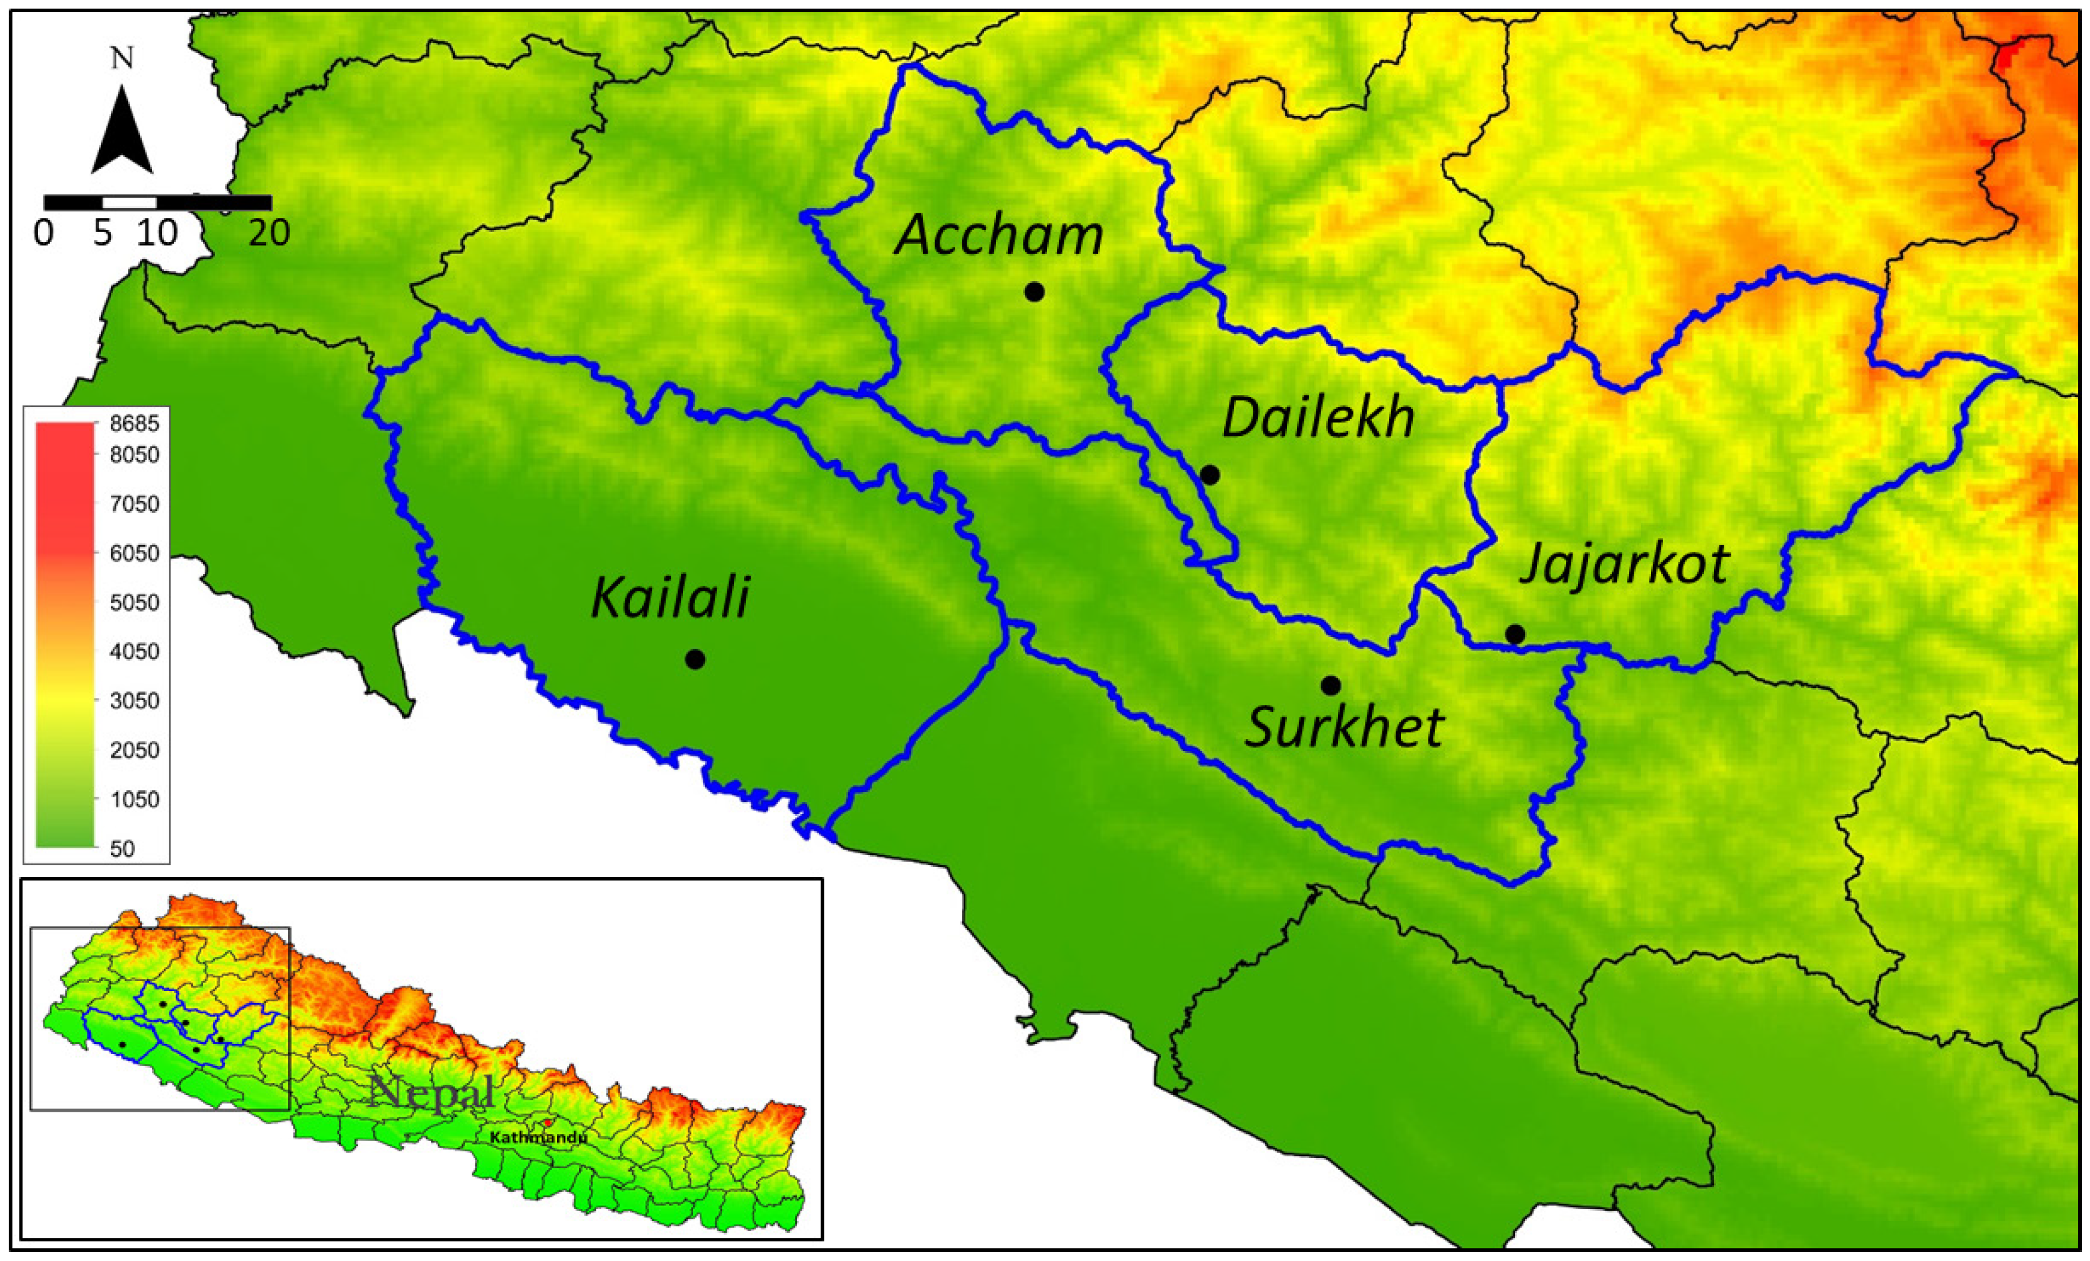
2.1. Study Setting
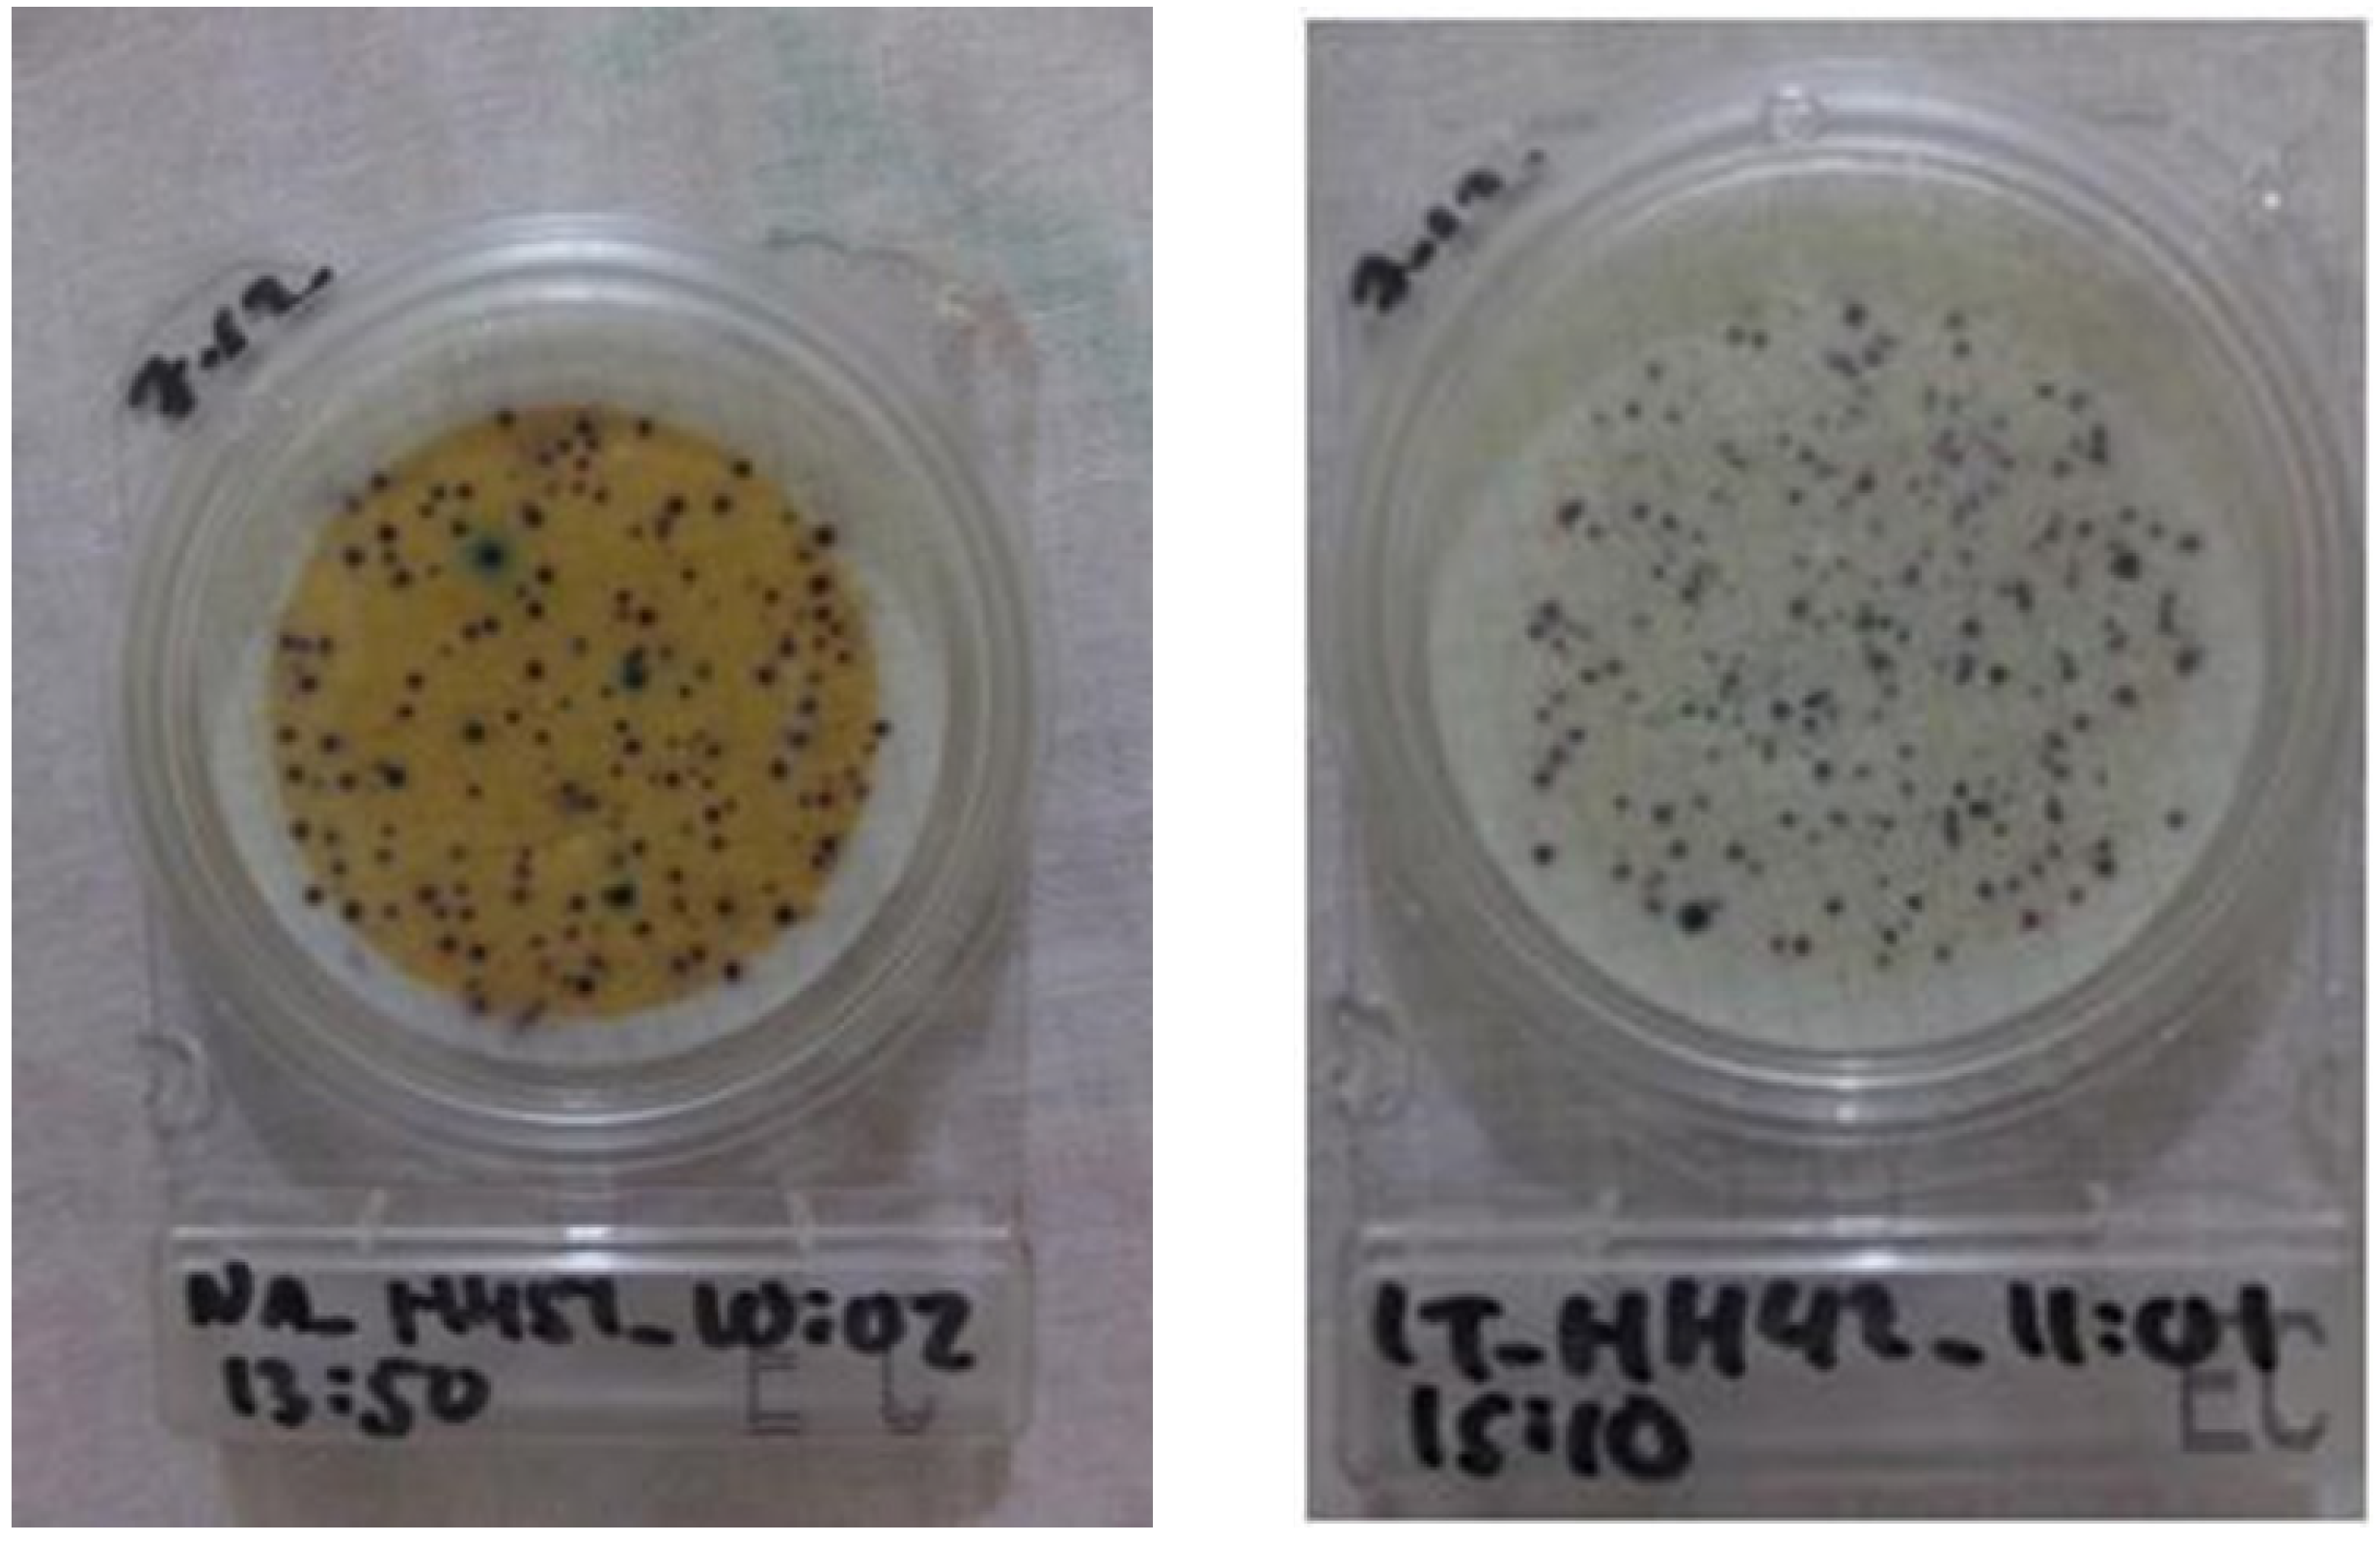
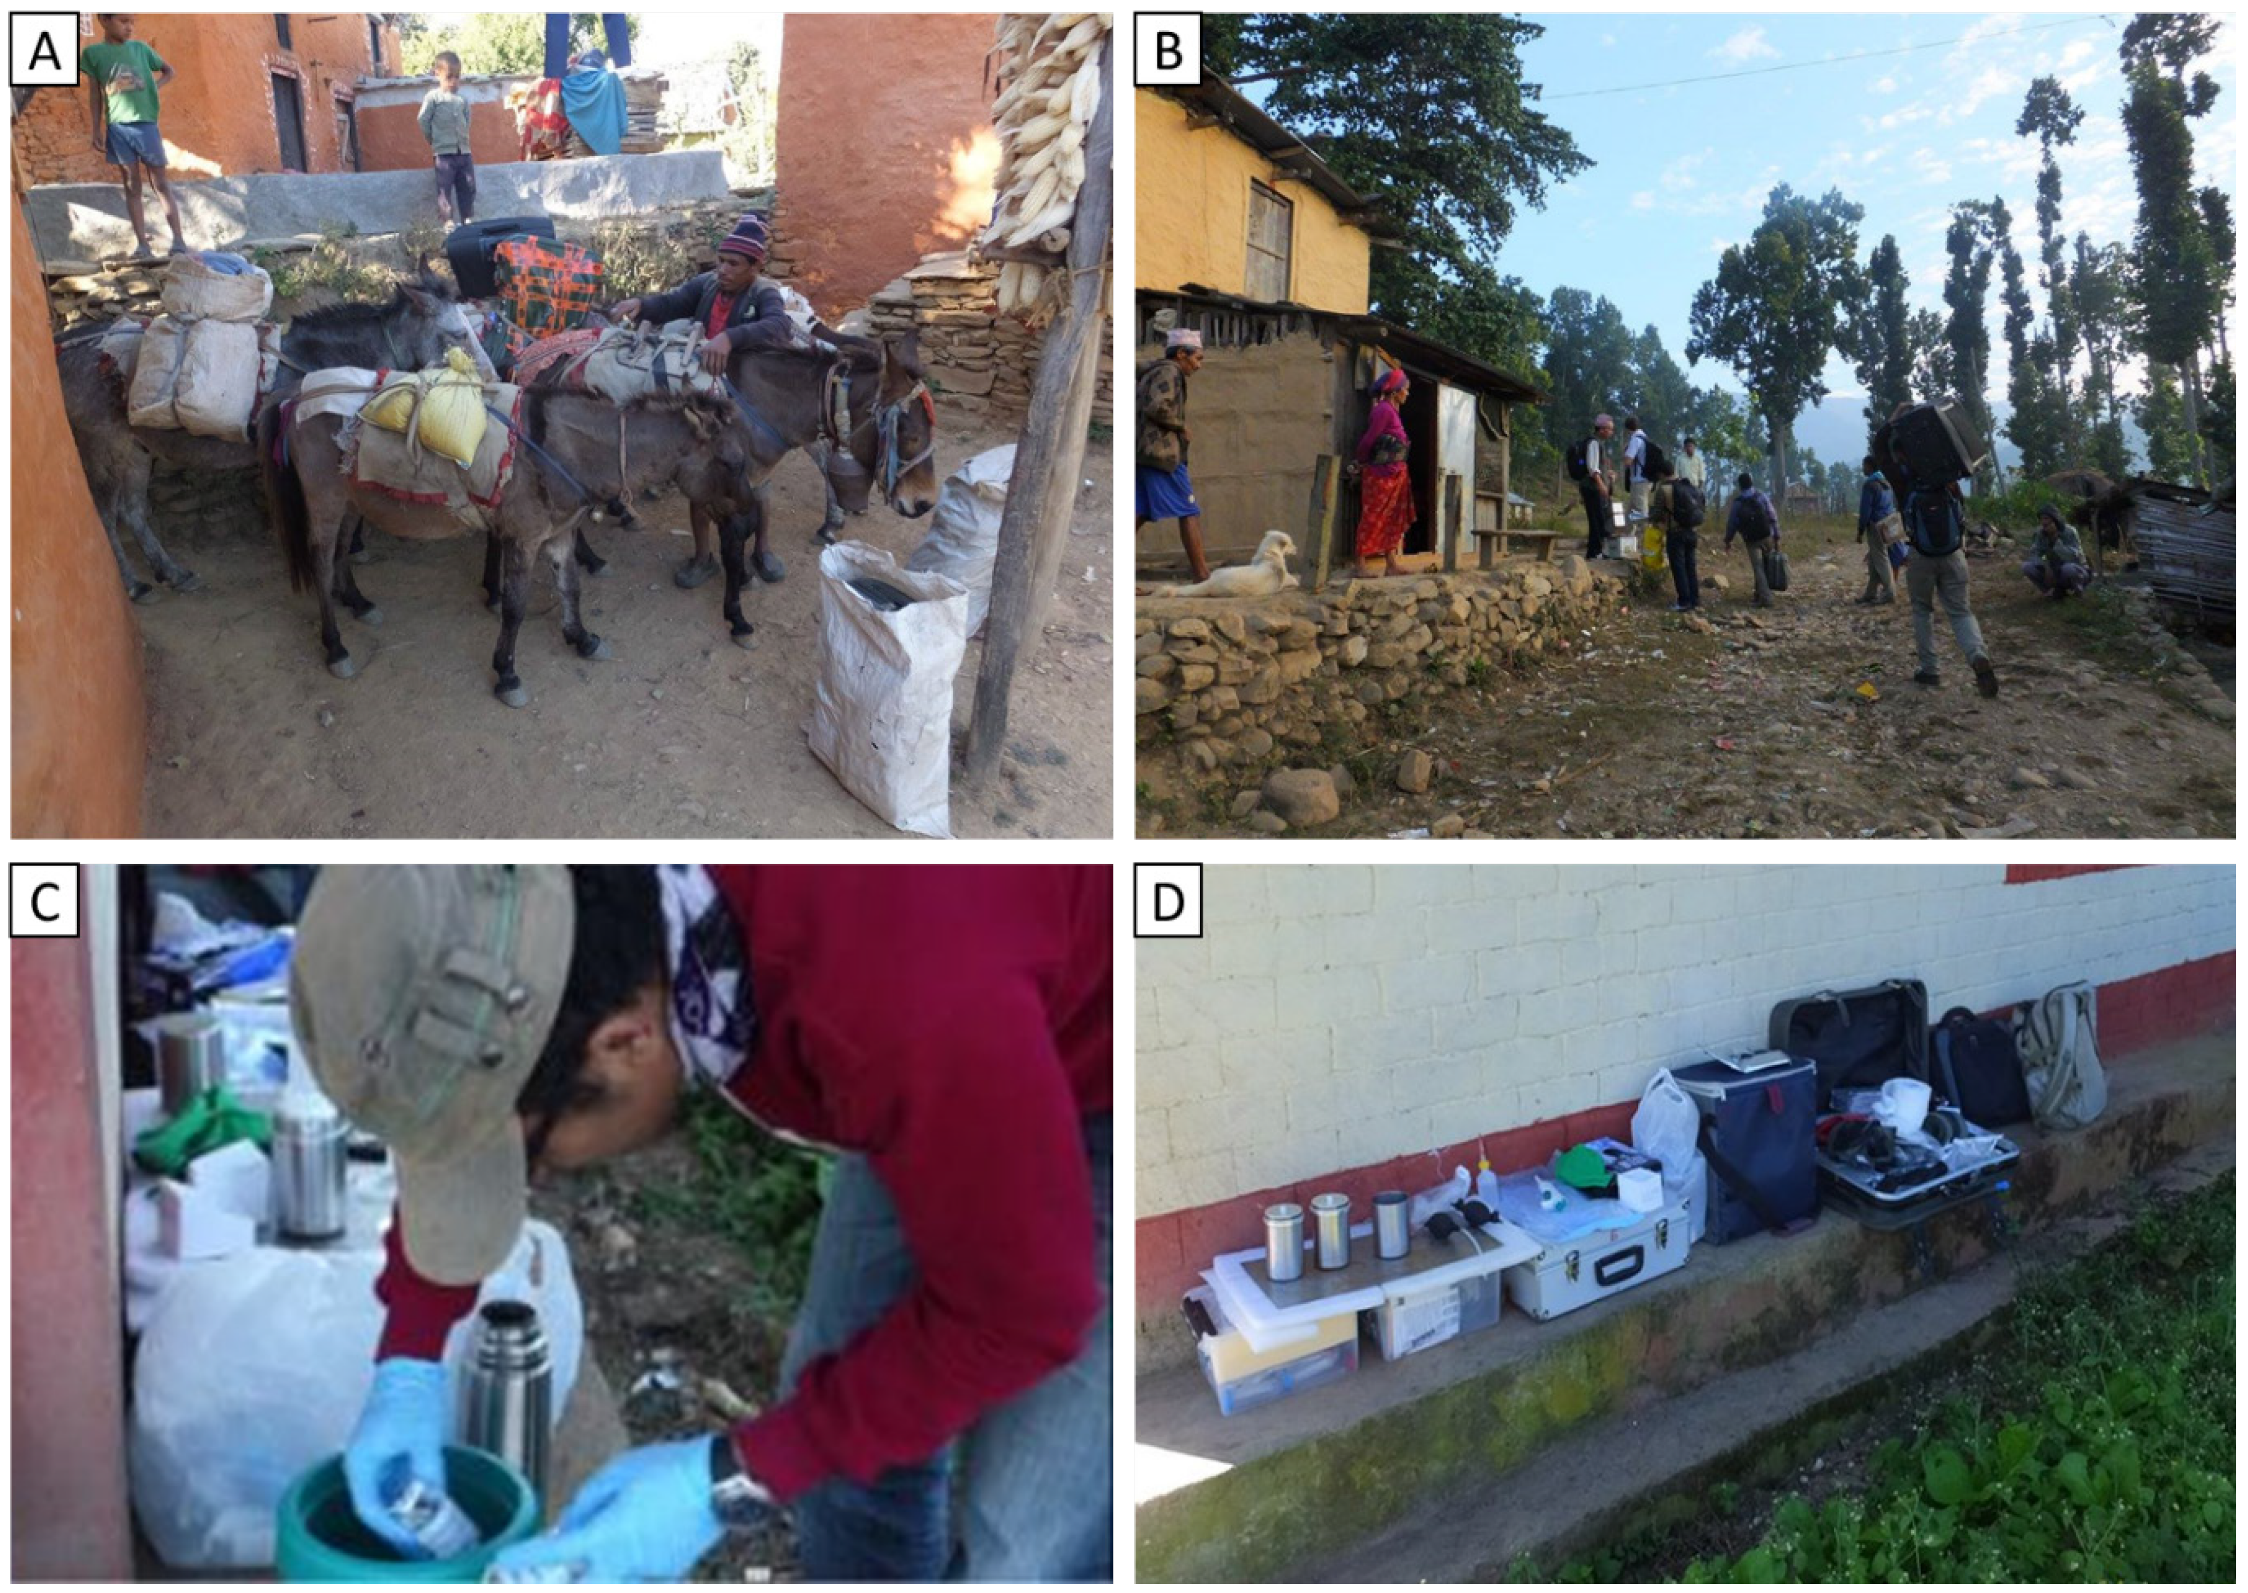
2.2. Water-Quality Testing
2.3. Data Analysis
3. Results
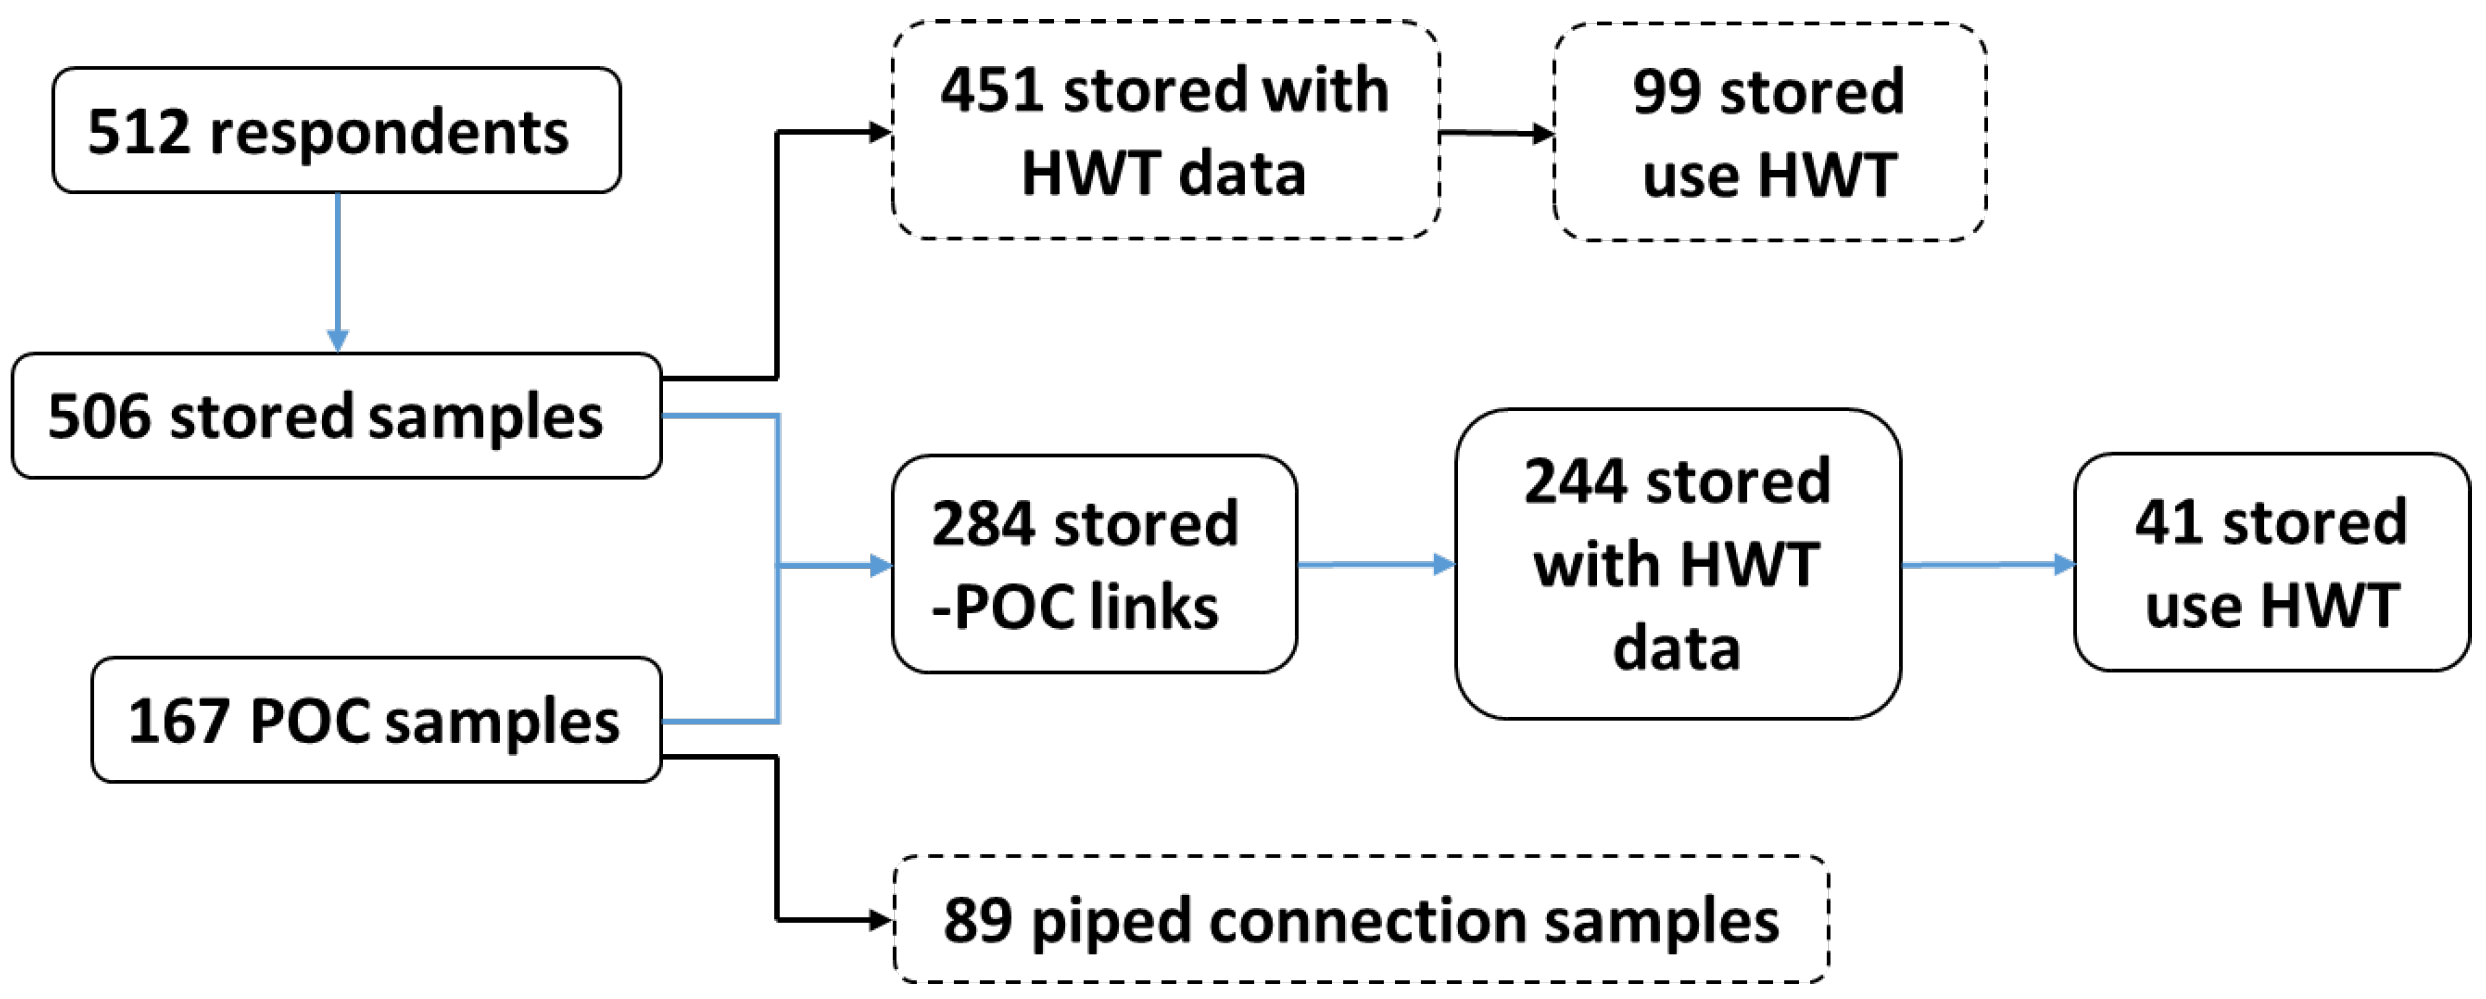
3.1. Household Characteristics
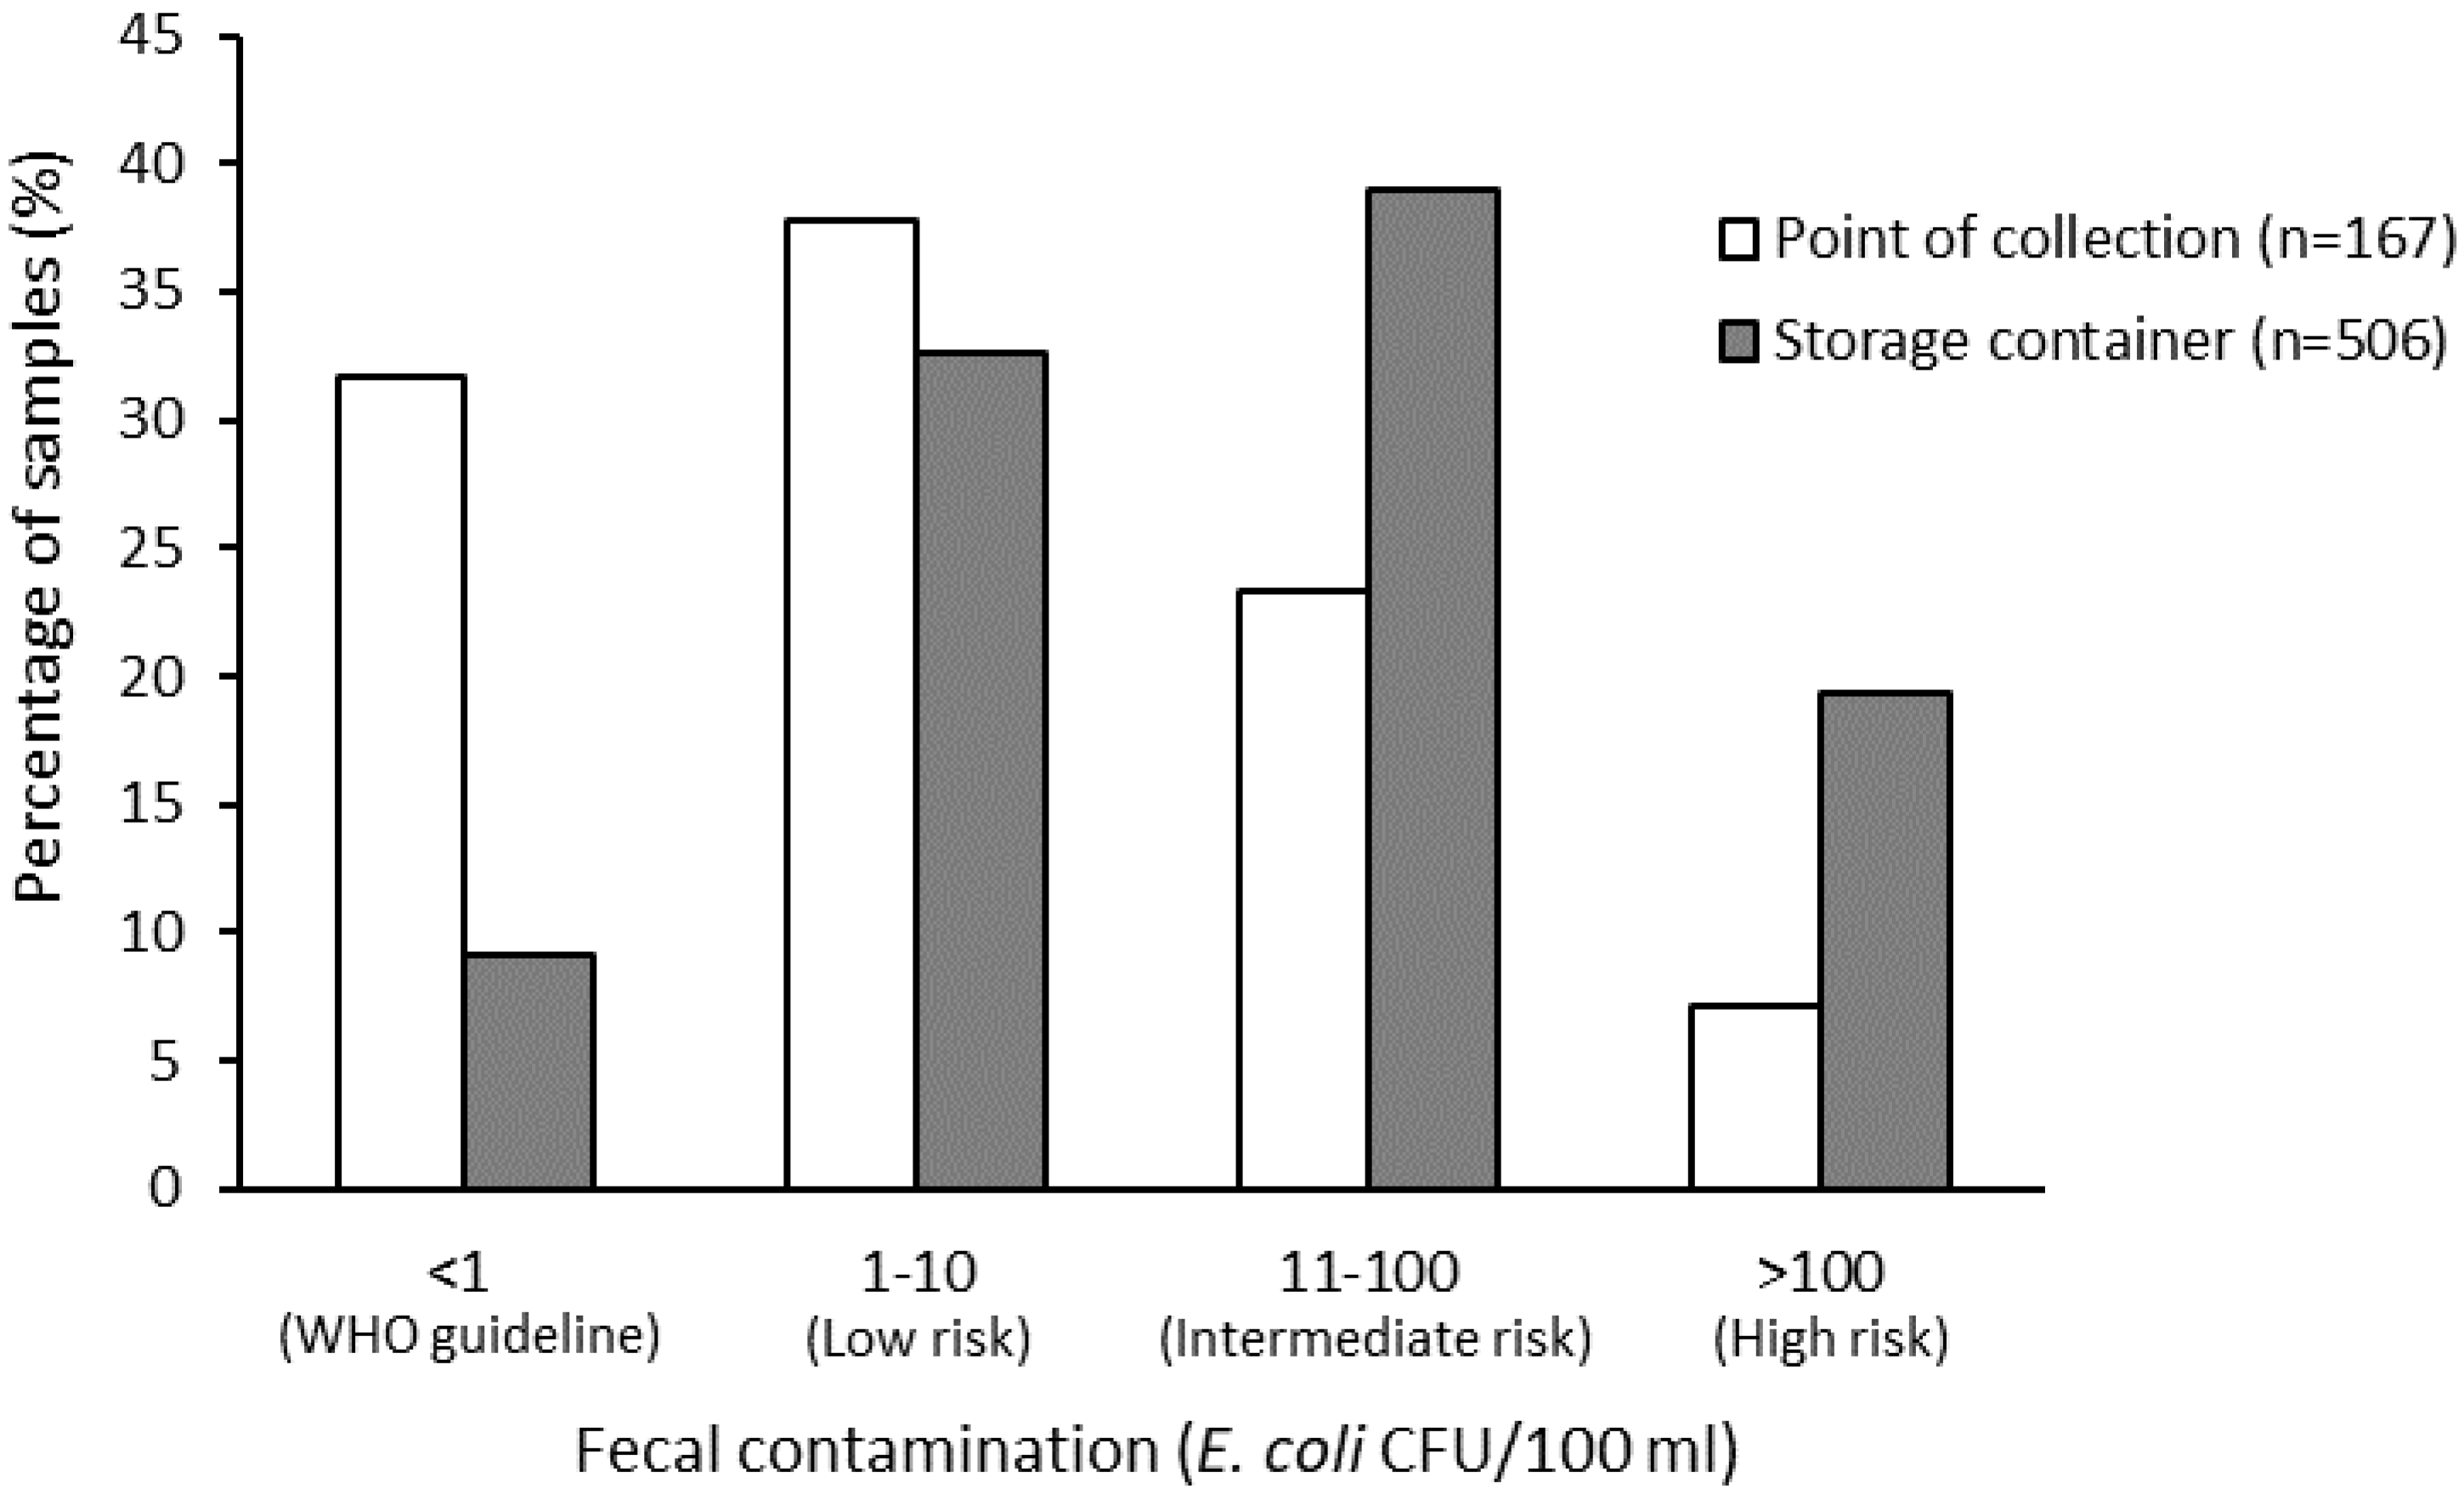
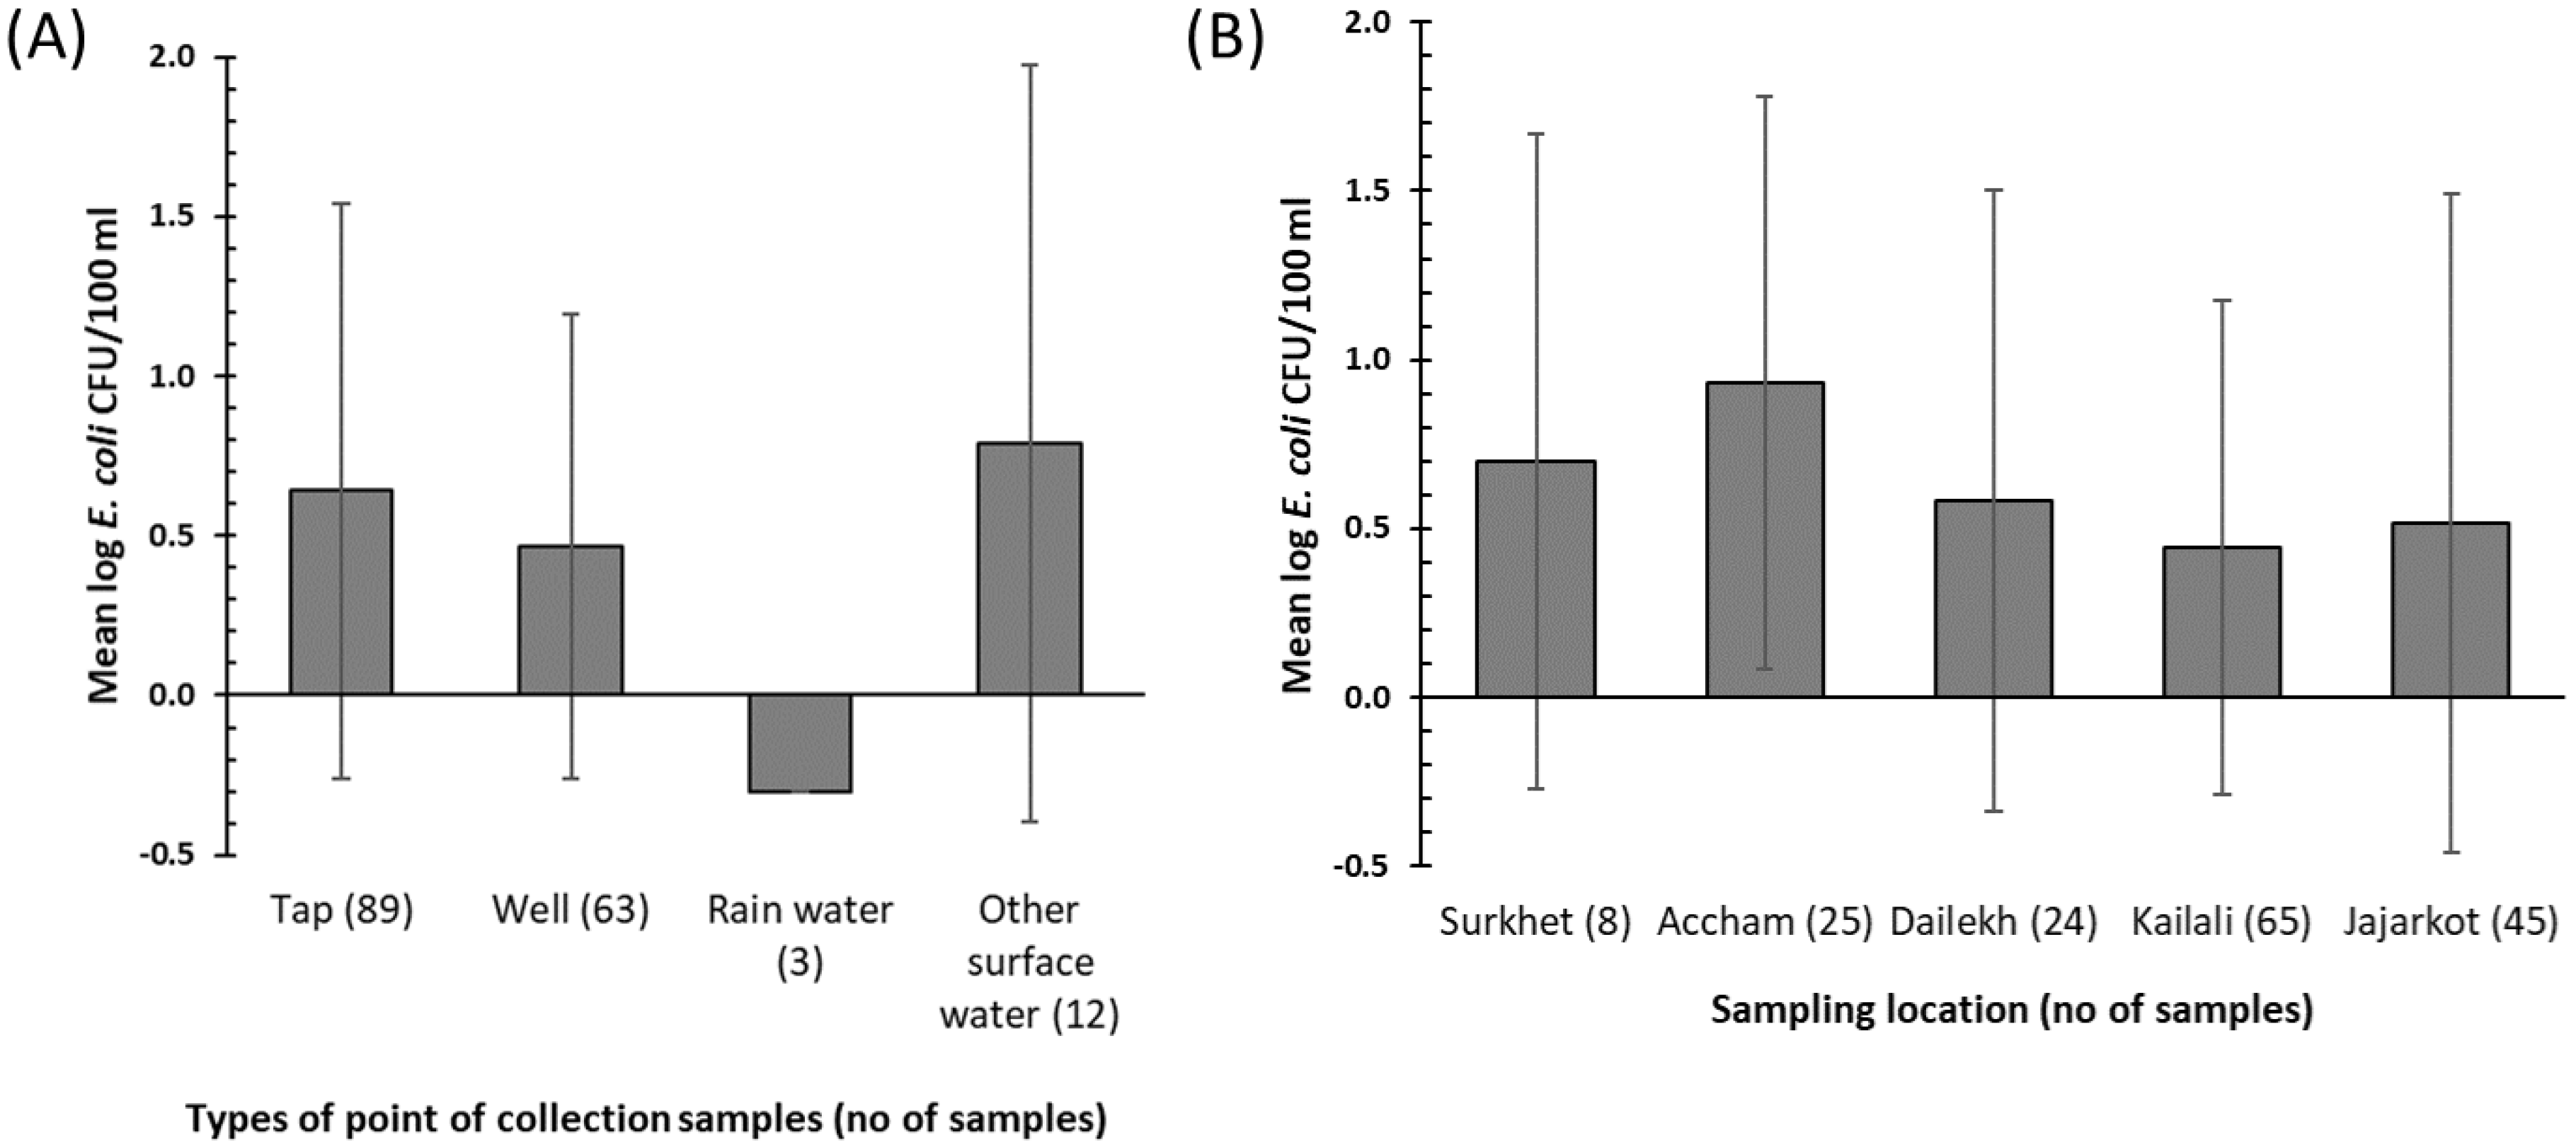
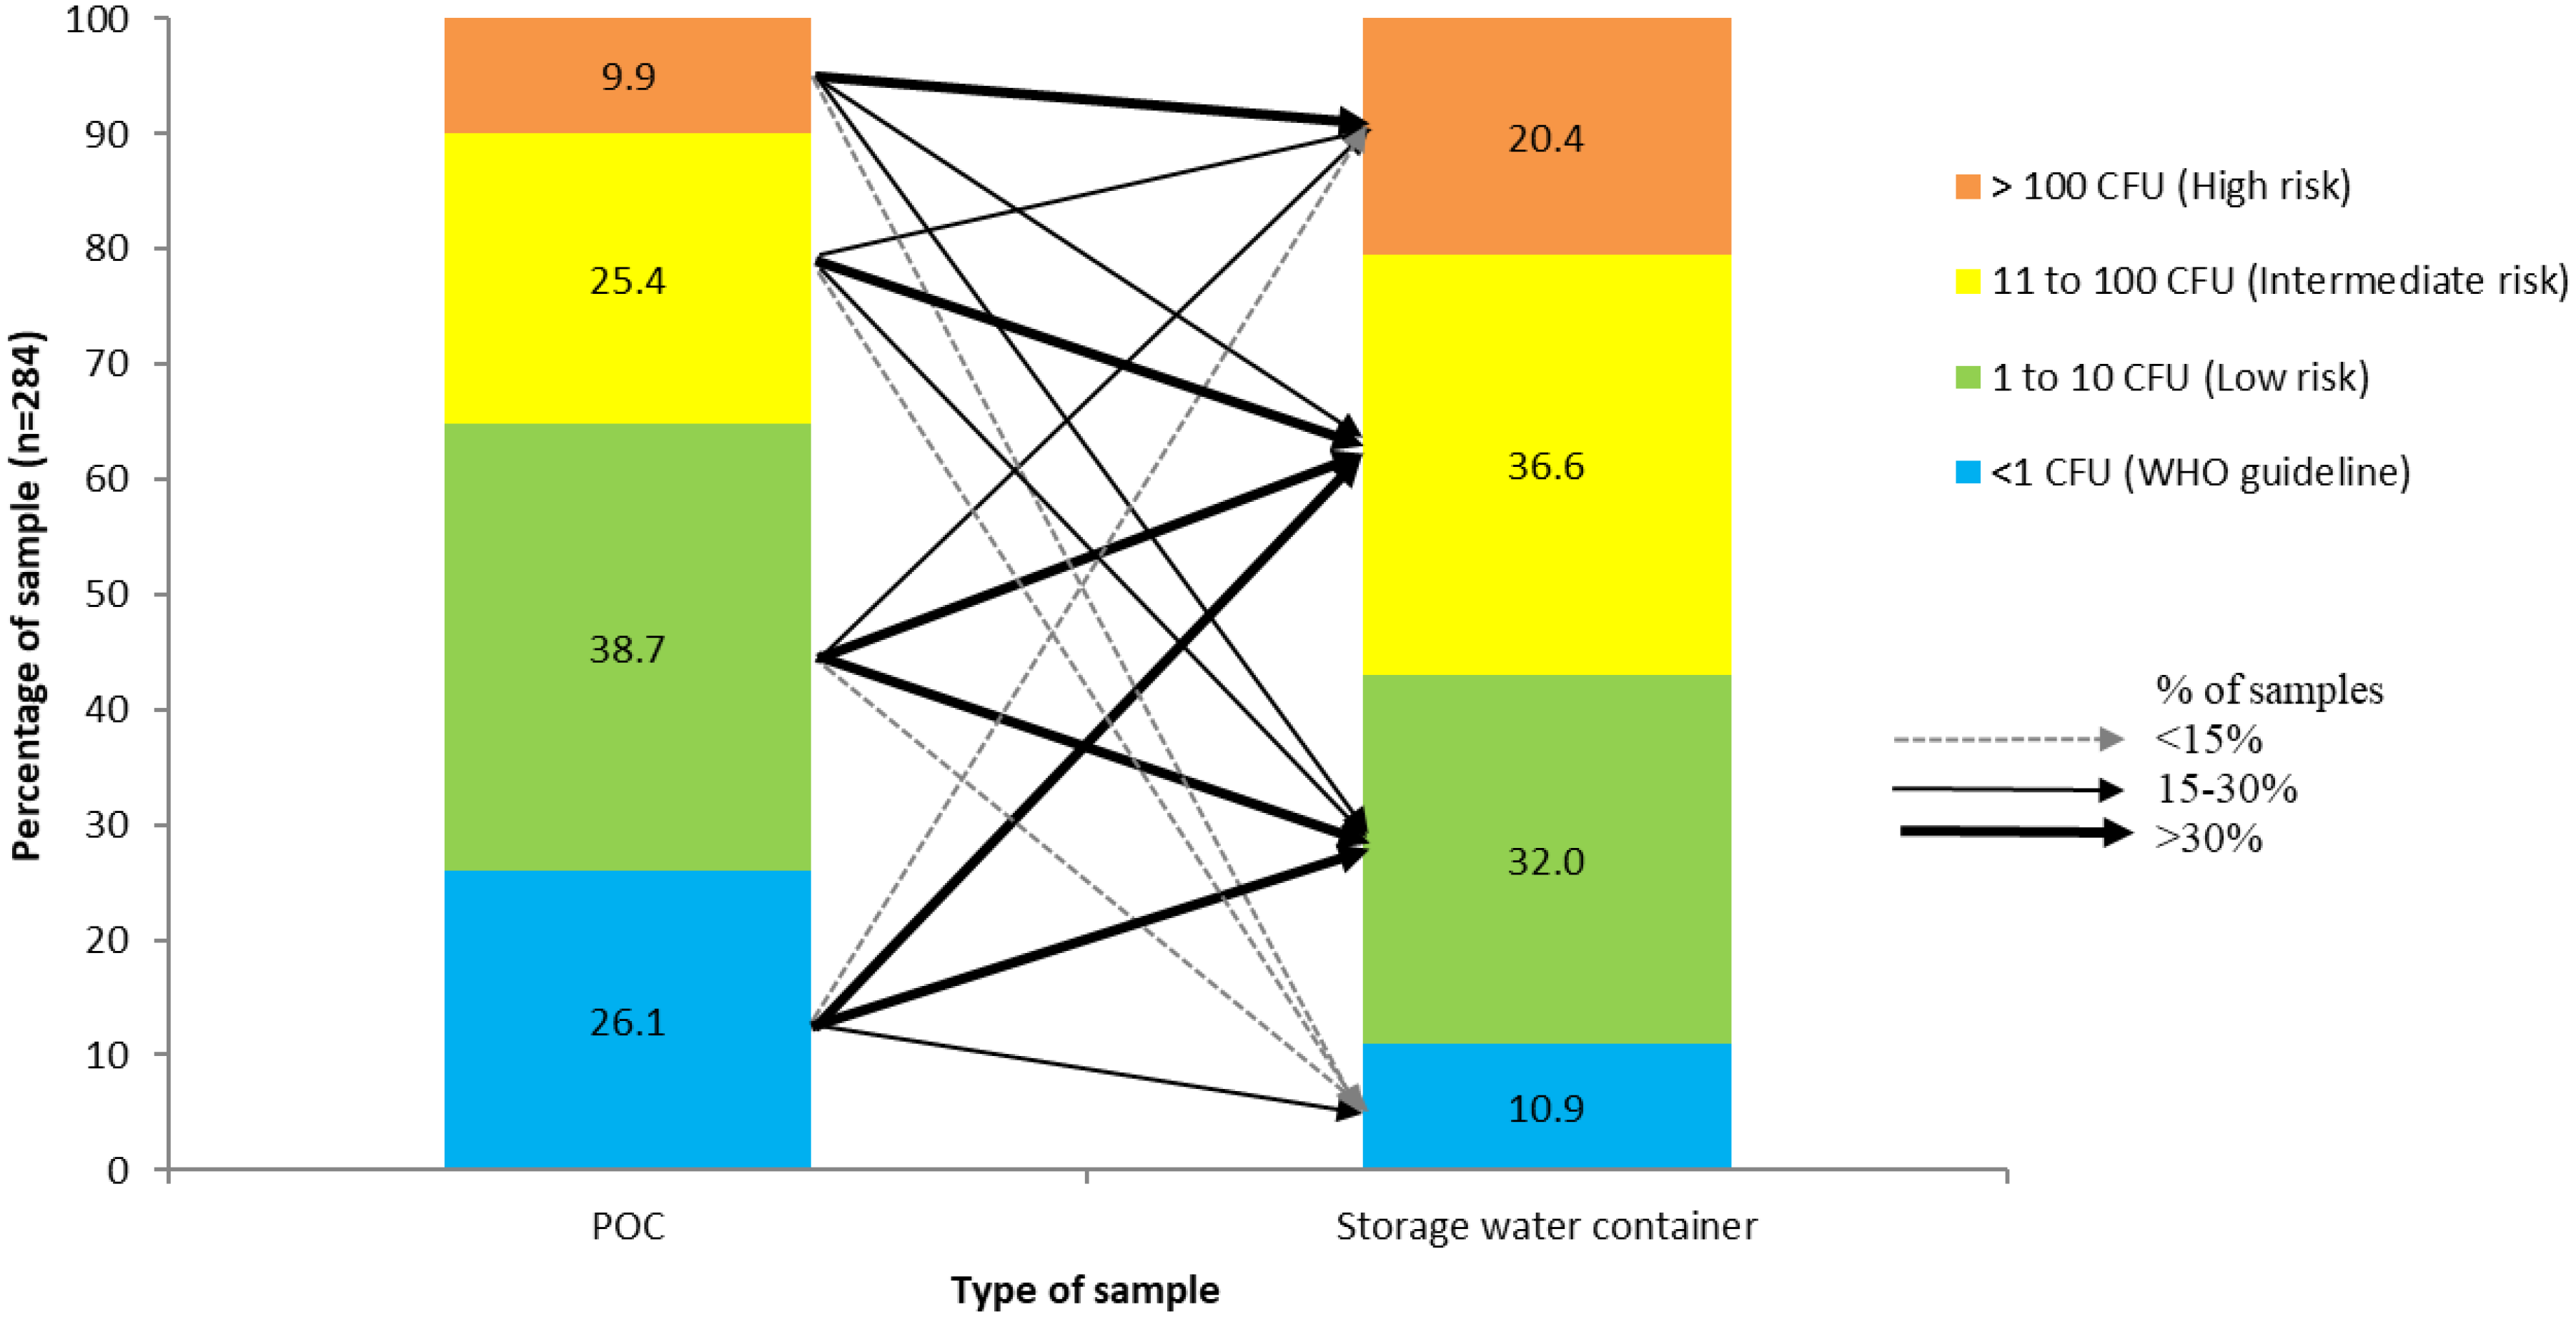
3.2. Water Quality
3.3. Predictors of the Use of Household Water Treatment
4. Discussion
4.1. Factors Related to Water Quality
4.2. Household’s Perceptions of Drinking Water Quality
4.3. Study Limitation
5. Conclusions
Author Contributions
Funding
Acknowledgments
Conflicts of Interest
References
- Prüss-Ustün, A.; Wolf, J.; Bartram, J.; Clasen, T.; Cumming, O.; Freeman, M.C.; Gordon, B.; Hunter, P.R.; Medlicott, K.; Johnston, R. Burden of Disease from Inadequate Water, Sanitation and Hygiene for Selected Adverse Health Outcomes: An Updated Analysis with a Focus on Low- and Middle-Income Countries. Int. J. Hyg. Environ. Health 2019, 222, 765–777. [Google Scholar] [CrossRef]
- UNICEF; WHO. Progress on Household Drinking Water, Sanitation and Hygiene 2000–2017: Special Focus on Inequalities; World Health Organization: Geneva, Switzerland, 2019. [Google Scholar]
- Elala, D.; Labhasetwar, P.; Tyrrel, S.F. Deterioration in Water Quality from Supply Chain to Household and Appropriate Storage in the Context of Intermittent Water Supplies. Water Sci. Technol. Water Supply 2011, 11, 400. [Google Scholar] [CrossRef]
- Meierhofer, R.; Bänziger, C.; Deppeler, S.; Kunwar, B.; Bhatta, M. From Water Source to Tap of Ceramic Filters—Factors That Influence Water Quality Between Collection and Consumption in Rural Households in Nepal. Int. J. Environ. Res. Public Health 2018, 15, 2439. [Google Scholar] [CrossRef] [Green Version]
- Rufener, S.; Mäusezahl, D.; Mosler, H.J.; Weingartner, R. Quality of Drinking-Water at Source and Point-of Consumption-Drinking Cup as a High Potential Recontamination Risk: A Field Study in Bolivia. J. Health Popul. Nutr. 2010, 28, 34–41. [Google Scholar] [CrossRef] [PubMed]
- Shields, K.F.; Bain, R.E.S.; Cronk, R.; Wright, J.A.; Bartram, J. Association of Supply Type with Fecal Contamination of Source Water and Household Stored Drinking Water in Developing Countries: A Bivariate Meta-Analysis. Environ. Health Perspect. 2015, 123, 1222–1231. [Google Scholar] [CrossRef] [PubMed]
- Bain, R.; Cronk, R.; Wright, J.; Yang, H.; Slaymaker, T.; Bartram, J. Fecal Contamination of Drinking-Water in Low-and Middle-Income Countries: A Systematic Review and Meta-Analysis. PLoS Med. 2014, 11, e1001644. [Google Scholar] [CrossRef] [PubMed] [Green Version]
- Bernardes, C.; Bernardes, R.; Zimmer, C.; Dorea, C.C. A Simple Off-Grid Incubator for Microbiological Water Quality Analysis. Water (Switzerland) 2020, 12, 240. [Google Scholar] [CrossRef] [Green Version]
- Bain, R.; Bartram, J.; Elliott, M.; Matthews, R.; McMahan, L.; Tung, R.; Chuang, P.; Gundry, S. A Summary Catalogue of Microbial Drinking Water Tests for Low and Medium Resource Settings. Int. J. Environ. Res. Public Health 2012, 9, 1609–1625. [Google Scholar] [CrossRef]
- Diener, A.; Schertenleib, A.; Daniel, D.; Kenea, M.; Pratama, I.; Bhatta, M.; Marks, S. Adaptable Drinking-Water Laboratory Unit for Decentralised Testing in Remote and Alpine Regions. In Proceedings of the 40th WEDC International Conference, Loughborough, UK, 24–28 July 2017; pp. 1–7. [Google Scholar]
- Rautanen, S.L.; White, P. Using Every Drop–Experiences of Good Local Water Governance and Multiple-Use Water Services for Food Security in Far-Western Nepal. Aquat. Procedia 2013, 1, 120–129. [Google Scholar] [CrossRef]
- Ministry of Health, Nepal; New ERA; ICF. Nepal Demographic and Health Survey 2016; Ministry of Health: Kathmandu, Nepal, 2017.
- Pokhrel, D.; Bhandari, B.S.; Viraraghavan, T. Arsenic Contamination of Groundwater in the Terai Region of Nepal: An Overview of Health Concerns and Treatment Options. Environ. Int. 2009, 35, 157–161. [Google Scholar] [CrossRef]
- Van Geen, A.; Ahmed, K.M.; Akita, Y.; Alam, M.J.; Culligan, P.J.; Emch, M.; Escamilla, V.; Feighery, J.; Ferguson, A.S.; Knappett, P.; et al. Fecal Contamination of Shallow Tubewells in Bangladesh Inversely Related to Arsenic. Environ. Sci. Technol. 2011, 45, 1199–1205. [Google Scholar] [CrossRef] [PubMed]
- Daniel, D.; Diener, A.; Pande, S.; Jansen, S.; Marks, S.; Meierhofer, R.; Bhatta, M.; Rietveld, L. Understanding the Effect of Socio-Economic Characteristics and Psychosocial Factors on Household Water Treatment Practices in Rural Nepal Using Bayesian Belief Networks. Int. J. Hyg. Environ. Health 2019, 222, 847–855. [Google Scholar] [CrossRef] [PubMed]
- Kumpel, E.; Peletz, R.; Bonham, M.; Fay, A.; Cock-Esteb, A.; Khush, R. When Are Mobile Phones Useful for Water Quality Data Collection? An Analysis of Data Flows and ICT Applications among Regulated Monitoring Institutions in Sub-Saharan Africa. Int. J. Environ. Res. Public Health 2015, 12, 10846–10860. [Google Scholar] [CrossRef] [PubMed] [Green Version]
- WHO. Guidelines for Drinking-Water Quality: Fourth Edition Incorporating The First Addendum, 4th ed.; World Health Organization: Geneva, Switzerland, 2017. [Google Scholar]
- Schertenleib, A.; Sigrist, J.; Friedrich, M.N.D.; Ebi, C.; Hammes, F.; Marks, S.J. Construction of a Low-Cost Mobile Incubator for Field and Laboratory Use. J. Vis. Exp. 2019, 145, e58443. [Google Scholar] [CrossRef]
- Sutton, S. Accuracy of Plate Counts. J. Valid. Technol. 2011, 3, 42–46. [Google Scholar]
- Pickering, A.J.; Davis, J.; Walters, S.P.; Horak, H.M.; Keymer, D.P.; Mushi, D.; Strickfaden, R.; Chynoweth, J.S.; Liu, J.; Blum, A.; et al. Hands, Water, and Health: Fecal Contamination in Tanzanian Communities with Improved, Non-Networked Water Supplies. Environ. Sci. Technol. 2010, 44, 3267–3272. [Google Scholar] [CrossRef]
- Robinson, D.T.; Schertenleib, A.; Kunwar, B.M.; Shrestha, R.; Bhatta, M.; Marks, S.J. Assessing the Impact of a Risk-Based Intervention on Piped Water Quality in Rural Communities: The Case of Mid-Western Nepal. Int. J. Environ. Res. Public Health 2018, 15, 1616. [Google Scholar] [CrossRef] [Green Version]
- Brown, J.; Stauber, C.; Murphy, J.L.; Khan, A.; Mu, T.; Elliott, M.; Sobsey, M.D. Ambient-Temperature Incubation for the Field Detection of Escherichia Coli in Drinking Water. J. Appl. Microbiol. 2011, 110, 915–923. [Google Scholar] [CrossRef]
- Houweling, T.A.J.; Kunst, A.E.; Mackenbach, J.P. Measuring Health Inequality among Children in Developing Countries: Does the Choice of the Indicator of Economic Status Matter? Int. J. Equity Health 2003, 2, 8. [Google Scholar] [CrossRef] [Green Version]
- WHO. Surveillance and Control of Community Supplies, Guidelines for Drinking-Water Quality, 2nd ed.; WHO: Geneva, Switzerland, 1997. [Google Scholar]
- Penakalapati, G.; Swarthout, J.; Delahoy, M.J.; McAliley, L.; Wodnik, B.; Levy, K.; Freeman, M.C. Exposure to Animal Feces and Human Health: A Systematic Review and Proposed Research Priorities. Environ. Sci. Technol. 2017, 51, 11537–11552. [Google Scholar] [CrossRef] [Green Version]
- Ercumen, A.; Pickering, A.J.; Kwong, L.H.; Arnold, B.F.; Parvez, S.M.; Alam, M.; Sen, D.; Islam, S.; Kullmann, C.; Chase, C.; et al. Animal Feces Contribute to Domestic Fecal Contamination: Evidence from E. Coli Measured in Water, Hands, Food, Flies, and Soil in Bangladesh. Environ. Sci. Technol. 2017, 51, 8725–8734. [Google Scholar] [CrossRef] [PubMed] [Green Version]
- Wardrop, N.A.; Hill, A.G.; Dzodzomenyo, M.; Aryeetey, G.; Wright, J.A. Livestock Ownership and Microbial Contamination of Drinking-Water: Evidence from Nationally Representative Household Surveys in Ghana, Nepal and Bangladesh. Int. J. Hyg. Environ. Health 2018, 221, 33–40. [Google Scholar] [CrossRef] [PubMed]
- Odagiri, M.; Schriewer, A.; Daniels, M.E.; Wuertz, S.; Smith, W.A.; Clasen, T.; Schmidt, W.; Jin, Y.; Torondel, B.; Misra, P.R.; et al. Human Fecal and Pathogen Exposure Pathways in Rural Indian Villages and the Effect of Increased Latrine Coverage. Water Res. 2016, 100, 232–244. [Google Scholar] [CrossRef] [PubMed] [Green Version]
- Budhathoki, S.S.; Shrestha, G.; Bhattachan, M.; Singh, S.B.; Jha, N. Latrine Coverage and Its Utilisation in a Rural Village of Eastern Nepal: A Community-Based Cross-Sectional Study. BMC Res. Notes 2017, 10, 209. [Google Scholar] [CrossRef] [PubMed] [Green Version]
- Aryal, J.P.; Holden, S.T. Livestock and Land Share Contracts in a Hindu Society. Agric. Econ. 2012, 43, 593–606. [Google Scholar] [CrossRef] [Green Version]
- Ercumen, A.; Naser, A.M.; Unicomb, L.; Arnold, B.F.; Colford, J.M.; Luby, S.P. Effects of Source-versus Household Contamination of Tubewell Water on Child Diarrhea in Rural Bangladesh: A Randomized Controlled Trial. PLoS ONE 2015, 10, e0121907. [Google Scholar] [CrossRef]
- Wolf, J.; Hunter, P.R.; Freeman, M.C.; Cumming, O.; Clasen, T.; Bartram, J.; Higgins, J.P.T.; Johnston, R.; Medlicott, K.; Boisson, S.; et al. Impact of Drinking Water, Sanitation and Handwashing with Soap on Childhood Diarrhoeal Disease: Updated Meta-Analysis and Meta-Regression. Trop. Med. Int. Health 2018, 23, 508–525. [Google Scholar] [CrossRef]
- Brown, J.; Clasen, T. High Adherence Is Necessary to Realize Health Gains from Water Quality Interventions. PLoS ONE 2012, 7, e36735. [Google Scholar] [CrossRef] [Green Version]
- Misati, A.G.; Ogendi, G.; Peletz, R.; Khush, R.; Kumpel, E. Can Sanitary Surveys Replace Water Quality Testing? Evidence from Kisii, Kenya. Int. J. Environ. Res. Public Health 2017, 14, 152. [Google Scholar] [CrossRef] [Green Version]
- Kumpel, E.; Nelson, K.L. Comparing Microbial Water Quality in an Intermittent and Continuous Piped Water Supply. Water Res. 2013, 47, 5176–5188. [Google Scholar] [CrossRef]
- Luoto, J.; Najnin, N.; Mahmud, M.; Albert, J.; Islam, M.S.; Luby, S.; Unicomb, L.; Levine, D.I. What Point-of-Use Water Treatment Products Do Consumers Use? Evidence from a Randomized Controlled Trial among the Urban Poor in Bangladesh. PLoS ONE 2011, 6, e26132. [Google Scholar] [CrossRef] [PubMed] [Green Version]
- Luby, S.P.; Mendoza, C.; Keswick, B.H.; Chiller, T.M.; Hoekstra, R.M. Difficulties in Bringing Point-of-Use Water Treatment to Scale in Rural Guatemala. Am. J. Trop. Med. Hyg. 2008, 78, 382–387. [Google Scholar] [CrossRef] [PubMed]
- Berg, M.; Tran, H.C.; Nguyen, T.C.; Pham, H.V.; Schertenleib, R.; Giger, W. Arsenic Contamination of Groundwater and Drinking Water in Vietnam: A Human Health Threat. Environ. Sci. Technol. 2001, 35, 2621–2626. [Google Scholar] [CrossRef] [PubMed] [Green Version]
- Annaduzzaman, M.; Bhattacharya, P.; Biswas, A.; Hossain, M.; Ahmed, K.M.; van Halem, D. Arsenic and Manganese in Shallow Tubewells: Validation of Platform Color as a Screening Tool in Bangladesh. Groundw. Sustain. Dev. 2018, 6, 181–188. [Google Scholar] [CrossRef]
- Winter, S.; Dreibelbis, R.; Barchi, F. Context Matters: A Multicountry Analysis of Individual- and Neighbourhood-Level Factors Associated with Women’s Sanitation Use in Sub-Saharan Africa. Trop. Med. Int. Health 2018, 23, 173–192. [Google Scholar] [CrossRef] [PubMed] [Green Version]
- Mosler, H.-J. A Systematic Approach to Behavior Change Interventions for the Water and Sanitation Sector in Developing Countries: A Conceptual Model, a Review, and a Guideline. Int. J. Environ. Health Res. 2012, 22, 431–449. [Google Scholar] [CrossRef]
- Kulinkina, A.V.; Mohan, V.R.; Francis, M.R.; Kattula, D.; Sarkar, R.; Plummer, J.D.; Ward, H.; Kang, G.; Balraj, V.; Naumova, E.N. Seasonality of Water Quality and Diarrheal Disease Counts in Urban and Rural Settings in South India. Sci. Rep. 2016, 6, 20521. [Google Scholar] [CrossRef] [Green Version]


| Variables | Surkhet (%) | Accham (%) | Dailekh (%) | Kailali (%) | Jajarkot (%) | Total (%) |
|---|---|---|---|---|---|---|
| Number of household survey respondents | 93 (18) | 103 (20) | 113 (22) | 129 (25) | 74 (14) | 512 (100) |
| Education (total: 512 respondents) | ||||||
| No education | 41 (8) | 60 (12) | 67 (13) | 44 (9) | 43 (8) | 255 (50) |
| Primary | 24 (5) | 22 ( 4) | 21 (4) | 40 (10) | 12 (2) | 119 (23) |
| Secondary | 22 (4) | 16 (3) | 15 (3) | 29 (6) | 9 (2) | 91 (18) |
| College or higher | 6 (1) | 5 (1) | 10 (4) | 16 (3) | 10 (2) | 47 (9) |
| Primary water sources (512 respondents) | ||||||
| Tap water (either in own house or community tap) | 57 (11) | 98 (19) | 89 (17) | 0 (0) | 60 (12) | 304 (59) |
| Tube well | 0 (0) | 0 (0) | 0 (0) | 127 | 0 (0) | 127 (25) |
| Rain-water harvesting | 0 (0) | 0 (0) | 10 (2) | 1 (0) | 1 (0) | 12 (2) |
| Surface water (e.g., open source, river) | 36 (7) | 5 (1) | 14 (3) | 1 (0) | 13 (3) | 69 (13) |
| Ever received promotional material on household water treatment (HWT, 512 respondents) | ||||||
| Yes | 71 (14) | 56 (11) | 65 (13) | 79 (15) | 32 (6) | 303 (59) |
| Presence of children under 5 years old (512 respondents) | ||||||
| Yes | 38 (7) | 58 (11) | 63 (12) | 61 (12) | 45 (9) | 265 (52) |
| Use HWT (451 respondents) | ||||||
| Yes | 44 (10) | 19 (4) | 18 (4) | 8 (2) | 10 (2) | 99 (22) |
| Total number of stored-water samples | 90 (18) | 101 (20) | 112 (22) | 129 (25) | 74 (15) | 506 (100) |
| Mean log10 E. coli colony-forming units (CFU)/100 mL (SD) | 1.14 (0.83) | 1.12 (0.89) | 1.23 (0.80) | 1.27 (0.82 | 0.94 (0.83) | 1.16 (0.84) |
| Total number of POC samples | 8 (5) | 25 (15) | 24 (14) | 65 (39) | 45 (27) | 167 (100) |
| Mean log10 E. coli CFU/100 mL (SD) | 0.70 (0.97) | 0.93 (0.84) | 0.58 (0.92) | 0.44 (0.73) | 0.52 (0.97) | 0.57 (0.86) |
| Psychosocial Factors | Answer (the Lowest and the Highest Criteria) | Mean (SD) | r (n) a |
|---|---|---|---|
| Perception of their own water quality | 1 = Very good, 5 = Very bad | 2.41 (0.81) | 0.03 (450) |
| Perception of the safety of drinking directly from water source without treatment | 1 = Very safe, 5 = Very risky | 3.06 (1.17) | 0.27 (436) ** |
| Perception of the risk of getting diarrhea if drinking untreated water | 1 = Very low, 5 = Very high | 2.49 (1.06) | 0.18 (434) ** |
| Perception about whether HWT can prevent diarrhea | 1 = Not certain, 5 = Very certain | 2.99 (0.92) | 0.37 (451) ** |
| Knowledge on different methods of HWT | 0 = Cannot explain any HWT methods, 4 = Can explain more than 3 methods | 2.01 (1.20) | 0.37 (450) ** |
© 2020 by the authors. Licensee MDPI, Basel, Switzerland. This article is an open access article distributed under the terms and conditions of the Creative Commons Attribution (CC BY) license (http://creativecommons.org/licenses/by/4.0/).
Share and Cite
Daniel, D.; Diener, A.; van de Vossenberg, J.; Bhatta, M.; Marks, S.J. Assessing Drinking Water Quality at the Point of Collection and within Household Storage Containers in the Hilly Rural Areas of Mid and Far-Western Nepal. Int. J. Environ. Res. Public Health 2020, 17, 2172. https://0-doi-org.brum.beds.ac.uk/10.3390/ijerph17072172
Daniel D, Diener A, van de Vossenberg J, Bhatta M, Marks SJ. Assessing Drinking Water Quality at the Point of Collection and within Household Storage Containers in the Hilly Rural Areas of Mid and Far-Western Nepal. International Journal of Environmental Research and Public Health. 2020; 17(7):2172. https://0-doi-org.brum.beds.ac.uk/10.3390/ijerph17072172
Chicago/Turabian StyleDaniel, D., Arnt Diener, Jack van de Vossenberg, Madan Bhatta, and Sara J. Marks. 2020. "Assessing Drinking Water Quality at the Point of Collection and within Household Storage Containers in the Hilly Rural Areas of Mid and Far-Western Nepal" International Journal of Environmental Research and Public Health 17, no. 7: 2172. https://0-doi-org.brum.beds.ac.uk/10.3390/ijerph17072172