Distribution and Geochemical Controls of Arsenic and Uranium in Groundwater-Derived Drinking Water in Bihar, India

 ,
,  ,
, 

Abstract
:1. Introduction
2. Materials and Methods
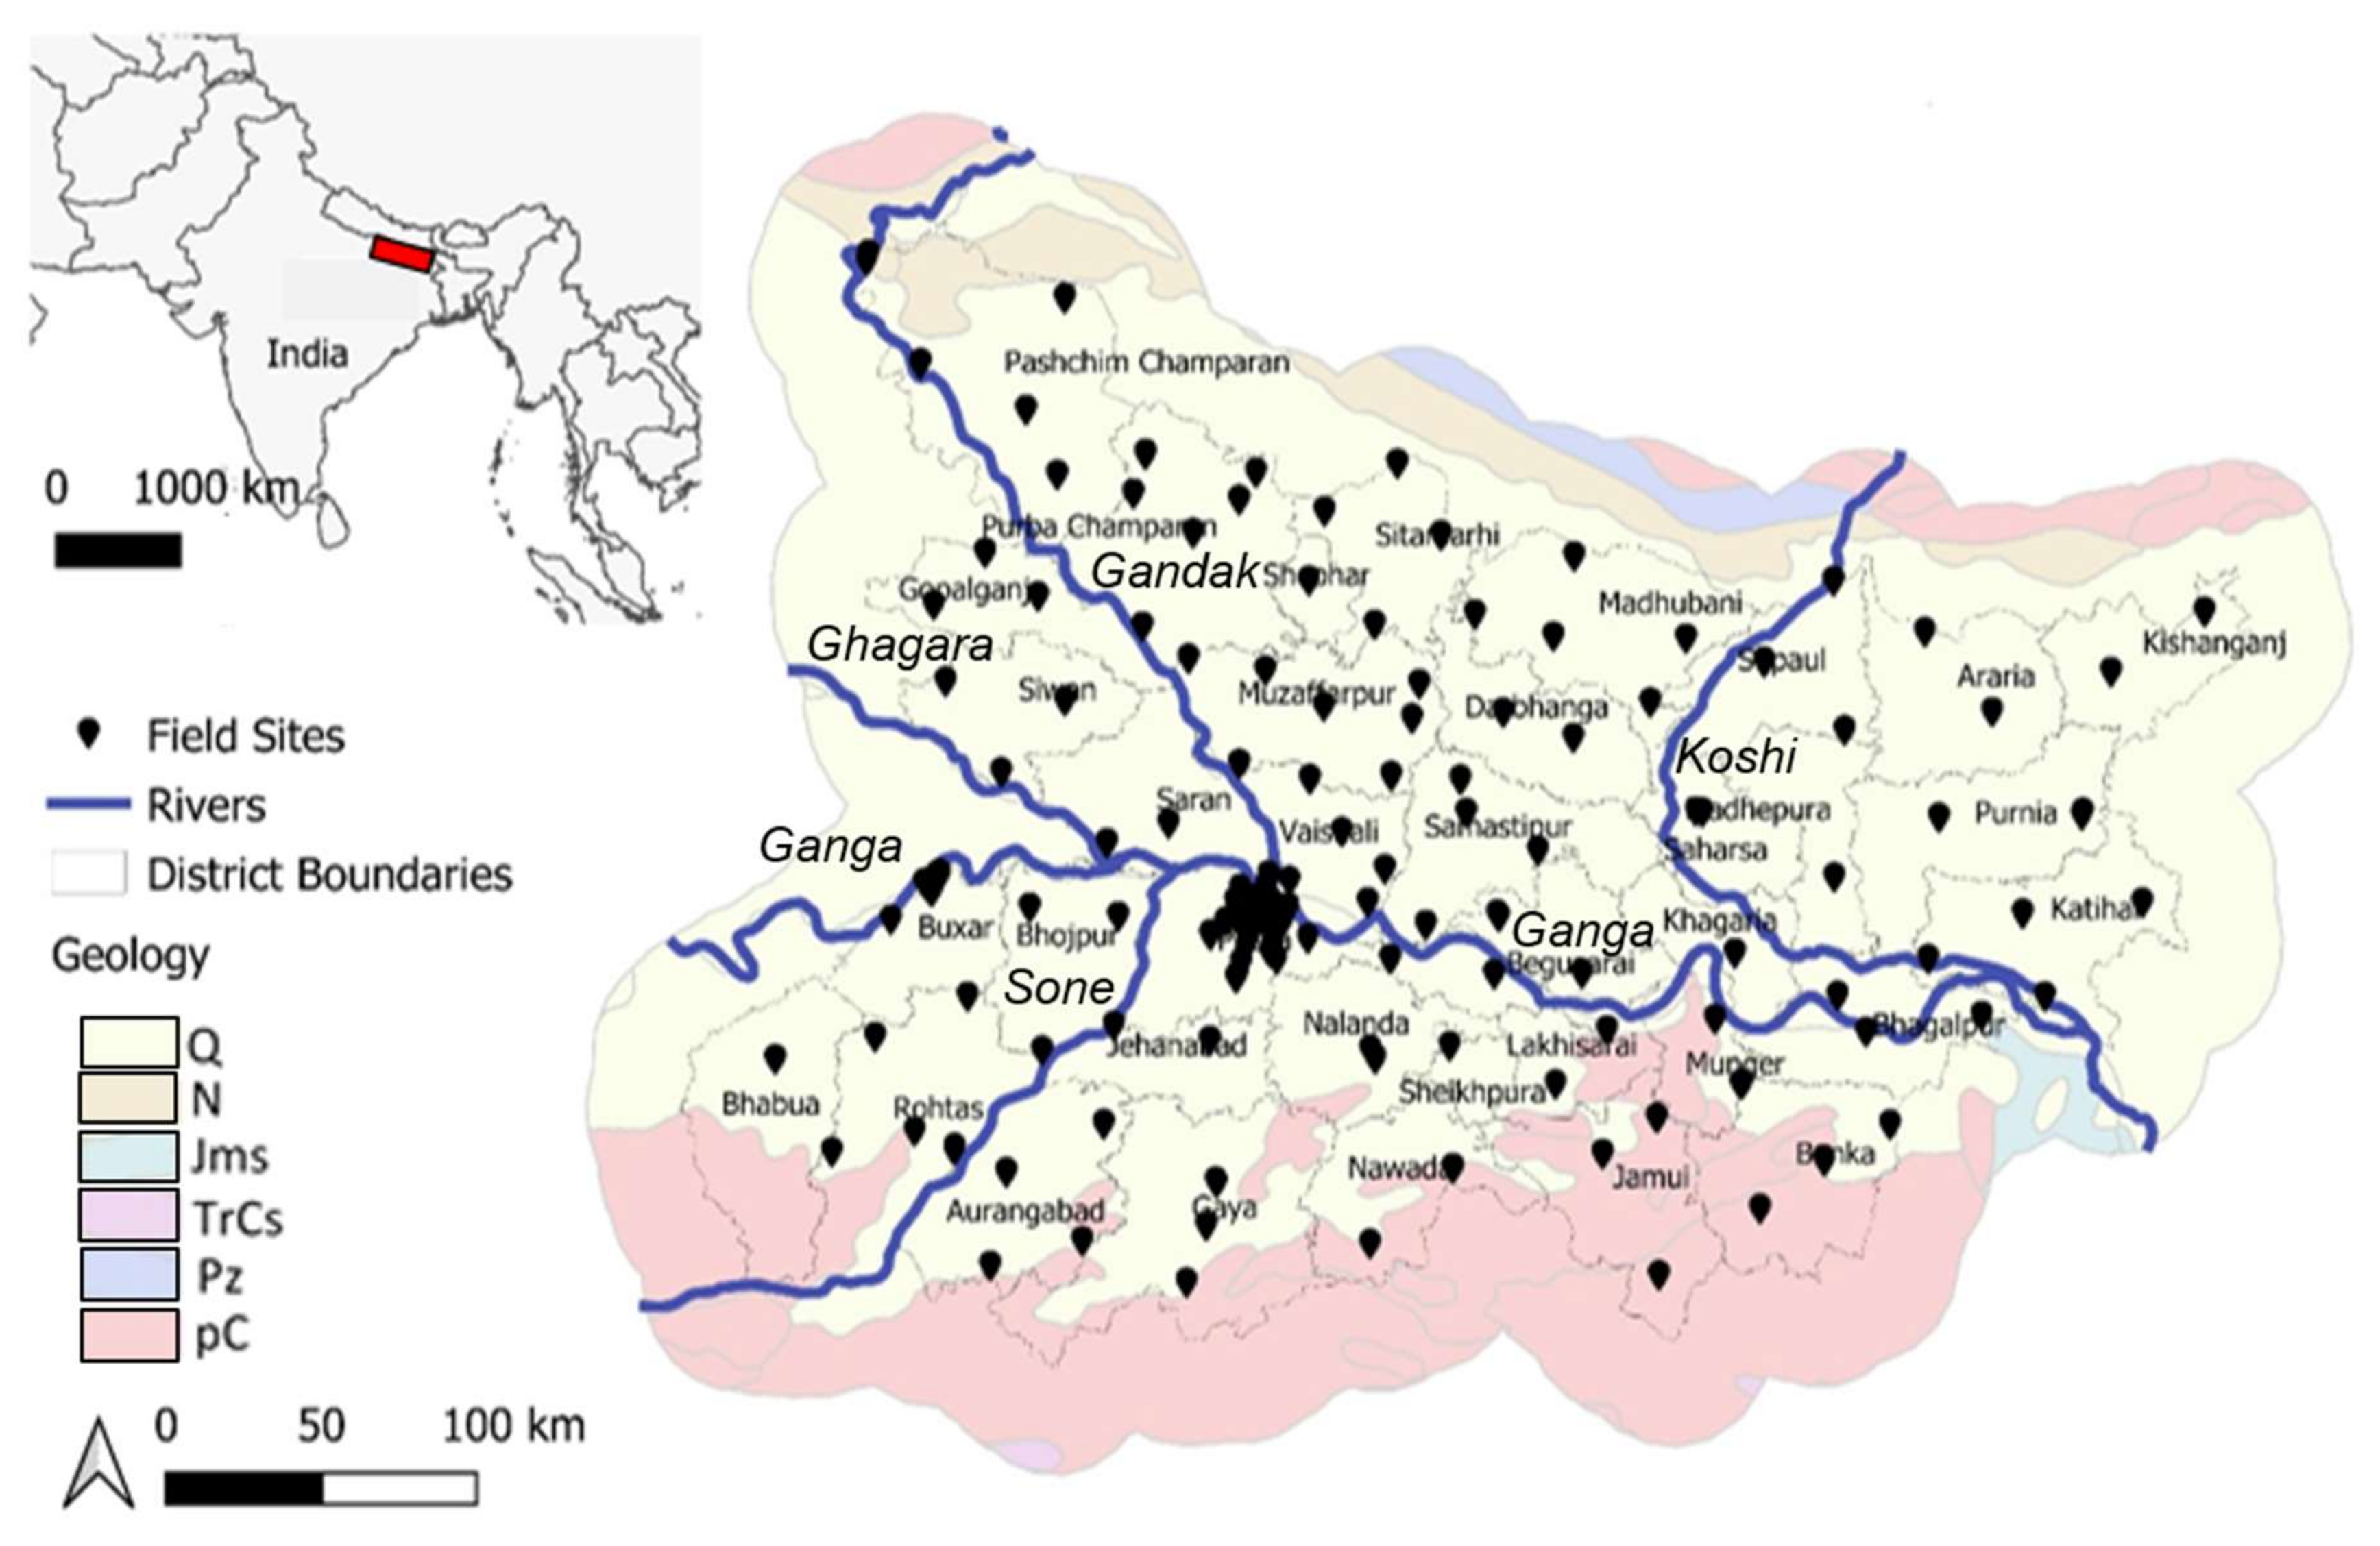
2.1. Field Area Description
2.2. Water Sample Collection
2.3. Aqueous Analytical Measurements
2.4. Quality Assurance and Quality Control
2.5. Statistical Analysis and GIS
3. Results
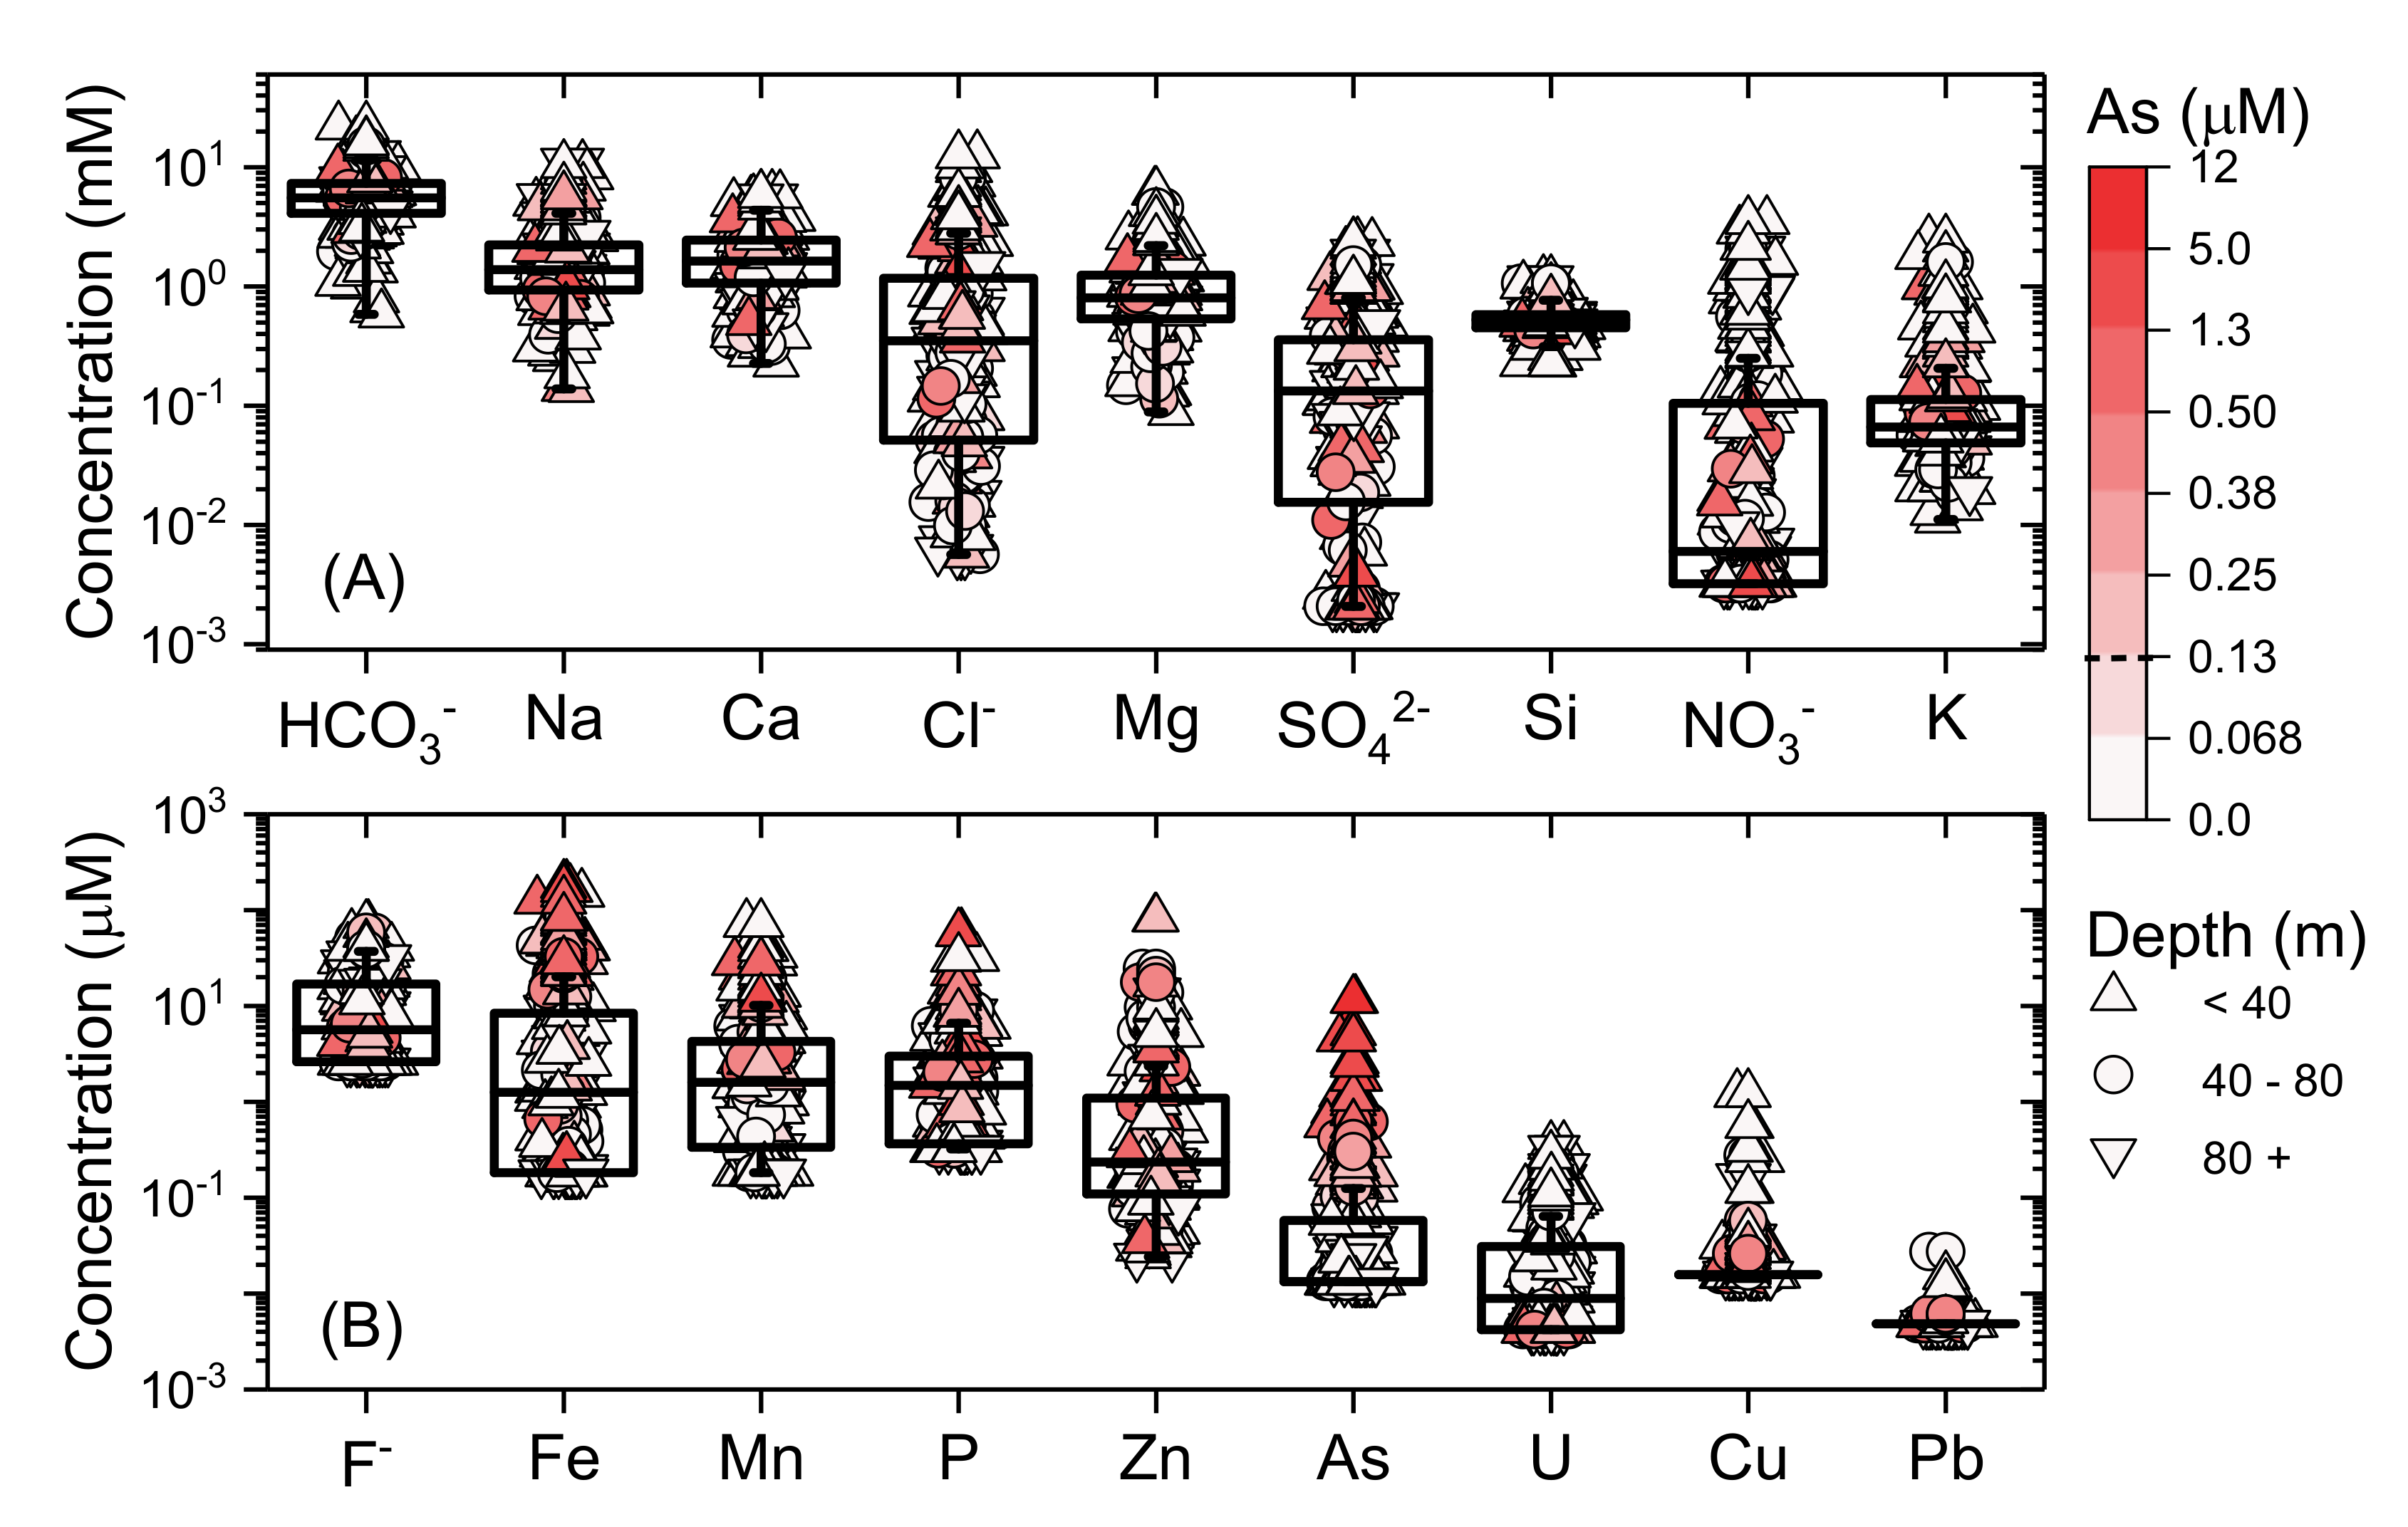
3.1. Data Quality
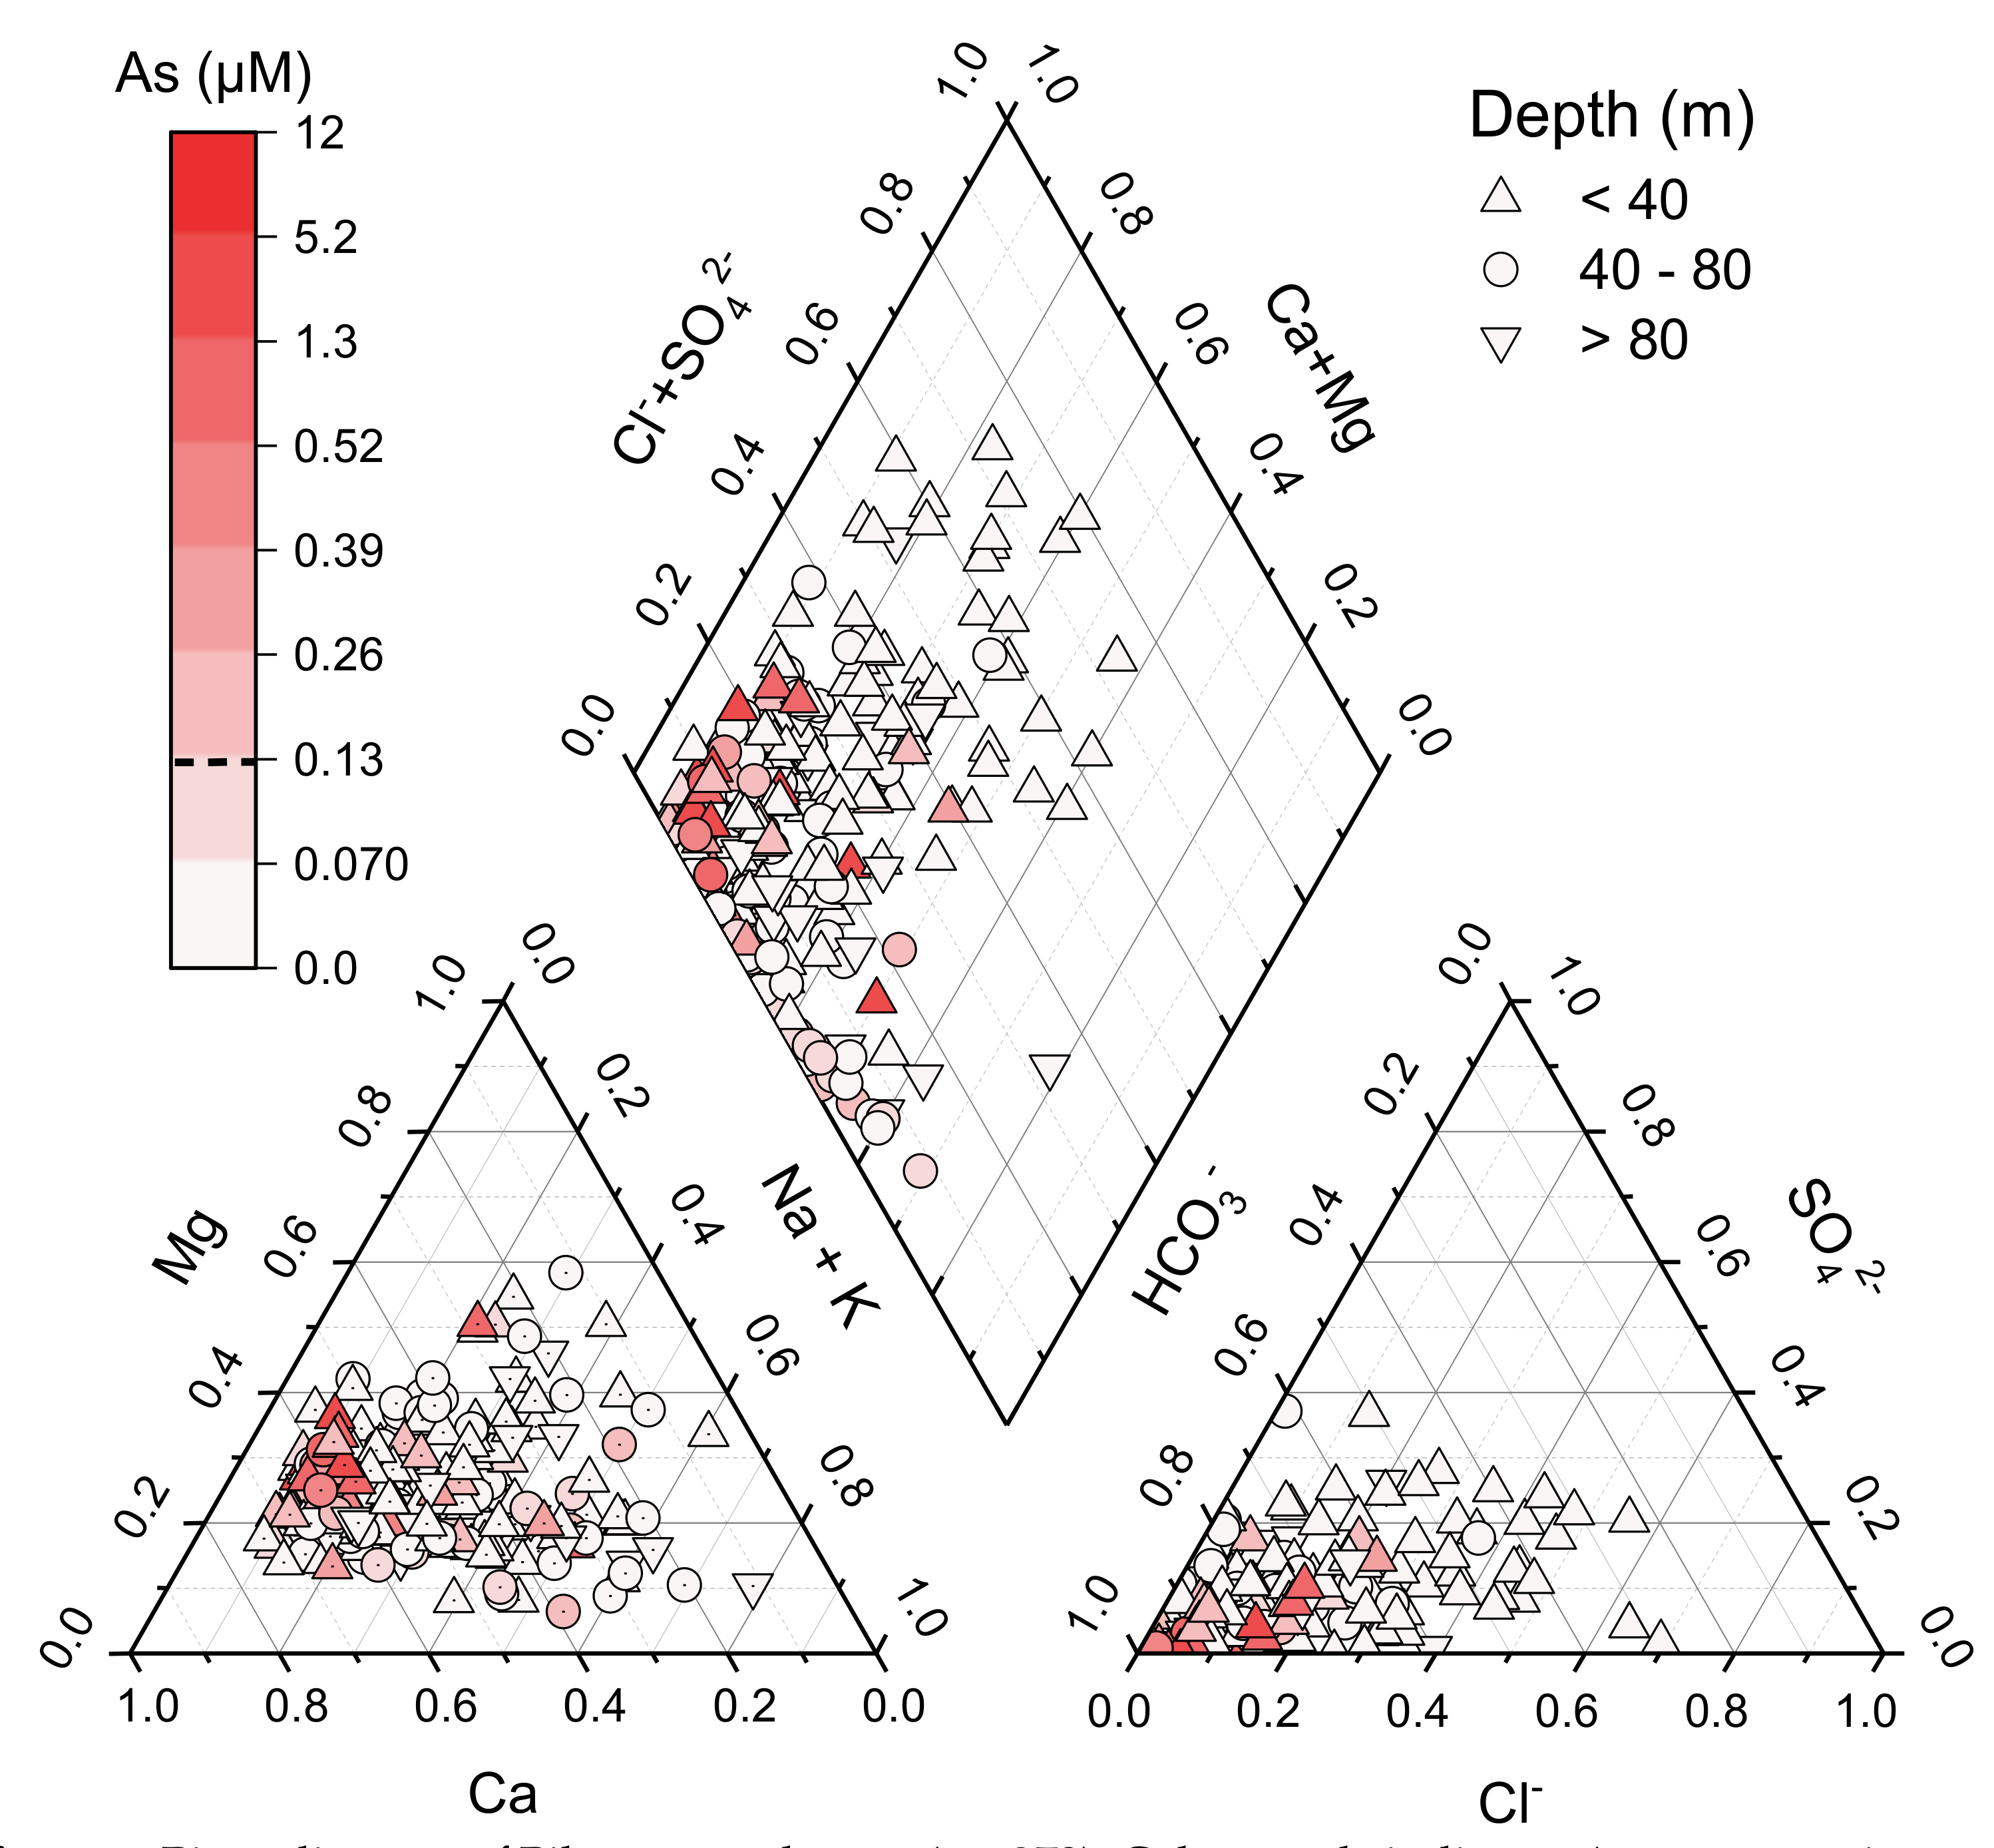
3.2. Dominant Groundwater Geochemical Conditions
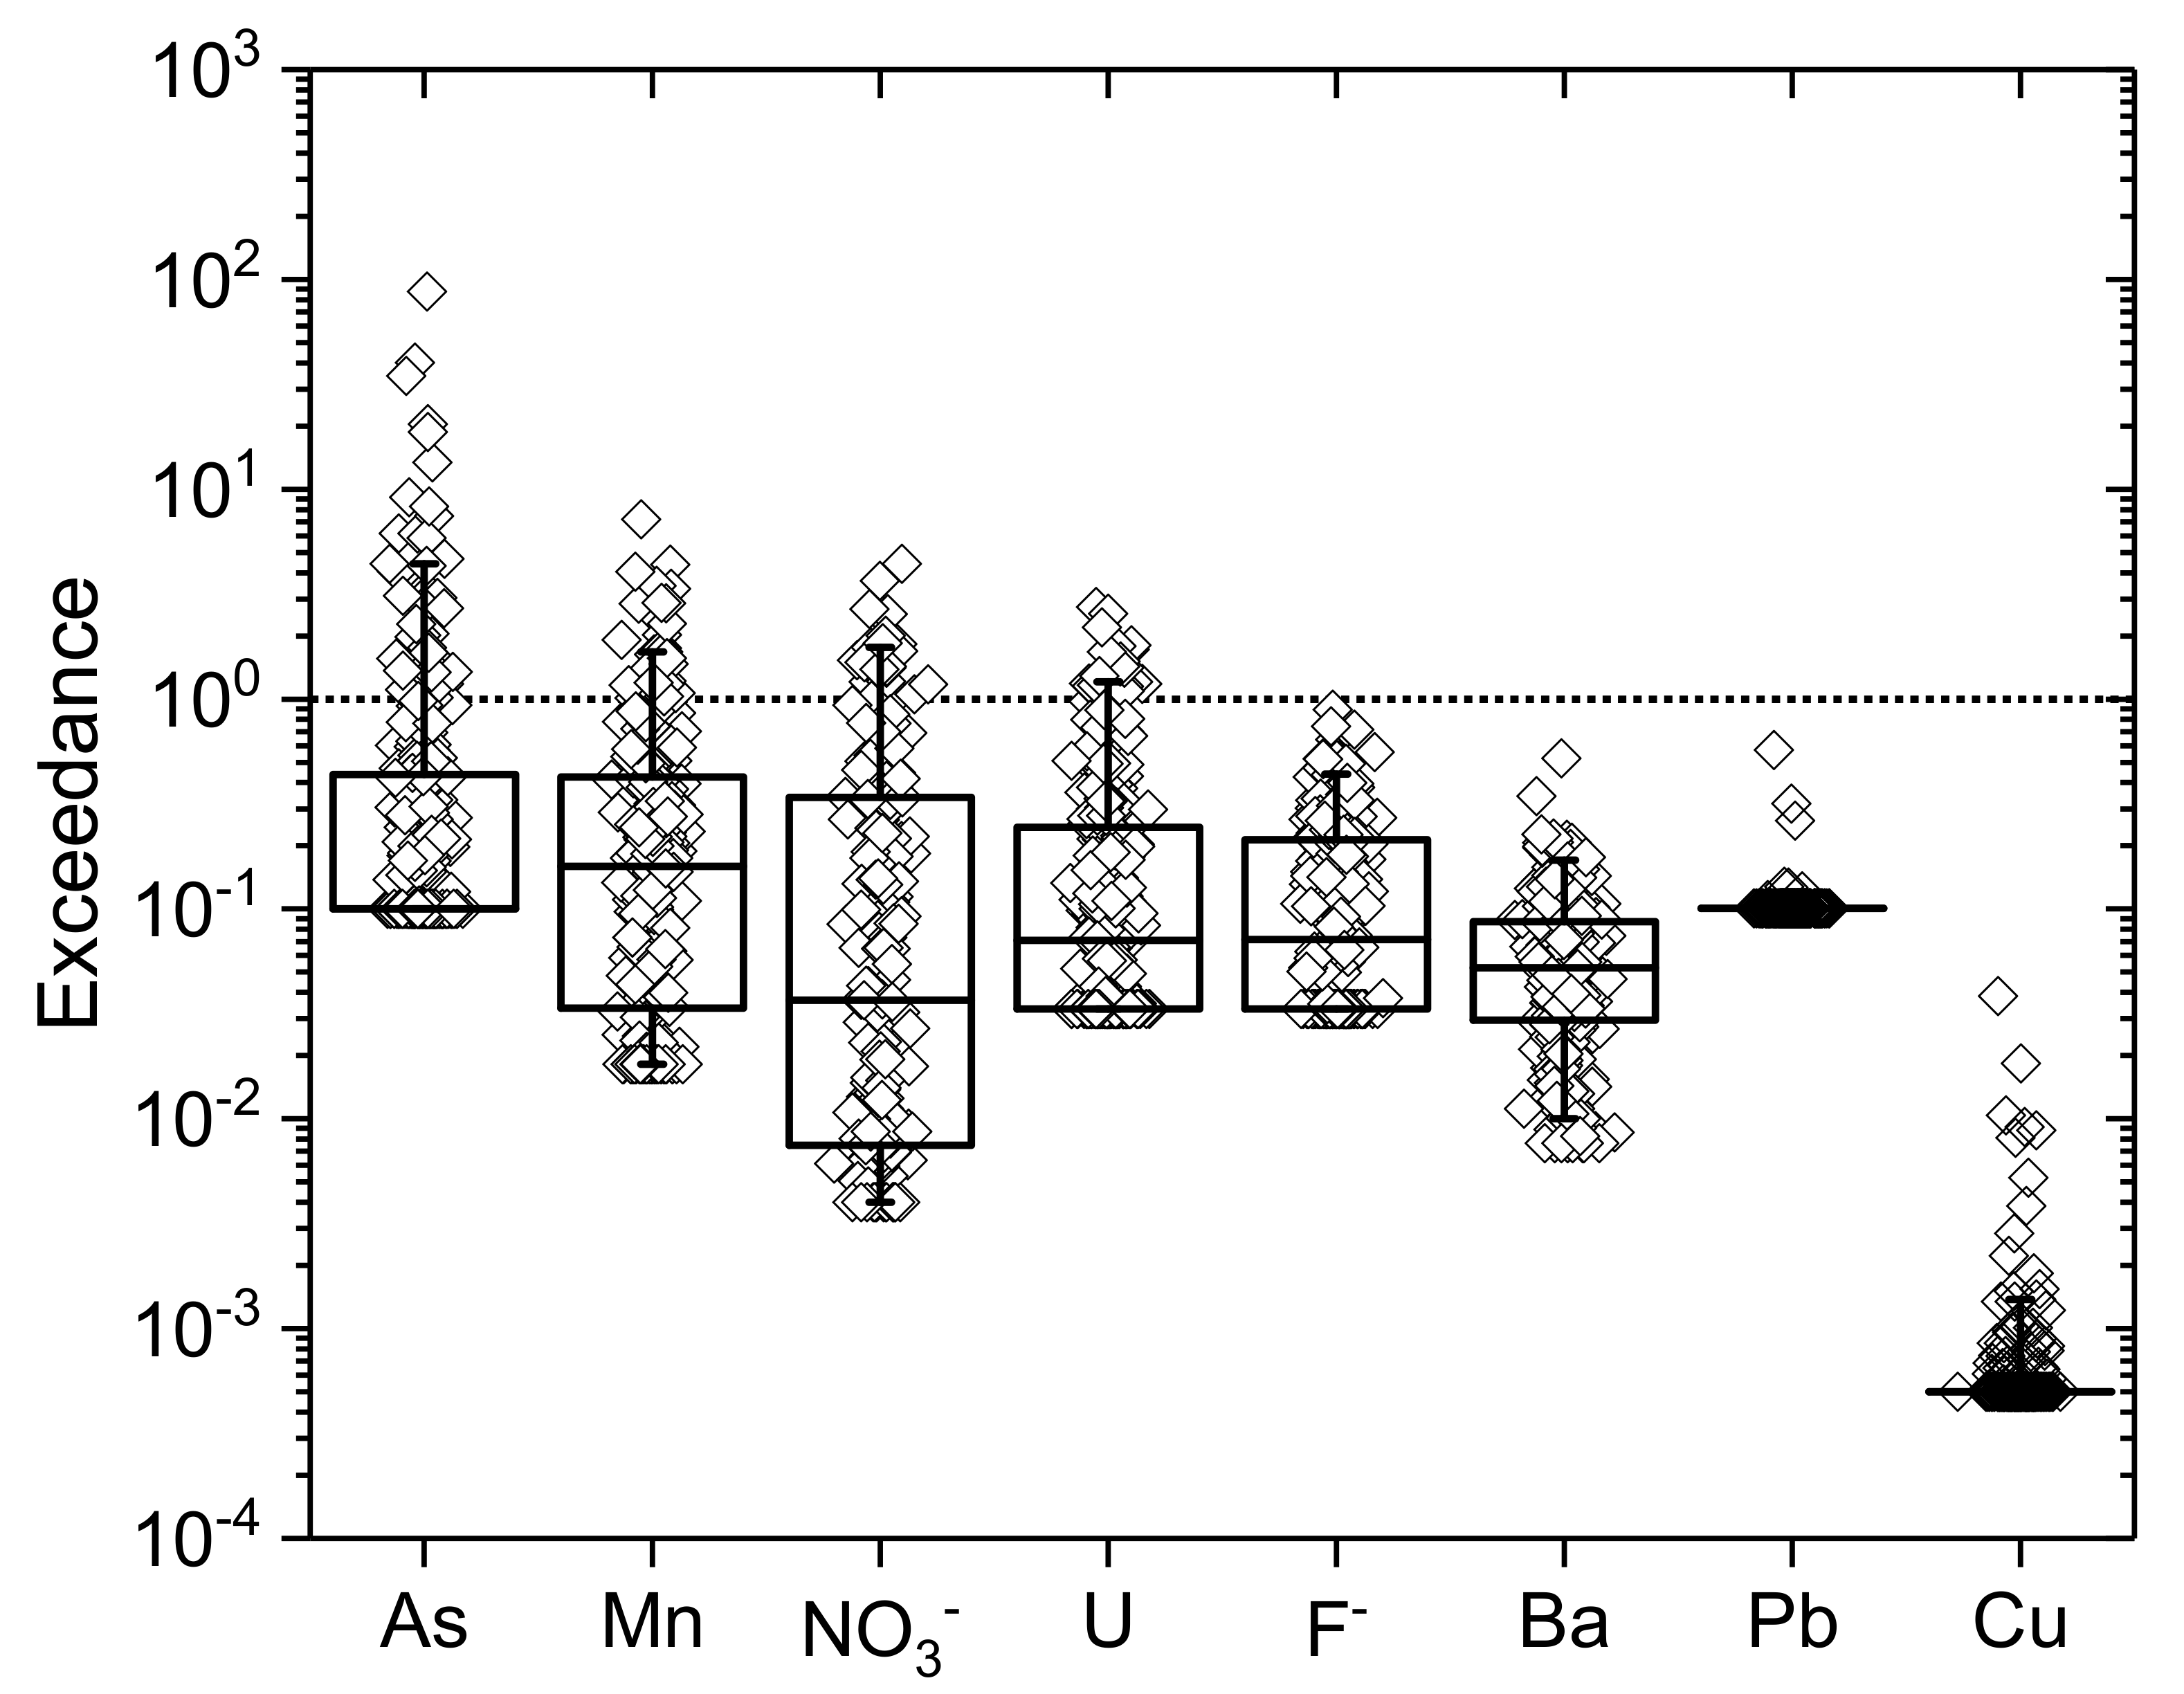
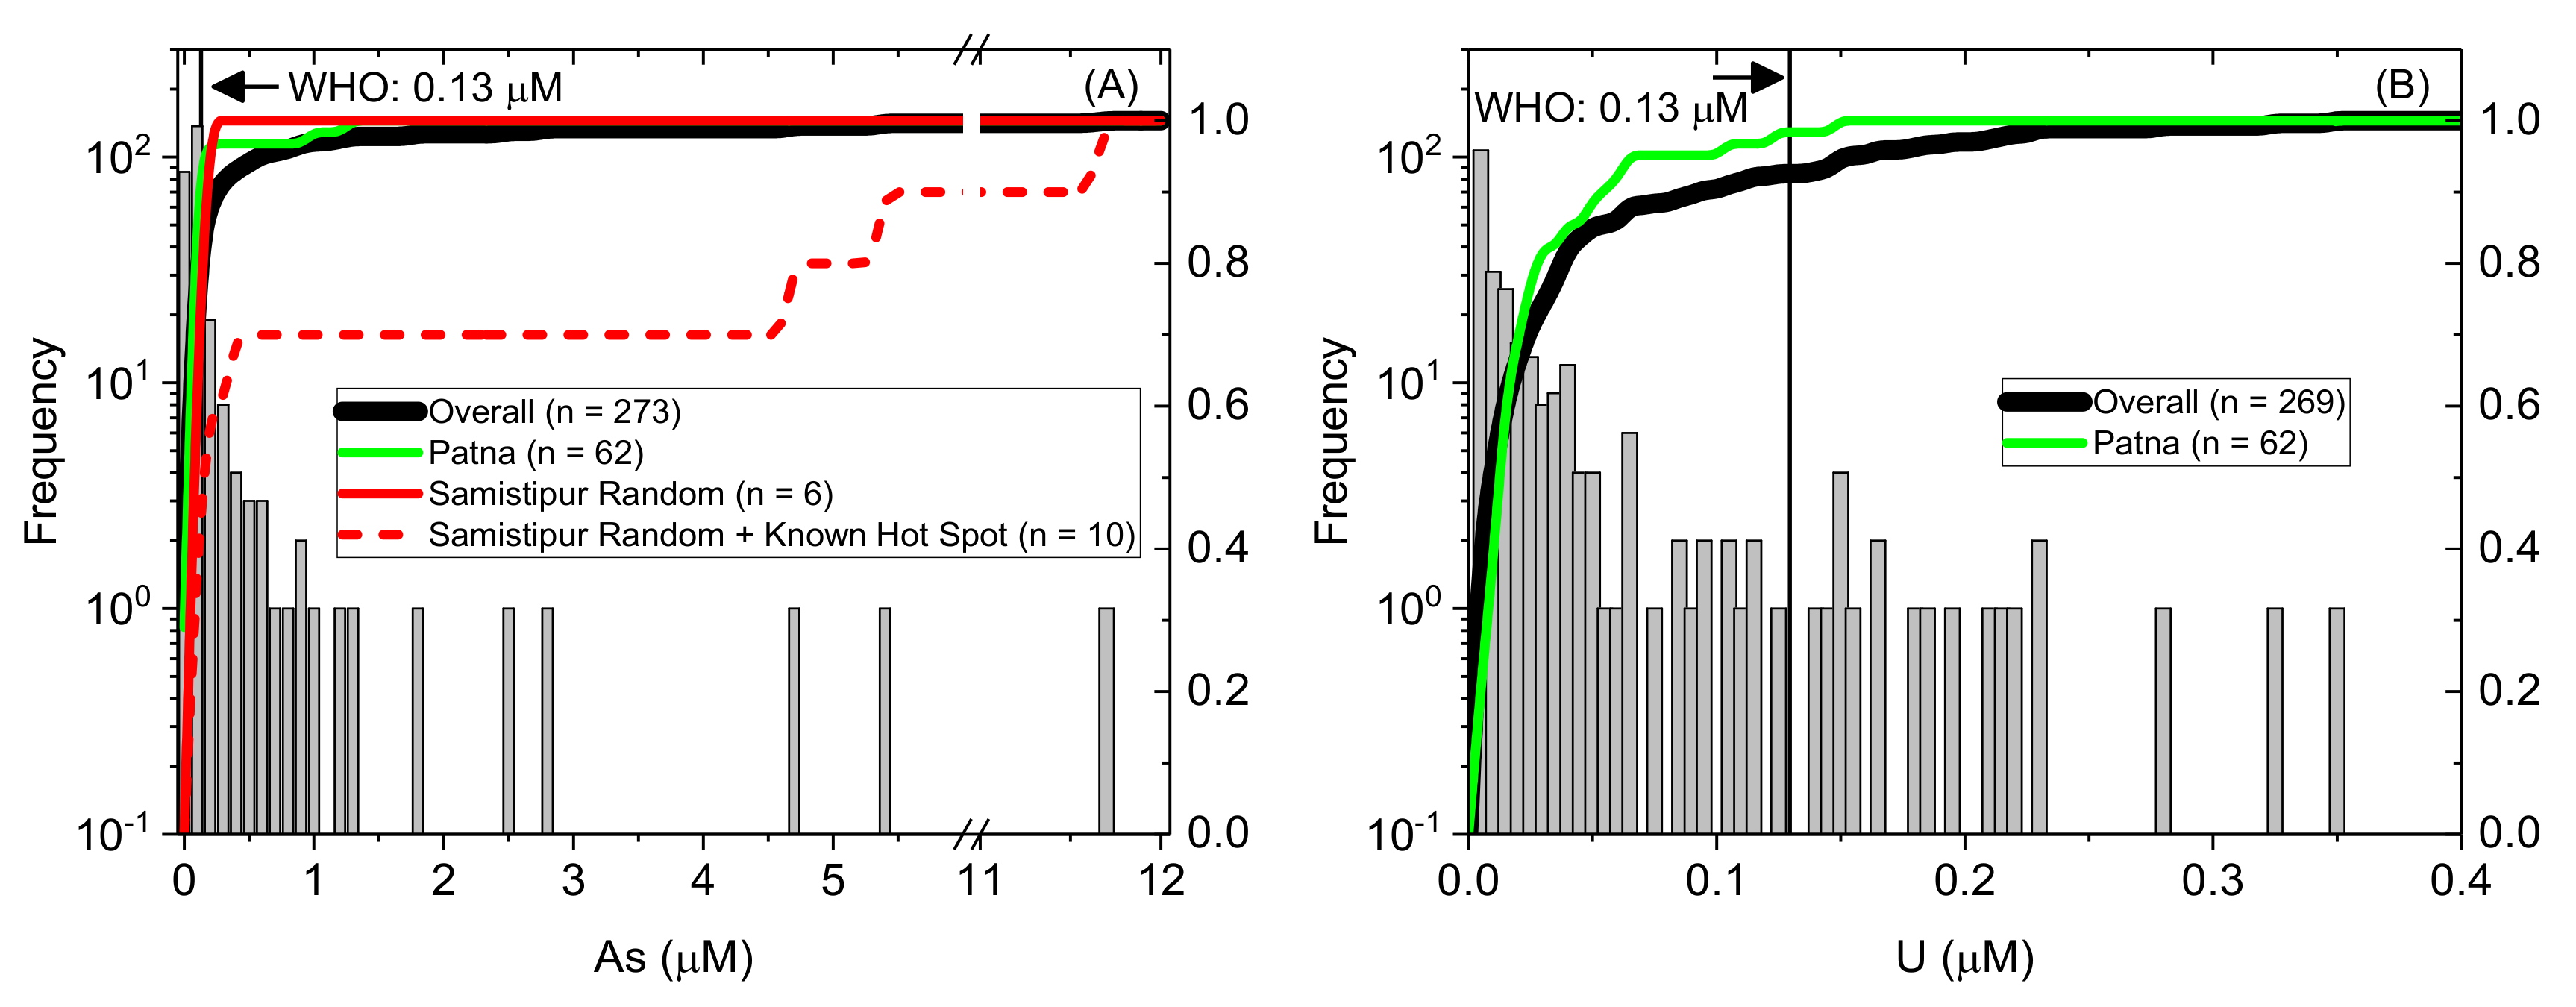
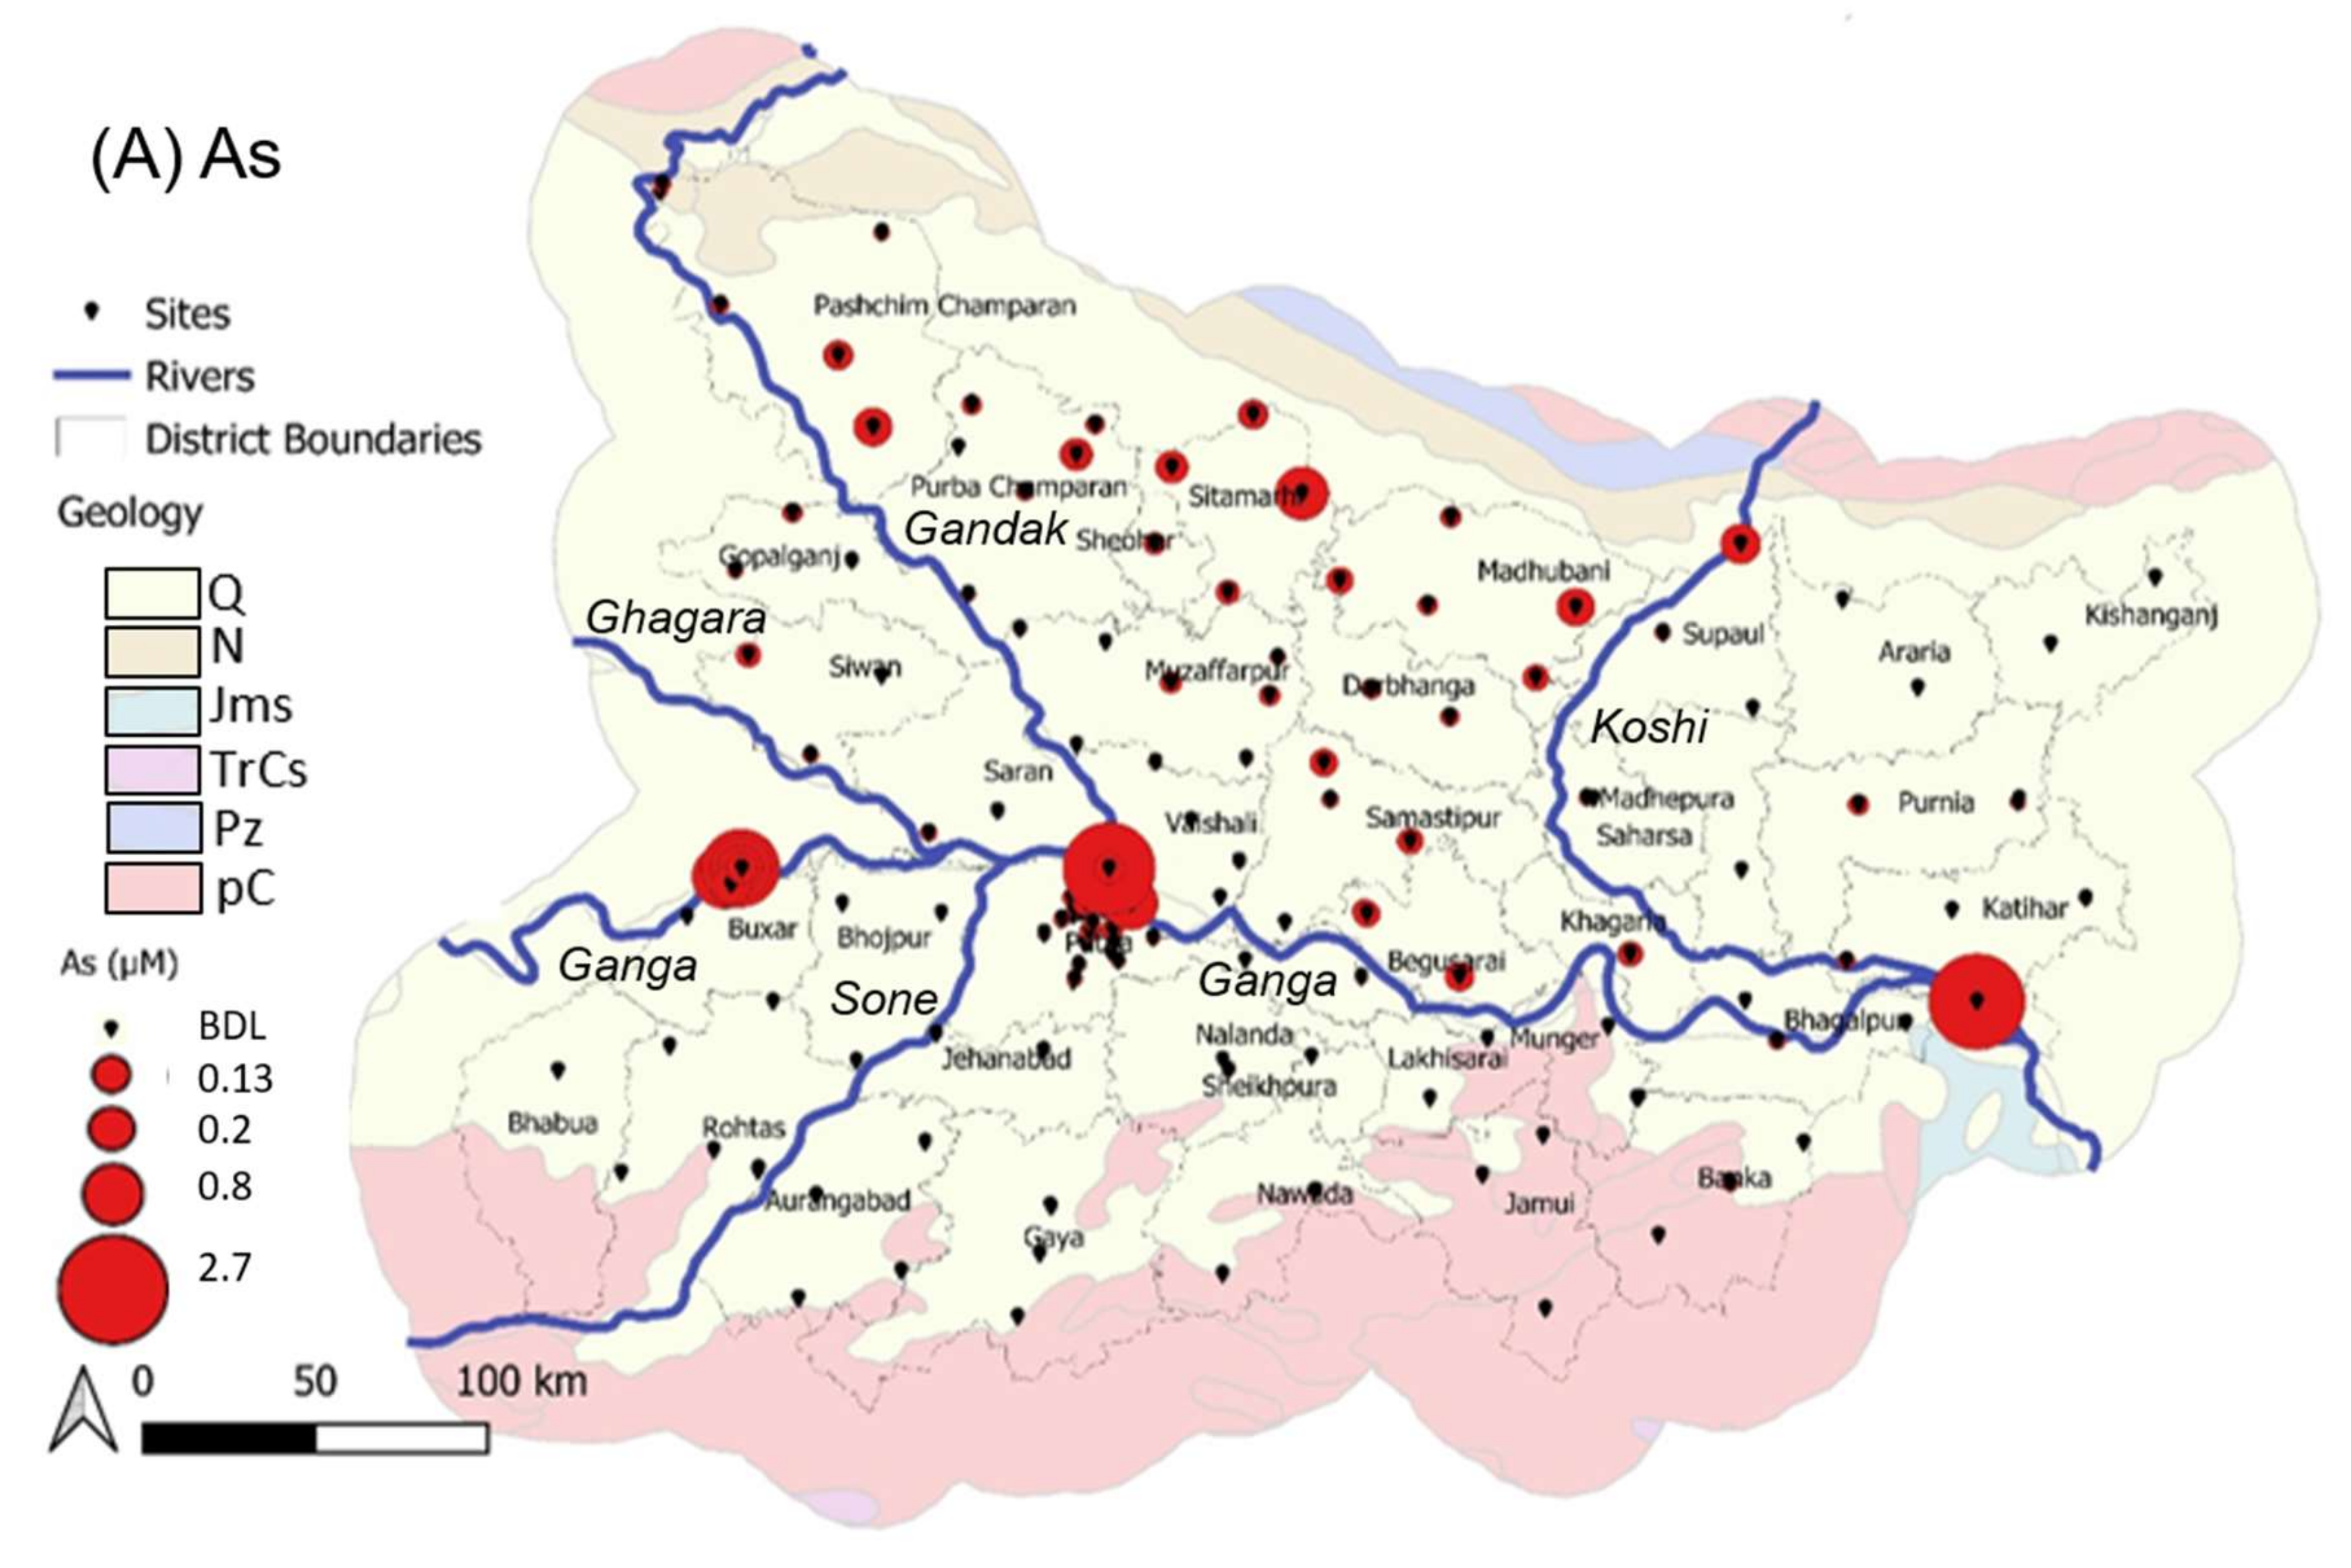
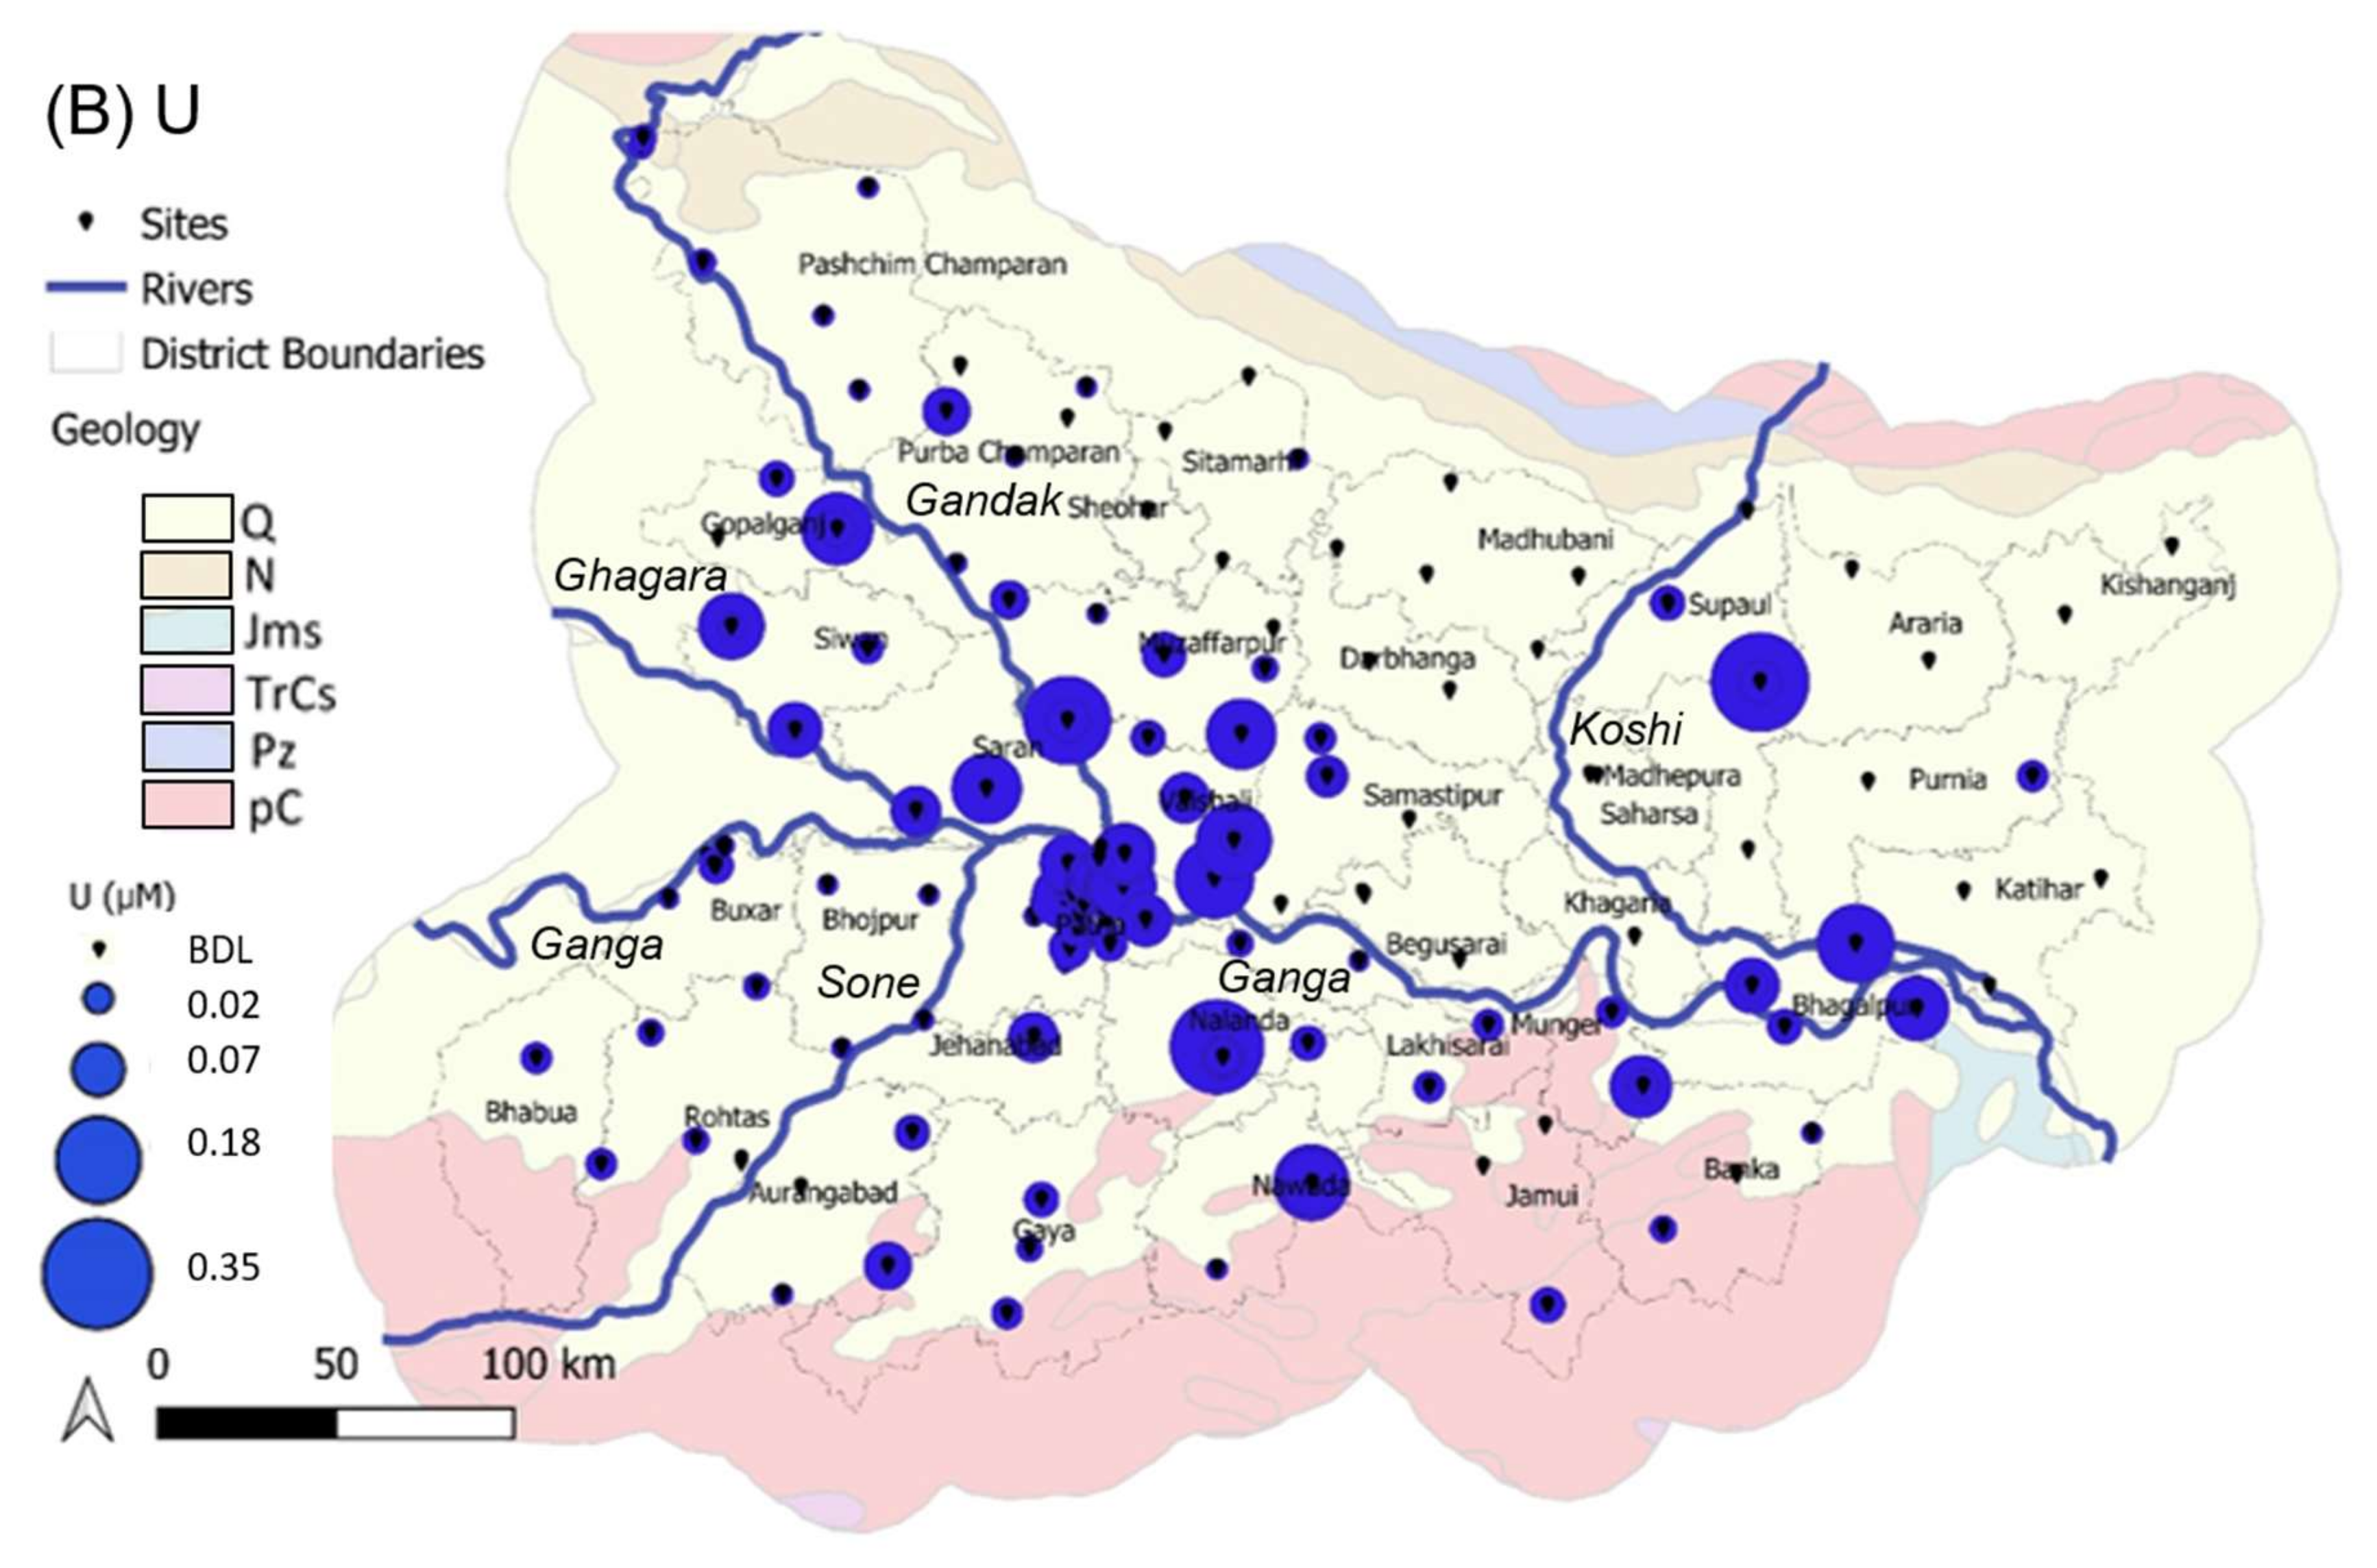
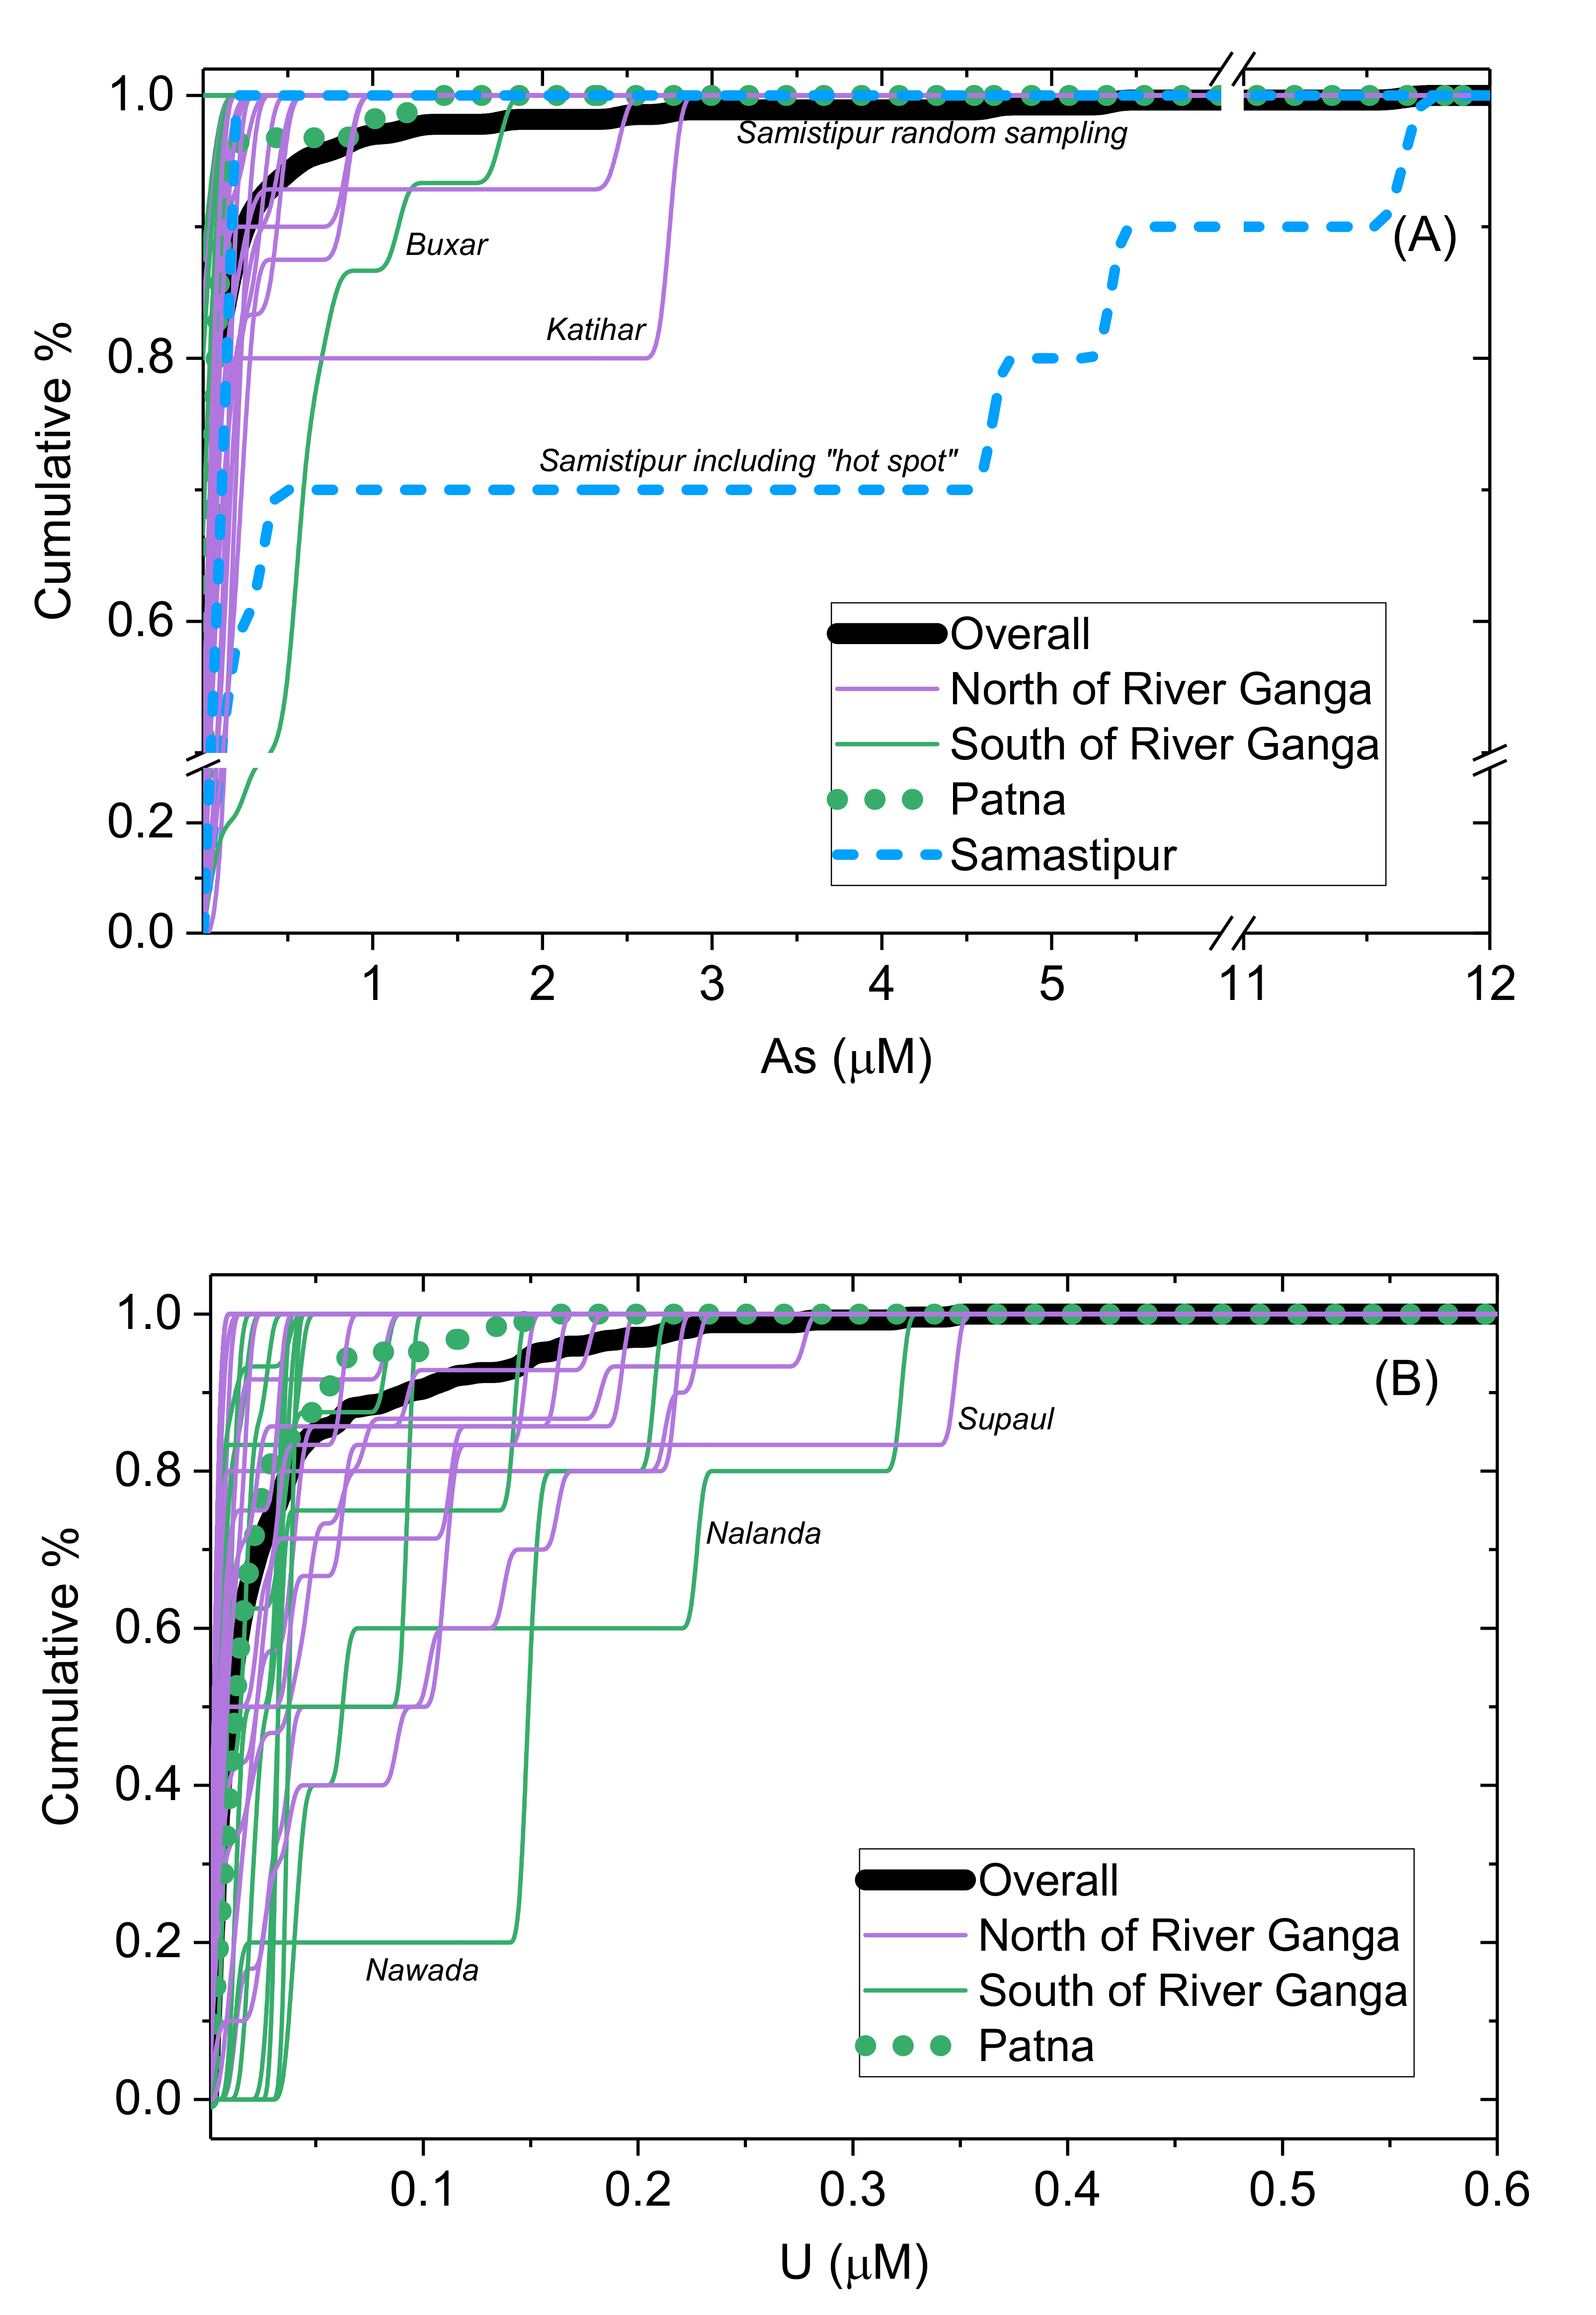
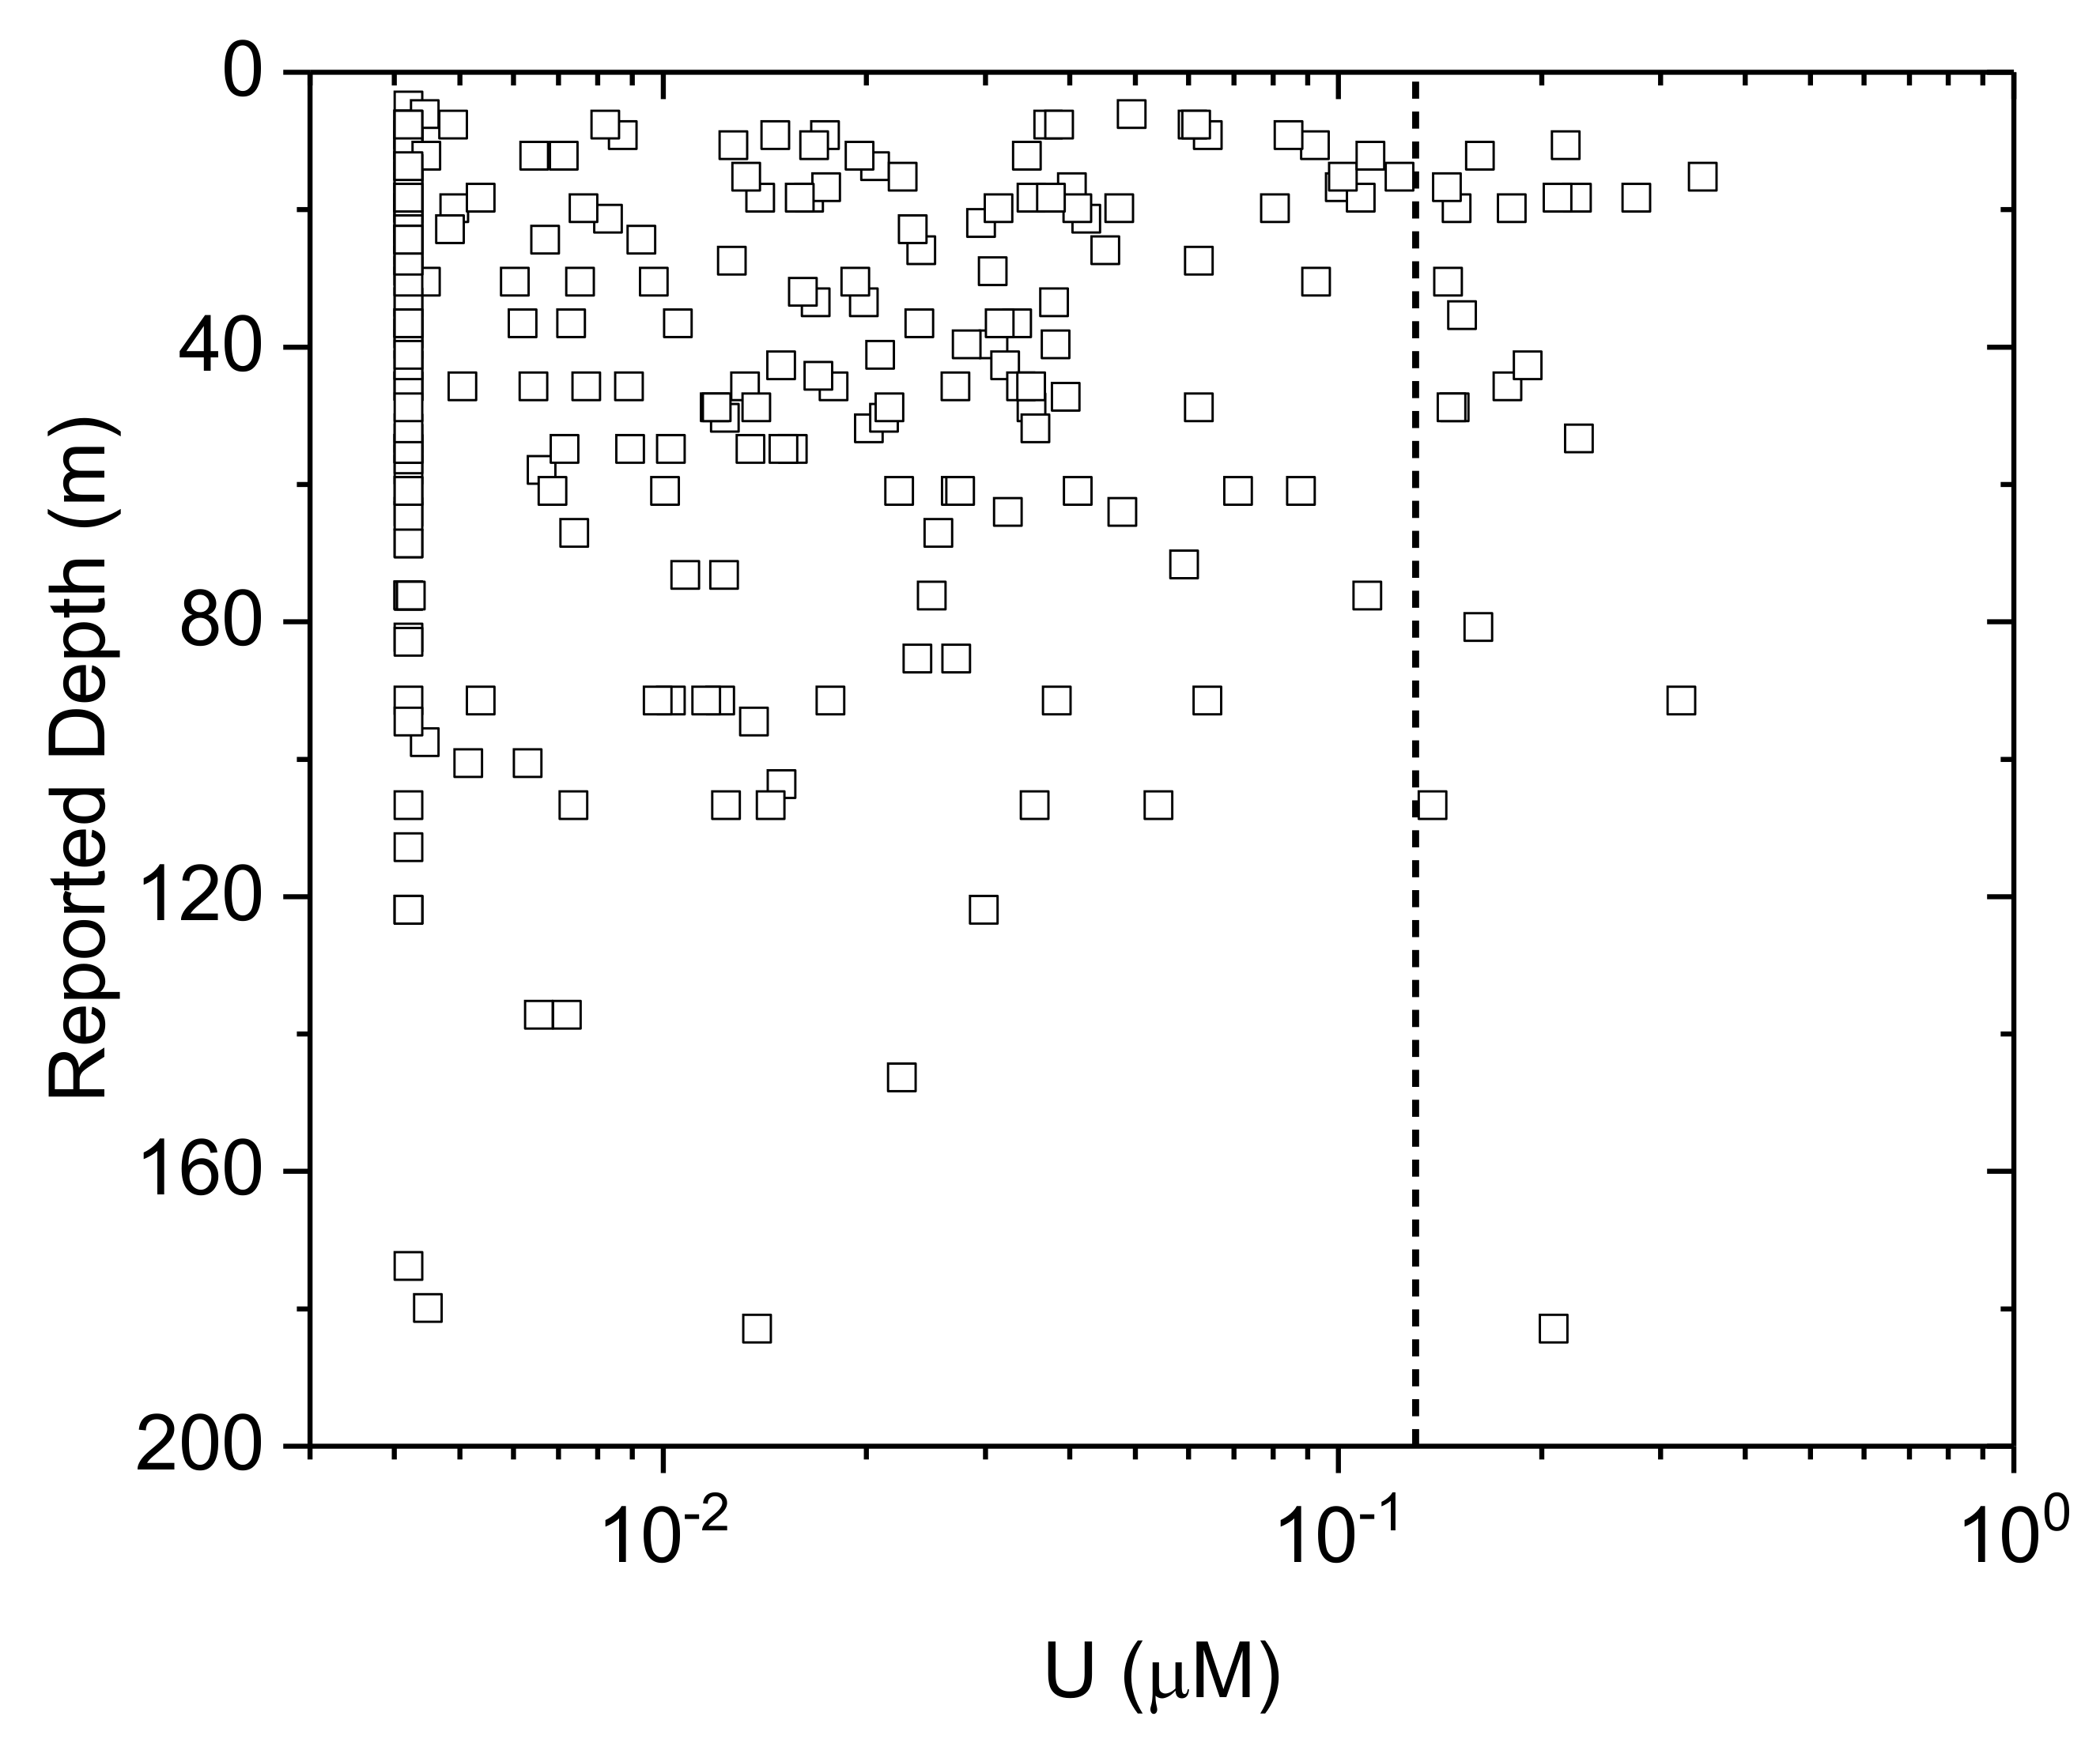
3.3. Arsenic and Uranium Distribution in Bihar
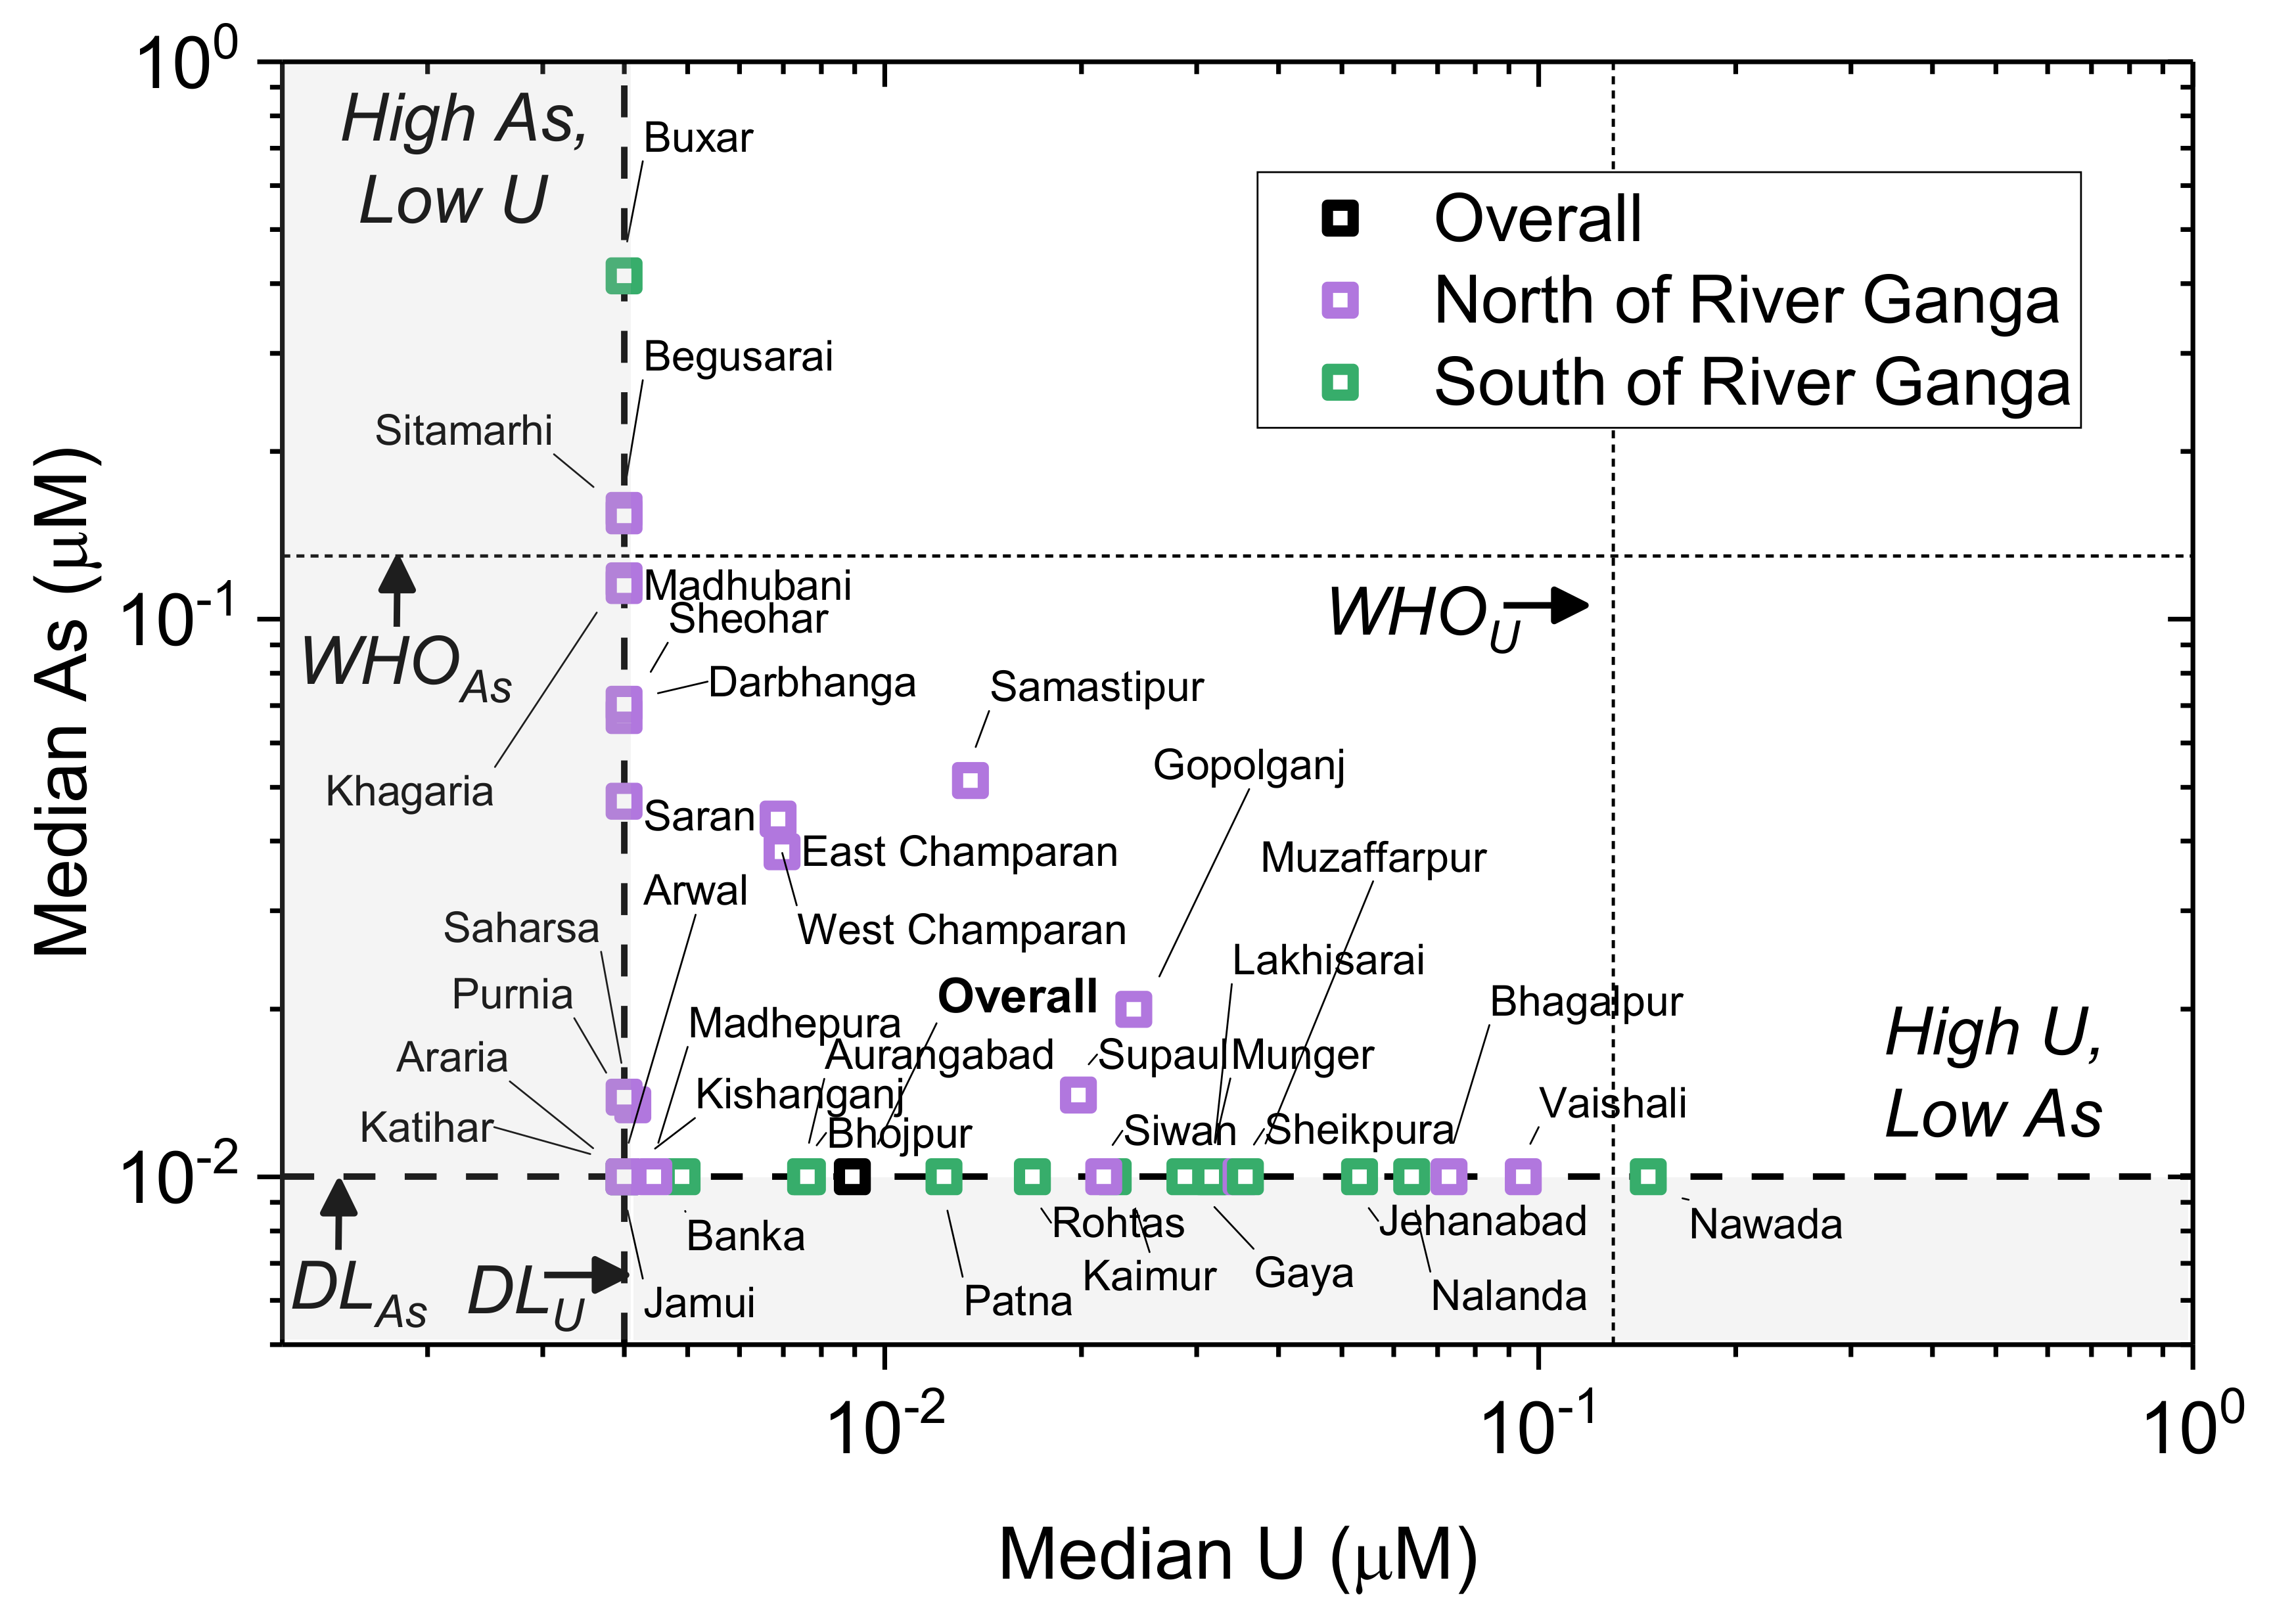
3.4. Distric-Specific Evaluation
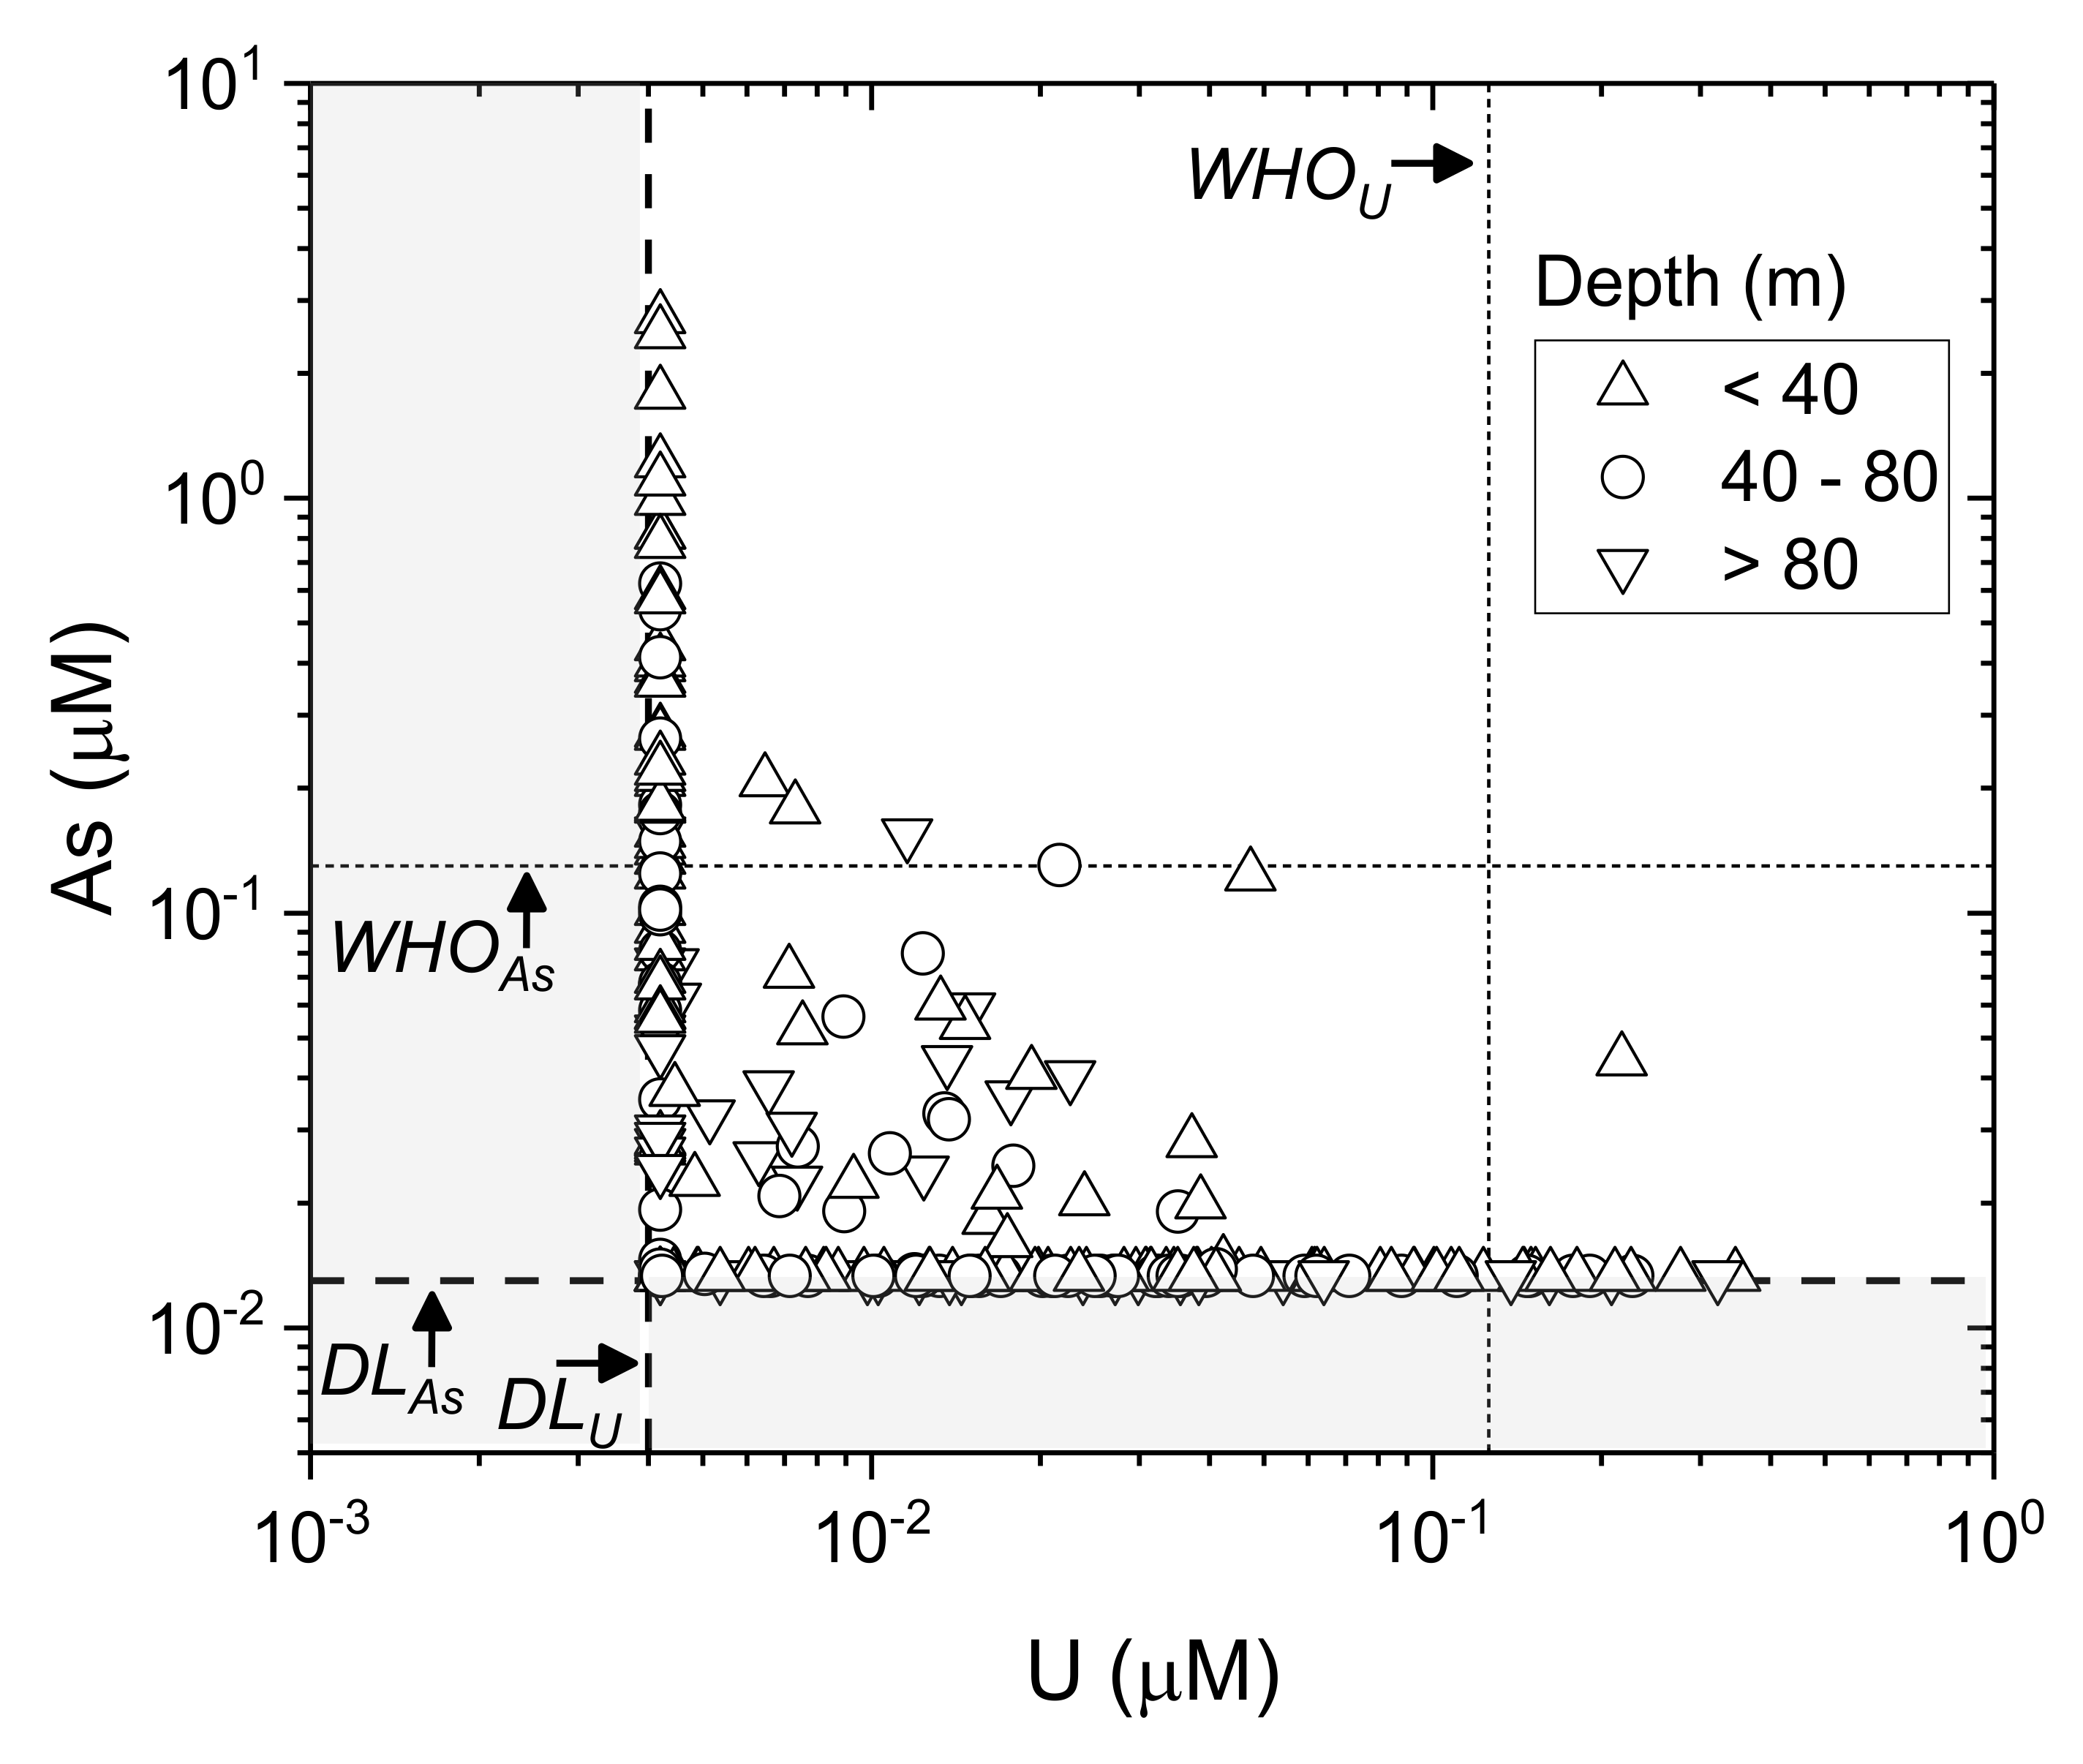
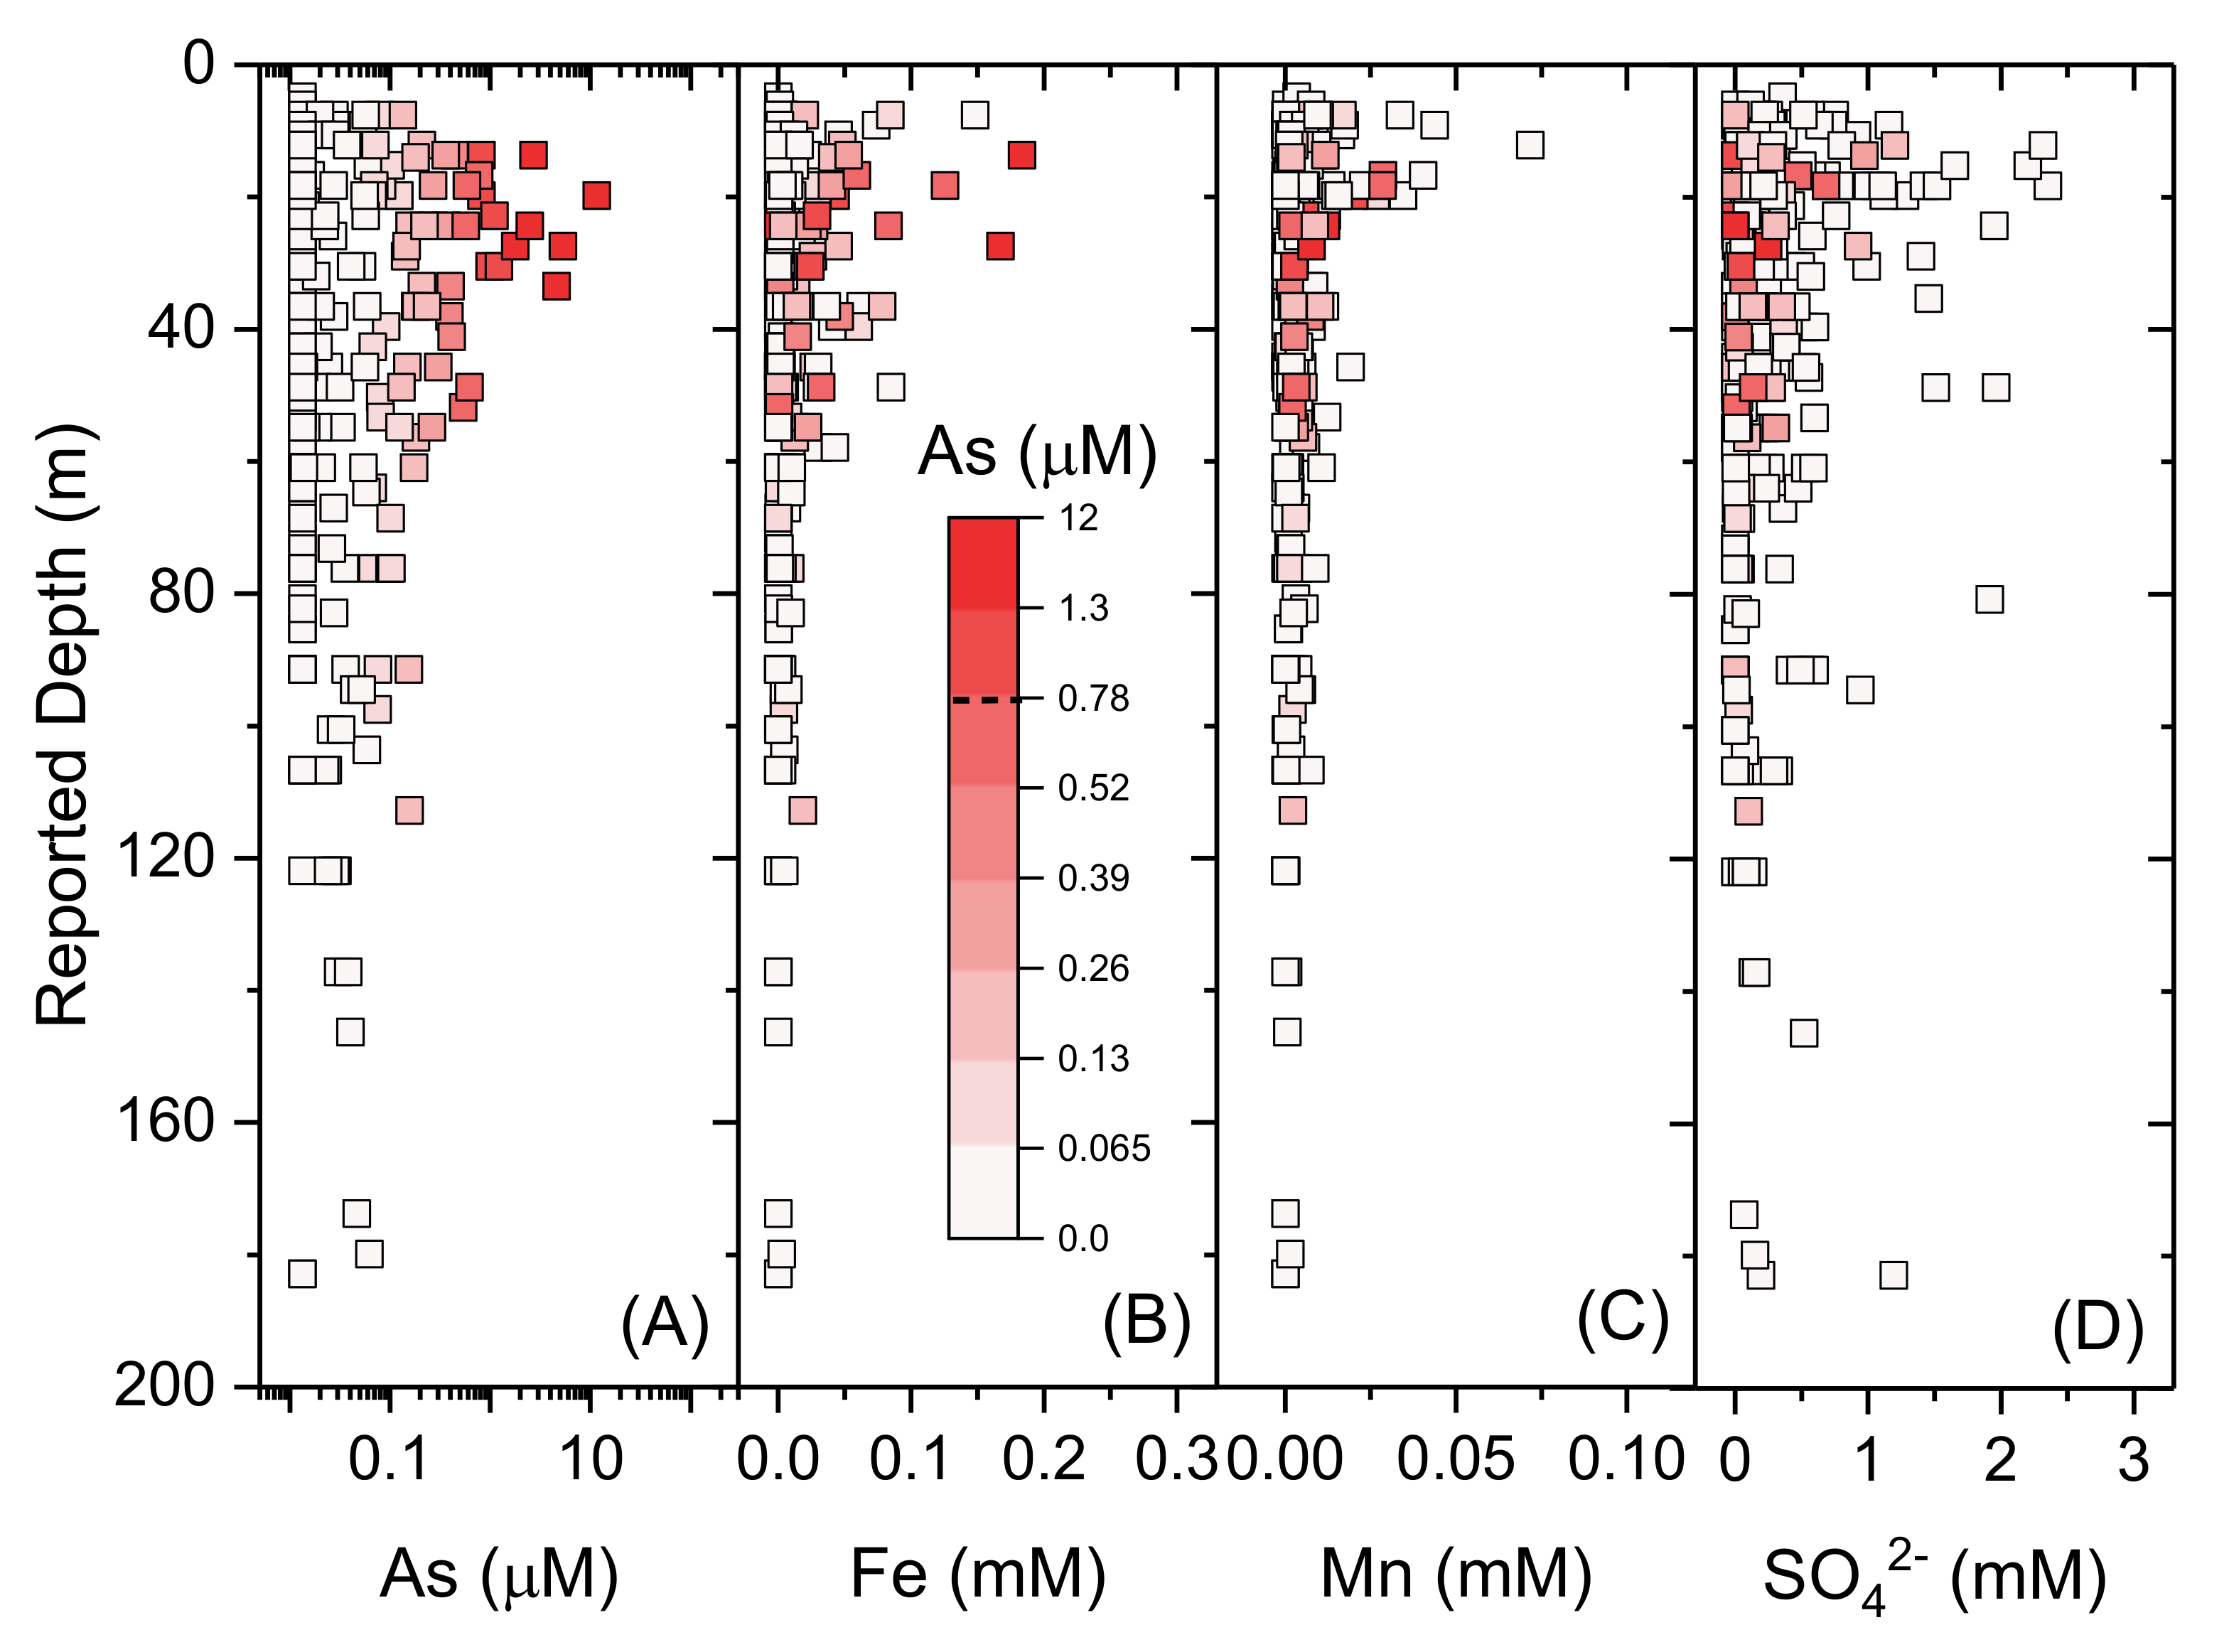
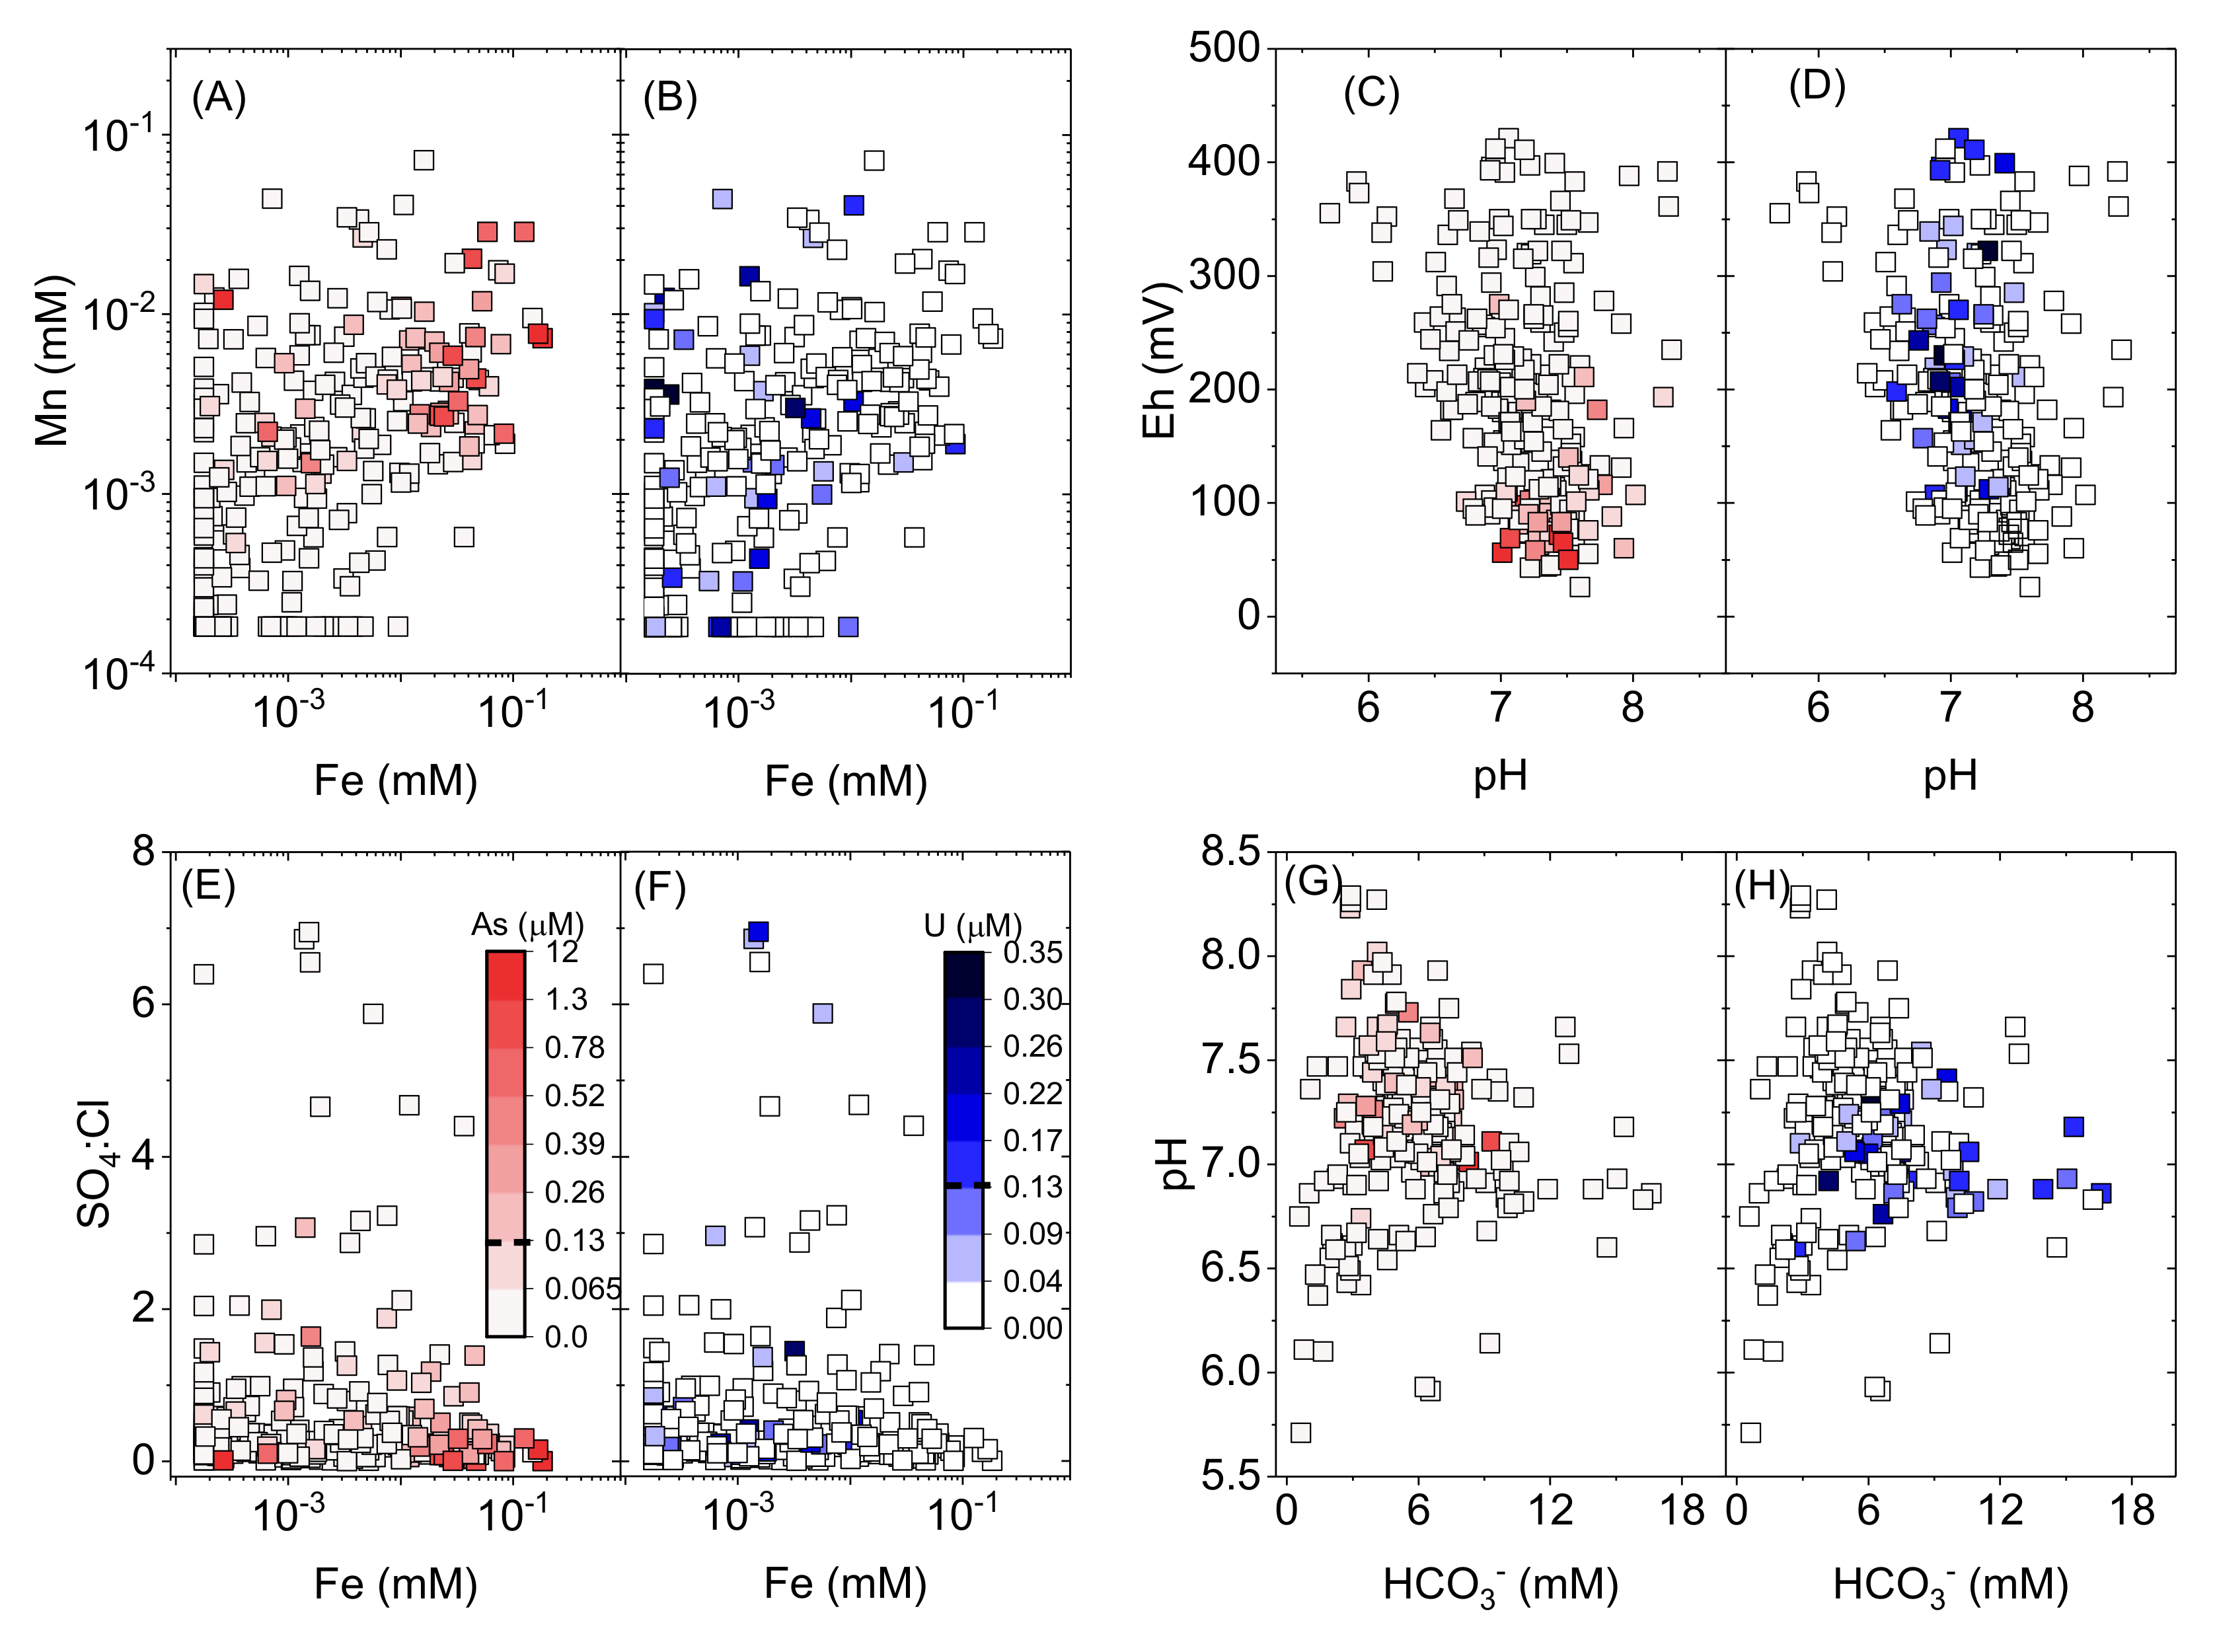
3.5. Geochemical Controls on Arsenic Mobility
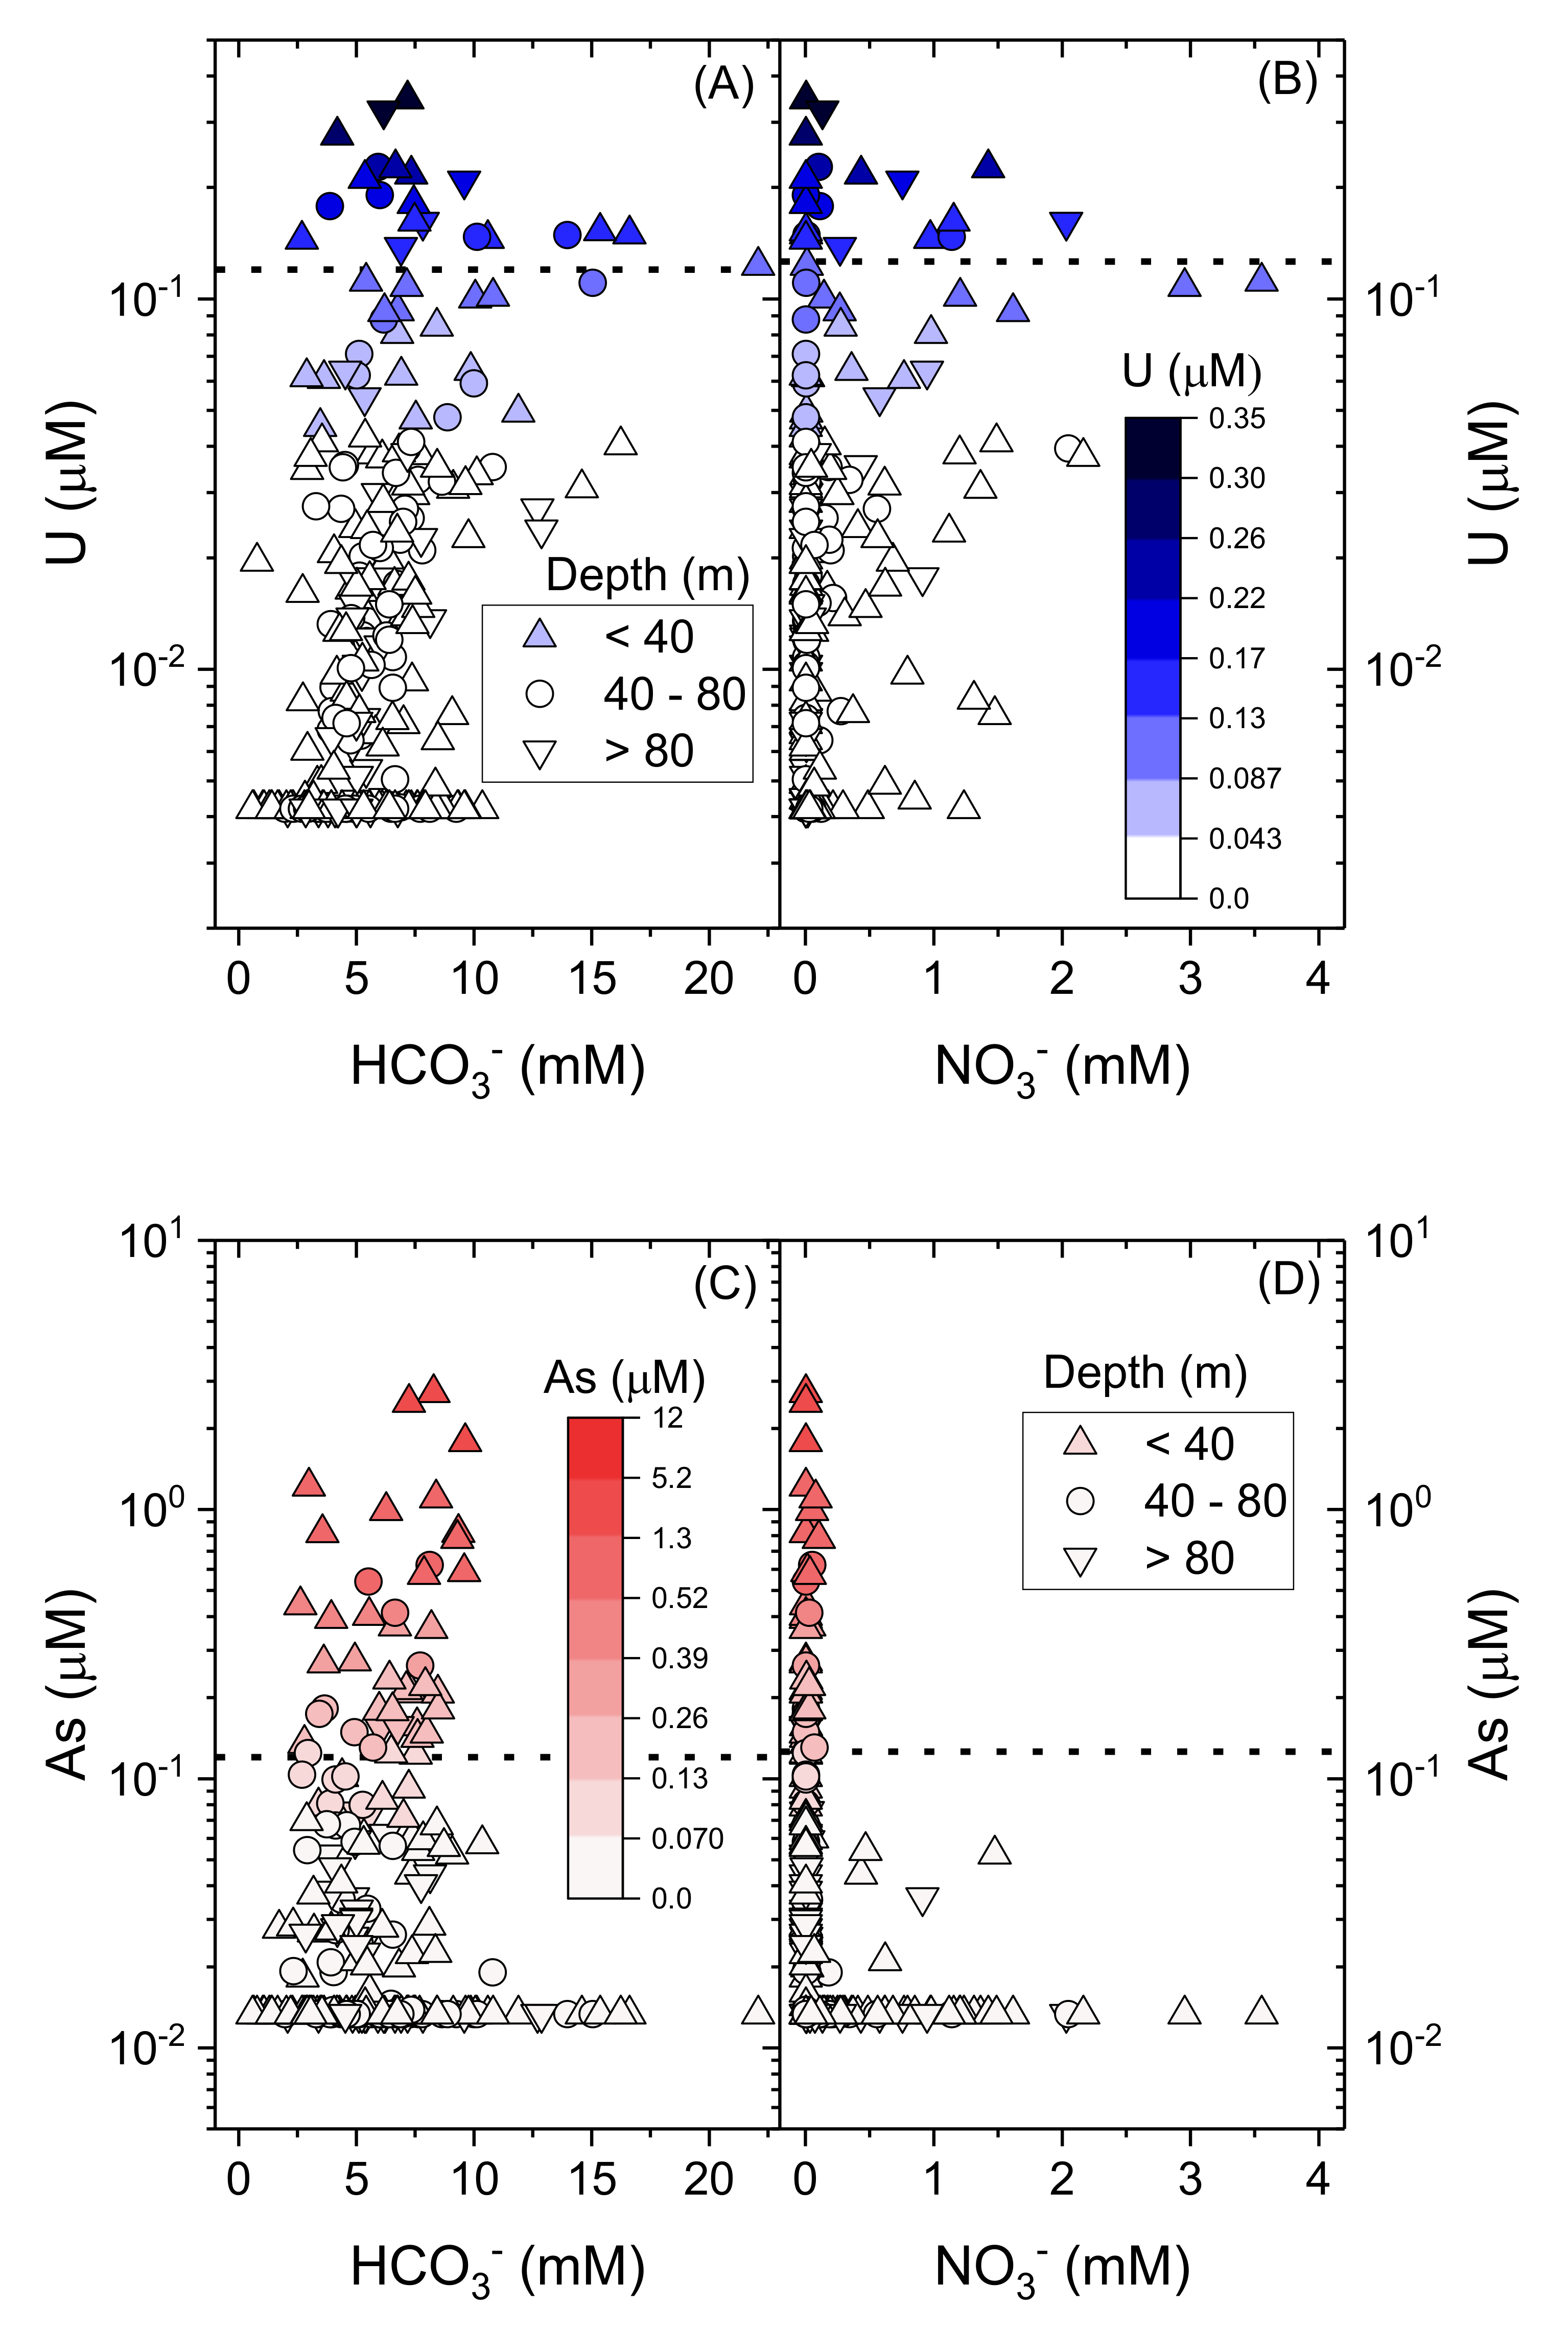
3.6. Geochemical Controls on Uranium Mobility
4. Conclusions
Author Contributions
Funding
Acknowledgments
Conflicts of Interest
References
- Smedley, L.P.; Kinniburgh, D.G. A review of the source, behaviour and distribution of arsenic in natural waters. Appl. Geochem. 2002, 17, 517–568. [Google Scholar] [CrossRef] [Green Version]
- Charlet, L.; Polya, D.A. Arsenic in Shallow, Reducing Groundwaters in Southern Asia: An Environmental Health Disaster. Elements 2006, 2, 91–96. [Google Scholar] [CrossRef]
- Ravenscroft, P.; Brammer, H.; Richards, K. Arsenic Pollution—A Global Synthesis. Royal Geographical Society with IBG; Wiley-Blackwell: Chichester, UK, 2009; p. 588. [Google Scholar]
- World Health Organization. Guidelines for Drinking-Water Quality, 4th ed.; World Health Organization: Geneva, Switzerland, 2011. [Google Scholar]
- Smith, A.H.; Lingas, E.O.; Rahman, M. Contamination of drinking-water by arsenic in Bangladesh: A public health emergency. Bull. World Health Organ. 2000, 78, 1093–1103. [Google Scholar] [PubMed]
- Harvey, C.F.; Swartz, C.H.; Badruzzaman, A.B.M.; Keon-Blute, N.; Yu, W.; Ashraf Ali, M.; Jay, J.; Beckie, R.; Niedan, V.; Brabander, D.; et al. Arsenic mobility and groundwater extraction in Bangladesh. Science 2002, 298, 1602–1606. [Google Scholar] [CrossRef] [Green Version]
- Kinniburgh, D.G.; Smedley, P.L. Arsenic Contamination of Groundwater in Bangladesh, Vol. 2: Final Report, in BGS Technical Report WC/00/19; British Geological Survey: Nicker Hill, UK, 2001; Volume 2. [Google Scholar]
- Ahmed, K.M.; Bhattacharua, P.; Hasan, M.A.; Akhter, S.H.; Alam, S.M.M.; Bhuian, M.A.H.; Khan, A.A.; Sracek, O. Arsenic enrichment in groundwater of the alluvial aquifers in Bangladesh: An overview. Appl. Geochem. 2004, 19, 181–200. [Google Scholar] [CrossRef]
- Horneman, A.; van Geen, A.; Kent, D.V.; Mathe, P.E.; Zheng, Y.; Dhar, R.K.; O’Connell, S.; Moque, M.A.; Aziz, Z.; Shamsudduha, M.; et al. Decoupling of As and Fe release to Bangladesh groundwater under reducing conditions. Part I: Evidence from sediment profiles. Geochim. Et Cosmochim. Acta 2004, 68, 3459–3473. [Google Scholar] [CrossRef] [Green Version]
- Van Geen, A.; Protus, T.; Cheng, Z.; Horneman, A.; Seddique, A.A.; Hoque, M.A.; Ahmed, K.M. Testing groundwater for arsenic in Bangladesh before installing a well. Environ. Sci. Technol. 2004, 38, 6783–6789. [Google Scholar] [CrossRef]
- Neumann, R.B.; Ashfaque, K.N.; Badruzzaman, A.B.M.; Ali, M.A.; Shoemaker, J.K.; Harvey, C.F. Anthropogenic influences on groundwater arsenic concentrations in Bangladesh. Nat. Geosci. 2010, 3, 46–52. [Google Scholar] [CrossRef]
- Yu, W.H.; Harvey, C.M.; Harvey, C.F. Arsenic in groundwater in Bangladesh: A geostatistical and epidemiological framework for evaluating health effects and potential remedies. Water Resour. Res. 2003, 39, 1146–1163. [Google Scholar] [CrossRef] [Green Version]
- Bhattacharya, P.; Jacks, G.; Ahmed, K.M.; Routh, J.; Khan, A.A. Arsenic in Groundwater of the Bengal Delta Plain Aquifers in Bangladesh. Bull. Environ. Contam. Toxicol. 2002, 69, 538–545. [Google Scholar] [CrossRef]
- McArthur, J.; Ravenscroft, P.; Safiulla, S.; Thirwall, M.F. Arsenic in groundwater: Testing pollution mechanisms for sedimentary aquifers in Bangladesh. Water Resour. Res. 2001, 37, 109–117. [Google Scholar] [CrossRef]
- Nickson, R.T.; McArthur, J.M.; Burgess, W.G.; Ahmed, K.M.; Ravenscroft, P.; Rahman, M. Arsenic poisoning of Bangladesh groundwater. Nature 1998, 395, 338. [Google Scholar] [CrossRef] [PubMed]
- Polya, D.A.; Gault, A.G.; Bourne, N.J.; Lythgoe, P.R.; Cooke, D.A. Coupled HPLC-ICP-MS analysis indicates highly hazardous concentrations of dissolved arsenic species in Cambodian groundwaters. R. Soc. Chem. Spec. Publ. 2003, 288, 127–140. [Google Scholar]
- Polya, D.A.; Gault, A.G.; Diebe, N.; Feldman, P.; Rosenboom, J.W.; Gilligan, E.; Fredericks, D.; Milton, A.H.; Sampson, M.; Rowland, H.A.L.; et al. Arsenic hazard in shallow Cambodian groundwaters. Mineral. Mag. 2005, 69, 807–823. [Google Scholar] [CrossRef]
- Tamura, T.; Saito, Y.; Sieng, S.; Ben, B.; Kong, M.; Choup, S.; Tsukawaki, S. Depositional facies and radiocarbon ages of a drill core from the Mekong River lowland near Phnom Penh, Cambodia: Evidence for tidal sedimentation at the time of Holocene maximum flooding. J. Asian Earth Sci. 2007, 29, 585–592. [Google Scholar] [CrossRef] [Green Version]
- Benner, S.G.; Polizzotto, M.L.; Kocar, B.D.; Ganguly, S.; Phan, K.; Ouch, K.; Sampson, M.; Fendorf, S. Groundwater flow in an arsenic-contaminated aquifer, Mekong Delta, Cambodia. Appl. Geochem. 2008, 23, 3072–3087. [Google Scholar] [CrossRef]
- Kocar, B.D.; Polizzotto, M.L.; Benner, S.G.; Ying, S.C.; Ung, M.; Ouch, K.; Samreth, S.; Suy, B.; Phan, K.; Sampson, M.; et al. Integrated biogeochemical and hydrologic processes driving arsenic release from shallow sediments to groundwaters of the Mekong delta. Appl. Geochem. 2008, 23, 3059–3071. [Google Scholar] [CrossRef]
- Polizzotto, M.L.; Kocar, B.D.; Benner, S.G.; Sampson, M.; Fendorf, S. Near-surface wetland sediments as a source of arsenic release to ground water in Asia. Nature 2008, 454, 505–508. [Google Scholar] [CrossRef]
- Rowland, H.A.L.; Gault, A.G.; Lythgoe, P.; Polya, D.A. Geochemistry of aquifer sediments and arsenic-rich groundwaters from Kandal Province, Cambodia. Appl. Geochem. 2008, 23, 3029–3046. [Google Scholar] [CrossRef]
- Van Dongen, B.; Rowland, H.A.L.; Gault, A.G.; Polya, D.A.; Bryant, C.; Pancost, R.D. Hopane, sterane and n-alkane distributions in shallow sediments hosting high arsenic groundwaters in Cambodia. Appl. Geochem. 2008, 23, 3047–3058. [Google Scholar] [CrossRef]
- Polya, D.A.; Charlet, L. Rising arsenic risk? Nat. Geosci. 2009, 2, 383–384. [Google Scholar] [CrossRef]
- Lawson, M.; Polya, D.A.; Boyce, A.J.; Bryant, C.; Mondal, D.; Shantz, A.; Ballentine, C.J. Pond-derived organic carbon driving changes in arsenic hazard found in Asian groundwaters. Environ. Sci. Technol. 2013, 47, 7085–7094. [Google Scholar] [CrossRef] [PubMed] [Green Version]
- Lawson, M.; Polya, D.A.; Boyce, A.J.; Bryant, C.; Ballentine, C.J. Tracing organic matter composition and distribution and its role on arsenic release in shallow Cambodian groundwaters. Geochim. Cosmochim. Acta 2016, 178, 160–177. [Google Scholar] [CrossRef]
- Richards, L.A.; Magnone, D.; Sovann, C.; Kong, C.; Uhlemann, S.; Kuras, O.; van Dongen, B.E.; Ballentine, C.J.; Polya, D.A. High Resolution Profile of Inorganic Aqueous Geochemistry and Key Redox Zones in an Arsenic Bearing Aquifer in Cambodia. Sci. Total Environ. 2017, 590, 540–553. [Google Scholar] [CrossRef] [PubMed] [Green Version]
- Richards, L.A.; Magnone, D.; Sültenfuß, J.; Chambers, L.; Bryant, C.; Boyce, A.J.; van Dongen, B.E.; Ballentine, C.J.; Sovann, C.; Uhlemann, S.; et al. Dual in-aquifer and near surface processes drive arsenic mobilization in Cambodian groundwaters. Sci. Total Environ. 2019, 659, 699–714. [Google Scholar] [CrossRef] [PubMed]
- Richards, L.A.; Lapworth, D.J.; Gooddy, D.C.; Chambers, L.; Williams, P.J.; van Dongen, B.E.; Polya, D.A. Dissolved organic matter tracers reveal contrasting characteristics across high arsenic aquifers in Cambodia: A fluorescence spectroscopy study. Geosci. Front. 2019, 10, 1653–1667. [Google Scholar] [CrossRef]
- Mai, N.T.H.; Postma, D.; Trang, P.T.K.; Jessen, S.; Viet, P.H.; Larsen, F. Adsorption and desorption of arsenic to aquifer sediment on the Red River floodplain at Nam Du, Vietnam. Geochim. Cosmochim. Acta 2014, 142, 587–600. [Google Scholar] [CrossRef] [Green Version]
- Berg, M.; Tran, H.C.; Nguyen, T.C.; Pham, H.V.; Schertenleib, R.; Giger, W. Arsenic contamination of groundwater and drinking water in Vietnam: A human health threat. Environ. Sci. Technol. 2001, 35, 2621–2626. [Google Scholar] [CrossRef] [Green Version]
- Postma, D.; Larsen, F.; Minh Hue, N.T.; Duc, M.T.; Viet, P.H.; Nhan, P.Q.; Jessen, S. Arsenic in groundwater of the Red River floodplain, Vietnam: Controlling geochemical processes and reactive transport modeling. Geochim. Cosmochim. Acta 2007, 71, 5054–5071. [Google Scholar] [CrossRef]
- Polya, D.A.; Berg, M.; Gault, A.G.; Takahashi, Y. Arsenic in Groundwaters of South-East Asia: With Emphasis on Cambodia and Vietnam. Appl. Geochem. 2008, 23, 2968–2976. [Google Scholar] [CrossRef]
- Winkel, L.H.E.; Trang, P.T.K.; Lan, V.M.; Stengel, C.; Amini, M.; Ha, N.T.; Viet, P.H.; Berg, M. Arsenic pollution of groundwater in Vietnam exacerbated by deep aquifer exploitation for more than a century. Proc. Natl. Acad. Sci. USA 2011, 108, 1246–1251. [Google Scholar] [CrossRef] [Green Version]
- Huy, T.B.; Tuyet-Hanh, T.T.; Johnston, R.; Nguyen-Viet, H. Assessing Health Risk due to Exposure to Arsenic in Drinking Water in Hanam Province, Vietnam. Int. J. Environ. Res. Public Health 2014, 11, 7575–7591. [Google Scholar] [CrossRef] [PubMed] [Green Version]
- Hug, S.J.; Leupin, O.X.; Berg, M. Bangladesh and Vietnam: Different groundwater compositions require different approaches to arsenic mitigation. Environ. Sci. Technol. 2008, 42, 6318–6323. [Google Scholar] [CrossRef] [PubMed] [Green Version]
- Larsen, F.; Pham, N.Q.; Dang, N.D.; Postma, D.; Jessen, S.; Pham, V.H.; Nguyen, T.B.; Trieu, H.D.; Tran, L.T.; Nguyen, H.; et al. Controlling geological and hydrogeological processes in an arsenic contaminated aquifer on the Red River flood plain, Vietnam. Appl. Geochem. 2008, 23, 3099–3115. [Google Scholar] [CrossRef]
- Postma, D.; Larsen, F.; Thai, N.T.; Trang, P.T.K.; Jakobsen, R.; Nhan, P.Q.; Long, T.V.; Viet, P.H.; Murray, A.S. Groundwaer arsenic concentrations in Vietnam controlled by sediment age. Nat. Geosci. 2012, 5, 656–661. [Google Scholar] [CrossRef]
- Agusa, T.; Trang, P.T.M.; Lan, V.M.; Anh, D.H.; Tanabe, S.; Viet, P.H.; Berg, M. Human exposure to arsenic from drinking water in Vietnam. Sci. Total Environ. 2014, 488–489, 562–569. [Google Scholar] [CrossRef] [Green Version]
- Berg, M.; Trang, P.T.K.; Stengel, C.; Buschmann, J.; Viet, P.H.; Van Dan, N.; Giger, W.; Stüben, D. Hydrological and sedimentary controls leading to arsenic contamination of groundwater in the Hanoi area, Vietnam: The impact of iron-arsenic ratios, peat, river bank deposits, and excessive groundwater abstraction. Chem. Geol. 2008, 249, 91–112. [Google Scholar] [CrossRef] [Green Version]
- Postma, D.; Trang, P.T.K.; Sø, H.U.; Hoan, H.V.; Lan, V.M.; Thai, N.T.; Larsen, F.; Viet, P.H.; Jakobsen, R. A model for the evolution in water chemistry of an arsenic contaminated aquifer over the last 6000 years, Red River floodplain, Vietnam. Geochem. Cosmochim. Acta 2016, 195, 277–292. [Google Scholar] [CrossRef] [Green Version]
- Nickson, R.T.; McArthur, J.M.; Shrestha, B.; Kyaw-Myint, T.O.; Lowry, D. Arsenic and other drinking water quality issues, Muzaffargarh District, Pakistan. Appl. Geochem. 2005, 20, 55–68. [Google Scholar] [CrossRef]
- Ali, W.; Aslam, M.W.; Feng, C.; Junaid, M.; Ali, K.; Li, S.; Chen, Z.; Yu, Z.; Rasool, A.; Zhang, H. Unraveling prevalence and public health risks of arsenic, uranium and co-occurring trace metals in groundwater along riverine ecosystem in Sindh and Punjab, Pakistan. Environ. Geochem. Health 2019, 2019, 2223–2238. [Google Scholar] [CrossRef]
- Podgorski, J.E.; Equani, S.A.M.A.S.E.; Khanam, T.; Ullah, R.; Shen, H.; Berg, M. Extensive arsenic contamination in high-pH unconfined aquifers in the Indus Valley. Sci. Adv. 2017, 3, e1700935. [Google Scholar] [CrossRef] [PubMed] [Green Version]
- Shahid, M.; Niazi, N.K.; Dumat, C.; Naidu, R.; Khalid, S.; Rahman, M.M.; Bibi, I. A meta-analysis of the distribution, sources and health risks of arsenic-contaminated groundwater in Pakistan. Environ. Pollut. 2018, 242, 307–319. [Google Scholar] [CrossRef] [PubMed]
- Van Geen, A.; Win, K.H.; Zaw, T.; Naing, W.; Mey, J.I.; Mallioux, B. Confirmation of elevated arsenic levels in groundwater of Myanmar. Sci. Total Environ. 2014, 478, 21–24. [Google Scholar] [CrossRef] [PubMed] [Green Version]
- Bacquart, T.; Frisbie, S.; Mitchell, E.; Grigg, L.; Cole, C.; Small, C.; Sarkar, B. Multiple inorganic toxic substances contaminating the groundwater of Myingyan Township, Myanmar: Arsenic, manganese, fluoride, iron, and uranium. Sci. Total Environ. 2015, 517, 232–245. [Google Scholar] [CrossRef]
- Richards, L.A.; Pincetti Zúñiga, G.P.; Polya, D.A. Groundwater Arsenic Distribution Reconnaissance Survey in Myanmar. In As2018: The 7th International Congress & Exhibition on Arsenic in the Environment; Arsenic in a Changing World: Beijing, China, 2018. [Google Scholar]
- Pincetti Zúñiga, G.P.; Richards, L.A.; Tun, Y.M.; Aung, H.P.; Swar, A.K.; Reh, U.P.; Khaing, T.; Hlaing, M.M.; Myint, T.A.; Nwe, M.L.; et al. Major and Trace (Including Arsenic) Groundwater Chemistry in Central and Southern Myanmar. Appl. Geochem. 2020, in press. [Google Scholar] [CrossRef]
- Das, D.; Samanta, G.; Mandal, B.K.; Chowdhury, T.R.; Chanda, C.R.; Chowdhury, P.P.; Basu, G.K.; Chakraborty, D. Arsenic in groundwater in six districts of West Bengal. Environ. Geochem. Health 1996, 18, 5–15. [Google Scholar] [CrossRef]
- Mazumder, D.N.G.; Haque, R.; Ghosh, N.; De, B.K.; Santra, A.; Chakraborty, D.; Smith, A.H. Arsenic levels in drinking water and the prevalence of skin lesions in West Bengal, India. Int. J. Epidemiol. 1998, 27, 871–877. [Google Scholar] [CrossRef] [Green Version]
- Hery, M.; van Dongen, B.E.; Gill, F.; Mondal, D.; Vaughan, D.J.; Pancost, R.D.; Polya, D.A.; Lloyd, J.R. Arsenic release and attenuation in low organic carbon aquifer sediments from West Bengal. Geobiology 2010, 8, 155–168. [Google Scholar] [CrossRef]
- Chakraborty, A.K.; Saha, K.C. Arsenical dermatosis from tubewell water in West Bengal, India. Indian J. Med. Res. 1987, 85, 326–334. [Google Scholar]
- Rowland, H.A.L.; Polya, D.A.; Lloyd, J.R.; Pancost, R.D. Characterisation of organic matter in a shallow, reducing, arsenic-rich aquifer, West Bengal. Org. Geochem. 2006, 37, 1101–1114. [Google Scholar] [CrossRef]
- Charlet, L.; Chakraborty, S.; Appelo, C.A.J.; Roman-Ross, G.; Nath, B.; Ansari, A.A.; Lanson, M.; Chatterjee, D.; Mallik, S.B. Chemodynamics of an arsenic “hotspot” in a West Bengal aquifer: A field and reactive transport modeling study. Appl. Geochem. 2007, 22, 1273–1292. [Google Scholar] [CrossRef]
- Mazumder, D.N.G.; Chakraborti, A.K.; Ghose, A.; Gupta, J.D.; Chakraborty, D.P.; Dey, S.B.; Chattopadhyay, N. Chronic arsenic toxicity from drinking tubewell water in rural West Bengal. Bull. World Health Organ. 1988, 66, 499–506. [Google Scholar]
- Sengupta, S.; McArthur, J.; Sarkar, A.; Leng, M.J.; Ravenscroft, P.; Howarth, R.J.; Banerjee, D.M. Do Ponds Cause Arsenic-Pollution of Groundwater in the Bengal Basin? An Answer from West Bengal. Environ. Sci. Technol. 2008, 42, 5156–5164. [Google Scholar] [CrossRef] [PubMed]
- Lawson, M.; Ballentine, C.J.; Polya, D.A.; Boyce, A.J.; Mondal, D.; Chatterjee, D.; Majumder, S.; Biswas, A. The geochemical and isotopic composition of ground waters in West Bengal: Tracing ground-surface water interaction and its role in arsenic release. Mineral. Mag. 2008, 72, 441–444. [Google Scholar] [CrossRef]
- Chowdhury, U.K.; Biswas, B.K.; Chowdhury, T.R.; Samanta, G.; Mandal, B.K.; Basu, G.C.; Chanda, C.R.; Lodh, D.; Saha, K.C.; Mukherjee, S.K.; et al. Groundwater arsenic contamination in Bangladesh and West Bengal, India. Environ. Health Perspect. 2000, 108, 393–397. [Google Scholar] [CrossRef] [PubMed]
- Nickson, R.T.; McArthur, J.M.; Ravenscroft, P.; Burgess, W.G.; Ahmed, K.M. Mechanism of arsenic release to groundwater, Bangladesh and West Bengal. Appl. Geochem. 2000, 15, 403–413. [Google Scholar] [CrossRef]
- Gault, A.G.; Islam, F.S.; Polya, D.A.; Charnock, J.M.; Boothman, C.; Chatterjee, D.; Lloyd, J.R. Microcosm depth profiles of arsenic release in a shallow aquifer, West Bengal. Mineral. Mag. 2005, 69, 855–863. [Google Scholar] [CrossRef]
- McArthur, J.M.; Banerjee, D.M.; Sengupta, S.; Ravenscroft, P.; Klump, S.; Sarkar, A.; Disch, B.; Kipfer, R. Migration of As, and 3H/3He ages, in groundwater from West Bengal: Implications for monitoring. Water Res. 2010, 44, 4171–4185. [Google Scholar] [CrossRef]
- Pal, T.; Mukherjee, P.K.; Sengupta, S. Nature of arsenic pollutants in groundwater of Bengal basin—A case study for Baruipur area, West Bengal, India. Curr. Sci. 2002, 82, 554–561. [Google Scholar]
- Charlet, L.; Chakraborty, S.; Appello, T.; Latscha, A.A.; Chatterjee, D.; Mallick, B. Propogation of natural arsenic plume in West Bengal, India. J. Phys. IV 2003, 107, 285–288. [Google Scholar]
- Mukherjee, A.; Fryar, A.E.; Howell, P.D. Regional hydrostratigraphy and groundwater flow modeling in the arsenic-affecte areas of the western Bengal basin, West Bengal, India. Hydrogeol. J. 2007. [Google Scholar] [CrossRef]
- Mukherjee, A.; Fryar, A.E. Deeper groundwater chemistry and geochemical modeling of the arsenic affected western Bengal basin, West Bengal, India. Appl. Geochem. 2008, 23, 863–894. [Google Scholar] [CrossRef]
- Bhowmick, S.; Pramanik, S.; Singh, P.; Mondal, P.; Chatterjee, D.; Nriagu, J. Arsenic in groundwater of West Bengal, India: A review of human health risks and assessment of possible intervention options. Sci. Total Environ. 2018, 612, 148–169. [Google Scholar] [CrossRef] [PubMed]
- Bhattacharyya, R.; Chatterjee, D.; Nath, B.; Jana, J.; Jacks, G.; Vahter, M. High arsenic groundwater: Mobilization, metabolism and mitigation—An overview in the Bengal Delta Plain. Mol. Cell. Biochem. 2003, 253, 347–355. [Google Scholar] [CrossRef] [PubMed]
- McArthur, J.M.; Ghosal, U.; Sikdar, P.K.; Ball, J.D. Arsenic in Groundwater: The Deep Late Pleistocene Aquifers of the Western Bengal Basin. Environ. Sci. Technol. 2016, 50, 3469–3476. [Google Scholar] [CrossRef] [PubMed]
- McArthur, J.M.; Sikdar, P.K.; Nath, B.; Grassineau, N.; Marshall, J.D.; Banerjee, D.M. Sedimentological Control on Mn, and Other Trace Elements, In Groundwater of the Bengal Delta. Environ. Sci. Technol. 2012, 46, 669–676. [Google Scholar] [CrossRef]
- McArthur, J.M.; Sikdar, P.K.; Leng, M.J.; Ghosal, U.; Sen, I. Groundwater Quality beneath an Asian Megacity on a Delta: Kolkata’s (Calcutta’s) Disappearing Arsenic and Present Manganese. Environ. Sci. Technol. 2018, 52, 5161–5172. [Google Scholar] [CrossRef]
- Kumar, M.; Kumar, P.; Ramanathan, A.L.; Bhattacharya, P.; Thunvik, R.; Singh, U.K.; Tsujimura, M.; Sracek, O. Arsenic enrichment in groundwater in the middle Gangetic Plain of Ghazipur District in Uttar Pradesh, India. J. Geochem. Explor. 2010, 105, 83–94. [Google Scholar] [CrossRef]
- Ahamed, S.; Sengupta, M.K.; Mukherjee, A.; Hossain, M.A.; Das, B.; Nayak, B.; Pal, A.; Mukherjee, S.C.; Pati, S.; Dutta, R.N.; et al. Arsenic groundwater contamination and its health effects in the state of Uttar Pradesh (UP) in upper and middle Ganga plain, India: A severe danger. Sci. Total Environ. 2006, 370, 310–322. [Google Scholar] [CrossRef]
- Srivastava, S.; Sharma, Y.K. Arsenic occurrence and accumulation in soil and water of eastern districts of Uttar Pradesh, India. Environ. Monit. Assess. 2013, 185, 4995–5002. [Google Scholar] [CrossRef]
- Chauhan, V.S.; Nickson, R.T.; Chauhan, D.; Iyengar, L.; Sankararamakrishnan, N. Ground water geochemistry of Ballia district, Uttar Pradesh, India and mechanism of arsenic release. Chemosphere 2009, 75, 83–91. [Google Scholar] [CrossRef] [PubMed]
- Chakraborti, D.; Mukherjee, S.; Pati, S.; Sengupta, M.K.; Rahman, M.; Chowdhury, M.; Lodh, D.; Chanda, C.R.; Chakraborti, A.K.; Basu, G.K. Arsenic Groundwter Contamination in Middle Ganga Plain, Bihar, India: A Future Danger? Environ. Health Perspect. 2003, 111, 1194–1201. [Google Scholar] [CrossRef] [Green Version]
- Nickson, R.; Sengupta, C.; Mitra, P.; Dave, S.N.; Banerjee, A.K.; Bhattacharya, A.; Basu, S.; Kakoti, N.; Moorthy, N.S.; Wasuja, M.; et al. Current knowledge on the distribution of arsenic in groundwater in five states of India. J. Environ. Sci. Health Part A 2007, 42, 1707–1718. [Google Scholar] [CrossRef]
- Chakraborti, D.; Singh, S.K.; Rahman, M.M.; Dutta, R.N.; Mukherjee, S.C.; Pati, S.; Kar, P.B. Groundwater Arsenic Contamination in the Ganga River Basin: A Future Health Danger. Int. J. Environ. Res. Public Health 2018, 15, 180. [Google Scholar] [CrossRef] [PubMed] [Green Version]
- Saha, D.; Sarangam, S.S.; Dwivedi, S.N.; Bhartariya, K.G. Evaluation of hydrogeochemical processes in arsenic-contaminated alluvial aquifers in parts of Mid-Ganga Basin, Bihar, Eastern India. Environ. Earth Sci. 2010, 61, 799–811. [Google Scholar] [CrossRef]
- Ghosh, A.K.; Bose, N.; Kumar, R.; Bruining, H.; Lourma, S.; Donselaar, M.E.; Bhatt, A.G. Geological origin of arsenic groundwater contamination in Bihar, India. In Understanding the Geological and Medical Interface of Arsenic; Ng, J.C., Noller, B.N., Naidu, R., Bundschuh, J., Bhattacharya, P., Eds.; Taylor & Francis Group: London, UK, 2012. [Google Scholar]
- Saha, D.; Sahu, S.; Chandra, P.C. Arsenic-safe alternate aquifers and their hydraulic characteristics in contaminated areas of Middle Ganga Plain, Eastern India. Environ. Monit. Assess. 2011, 175, 331–348. [Google Scholar] [CrossRef]
- Saha, D. Arsenic goundwater contamination in parts of middle Ganga plain, Bihar. Curr. Sci. 2009, 97, 753–755. [Google Scholar]
- Ghosh, A.K.; Singh, S.K.; Singh, S.; Singh, A.; Roy, N.P.; Upadhyaya, A.; Bose, N.; Chaudhary, S.; Mishra, R. Study of Arsenic Contamination in Ground Water of Bihar, (India) Along the River Ganges. In Proceedings of the 3rd International Conference on Water Quality Management, Nagpur, India, 6–8 February 2008. [Google Scholar]
- Suman, S.; Sharma, P.; Siddique, A.B.; Rahman, M.A.; Kumar, R.; Rahman, M.M.; Bose, N.; Singh, S.K.; Ghosh, A.K.; Matthews, H.; et al. Wheat is an emerging exposure route for arsenic in Bihar, India. Sci. Total Environ. 2020, 703, 134774. [Google Scholar] [CrossRef]
- Chakraborti, D.; Rahman, M.M.; Bas, B.; Chatterjee, A.; Das, D.; Nayak, B.; Pal, A.; Chowdhury, U.K.; Ahmed, S.; Biswas, B.K.; et al. Groundwater arsenic contamination and its health effects in India. Hydrogeol. J. 2017, 25, 1165–1181. [Google Scholar] [CrossRef]
- Brugge, D.; Buchner, V. Health effects of uranium: New research findings. Rev. Environ. Health 2011, 26, 231–249. [Google Scholar] [CrossRef]
- Kurttio, P.; Auvinen, A.; Salonen, L.; Saha, H.; Pekkanen, J.; Mäkeläinen, I.; Väisänen, I.S.B.; Penttilä, M.; Komulainen, H. Renal effects of uranium in drinking water. Environ. Health Perspect. 2002, 10, 337–342. [Google Scholar] [CrossRef] [PubMed]
- Banning, A.; Demmel, T.; Rüde, T.R.; Wrobel, M. Groundwater Uranium Origin and Fate Control in a River Valley Aquifer. Environ. Sci. Technol. 2013, 47, 13941–13948. [Google Scholar] [CrossRef] [PubMed]
- Alam, M.S.; Cheng, T. Uranium release from sediment to groundwater: Influence of water chemistry and insights into release mechanisms. J. Contam. Hydrol. 2014, 164, 72–87. [Google Scholar] [CrossRef] [PubMed]
- Yang, Q.; Smitherman, P.; Hess, C.T.; Culbertson, C.W.; Marvinney, R.G.; Smith, A.E.; Zheng, Y. Uranium and Radon in Private Bedrock Well Water in Maine: Geospatial Analysis at Two Scales. Environ. Sci. Technol. 2014, 48, 4298–4306. [Google Scholar] [CrossRef]
- Welch, A.H.; Lico, M.S. Factors controlling As and U in shallow ground water, southern Carson Desert, Nevada. Appl. Geochem. 1998, 13, 521–539. [Google Scholar] [CrossRef]
- Seldén, A.I.; Lundholm, C.; Edlund, B.; Högdahl, C.; Ek, B.-M.; Bergström, B.E.; Ohlson, C.-G. Nephrotoxity of uranium in drinking water from private drilled wells. Environ. Res. 2009, 109, 486–494. [Google Scholar] [CrossRef]
- Stalder, E.; Blanc, A.; Haldimann, M.; Dudler, V. Occurrence of uranium in Swiss drinking water. Chemosphere 2012, 86, 672–679. [Google Scholar] [CrossRef]
- Smedley, P.L.; Smith, B.; Abesser, C.; Lapworth, D. Uranium Occurrence and Behaviour in British Groundwater (Groundwater Systems & Water Quality Programme Commissioned Report CR/06/050N); British Geological Survey: Nicker Hill, UK, 2006. [Google Scholar]
- Frisbie, S.H.; Mitchell, E.J.; Mastera, L.J.; Maynard, D.M.; Yusuf, A.Z.; Siddiq, M.Y.; Ortega, R.; Dunn, R.K.; Westerman, D.S.; Bacquart, T.; et al. Public Health Strategies for Western Bangladesh That Address Arsenic, Manganese, Uranium, and Other Toxic Elements in Drinking Water. Environ. Health Perspect. 2009, 117, 410–416. [Google Scholar] [CrossRef]
- Guo, H.; Jia, Y.; Wanty, R.B.; Jiang, Y.; Zhao, W.; Xiu, W.; Shen, J.; Li, Y.; Cao, Y.; Wu, Y.; et al. Contrasting distributions of groundwater arsenic and uranium in the western Hetao basin, Inner Mongolia: Implications for origins and fate controls. Sci. Total Environ. 2016, 541, 1172–1190. [Google Scholar] [CrossRef]
- Wu, Y.; Wang, Y.; Xie, X. Occurrence, behavior and distribution of high levels of uranium in shallow groundwater at Datong basin, northern China. Sci. Total Environ. 2014, 472, 809–817. [Google Scholar] [CrossRef]
- Moon, S.H.; Hwang, J.; Lee, J.Y.; Hyun, S.P.; Bae, B.K.; Park, Y. Establishing the Origin of Elevated Uranium Concnetrations in Groundwater near the Central Ogcheon Metamorphic Belt, Korea. J. Environ. Qual. 2013, 42, 118–128. [Google Scholar] [CrossRef] [PubMed] [Green Version]
- Nriagu, J.; Nam, D.-H.; Ayanwola, T.A.; Dinh, H.; Erdenechimeg, E.; Ochir, C.; Bolormaa, T.-A. High levels of uranium in groundwater of Ulaanbaatar, Mongolia. Sci. Total Environ. 2012, 414, 722–726. [Google Scholar] [CrossRef] [PubMed] [Green Version]
- Buschmann, J.; Berg, M.; Stengel, C.; Winkel, L.; Sampson, M.L.; Trang, P.T.K.; Viet, P.H. Contamination of drinking water resources in the Mekong delta floodplains: Arsenic and other trace metals pose serious health risks to population. Environ. Int. 2008, 34, 756–764. [Google Scholar] [CrossRef] [PubMed]
- Bhangare, R.C.; Tiwari, M.; Ajmal, P.Y.; Sahu, S.K.; Pandit, G.G. Laser fluorimetric analysis of uranium in water from Vishakhapatnam and estimation of health risk. Radiat. Prot. Environ. 2013, 36, 128–132. [Google Scholar]
- Kumar, D.; Singh, A.; Jha, R.K.; Sahoo, S.K.; Jha, V. Using spatial statistics to identify the uranium hotspot in groundwater in the mid-eastern Gangetic plain, India. Environ. Earth Sci. 2018, 77, 702. [Google Scholar] [CrossRef]
- Kumar, D.; Singh, A.; Jha, R.K. Spatial distribution of uranium and basic water quality parameter in the capital of Bihar and consequent ingestion dose. Environ. Sci. Pollut. Res. 2018, 25, 17901–17914. [Google Scholar] [CrossRef]
- Kumar, D.; Singh, A.; Kumar, P.; Jha, R.K.; Sahoo, S.K.; Jha, V. Sobol sensitivity analysis for risk assessment of uranium in groundwater. Environ. Geochem. Health 2020. [Google Scholar] [CrossRef]
- Sar, S.K.; Diwan, V.; Biswas, S.; Singh, S.; Sahu, M.; Jindal, M.K.; Arora, A. Study of uranium level in groundwater of Balod district of Chhattisgarh state, India and assessment of health risk. Hum. Ecol. Risk Assess. 2018, 24, 691–698. [Google Scholar] [CrossRef]
- Singh, B.; Garg, V.K.; Yadav, P.; Kishor, N.; Pulhani, V. Uranium in groundwater from Western Haryana, India. J. Radioanal. Nucl. Chem. 2014, 301, 427–433. [Google Scholar] [CrossRef]
- Ajay, K.; Manpreet, K.; Rohit, M.; Sumit, S.; Rosaline, M.; Singh, K.P.; Bajwa, B.S. Quantification and assessment of health risk due to ingestion of uranium in groundwater of Jammu district, Jammu & Kashmir, India. J. Radioanal. Nucl. Chem. 2016, 310, 793–804. [Google Scholar]
- Patra, A.C.; Mohapatra, S.; Sahoo, S.K.; Lenka, P.; Dubey, J.S.; Tripathi, R.M.; Puranik, V.D. Age-Dependent Dose and Health Risk due to Intake of Uranium in Drinking Water from Jaduguda, India. Radiat. Prot. Dosim. 2013, 155, 210–216. [Google Scholar] [CrossRef] [PubMed]
- Sethy, N.K.; Tripathi, R.M.; Jha, V.N.; Sahoo, S.K.; Shukla, A.K.; Puranik, V.D. Assessment of Natural Uranium in the Groundwater around Jaduguda Uranium Mining Complex, India. J. Environ. Prot. 2011, 2, 1002–1007. [Google Scholar] [CrossRef] [Green Version]
- Gupta, S.; Saravanan, B.; Agarwal, M.; Yadav, G.S.; Kumar, P. Hydrogeochemical Constraints of Uranium Solubility and Groundwater Quality in Aquifers of Central and Western Parts of Singhbhum Shear Zone, Jharkhand, India. J. Groundw. Res. 2016, 5, 16–36. [Google Scholar]
- Singh, S.; Malhotra, R.; Kumar, J.; Singh, B.; SIngh, L. Uranium analysis of geological samples, water and plants from Kulu Area, Himachal Pradesh, India. Radiat. Meas. 2001, 34, 427–431. [Google Scholar] [CrossRef]
- Nagaiah, N.; Mathews, G.; Balakrishna, K.K.M.; Rajanna, A.M.; Naregundi, K. Influence of physico-chemical parameters on the distribution of uranium in the ground water of Bangalore, India. Radiat. Prot. Environ. 2013, 36, 175–180. [Google Scholar] [CrossRef] [Green Version]
- Ben Byju, B.; Sunil, A.; Reba, M.J.; Christa, E.P.; Vaidyan, V.K.; Prasad, R.; Jojo, P.J. Uranium in drinking water from the south coast districts of Kerala, India. Int. J. Radiat. Res. 2012, 10, 31–36. [Google Scholar]
- Kumar, A.; Usha, N.; Sawant, P.D.; Tripathi, R.M.; Raj, S.S.; Mishra, M.; Rout, S.; Supreeta, P.; Singh, J.; Kumar, S.; et al. Risk Assessment for Natural Uranium in Subsurface Water of Punjab State, India. Hum. Ecol. Risk Assess. 2011, 17, 381–393. [Google Scholar] [CrossRef]
- Rani, A.; Mehra, R.; Duggal, V.; Balaram, V. Analysis of Uranium Concentration in Drinking Water Samples Using ICPMS. Health Phys. 2013, 104, 251–255. [Google Scholar] [CrossRef]
- Kumar, M.P.; Prerna, S.; Akash, K.; Prasad, M.K. Uranium in Ground water of Eastern Uttar Pradesh, India: A prelimary study. Int. Res. J. Env. Sci. 2015, 4, 70–74. [Google Scholar]
- Yadav, S.K.; Ramanathan, A.L.; Kumar, M.; Chidambaram, S.; Sautam, Y.P.; Tiwari, C. Assessment of arsenic and uranium co-occurrences in groundwater of central Gangetic Plain, Uttar Pradesh, India. Environ. Earth Sci. 2020, 79, 154. [Google Scholar] [CrossRef]
- Islam, F.S.; Gault, A.G.; Boothman, C.; Polya, D.A.; Charnock, J.M.; Chatterjee, D.; Lloyd, J.R. Role of metal-reducing bacteria in arsenic release from Bengal delta sediments. Nature 2004, 430, 68–71. [Google Scholar] [CrossRef]
- Bhattacharya, P.; Chatterjee, D.; Jacks, G. Occurence of arsenic contaminated groundwater in alluvial aquifers from delta plains, Eastern India: Options for safe drinking water supply. Water Resour. Dev. 1997, 13, 79–92. [Google Scholar] [CrossRef]
- Van Geen, A.; Rose, J.; Thoral, S.; Garnier, J.M.; Zheng, Y.; Bottero, J.Y. Decoupling of As and Fe release to Bangladesh groundwater under reducing conditions. Part II: Evidence from sediment incubations. Geochim. Cosmochim. Acta 2004, 68, 3475–3486. [Google Scholar] [CrossRef]
- Rowland, H.A.L.; Boothman, C.; Pancost, R.D.; Gault, A.G.; Polya, D.A.; Lloyd, J.R. The role of indigenous mircoorganisms in the biodegradation of naturally occurring petroleum, the reduction of iron, and the mobilization of arsenite from West Bengal aquifer sediments. J. Environ. Qual. 2009, 38, 1598–1607. [Google Scholar] [CrossRef] [PubMed]
- McArthur, J.M.; Banerjee, D.M.; Hudson-Edwards, K.A.; Mishra, R.; Purohit, R.; Ravenscroft, P.; Cronin, A.; Howarth, R.J.; Chatterjee, A.; Talukder, T.; et al. Natural organic matter in sedimentary basins and its relation to arsenic in anoxic ground water: The example of West Bengal and its worldwide implications. Appl. Geochem. 2004, 19, 1255–1293. [Google Scholar] [CrossRef]
- Rowland, H.A.L.; Pederick, R.L.; Polya, D.A.; Pancost, R.D.; van Dongen, B.E.; Gault, A.G.; Vaughan, D.J.; Bryant, C.; Anderson, B.; Lloyd, J.R. The control of organic matter on microbially mediated iron reduction and arsenic release in shallow alluvial aquifers, Cambodia. Geobiology 2007, 5, 281–292. [Google Scholar] [CrossRef]
- Neumann, R.B.; Polizzotto, M.L.; Badruzzaman, A.B.M.; Ali, M.A.; Zhang, Z.Y.; Harvey, C.F. Hydrology of a groundwater-irrigated rice field in Bangladesh: Seasonal and daily mechanisms of infiltration. Water Resour. Res. 2009, 45, 14. [Google Scholar] [CrossRef]
- Fendorf, S.; Michael, H.A.; Van Geen, A. Spatial and temporal variations of groundwater arsenic in south and southeast Asia. Science 2010, 328, 1123–1127. [Google Scholar] [CrossRef] [Green Version]
- Mladenov, N.; Zheng, Y.; Miller, M.P.; Nemergut, D.R.; Legg, T.; Simone, B.; Hageman, C.; Rahman, M.M.; Ahmed, K.M.; McKnight, D.M. Dissolved Organic Matter Sources and Consequences for Iron and Arsenic Mobilization in Bangladesh Aquifers. Environ. Sci. Technol. 2010, 44, 123–128. [Google Scholar] [CrossRef]
- Al Lawati, W.M.; Rizoulis, A.; Eiche, E.; Boothman, C.; Polya, D.A.; Lloyd, J.R.; Berg, M.; Vasquez-Aguilar, P.; van Dongen, B.E. Characterisation of organic matter and microbial communities in contrasting arsenic-rich Holocene and arsenic-poor Pleistocene aquifers, Red River Delta, Vietnam. Appl. Geochem. 2012, 27, 315–325. [Google Scholar] [CrossRef] [Green Version]
- Al Lawati, W.M.; Jean, J.-S.; Kulp, T.R.; Lee, M.-K.; Polya, D.A.; Liu, C.-C.; van Dongen, B.E. Characterisation of organic matter associated with groundwater arsenic in reducing aquifers of southwestern Taiwan. J. Hazard. Mater. 2013, 262, 970–979. [Google Scholar] [CrossRef] [PubMed]
- Neumann, R.B.; Pracht, L.E.; Polizzotto, M.L.; Badruzzaman, A.B.M.; Ashraf Ali, M. Biodegradable Organic Carbon in Sediments of an Arsenic-Contaminated Aquifer in Bangladesh. Environ. Sci. Technol. Lett. 2014, 1, 221–225. [Google Scholar] [CrossRef]
- McArthur, J.M.; Ravenscroft, P.; Sracek, O. Aquifer arsenic source. Nat. Geosci. 2011, 4, 655–656. [Google Scholar] [CrossRef]
- Neumann, R.B.; Ashfaque, K.N.; Badruzzaman, A.B.M.; Ali, M.A.; Shoemaker, J.K.; Harvey, C.F. Aquifer arsenic source reply. Nat. Geosci. 2011, 4, 656. [Google Scholar] [CrossRef]
- Datta, S.; Neal, A.W.; Mohajerin, T.J.; Ocheltree, T.; Rosenheim, B.E.; White, C.D.; Johannesson, K.H. Perennial ponds are not an important source of water or dissolved organic matter to groundwaters with high arsenic concentrations in West Bengal, India. Geophys. Res. Lett. 2011, 38, L20404. [Google Scholar] [CrossRef]
- Schaefer, M.V.; Ying, S.C.; Benner, S.G.; Duan, Y.; Wang, Y.; Fendorf, S. Aquifer Arsenic Cycling Induced by Seasonal Hydrologic Changes within the Yangtze River Basin. Environ. Sci. Technol. 2016, 50, 3521–3529. [Google Scholar] [CrossRef]
- Stuckey, J.W.; Schaefer, M.V.; Kocar, B.D.; Benner, S.G.; Fendorf, S. Arsenic release metabolically limited to permanently water-saturated soil in Mekong Delta. Nat. Geosci. 2016, 9, 70–76. [Google Scholar] [CrossRef]
- Goldberg, S.; Criscenti, L.J.; Turner, D.R.; Davis, J.A.; Cantrell, K.J. Adsorption-Desorption Processes in Subsurface Reactive Transport Modelling. Vadose Zone J. 2007, 6, 407–435. [Google Scholar] [CrossRef] [Green Version]
- Richards, L.A.; Casanueva-Marenco, M.J.; Magnone, D.; Sovann, C.; van Dongen, B.E.; Polya, D.A. Contrasting Sorption Behaviours Affected Groundwater Arsenic Concentration in Kandal Province, Cambodia. Geosci. Front. 2019, 10, 1701–1713. [Google Scholar] [CrossRef]
- Lalonde, K.; Mucci, A.; Ouellet, A.; Gélinas, Y. Preservation of organic matter in sediments promoted by iron. Nature 2012, 483, 198–200. [Google Scholar] [CrossRef] [Green Version]
- Johnson, K.; Purvis, G.; Lopez-Capel, E.; Peacock, C.; Gray, N.; Wagner, T.; März, C.; Bowen, L.; Ojeda, J.; Finlay, N.; et al. Towards a mechanistic understanding of carbon stabilization in manganese oxides. Nat. Commun. 2015, 6, 7628. [Google Scholar] [CrossRef] [PubMed] [Green Version]
- Spycher, N.F.; Issarangun, M.; Stewart, B.D.; Şengör, S.; Belding, E.; Ginn, T.R.; Peyton, B.M.; Sani, R.K. Biogenic uraninite precipitation and its reoxidation by iron(III) (hydr)oxides: A reaction modelling approach. Geochem. Cosmochim. Acta 2011, 75, 4426–4440. [Google Scholar] [CrossRef]
- Langmuir, D. Uranium solution-mineral equilibria at low temperatures with applications to sedimentary ore deposits. Geochem. Cosmochim. Acta 1978, 42, 547–569. [Google Scholar] [CrossRef]
- Katsoyiannis, I.; Hug, S.J.; Ammann, A.; Zikoudi, A.; Hatziliontos, C. Arsenic speciation and uranium concentrations in drinking water supply wells in Northern Greece: Correlations with redox indicative parameters and implications for groundwater treatment. Sci. Total Environ. 2007, 383, 128–140. [Google Scholar] [CrossRef]
- Dong, W.; Brooks, S.C. Determination of the Formation Constants of Ternary Complexes of Uranyl and Carbonate with Alkaline Earth Metals (Mg2+, Ca2+, Sr2+, and Ba2+) Using Anion Exchange Method. Environ. Sci. Technol. 2006, 40, 4689–4695. [Google Scholar] [CrossRef]
- Artinger, R.; Rabung, T.; Kim, J.I.; Sachs, S.; Schmeide, K.; Heise, K.H.; Bernhard, G.; Nitsche, H. Humic colloid-borne migration of uranium in sand columns. J. Contam. Hydrol. 2002, 58, 1–12. [Google Scholar] [CrossRef]
- Regenspurg, S.; Margot-Roquier, C.; Harfouche, M.; Froidevaux, P.; Steinmann, P.; Junier, P.; Bernier-Latmani, R. Speciation of naturally-accumulated uranium in an organic-rich soil of an alpine region (Switzerland). Geochem. Cosmochim. Acta 2010, 74, 2082–2098. [Google Scholar] [CrossRef] [Green Version]
- Richards, L.A.; Kumar, A.; Shankar, P.; Gaurav, A.; Ghosh, A.; Polya, D.A. Distribution of Arsenic and Uranium in Groundwater Utilized as Drinking Water in Bihar, India. In In Proceedings of the Abstract of the As2020 8th International Congress & Exhibition of Arsenic in the Environment, Wageningen, The Netherlands. Originally scheduled for 15–18 June 2020; postponed Due to COVID-19.
- Natural Earth. Natural Earth Data. Available online: https://www.naturalearthdata.com/ (accessed on 1 April 2020).
- United States Department of Interior. Geologic map of South Asia (geo8ag). Available online: https://catalog.data.gov/dataset/geologic-map-of-south-asia-geo8ag-48972 (accessed on 1 April 2020).
- Polya, D.A.; Watts, M.J. Chapter 5: Sampling and analysis for monitoring arsenic in drinking water. In Best Practice Guide on the Control of Arsenic in Drinking Water; Bhattacharya, P., Polya, D.A., Jovanovic, D., Eds.; IWA Publishing: London, UK, 2017; ISBN 9781843393856. [Google Scholar]
- Polya, D.A.; Richards, L.A.; Al Bualy, A.N.; Sovann, C.; Magnone, D.; Lythgoe, P.R. Chapter A14: Groundwater sampling, arsenic analysis and risk communication: Cambodia Case Study. In Best Practice Guide for the Control of Arsenic in Drinking Water; Bhattacharya, P., Polya, D.A., Jovanovic, D., Eds.; IWA Publishing: London, UK, 2017; ISBN 9781843393856. [Google Scholar]
- Frisbie, S.H.; Mitchell, E.J.; Dustin, H.; Maynard, D.M.; Sarkar, B. World Health Organization discontinues its drinking-water guideline for manganese. Environ. Health Perspect. 2012, 120, 775–778. [Google Scholar] [CrossRef] [Green Version]
- Wasserman, G.A.; Lui, X.; Parvez, F.; Ahsan, H.; Levy, D.; Factor-Litvak, P.; Kline, J.; van Geen, A.; Slavkovich, V.; Lolacono, N.J.; et al. Water Manganese Exposure and Children’s Intellectual Function in Araihazar, Bangladesh. Environ. Health Perspect. 2005, 114, 124–129. [Google Scholar] [CrossRef] [Green Version]
- Singh, A.K.; Sengupta, D.; Prasad, R. Radon exhalation rate and uranium estimation in rock samples from Bihar uranium and copper mines using the SSNTD technique. Appl. Radiat. Isot. 1999, 51, 107–113. [Google Scholar] [CrossRef]
- Xie, X.; Wang, Y.; Su, C. Hydrochemical and Sediment Biomarker Evidence of the Impact of Organic Matter Biodegradation on Arsenic Mobilization in Shallow Aquifers of Datong Basin, China. Water Air Soil Pollut. 2012, 223, 483–498. [Google Scholar] [CrossRef]


| Analyte | MDL | Min | Q1 | Median | Q3 | Max |
|---|---|---|---|---|---|---|
| pH (--) | n/a | 5.7 | 7.0 | 7.2 | 7.5 | 8.3 |
| Eh (mV) | n/a | 30 | 110 | 200 | 240 | 420 |
| Elec. Cond. (mS.cm−1) | n/a | 0.03 | 0.5 | 0.7 | 0.9 | 3.1 |
| Temp. (°C) | n/a | 22.4 | 26.0 | 27.3 | 28.5 | 36.0 |
| Na (mM) | 0.0004 | 0.1 | 0.9 | 1.4 | 2.2 | 11 |
| Ca (mM) | 0.0002 | 0.2 | 1.1 | 1.6 | 2.5 | 5.9 |
| Mg (mM) | 0.0004 | 0.09 | 0.5 | 0.8 | 1.2 | 6.2 |
| Si (mM) | 0.0004 | 0.2 | 0.5 | 0.5 | 0.6 | 1.2 |
| K (mM) | 0.0003 | 0.01 | 0.05 | 0.07 | 0.11 | 2.5 |
| HCO3− (mM) | n/a | 0.6 | 4.1 | 5.6 | 7.3 | 22 |
| Cl− (mM) | 0.006 | <0.006 | 0.1 | 0.4 | 1.2 | 12.6 |
| SO42− (mM) | 0.002 | <0.002 | 0.02 | 0.13 | 0.4 | 2.4 |
| NO3− (mM) | 0.003 | <0.003 | <0.003 | 0.006 | 0.1 | 3.4 |
| F− (mM) | 0.003 | <0.003 | <0.003 | 0.006 | 0.02 | 0.07 |
| P (mM) | 0.0003 | <0.0003 | 0.0004 | 0.002 | 0.003 | 0.06 |
| Fe (mM) | 0.0002 | <0.0002 | 0.0002 | 0.001 | 0.01 | 0.2 |
| Mn (mM) | 0.0002 | <0.0002 | 0.0003 | 0.002 | 0.004 | 0.07 |
| Zn (µM) | 0.02 | 0.02 | 0.11 | 0.24 | 1.1 | 82 |
| As (µM) | 0.01 | <0.01 | <0.01 | <0.01 | 0.06 | 11.6 |
| U (µM) | 0.004 | <0.004 | <0.004 | 0.009 | 0.03 | 0.4 |
| Cu (µM) | 0.02 | <0.02 | <0.02 | <0.02 | <0.02 | 1.2 |
| Pb (µM) | 0.005 | <0.005 | <0.005 | <0.005 | <0.005 | 0.03 |
| District | n | As | U | ||||||||
|---|---|---|---|---|---|---|---|---|---|---|---|
| Cmin (µM) | Cmedian (µM) | Cmean (µM) | Cmax (µM) | Ex (%) | Cmin (µM) | Cmedian (µM) | Cmean (µM) | Cmax (µM) | Ex (%) | ||
| Overall | 273 | <0.01 | <0.01 | 0.17 | 11.6 | 16 | <0.004 | 0.01 | 0.03 | 0.35 | 7 |
| Araria | 2 | <0.01 | <0.01 | <0.01 | <0.01 | 0 | <0.004 | <0.004 | <0.004 | <0.004 | 0 |
| Arwal | 2 | <0.01 | <0.01 | <0.01 | <0.01 | 0 | <0.004 | <0.004 | <0.004 | 0.01 | 0 |
| Aurangabad | 8 | <0.01 | <0.01 | <0.01 | <0.01 | 0 | <0.004 | 0.01 | 0.02 | 0.08 | 0 |
| Banka | 6 | <0.01 | <0.01 | <0.01 | 0.03 | 0 | <0.004 | 0.01 | 0.01 | 0.02 | 0 |
| Begusarai | 4 | 0.12 | 0.16 | 0.16 | 0.21 | 75 | <0.004 | <0.004 | <0.004 | <0.004 | 0 |
| Bhagalpur | 6 | <0.01 | <0.01 | <0.01 | 0.04 | 0 | 0.01 | 0.07 | 0.07 | 0.15 | 17 |
| Bhojpur | 3 | <0.01 | <0.01 | <0.01 | <0.01 | 0 | 0.01 | 0.01 | 0.01 | 0.01 | 0 |
| Buxar | 15 | <0.01 | 0.41 | 0.51 | 1.79 | 80 | <0.004 | <0.004 | 0.004 | 0.04 | 0 |
| Darbhanga | 3 | 0.06 | 0.07 | 0.06 | 0.07 | 0 | <0.004 | <0.004 | <0.004 | <0.004 | 0 |
| East Champaran | 12 | <0.01 | 0.04 | 0.05 | 0.27 | 8 | <0.004 | 0.01 | 0.01 | 0.08 | 0 |
| Gaya | 4 | <0.01 | <0.01 | <0.01 | <0.01 | 0 | 0.02 | 0.03 | 0.03 | 0.04 | 0 |
| Gopalganj | 7 | <0.01 | 0.02 | 0.02 | 0.07 | 0 | <0.004 | 0.02 | 0.04 | 0.19 | 14 |
| Jamui | 6 | <0.01 | <0.01 | <0.01 | <0.01 | 0 | <0.004 | <0.004 | 0.01 | 0.04 | 0 |
| Jehanabad | 2 | <0.01 | <0.01 | <0.01 | <0.01 | 0 | 0.01 | 0.05 | 0.05 | 0.09 | 0 |
| Kaimur | 2 | <0.01 | <0.01 | <0.01 | <0.01 | 0 | 0.01 | 0.02 | 0.02 | 0.03 | 0 |
| Katihar | 5 | <0.01 | <0.01 | 0.55 | 2.72 | 20 | <0.004 | <0.004 | 0.04 | 0.22 | 20 |
| Khagaria | 2 | 0.09 | 0.12 | 0.12 | 0.14 | 50 | <0.004 | <0.004 | <0.004 | <0.004 | 0 |
| Kishanganj | 3 | <0.01 | <0.01 | <0.01 | <0.01 | 0 | <0.004 | <0.004 | <0.004 | <0.004 | 0 |
| Lakhisarai | 2 | <0.01 | <0.01 | <0.01 | <0.01 | 0 | 0.03 | 0.03 | 0.03 | 0.03 | 0 |
| Madhepura | 1 | -- | <0.01 | <0.01 | -- | 0 | -- | 0.004 | 0.004 | -- | 0 |
| Madhubani | 6 | 0.06 | 0.11 | 0.15 | 0.39 | 50 | <0.004 | <0.004 | <0.004 | <0.004 | 0 |
| Munger | 4 | <0.01 | <0.01 | <0.01 | <0.01 | 0 | 0.03 | 0.03 | 0.06 | 0.14 | 25 |
| Muzaffarpur | 15 | <0.01 | <0.01 | 0.02 | 0.10 | 0 | <0.004 | 0.04 | 0.05 | 0.28 | 13 |
| Nalanda | 5 | <0.01 | <0.01 | <0.01 | <0.01 | 0 | 0.04 | 0.06 | 0.14 | 0.32 | 40 |
| Nawada | 5 | <0.01 | <0.01 | <0.01 | <0.01 | 0 | 0.01 | 0.15 | 0.13 | 0.21 | 80 |
| Patna | 62 | <0.01 | <0.01 | 0.05 | 1.22 | 5 | <0.004 | 0.01 | 0.02 | 0.15 | 2 |
| Purnia | 4 | <0.01 | 0.01 | 0.03 | 0.08 | 0 | <0.004 | 0.004 | 0.01 | 0.03 | 0 |
| Rohtas | 7 | <0.01 | <0.01 | <0.01 | <0.01 | 0 | <0.004 | 0.02 | 0.01 | 0.03 | 0 |
| Saharsa | 2 | <0.01 | 0.01 | 0.01 | 0.03 | 0 | <0.004 | <0.004 | <0.004 | 0.005 | 0 |
| Samastipur 1 | 6 | <0.01 | 0.05 | 0.07 | 0.18 | 33 | <0.004 | 0.01 | 0.02 | 0.06 | 0 |
| Samastipur 2 | 10 | <0.01 | 0.16 | 2.23 | 11.6 | 60 | -- | -- | -- | -- | -- |
| Saran | 14 | <0.01 | 0.05 | 0.23 | 2.50 | 21 | <0.004 | <0.004 | 0.02 | 0.18 | 7 |
| Sheikpura | 1 | -- | <0.01 | <0.01 | -- | 0 | -- | 0.04 | 0.04 | -- | 0 |
| Sheohar | 2 | 0.04 | 0.07 | 0.07 | 0.10 | 0 | <0.004 | <0.004 | <0.004 | 0.004 | 0 |
| Sitamarhi | 8 | 0.03 | 0.15 | 0.22 | 0.82 | 50 | <0.004 | <0.004 | <0.004 | 0.01 | 0 |
| Siwan | 7 | <0.01 | <0.01 | 0.03 | 0.13 | 14 | 0.01 | 0.02 | 0.05 | 0.16 | 14 |
| Supaul | 6 | <0.01 | 0.01 | 0.10 | 0.44 | 33 | <0.004 | 0.02 | 0.07 | 0.35 | 17 |
| Vaishali | 10 | <0.01 | <0.01 | 0.08 | 0.82 | 10 | <0.004 | 0.09 | 0.10 | 0.23 | 40 |
| West Champaran | 10 | <0.01 | 0.04 | 0.10 | 0.40 | 30 | <0.004 | 0.01 | 0.01 | 0.02 | 0 |
© 2020 by the authors. Licensee MDPI, Basel, Switzerland. This article is an open access article distributed under the terms and conditions of the Creative Commons Attribution (CC BY) license (http://creativecommons.org/licenses/by/4.0/).
Share and Cite
Richards, L.A.; Kumar, A.; Shankar, P.; Gaurav, A.; Ghosh, A.; Polya, D.A. Distribution and Geochemical Controls of Arsenic and Uranium in Groundwater-Derived Drinking Water in Bihar, India. Int. J. Environ. Res. Public Health 2020, 17, 2500. https://0-doi-org.brum.beds.ac.uk/10.3390/ijerph17072500
Richards LA, Kumar A, Shankar P, Gaurav A, Ghosh A, Polya DA. Distribution and Geochemical Controls of Arsenic and Uranium in Groundwater-Derived Drinking Water in Bihar, India. International Journal of Environmental Research and Public Health. 2020; 17(7):2500. https://0-doi-org.brum.beds.ac.uk/10.3390/ijerph17072500
Chicago/Turabian StyleRichards, Laura A., Arun Kumar, Prabhat Shankar, Aman Gaurav, Ashok Ghosh, and David A. Polya. 2020. "Distribution and Geochemical Controls of Arsenic and Uranium in Groundwater-Derived Drinking Water in Bihar, India" International Journal of Environmental Research and Public Health 17, no. 7: 2500. https://0-doi-org.brum.beds.ac.uk/10.3390/ijerph17072500