Covid-19 Outbreak Progression in Italian Regions: Approaching the Peak by the End of March in Northern Italy and First Week of April in Southern Italy


Abstract
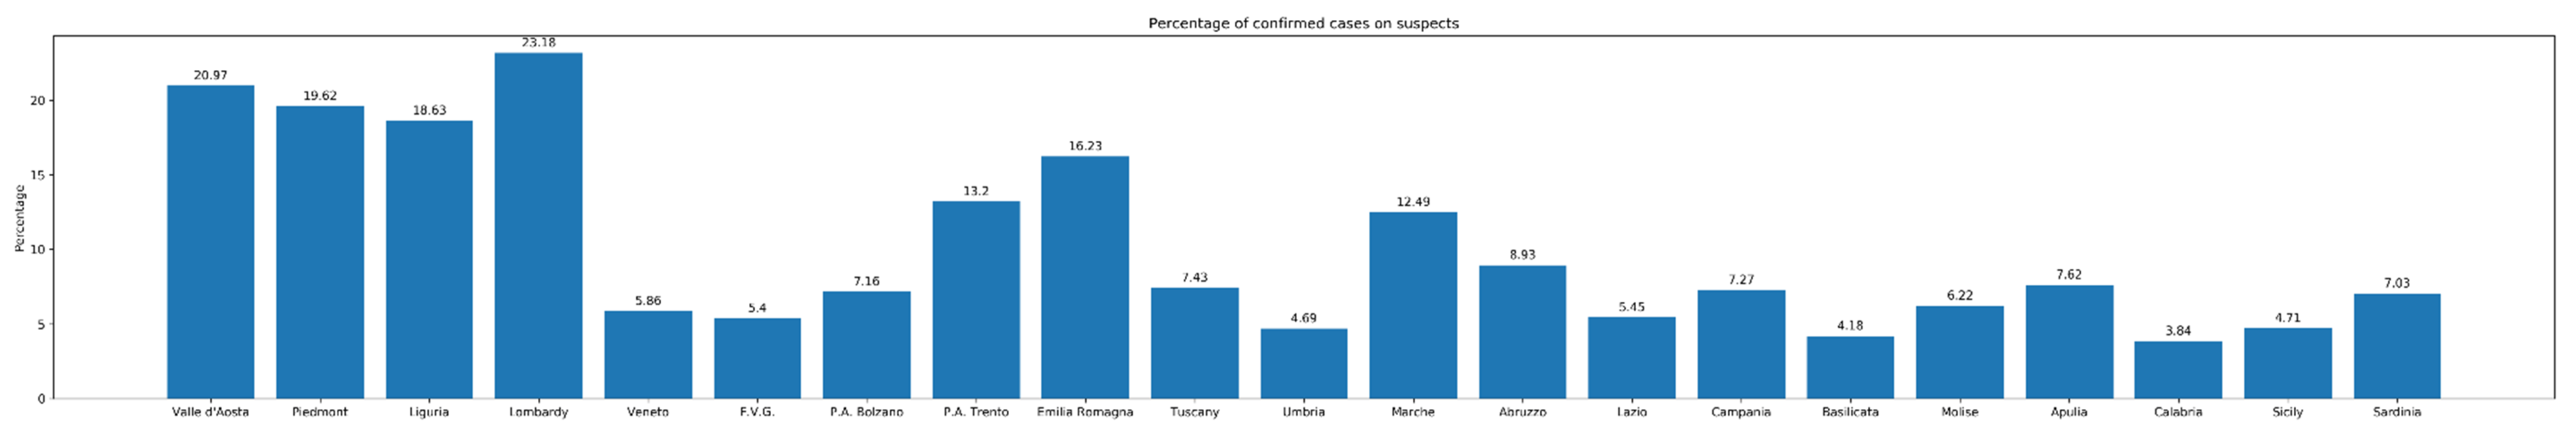
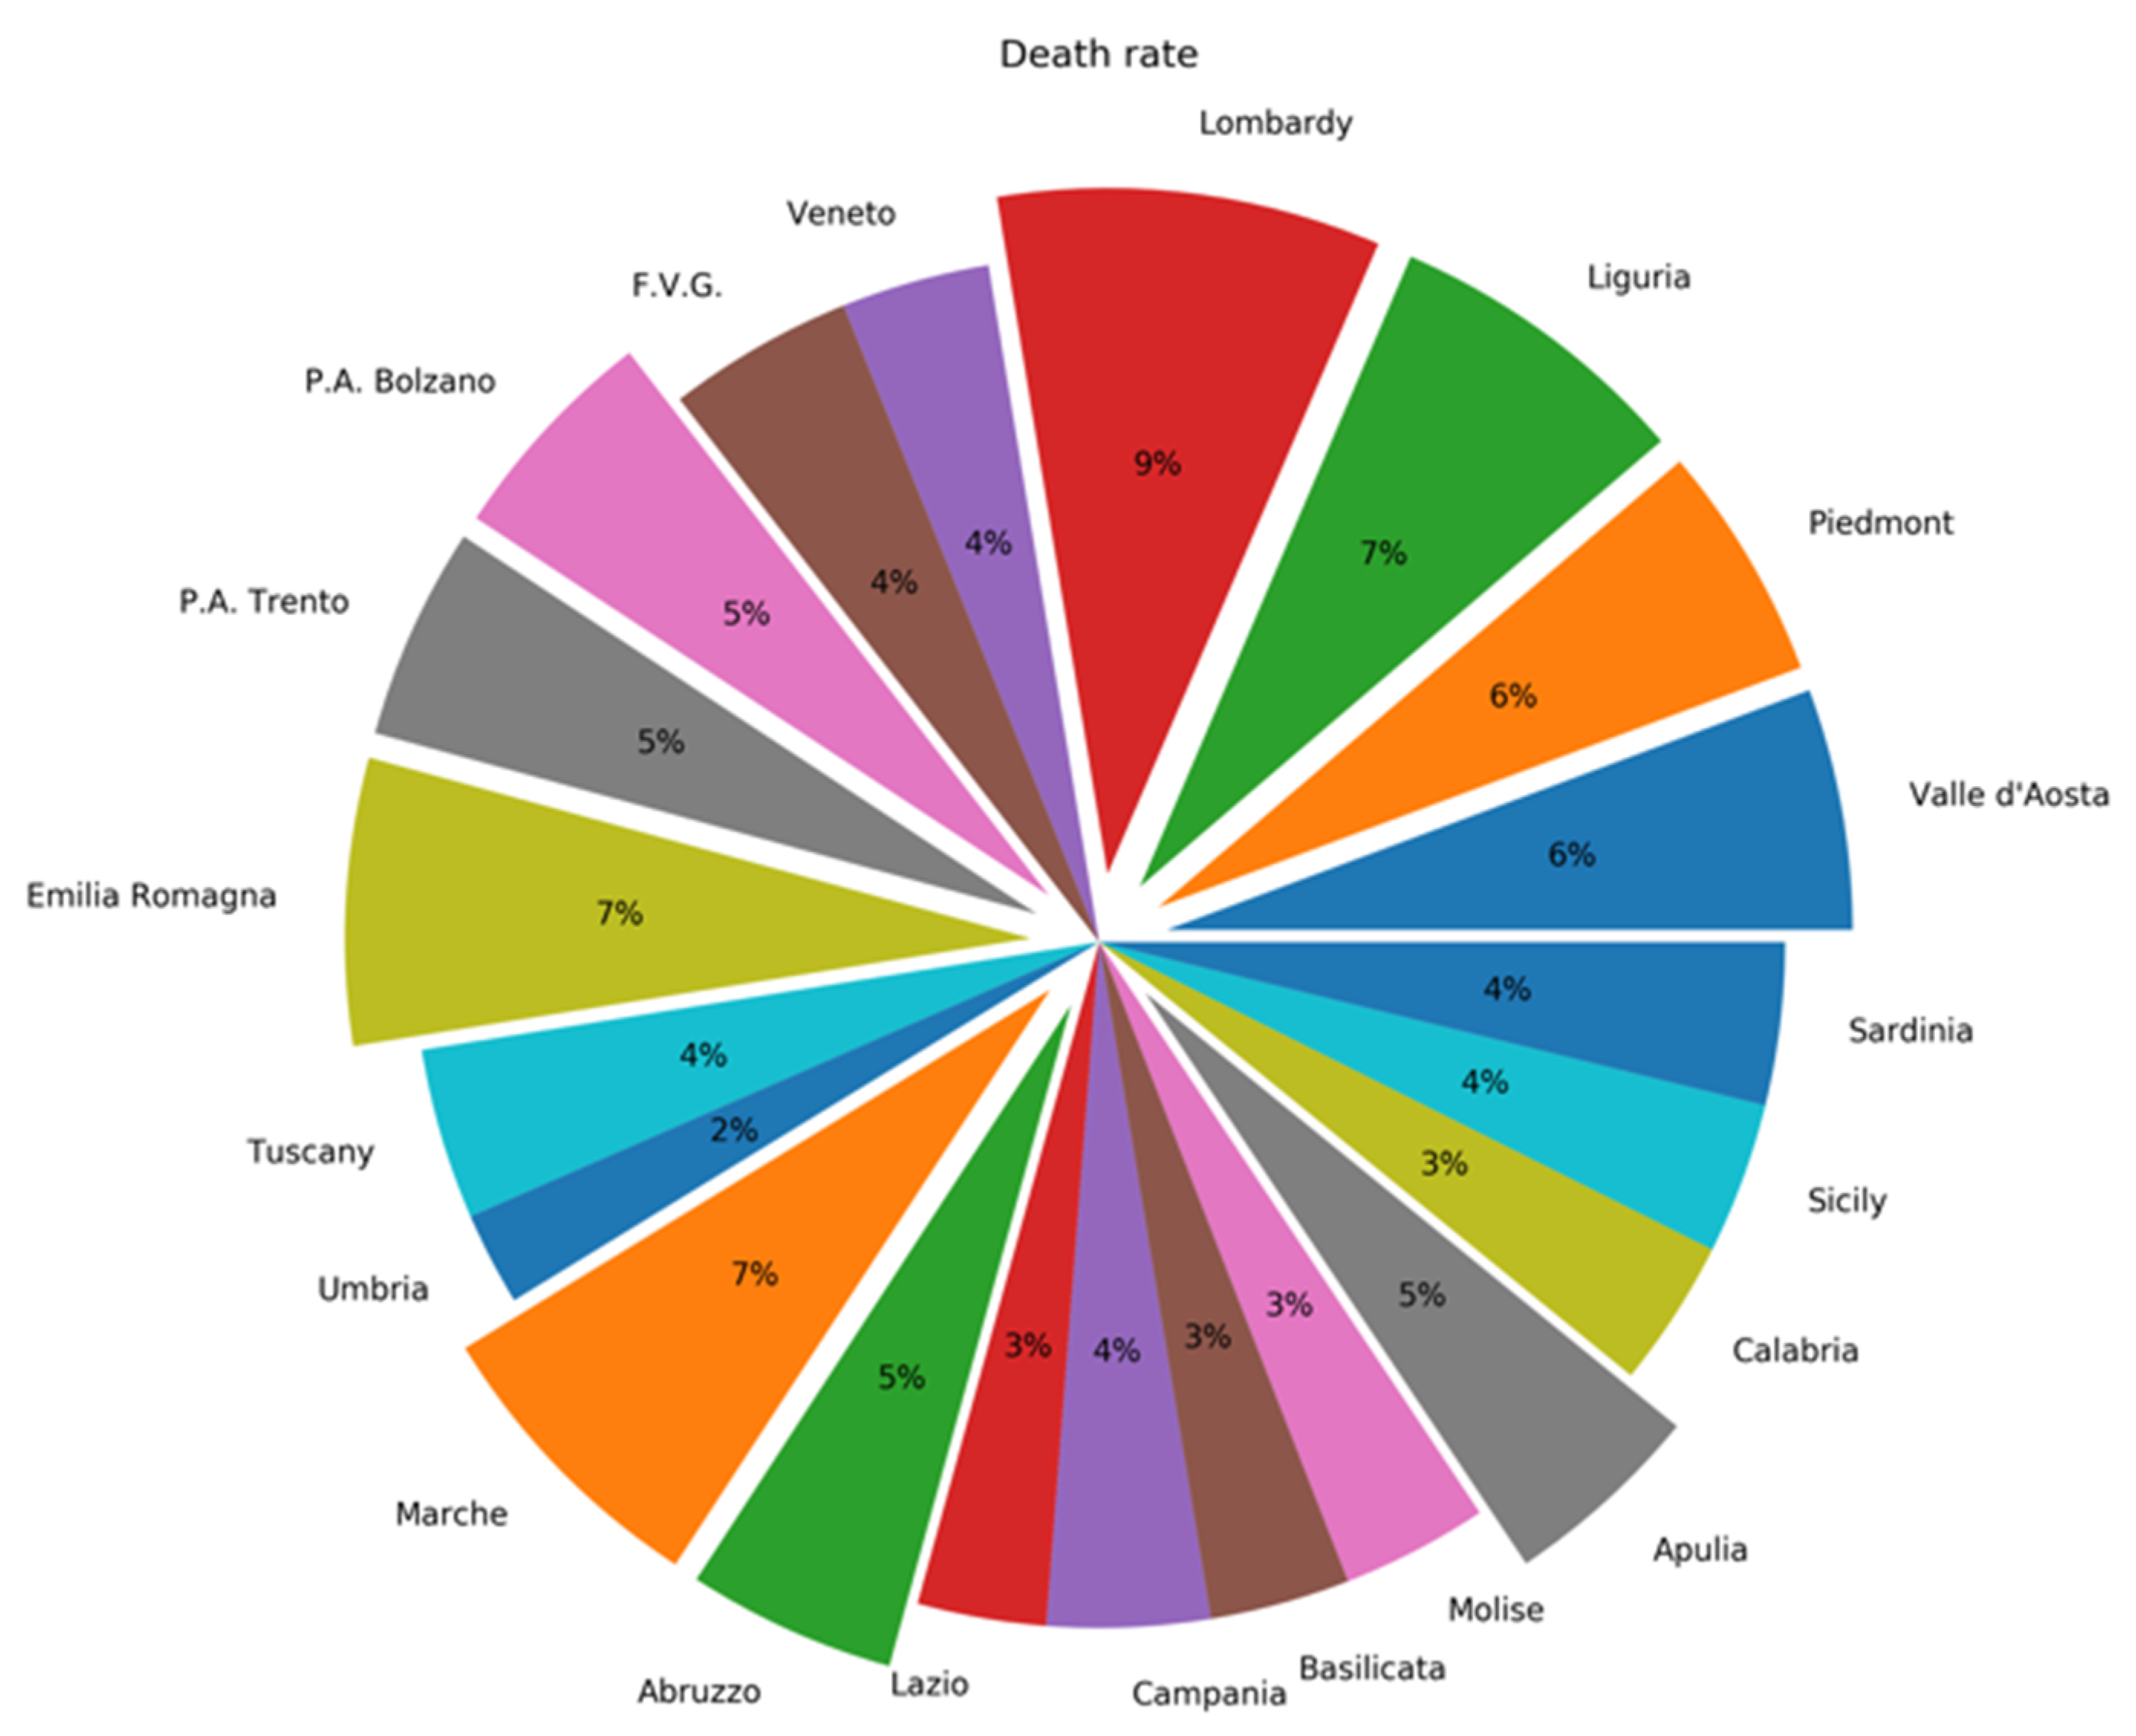
:1. Epidemiological Figures
2. Modeling the Covid-19 Outbreak Progression in Southern Italian Regions vs. Lombardy
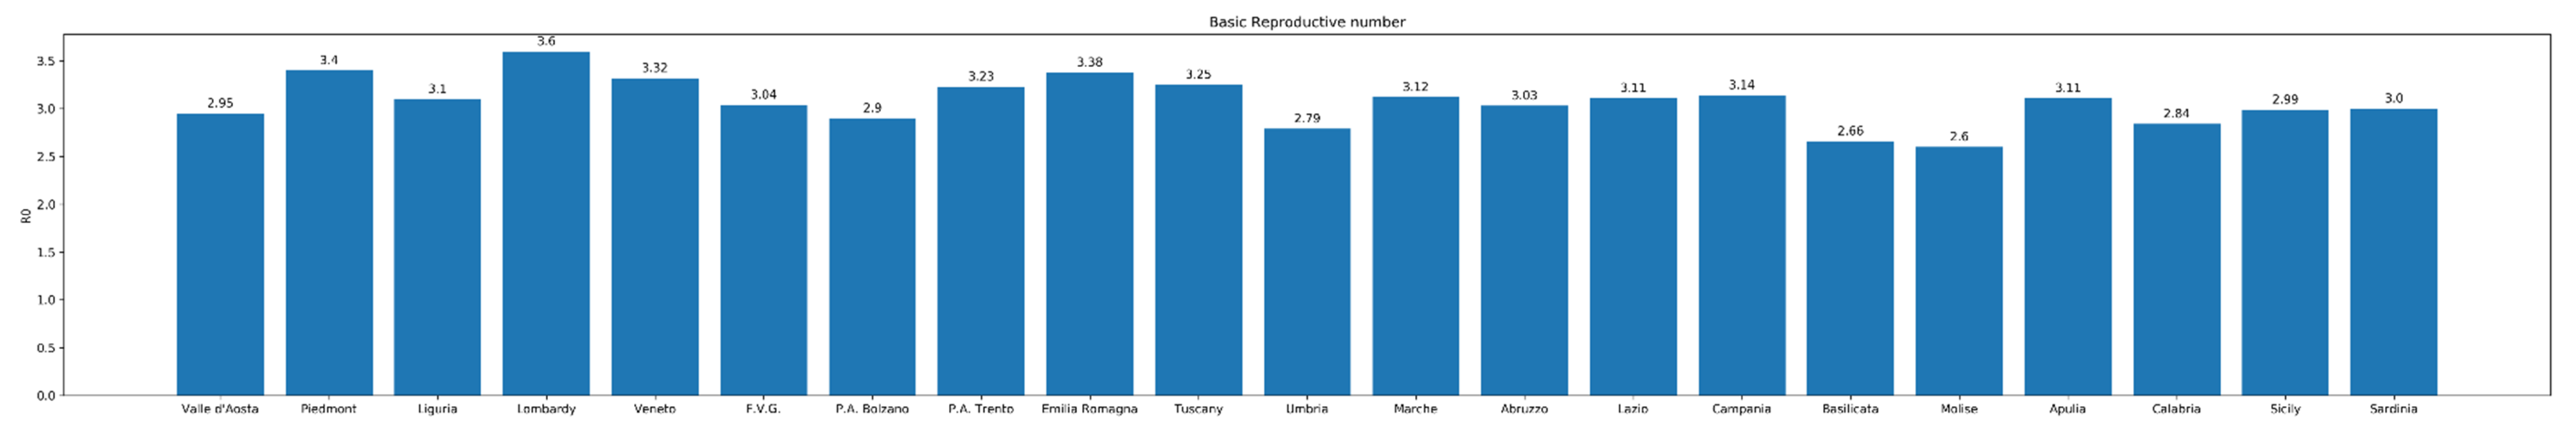
2.1. Modeling the Basic Reproductive Number R0 Exponential Framework Estimation
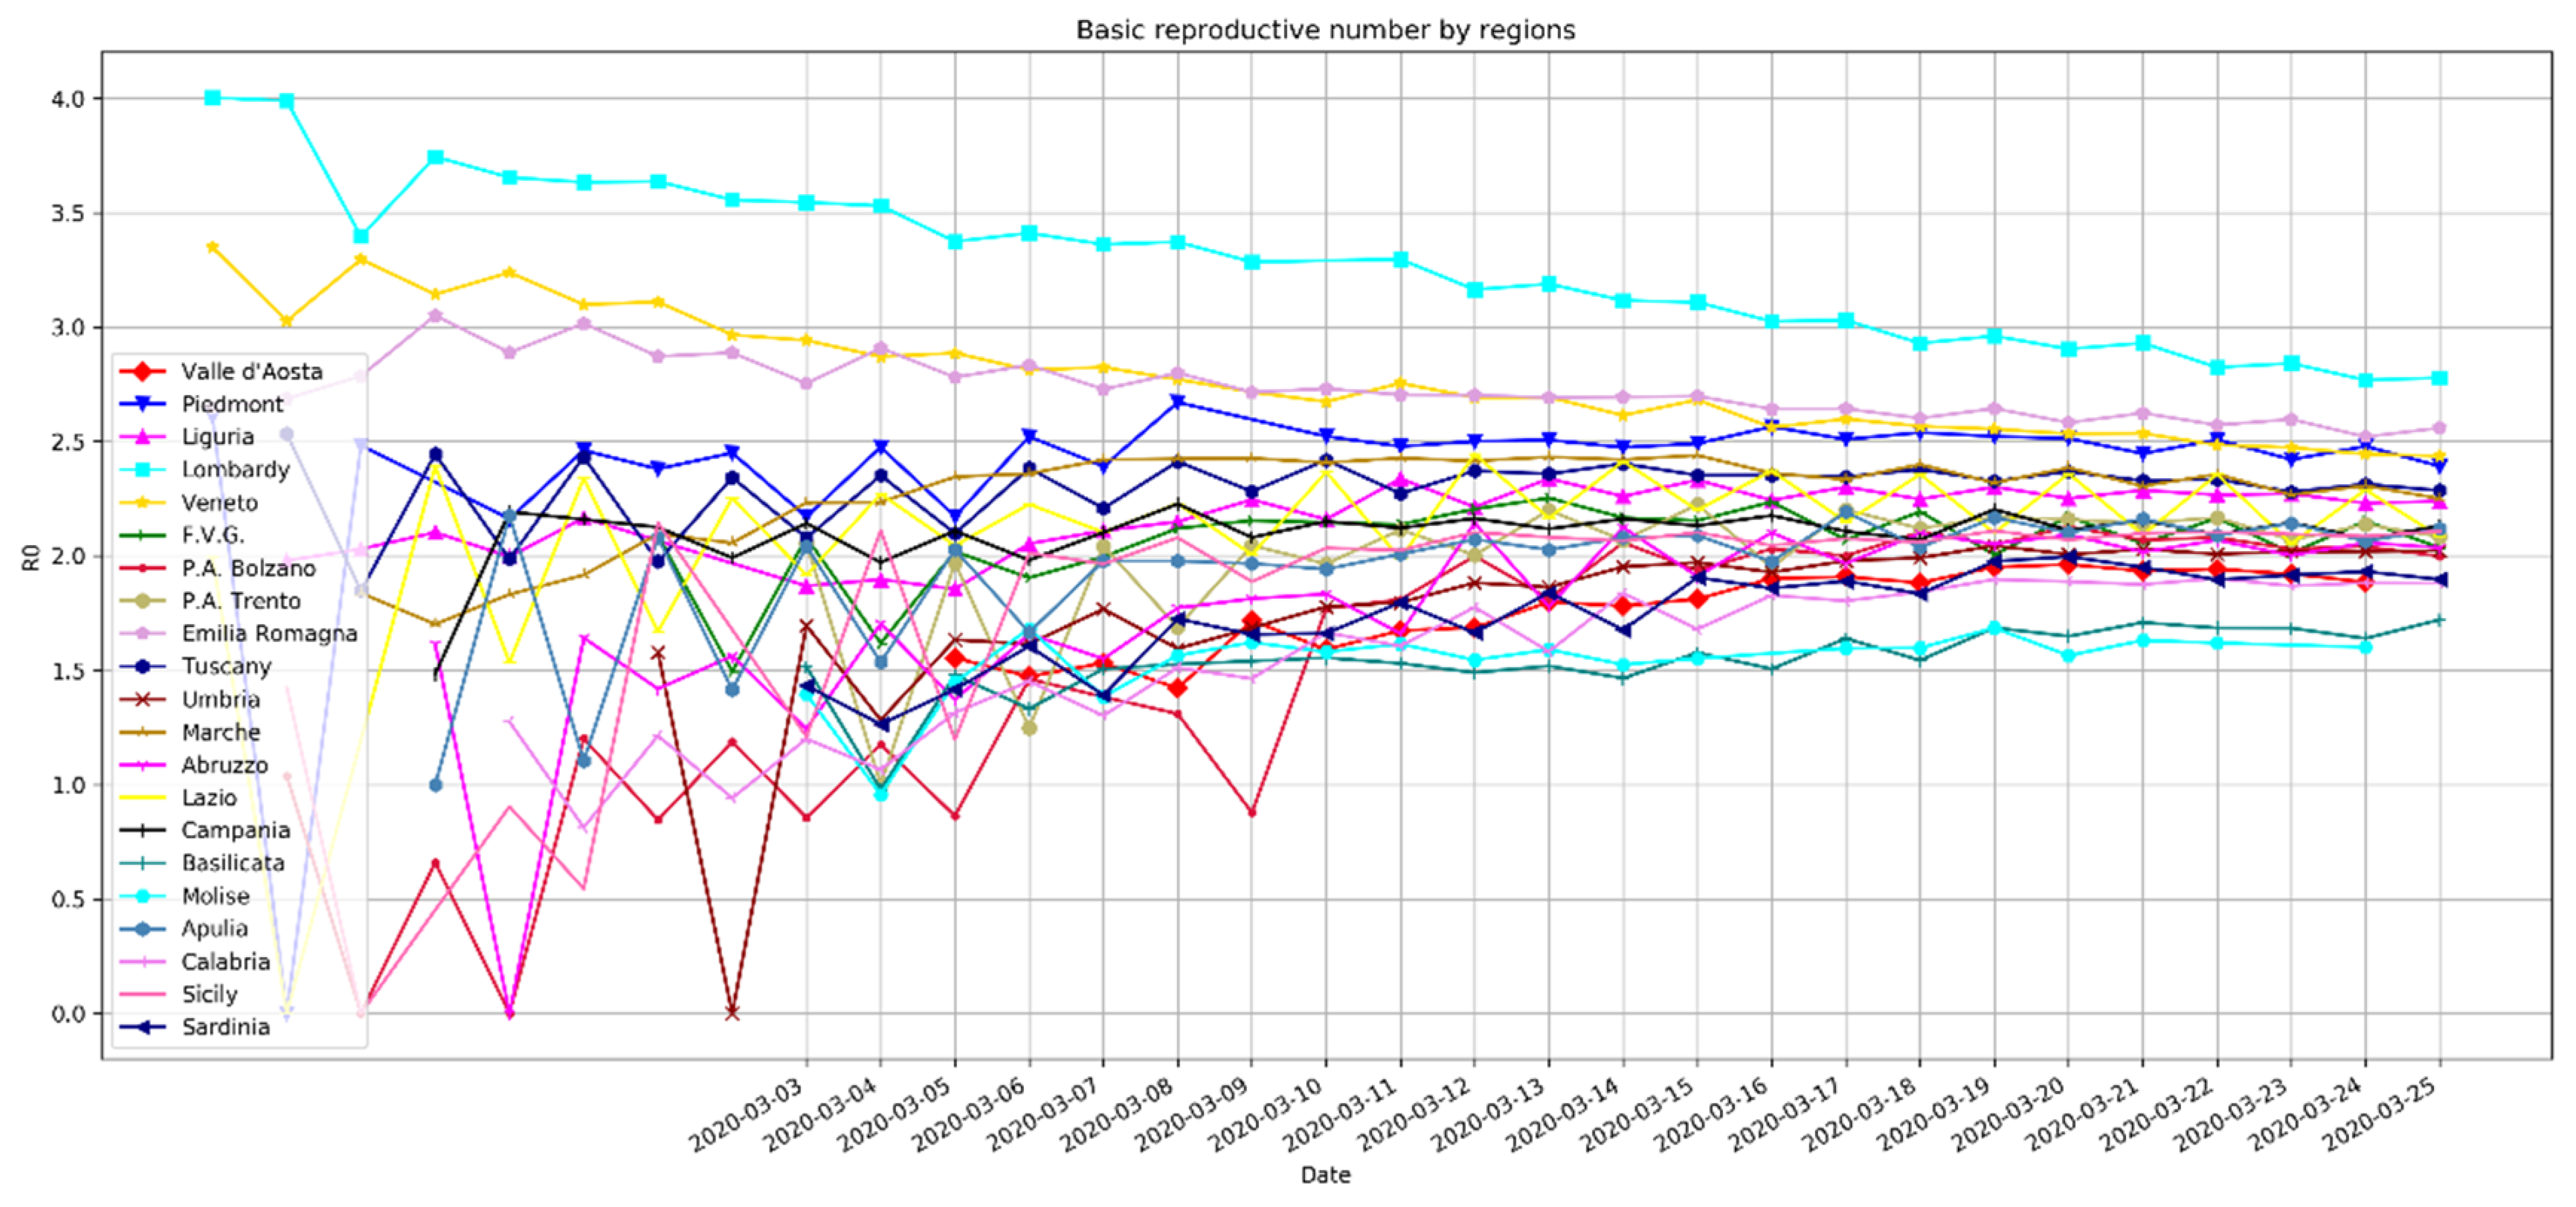
2.2. Daily Basis Estimation of the Reproductive Number
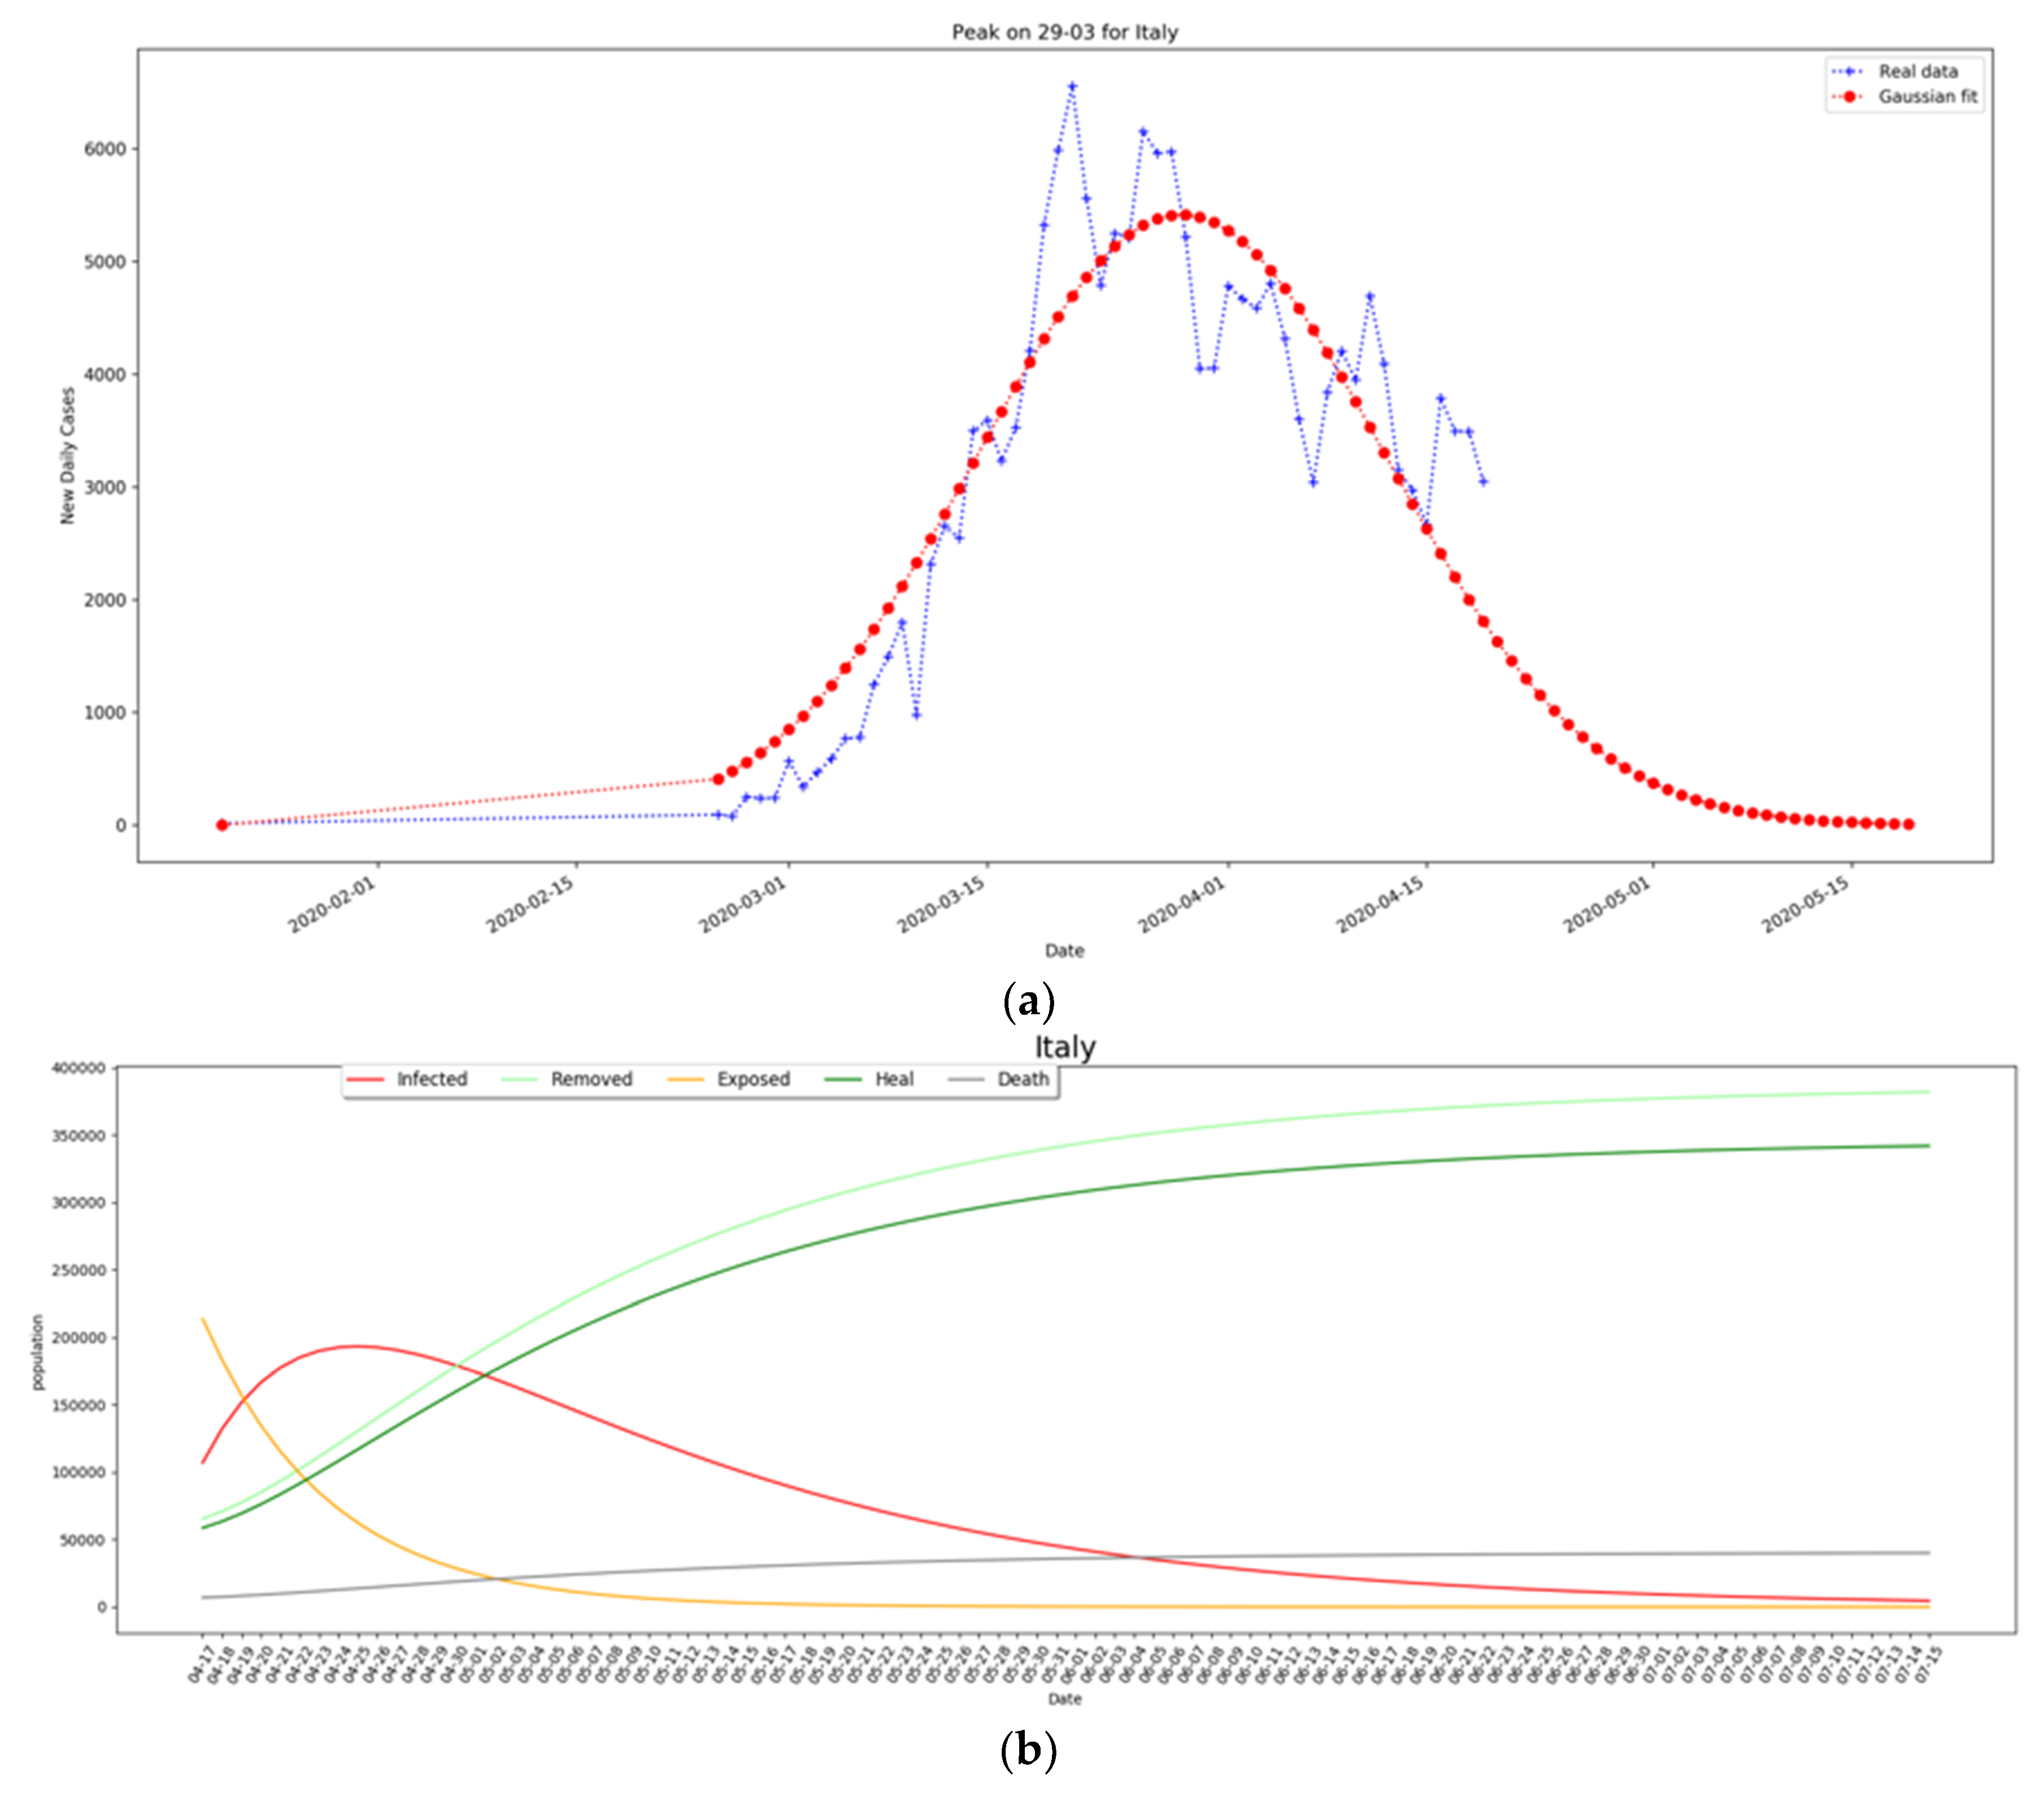
2.3. Modeling Transmission in Italy
3. Conclusions
Author Contributions
Funding
Conflicts of Interest
Patients Involvement
References
- Italian Ministry of Health. Daily Bulletin Covid-19 Outbreak in Italy. Available online: http://www.salute.gov.it/imgs/C_17_pagineAree_5351_24_file.pdf (accessed on 23 April 2020).
- Italian National Institute of Health (ISS). Coronavirus Surveillance Bulletin March 19/20. Available online: https://www.epicentro.iss.it/coronavirus/bollettino/Bollettino%20sorveglianza%20integrata%20COVID-19_19-marzo%202020.pdf (accessed on 23 April 2020).
- Zhou, T.; Liu, Q.; Yang, Z.; Liao, J.; Yang, K.; Bai, W.; Lu, X.; Zhang, W. Preliminary prediction of the basic reproduction number of the Wuhan novel coronavirus 2019-nCoV. J. Evid. Based Med. 2020, 13, 3–7. [Google Scholar] [CrossRef] [PubMed]
- Pastor-Satorras, R.; Castellano, C.; Mieghem, P.V.; Vespignani, A. Epidemic processes in complex networks. Rev. Mod. Physis 2015, 87, 925–979. [Google Scholar] [CrossRef] [Green Version]
- Wang, J.; Tang, K.; Feng, K.; Lv, W. High Temperature and High Humidity Reduce the Transmission of COVID-19. Available online: https://arxiv.org/abs/2003.05003 (accessed on 23 April 2020).
- Wu, J.T.; Leung, K.; Leung, G.M. Nowcasting and forecasting the potential domestic and international spread of the 2019-nCoV outbreak originating in Wuhan, China: A modelling study. Lancet 2020, 395, 689–697. [Google Scholar] [CrossRef] [Green Version]
- Zhao, S.; Musa, S.S.; Fu, H.; He, D.; Qin, J. Simple framework for real-time forecast in a data- limited situation: The Zika virus (ZIKV) outbreaks in Brazil from 2015 to 2016 as an example. Parasites Vectors 2019, 12, 344. [Google Scholar] [CrossRef] [PubMed] [Green Version]
- Zhao, S.; Lin, Q.; Ran, J.; Musa, S.S.; Yang, G.; Wang, W.; Lou, Y.; Gao, D.; Yang, L.; He, D.; et al. Preliminary estimation of the basic reproduction number of novel coronavirus (2019-nCoV) in China, from 2019 to 2020: A data-driven analysis in the early phase of the outbreak. Int. J. Infect. Dis. 2020, 92. [Google Scholar] [CrossRef] [PubMed] [Green Version]
- Kucharski, A.J.; Russell, T.W.; Diamond, C.; Liu, Y.; Edmunds, J.; Funk, S.; Eggo, R.M.; Sun, F.; Jit, M.; Munday, J.D.; et al. Early dynamics of transmission and control of COVID-19: A mathematical modelling study. Lancet Infect. Dis. 2020. [Google Scholar] [CrossRef] [Green Version]
- Kraemer, M.U.; Yang, C.H.; Gutierrez, B.; Wu, C.H.; Klein, B.; Pigott, D.M.; du Plessis, L.; Faria, N.R.; Li, R.; Hanage, W.P.; et al. The effect of human mobility and control measures on the COVID-19 epidemic in China. Science 2020. [Google Scholar] [CrossRef] [Green Version]
- Li1, R.; Pei, S.; Chen, B.; Song, Y.; Zhang, T.; Yang, W.; Shaman, J. Substantial undocumented infection facilitates the rapid dissemination of novel coronavirus (SARS-CoV2). Science 2020. [Google Scholar] [CrossRef] [Green Version]


| Region | Region | ||||
|---|---|---|---|---|---|
| min | max | min | max | ||
| Valle d’Aosta | 1.57 | 2.11 | Umbria | 2.16 | |
| Piedmont | 2.36 | 2.98 | Tuscany | 2.11 | 2.84 |
| Lombardy | 2.94 | 4.27 | Lazio | 2.10 | 3.11 |
| Liguria | 2.02 | 2.47 | Abruzzo | 1.29 | 2.36 |
| P.A. Bolzano | 0.84 | 2.26 | Campania | 1.62 | 2.44 |
| P.A. Trento | 1.00 | 2.38 | Molise | 1.06 | 1.78 |
| Friuli.V.G. | 1.74 | 2.52 | Apulia | 1.00 | 2.32 |
| Veneto | 2.60 | 3.64 | Basilicata | 1.19 | 1.73 |
| Emilia Romagna | 2.68 | 3.26 | Calabria | 0.99 | 2.02 |
| Marche | 1.96 | 2.65 | Sicily | 1.45 | 2.22 |
| Sardinia | 1.42 | 2.12 | |||
© 2020 by the authors. Licensee MDPI, Basel, Switzerland. This article is an open access article distributed under the terms and conditions of the Creative Commons Attribution (CC BY) license (http://creativecommons.org/licenses/by/4.0/).
Share and Cite
Distante, C.; Piscitelli, P.; Miani, A. Covid-19 Outbreak Progression in Italian Regions: Approaching the Peak by the End of March in Northern Italy and First Week of April in Southern Italy. Int. J. Environ. Res. Public Health 2020, 17, 3025. https://0-doi-org.brum.beds.ac.uk/10.3390/ijerph17093025
Distante C, Piscitelli P, Miani A. Covid-19 Outbreak Progression in Italian Regions: Approaching the Peak by the End of March in Northern Italy and First Week of April in Southern Italy. International Journal of Environmental Research and Public Health. 2020; 17(9):3025. https://0-doi-org.brum.beds.ac.uk/10.3390/ijerph17093025
Chicago/Turabian StyleDistante, Cosimo, Prisco Piscitelli, and Alessandro Miani. 2020. "Covid-19 Outbreak Progression in Italian Regions: Approaching the Peak by the End of March in Northern Italy and First Week of April in Southern Italy" International Journal of Environmental Research and Public Health 17, no. 9: 3025. https://0-doi-org.brum.beds.ac.uk/10.3390/ijerph17093025