Global Burden of Headache Disorders in Children and Adolescents 2007–2017

 , , ,
, , ,
Abstract
:1. Introduction
2. Materials and Methods
3. Results
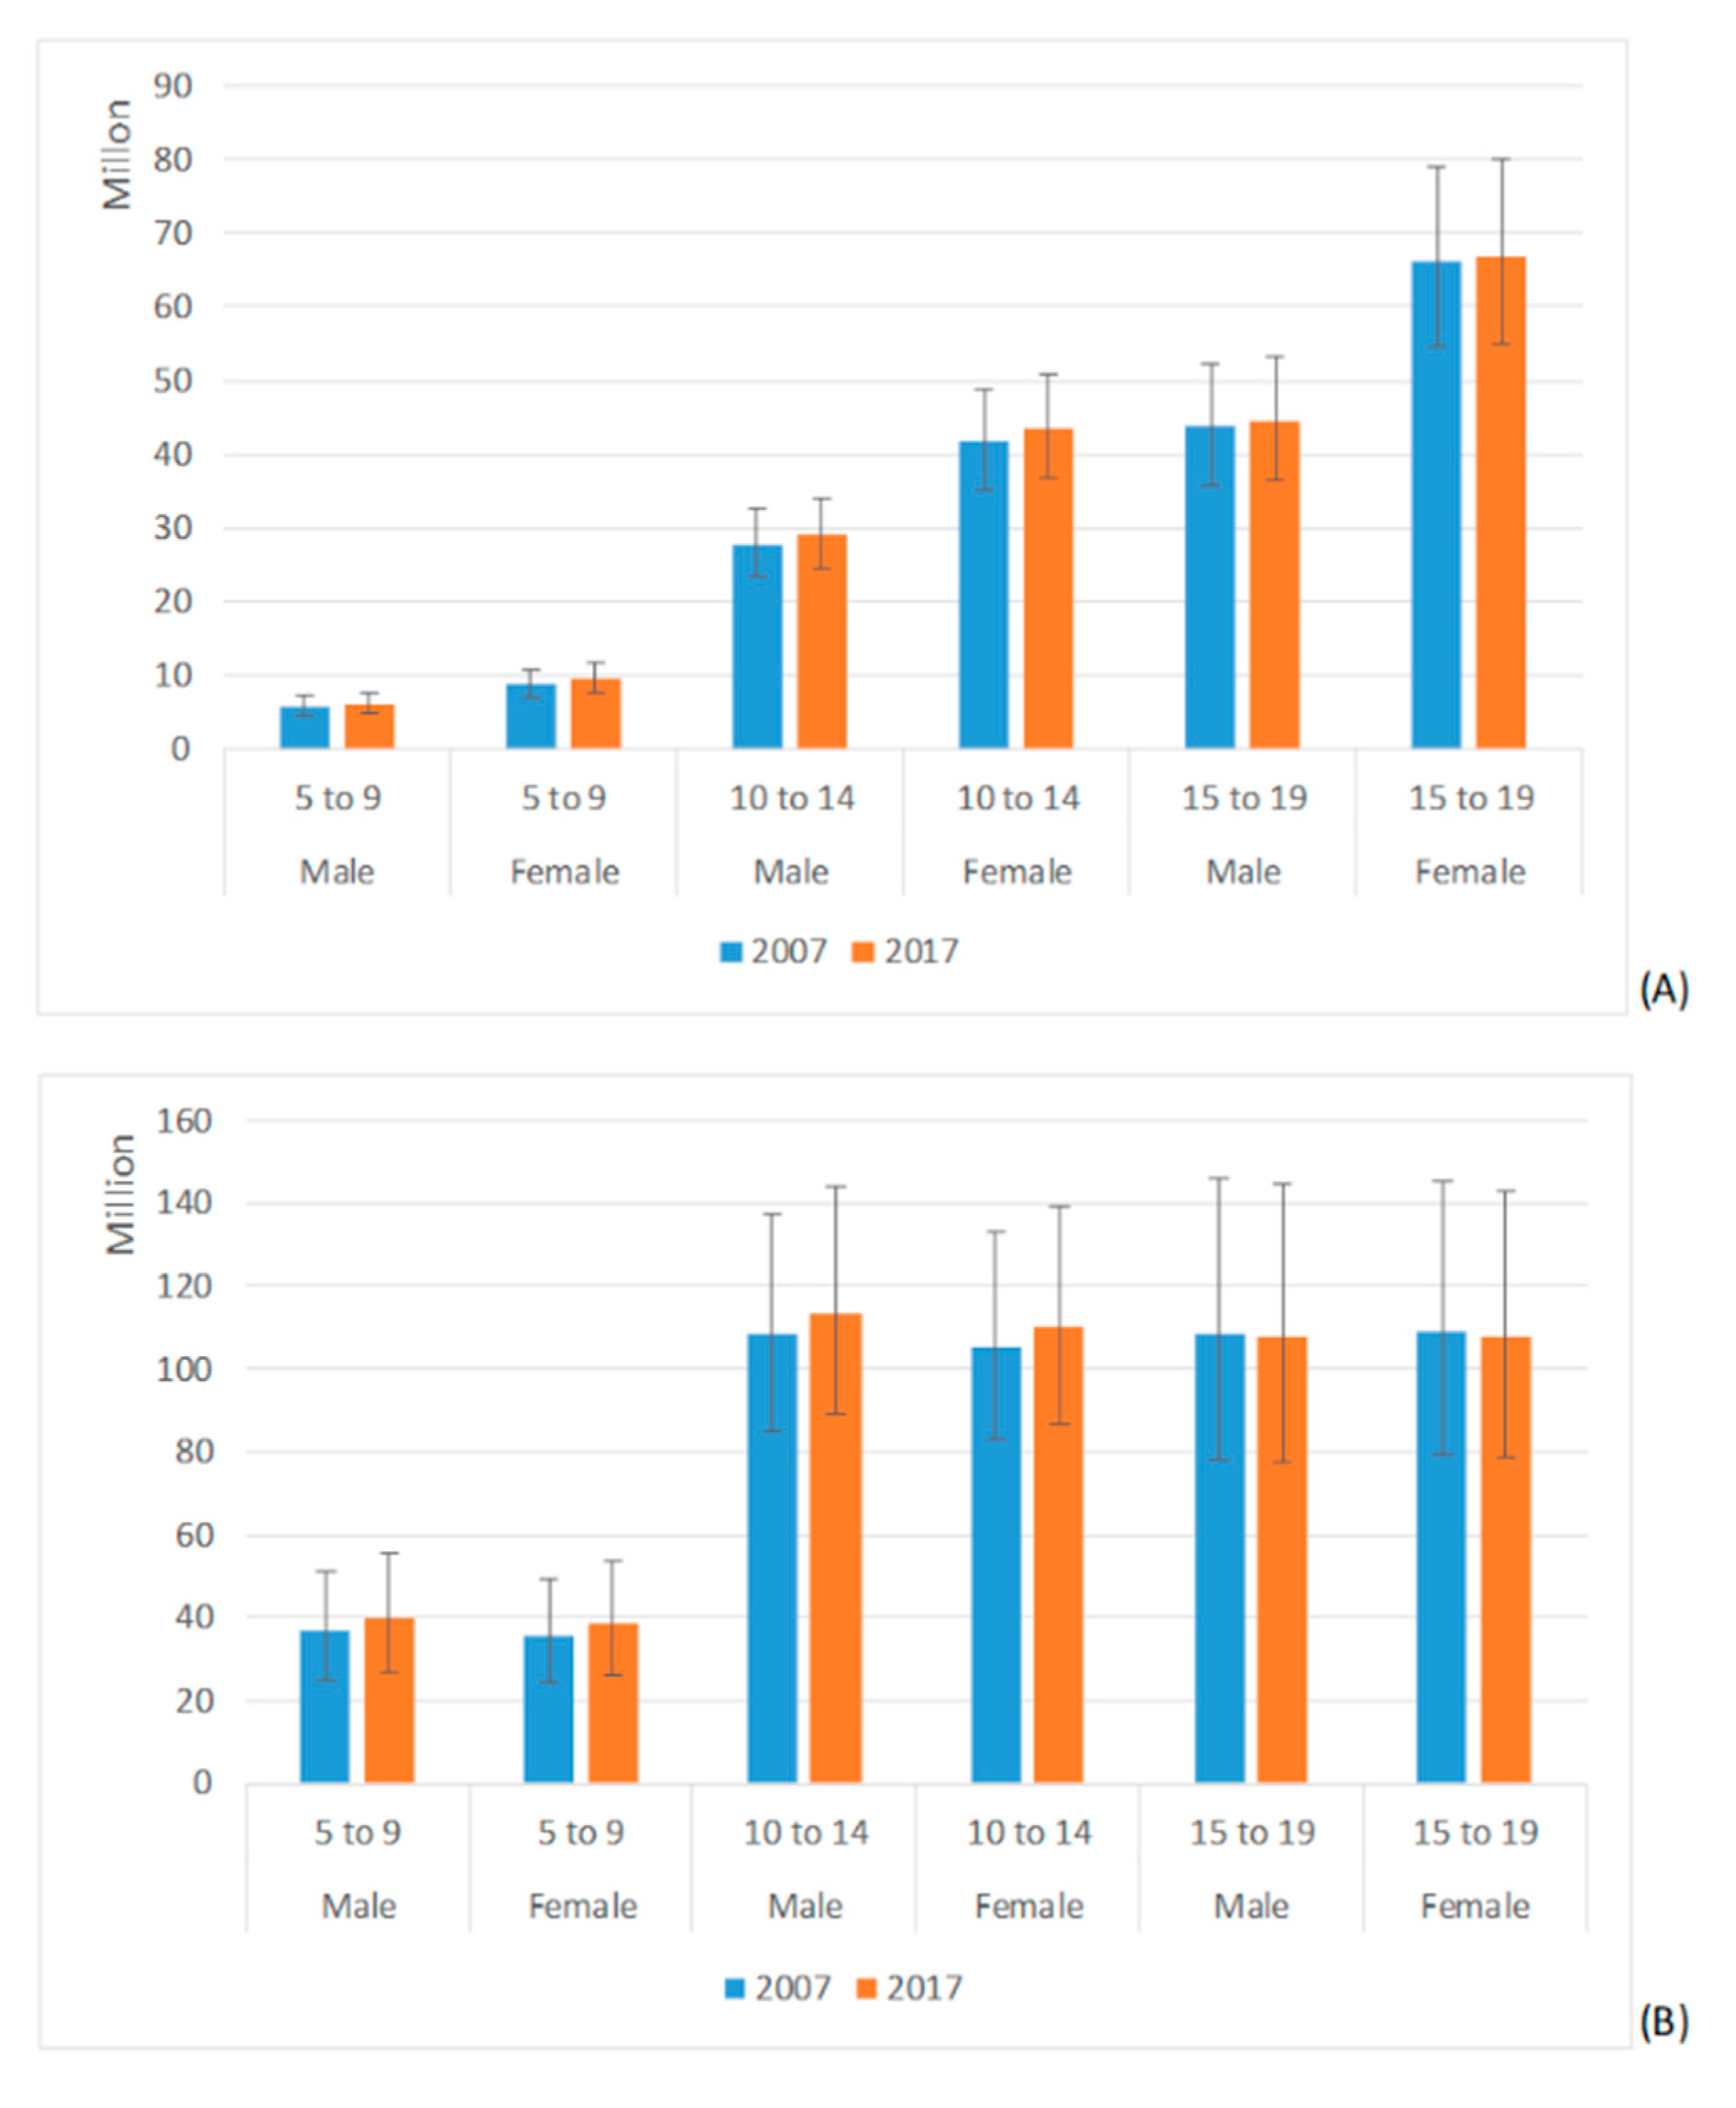
3.1. Migraine and TTH Prevalence Estimates
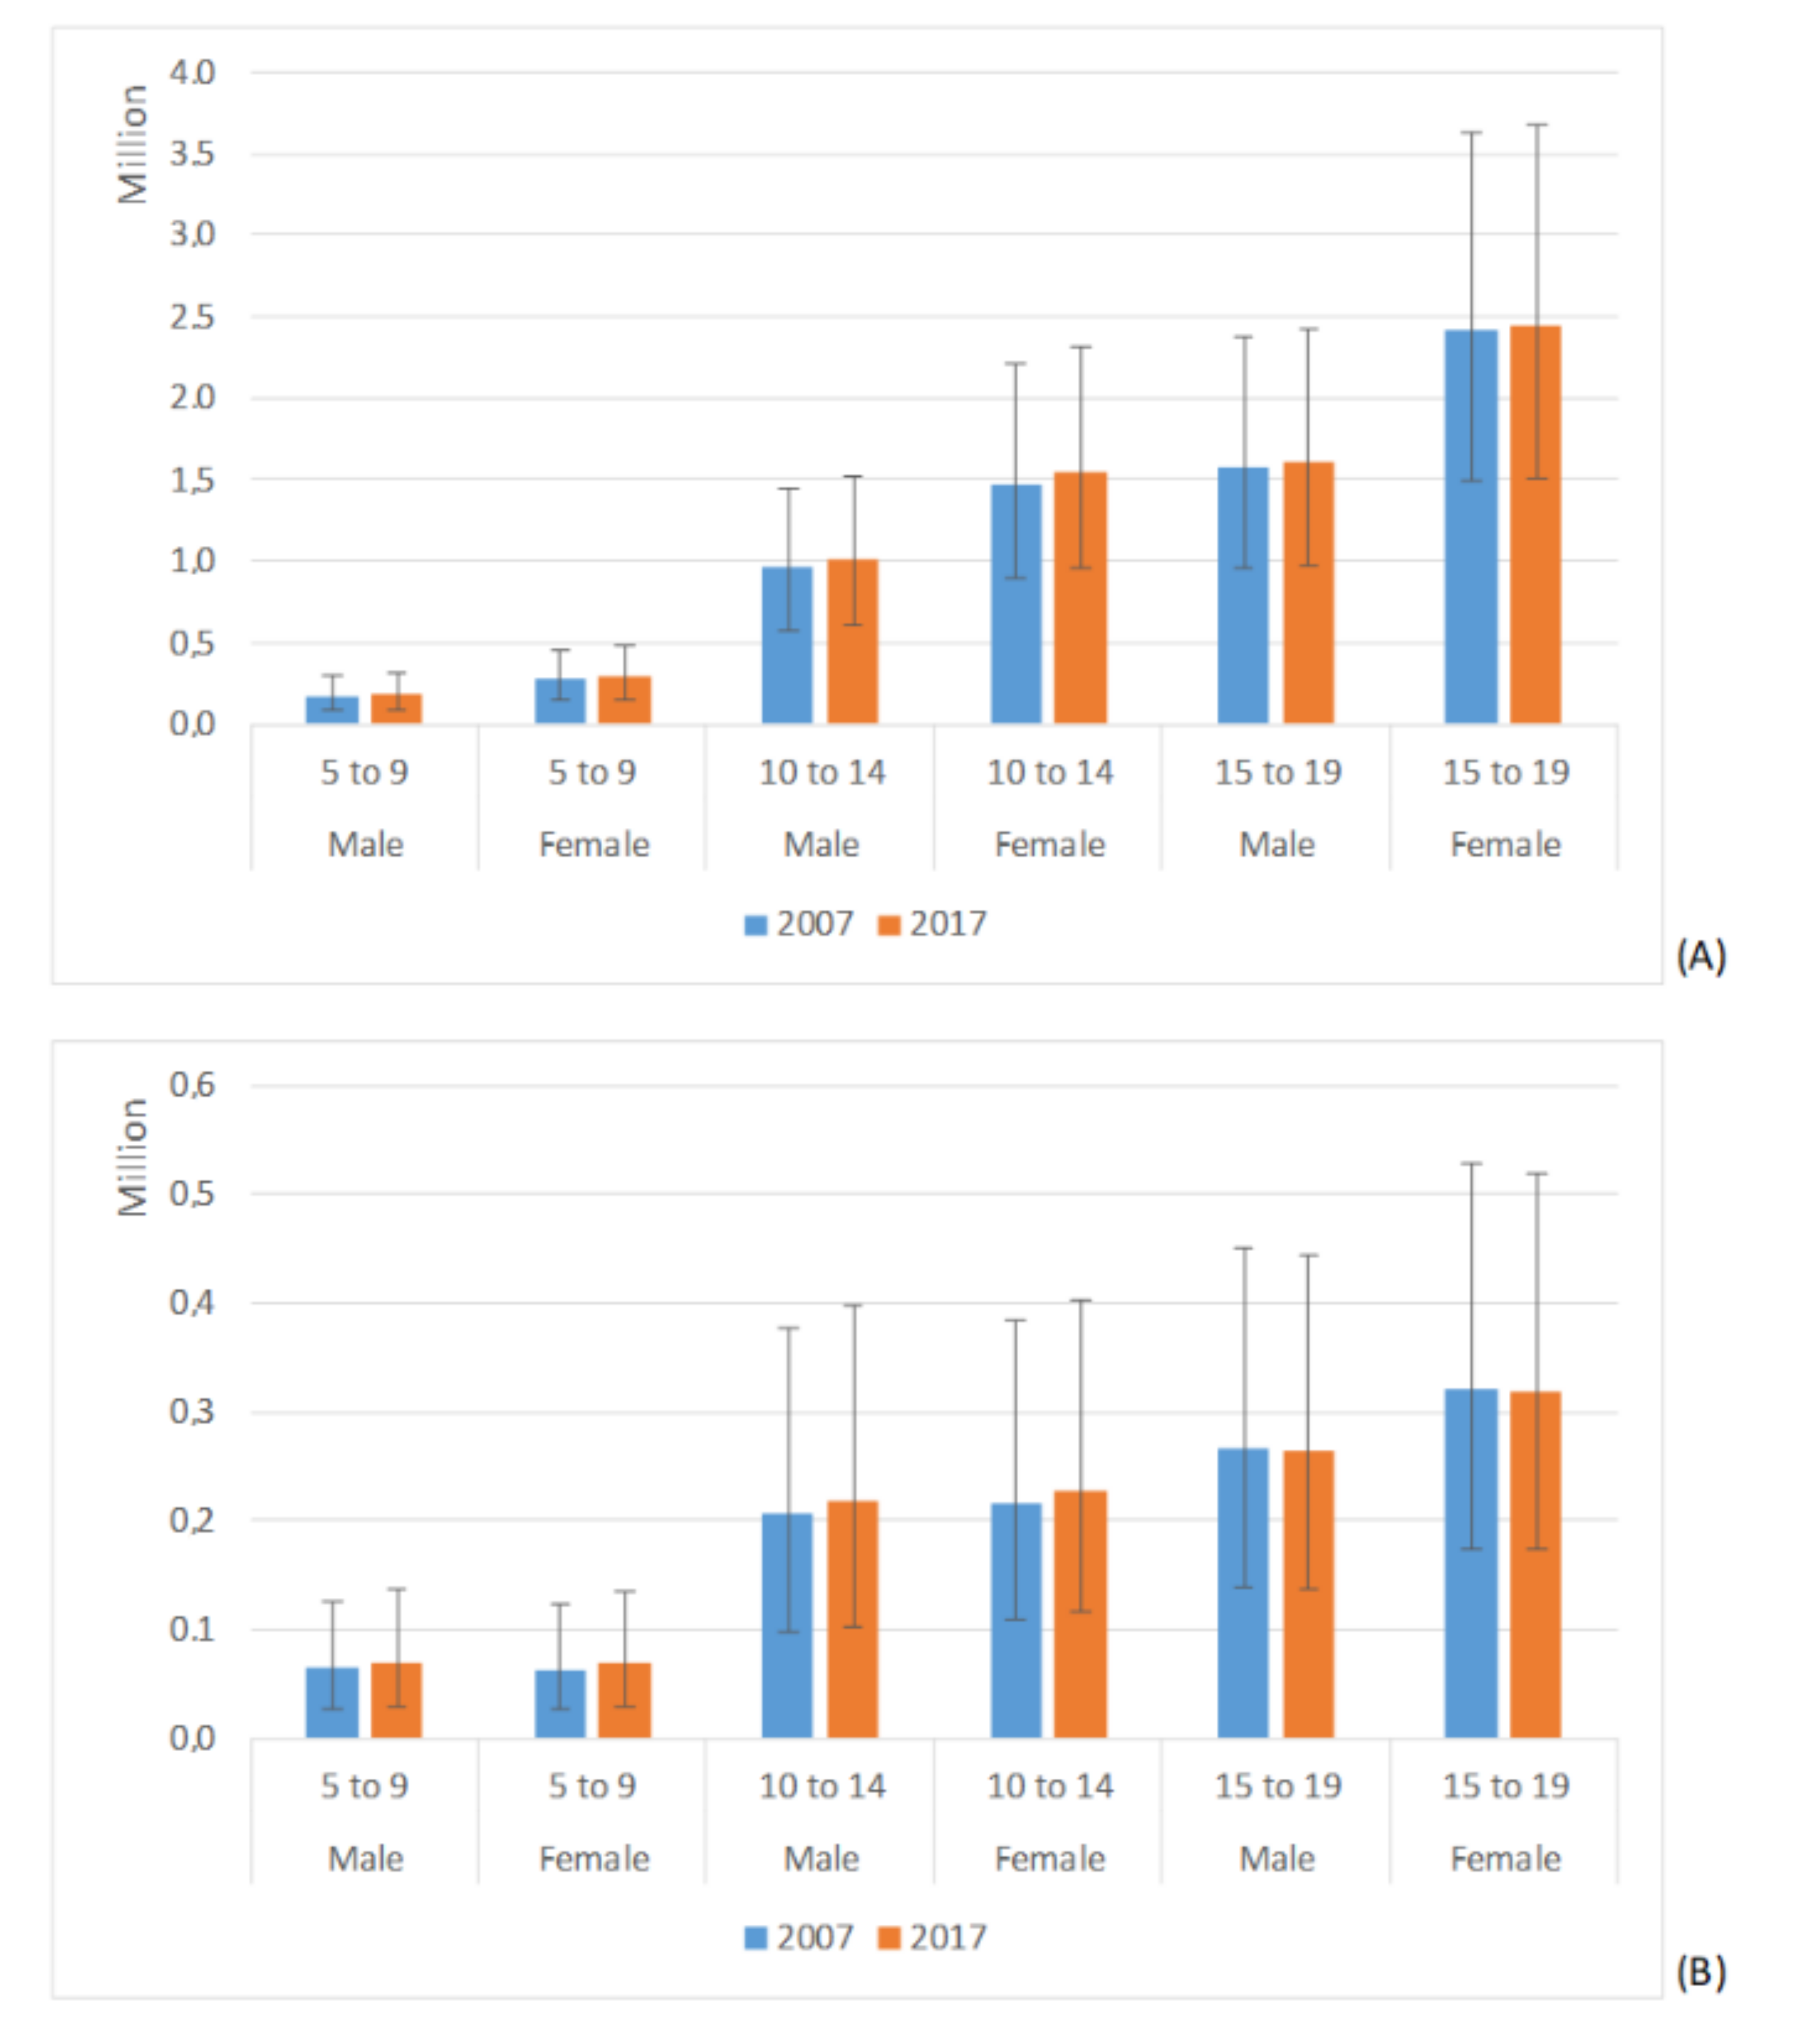
3.2. Migraine and TTH YLDs Estimates
4. Discussion
Limitations
5. Conclusions
Author Contributions
Funding
Institutional Review Board Statement
Informed Consent Statement
Data Availability Statement
Acknowledgments
Conflicts of Interest
References
- Abu-Arafeh, I.; Razak, S.; Sivaraman, B.; Graham, C. Prevalence of headache and migraine in children and adolescents: A systematic review of population-based studies. Dev. Med. Child Neurol. 2010, 52, 1088–1097. [Google Scholar] [CrossRef]
- Wöber-Bingöl, Ç. Epidemiology of Migraine and Headache in Children and Adolescents. Curr. Pain Headache Rep. 2013, 17, 1–11. [Google Scholar] [CrossRef]
- Karwautz, A.; Wöber, C.; Lang, T.; Böck, A.; Wagner-Ennsgraber, C.; Vesely, C.; Kienbacher, C.; Wöber-Bingöl, Ç. Psychosocial Factors in Children and Adolescents with Migraine and Tension-Type Headache: A Controlled Study and Review of the Literature. Cephalalgia 1999, 19, 32–43. [Google Scholar] [CrossRef]
- Kernick, D.; Reinhold, D.; Campbell, J.L. Impact of headache on young people in a school population. Br. J. Gen. Pr. 2009, 59, 678–681. [Google Scholar] [CrossRef]
- Al-Hashel, J.Y.; Alroughani, R.; Shauibi, S.; Alashqar, A.; Alhamdan, F.; Althufairi, H.; Owayed, S.; Ahmed, S.F. Impact of primary headache disorder on quality of life among school students in Kuwait. J. Headache Pain 2020, 21, 1–6. [Google Scholar] [CrossRef]
- Slater, S.K.; Powers, S.W.; O’Brien, H.L. Migraine in children: Presentation, disability and response to treatment. Curr. Opin. Pediatr. 2018, 30, 775–779. [Google Scholar] [CrossRef]
- Eidlitz-Markus, T.; Haimi-Cohen, Y.; Steier, D.; Zeharia, A. Effectiveness of Nonpharmacologic Treatment for Migraine in Young Children. Headache: J. Head Face Pain 2010, 50, 219–223. [Google Scholar] [CrossRef]
- Andrasik, F.; Grazzi, L.; Sansone, E.; D’Amico, D.; Raggi, A.; Grignani, E. Non-pharmacological Approaches for Headaches in Young Age: An Updated Review. Front. Neurol. 2018, 9, 1009. [Google Scholar] [CrossRef] [Green Version]
- Steiner, T.J. Lifting The Burden: The Global Campaign to Reduce the Burden of Headache Worldwide. J. Headache Pain 2005, 6, 373–377. [Google Scholar] [CrossRef] [Green Version]
- Steiner, T.J.; Birbeck, G.L.; Jensen, R.; Katsarava, Z.; Martelletti, P.; Stovner, L.J. Lifting The Burden: The first 7 years. J. Headache Pain 2010, 11, 451–455. [Google Scholar] [CrossRef] [Green Version]
- GBD 2016 Headache Collaborators. Global, regional, and national burden of migraine and tension-type headache, 1990–2016: A systematic analysis for the Global Burden of Disease Study 2016. Lancet Neurol. 2018, 17, 954–976. [Google Scholar] [CrossRef] [Green Version]
- Steiner, T.J.; Stovner, L.J.; Vos, T. GBD 2015: Migraine is the third cause of disability in under 50s. J. Headache Pain 2016, 17, 1–4. [Google Scholar] [CrossRef] [Green Version]
- Leonardi, M.; Raggi, A. A narrative review on the burden of migraine: When the burden is the impact on people’s life. J. Headache Pain 2019, 20, 1–11. [Google Scholar] [CrossRef] [Green Version]
- The Lancet. Join the Lancet 2020 Campaign on child and adolescent health. Lancet 2020, 395, 89. [Google Scholar] [CrossRef]
- Ruan, P.-S.; Xu, H.-Q.; Wu, J.-H.; Song, Q.F.; Qiu, H.-Y. COVID-19 in Children: Clinical Characteristics and Follow-Up Study. SN Compr. Clin. Med. 2020, 2, 1713–1716. [Google Scholar] [CrossRef]
- Vierucci, F.; Bacci, C.; Mucaria, C.; Dini, F.; Federico, G.; Maielli, M.; Vaccaro, A. How COVID-19 Pandemic Changed Children and Adolescents Use of the Emergency Department: The Experience of a Secondary Care Pediatric Unit in Central Italy. SN Compr. Clin. Med. 2020, 2, 1959–1969. [Google Scholar] [CrossRef]
- Sakai, F. Oral Triptans in Children and Adolescents: An Update. Curr. Pain Headache Rep. 2015, 19. [Google Scholar] [CrossRef]
- Evers, S. The Efficacy of Triptans in Childhood and Adolescence Migraine. Curr. Pain Headache Rep. 2013, 17. [Google Scholar] [CrossRef]
- Vollono, C.; Vigevano, F.; Tarantino, S.; Valeriani, M. Triptans other than sumatriptan in child and adolescent migraine: Literature review. Expert Rev. Neurother. 2011, 11, 395–401. [Google Scholar] [CrossRef]
- Hershey, A.D.; Powers, S.W.; Bentti, A.-L.; Degrauw, T.J. Effectiveness of Amitriptyline in the Prophylactic Management of Childhood Headaches. Headache: J. Head Face Pain 2000, 40, 539–549. [Google Scholar] [CrossRef]
- Whitehouse, W.P.; Agrawal, S. Management of children and young people with headache. Arch. Dis. Child. Educ. Pr. Ed. 2016, 102, 58–65. [Google Scholar] [CrossRef] [Green Version]
- Kacperski, J.; Hershey, A.D. Preventive Drugs in Childhood and Adolescent Migraine. Curr. Pain Headache Rep. 2014, 18, 1–8. [Google Scholar] [CrossRef]
- Papetti, L.; Spalice, A.; Nicita, F.; Paolino, M.C.; Castaldo, R.; Iannetti, P.; Villa, M.P.; Parisi, P. Migraine treatment in developmental age: Guidelines update. J. Headache Pain 2010, 11, 267–276. [Google Scholar] [CrossRef] [Green Version]
- Zewde, Y.Z.; Zebenigus, M.; Demissie, H.; Tekle-Haimanot, R.; Uluduz, D.; Şaşmaz, T.; Bozdag, F.; Steiner, T.J. The prevalence of headache disorders in children and adolescents in Ethiopia: A schools-based study. J. Headache Pain 2020, 21, 1–9. [Google Scholar] [CrossRef]
- Luvsannorov, O.; Anisbayar, T.; Davaasuren, M.; Baatar, O.; Batmagnai, K.; Tumurbaatar, K.; Enkhbaatar, S.; Uluduz, D.; Şaşmaz, T.; Solmaz, E.T.; et al. The prevalence of headache disorders in children and adolescents in Mongolia: A nationwide schools-based study. J. Headache Pain 2020, 21, 1–9. [Google Scholar] [CrossRef]
- Genc, D.; Vaičienė-Magistris, N.; Zaborskis, A.; Şaşmaz, T.; Tunç, A.Y.; Uluduz, D.; Steiner, T.J. The prevalence of headache disorders in children and adolescents in Lithuania: A schools-based study. J. Headache Pain 2020, 21, 1–9. [Google Scholar] [CrossRef]
- Philipp, J.; Zeiler, M.; Wöber, C.; Wagner, G.; Karwautz, A.F.K.; Steiner, T.J.; Wöber-Bingöl, Ç. Prevalence and burden of headache in children and adolescents in Austria—A nationwide study in a representative sample of pupils aged 10–18 years. J. Headache Pain 2019, 20, 1–12. [Google Scholar] [CrossRef] [Green Version]
- Wöber, C.; Wöber-Bingöl, Ç.; Uluduz, D.; Aslan, T.S.; Uygunoglu, U.; Tüfekçi, A.; Alp, S.I.; Duman, T.; Sürgün, F.; Emir, G.K.; et al. Undifferentiated headache: Broadening the approach to headache in children and adolescents, with supporting evidence from a nationwide school-based cross-sectional survey in Turkey. J. Headache Pain 2018, 19, 18. [Google Scholar] [CrossRef]
- Wöber-Bingöl, Ç.; Wöber, C.; Uluduz, D.; Uygunoğlu, U.; Aslan, T.S.; Kernmayer, M.; Zesch, H.-E.; A Gerges, N.T.; Wagner, G.; Siva, A.; et al. The global burden of headache in children and adolescents—Developing a questionnaire and methodology for a global study. J. Headache Pain 2014, 15, 86. [Google Scholar] [CrossRef]


| Location and Age Range | Females | Males | ||||
|---|---|---|---|---|---|---|
| 2007 | 2017 | Variation | 2007 | 2017 | Variation | |
| Global-Migraine | ||||||
| 5–9 | 2996.0 (2387.9;3652.4) | 2956.3 (2350.1;3613.2) | −0.7% (−4.2;2.8%) | 1809.3 (1431.6;2237.5) | 1795.6 (1417.7;2211.8) | 0.1% (−3.7;3.7%) |
| 10–14 | 14,149.7 (11,954.0;16,563.3) | 14,144.4 (11,902.9;16,581.7) | 0.1% (−2.4;2.9%) | 8803.0 (7432.0;10381.5) | 8832.4 (7426.5;10,389.0) | 0.7% (−2.1;3.3%) |
| 15–19 | 21,529.3 (17,769.9;25,636.3) | 22,279.6 (18,332.4;26,664.4) | 3.4% * (1.5;5.4%) | 13,596.9 (11,093.5;16,178.2) | 14,121.7 (11,514.5;16,906.4) | 3.8% * (1.7%;5.9%) |
| Global-TTH | ||||||
| 5–9 | 12,126.6 (8189.7;16,770.1) | 12,142.7 (8195.7;16,807.5) | 0.7% * (0.3;1.2%) | 11,657.6 (7812.0;16,193.8) | 11,668.6 (7796.9;16,222.8) | 0.9% * (0.4;1.5%) |
| 10–14 | 35,624.1 (28,047.0;45,105.4) | 35,748.8 (28,145.9;45,226.8) | 0.5% * (0.1;0.9%) | 34,243.9 (26,829.1;43,514.0) | 34,466.6 (27,033.1;43,781.5) | 1.0% * (0.6;1.4%) |
| 15–19 | 35,451.0 (25,841.4;47,154.6) | 35,834.4 (26,156.8;47,624.5) | 1.0% * (0.3;1.7%) | 33,570.2 (24,124.9;45,204.0) | 34,035.6 (24,528.0;45,761.0) | 1.3% * (0.8;1.9%) |
| African Region-Migraine | ||||||
| 5–9 | 2052.5 (1581.6;2598.0) | 2081.3 (1599.8;2631.9) | 2.7% * (1.7;3.5%) | 1135.2 (1024.5;1690.8) | 1351.1 (1034.6;1716.0) | 2.7% * (2.0;3.4%) |
| 10–14 | 10,465.5 (8600.3;12,687.8) | 10,569.0 (8675.9;12,808.5) | 2.0% * (1.2;2.7%) | 6877.5 (5660.1;8249.4) | 6909.8 (5674.3;8304.2) | 1.8% * (1.2;2.4%) |
| 15–19 | 19,155.9 (15,427.3;23,222.6) | 19,166.8 (15,375.2;23,334.6) | 0.4% * (0.0;0.9%) | 12,477.2 (9923.8;15,198.0) | 12,431.8 (9872.0;15,179.8) | 0.2% (−0.3;0.6%) |
| African Region-TTH | ||||||
| 5–9 | 11,707.7 (7879.1;16,349.5) | 11,835.3 (7981.8;16,531.3) | 2.4% * (2.0;2.8%) | 11,275.9 (7522.4;15826.3) | 11,352.9 (7561.0;15,942.2) | 2.1% * (1.7;2.7%) |
| 10–14 | 34,222.3 (26,820.3;43,450.5) | 34,544.8 (27,177.5;44,000.4) | 1.9% * (1.6;2.3%) | 33,317.1 (25,951.2;42,565.5) | 33,520.8 (26,148.0;42,788.6) | 2.0% * (1.5;2.4%) |
| 15–19 | 3816.8 (22,911.6;43,090.1) | 31,965.9 (22,998.0;43,367.8) | 0.8% * (0.5;1.2%) | 31,331.1 (22,472.0;42,730.0) | 31,399.5 (22,485.1;72,857.0) | 0.7% * (0.4;1.1%) |
| Eastern Mediterranean Region-Migraine | ||||||
| 5–9 | 3085.0 (2414.2;3832.0) | 3080.9 (2413.1;3831.3) | 0.9% (−0.2;1.8%) | 2130.0 (1682.5;2651.9) | 2128.9 (1680.5;2652.9) | 1.1% (−0.2;2.3%) |
| 10–14 | 14,845.1 (12,457.2;17,616.9) | 14,703.6 (12,325.8;17,460.0) | 0.3% (−0.5;1.0%) | 10,590.8 (8885.9;12,500.6) | 10,441.8 (8765.9;12,343.5) | 0.0% (−0.2;2.3%) |
| 15–19 | 24,453.3 (20,967.9;30,305.5) | 24,618.6 (20,242.8;29,329.0) | −2.9% * (−3.5;−2.1%) | 17,597.3 (14,219.9;21,080.4) | 16,937.4 (13,713.8;20,306.4) | −3.1% * (−3.8;−2.3%) |
| Eastern Mediterranean Region-TTH | ||||||
| 5–9 | 12,011.3 (8129.3;16,698.2) | 11,983.4 (8098.3;16,696.2) | 0.8% (−0.1;1.6%) | 11,866.8 (7982.3;16,648.0) | 11,788.4 (7947.9;16,539.7) | 0.5% (−0.8;1.7%) |
| 10–14 | 33,710.3 (26,507.7;42,641.6) | 33,813.4 (2660.7;42,720.7) | 1.5% * (0.9;2.2%) | 33,558.9 (26,109.2;42,987.0) | 33,588.1 (26,100.7;43,024.1) | 1.5% * (0.5;2.4%) |
| 15–19 | 31,830.2 (23,357.2;42,070.9) | 32,296.5 (23,751.1;42,860.9) | 1.9% * (1.1;2.8%) | 32,499.5 (23,500.6;43,162.6) | 32,870.6 (23,835.9;43,546.3) | 1.8% * (1.1;2.6%) |
| European Region-Migraine | ||||||
| 5–9 | 3207.2 (2576.9;3885.5) | 3248.3 (2574.0;3989.0) | 1.7% (−1.4;4.8%) | 1786.5 (1424.3;2171.7) | 1801.4 (1435.8;2202.1) | 1.4% (−1.3;4.1%) |
| 10–14 | 15,289.1 (12,948.;17,765.2) | 15,510.5 (13,014.0;18,195.6) | −0.1% (−2.4;2.9%) | 8745.4 (7377.4;10,258.2) | 8835.6 (7383.6;10,451.9) | 2.1% (−0.1;4.2%) |
| 15–19 | 25,126.0 (20,934.7;29,465.5) | 25,518.8 (21,077.1;30,274.2) | 1.9% * (0.0;3.7%) | 14,197.9 (11,670.8;16,884.9) | 14,367.2 (11,747.6;17,158.9) | 2.1% * (0.4;3.9%) |
| European Region-TTH | ||||||
| 5–9 | 11,302.7 (7712.5;15706.4) | 11,458.8 (7673.8;16,003.2) | 1.7% (−0.6;3.6%) | 12,246.9 (8348.3;16,937.5) | 12,347.6 (8380.1;17,218.8) | 1.4% (−0.7;3.3%) |
| 10–14 | 33,272.1 (26,430.7;41,961.4) | 32,936.1 (26,060.6;41,486.1) | −0.1% (−1.6;1.2%) | 34,875.9 (27,502.8;44,034.4) | 34,777.0 (27,361.1;44,006.5) | 0.7% (−0.7;1.9%) |
| 15–19 | 33,290.1 (24,364.4;44,377.1) | 32,010.0 (23,390.6;42,898.1) | −3.5% * (−4.9;−2.2%) | 32,659.7 (23,684.4;43,390.8) | 31,838.9 (22,949.6;42,334.4) | −1.7% * (−2.9;−0.4%) |
| Region of the Americas-Migraine | ||||||
| 5–9 | 4762.4 (3818.2;5781.2) | 4772.7 (3836.7;5772.3) | 1.3% (−2.5;4.5%) | 2608.5 (2107.2;3165.7) | 2574.2 (2061.3;3145.7) | −0.2% (−4.5;3.7%) |
| 10–14 | 21,409.6 (18,335.4;24,836.1) | 21,401.3 (18,331.4;24,949.7) | 0.9% (−1.8;3.4%) | 12,024.3 (10,238.7;14,012.9) | 11,908.0 (10,092.2;13,899.9) | 0.3% (−2.7;3.4%) |
| 15–19 | 30,015.5 (25,058.5;35,166.5) | 30,089.5 (25,096.2;35,441.1) | 0.5% (−1.5;2.7%) | 16,563.6 (13,719.9;19,601.1) | 16,625.5 (13,844.3;19,611.4) | 0.9% (−1.7;3.3%) |
| Region of the Americas-TTH | ||||||
| 5–9 | 11,961.3 (8214.4;16,403.7) | 11,954.7 (8189.1;16,544.1) | 1.0% (−0.9;3.0%) | 12,090.7 (8246.2;16,704.3) | 12,042.8 (8164.2;16,625.3) | 0.8% (−2.1;2.9%) |
| 10–14 | 34,347.7 (26,851.8;43,588.6) | 34,452.8 (26,929.6;43,882.1) | 1.3% * (0.0;2.7%) | 34,247.8 (26,567.2;43,930.0) | 34,606.7 (26,881.8;44,340.7) | 2.4% * (0.9;4.0%) |
| 15–19 | 34,662.6 (25,118.6;46,253.2) | 34,419.2 (25,001.3;45,595.6) | −0.4% (−1.6;0.9%) | 35,102.0 (25,581.8;46,030.0) | 34,451.5 (25,051.3;45,221.5) | −1.4% (−2.8;0.1%) |
| South-East Asia Region-Migraine | ||||||
| 5–9 | 3428.3 (2741.3;4168.3) | 3404.0 (2692.8;4178.2) | 0.2% (−10.0;10.6%) | 2072.2 (1626.3;2563.1) | 2072.1 (1647.4;2554.3) | 1.5% (−8.4;12.7%) |
| 10–14 | 16,007.0 (13,553.9;18,700.3) | 15,964.8 (13,453.1;18,645.7) | 0.2% (−8.1;8.8%) | 10,163.5 (8555.1;12,078.3) | 10,163.9 (8551.3;12,033.6) | 1.2% (−6.3;9.0%) |
| 15–19 | 23,648.0 (19,474.7;28,274.5) | 23,818.6 (19,588.0;28,437.9) | 0.9% (−4.6;6.9%) | 16,087.6 (13,075.2;19,174.9) | 16,090.1 (13,091.5;19,337.4) | 0.6% (−4.7;6.2%) |
| South-East Asia Region-TTH | ||||||
| 5–9 | 13,397.7 (8927.3;18,707.9) | 13,407.3 (8914.8;18,716.6) | 1.0% * (0.6;1.4%) | 12,674.7 (8499.1;17,667.7) | 12,665.5 (8485.3;17,675.9) | 1.4% * (0.8;2.0%) |
| 10–14 | 40,273.4 (31,690.9;50,486.9) | 40,317.5 (31,756.6;50,534.9) | 0.6% * (0.3;0.8%) | 38,162.0 (29,879.8;48,013.5) | 38,179.6 (29,908.0;48,013.4) | 1.2% * (0.8;1.8%) |
| 15–19 | 43,507.2 (32,092.3;56,830.4) | 43,734.6 (32,274.1;57,079.0) | 0.7% * (0.5;0.9%) | 39,754.9 (28,736.1;53,602.0) | 39,820.7 (28,782.9;53,716.4) | 0.8% (0.5;1.1%) |
| Western Pacific Region-Migraine | ||||||
| 5–9 | 1825.0 (1458.7;2241.1) | 1824.6 (1453.7;2244.7) | 0.0% (−1.4;1.2%) | 1132.7 (871.1;1406.6) | 1142.3 (878.6;1416.6) | 0.8% (−0.1;2.0%) |
| 10–14 | 8844.8 (7409.2;10,461.2) | 8935.5 (7482.7;10,579.6) | 0.5% (−0.6;1.4%) | 5507.5 (4579.2;6552.6) | 5598.1 (4656.5;6660.3) | 0.7% (−0.2;1.7%) |
| 15–19 | 13,612.1 (11,073.6;16,269.0) | 14,313.9 (11,667.1;17,144.7) | 5.1% * (3.9;6.2%) | 8393.0 (6850.8;10,031.9) | 9034.6 (7349.3;10,800.6) | 7.4% * (6.3;8.4%) |
| Western Pacific Region-TTH | ||||||
| 5–9 | 10,944.1 (7280.5;15,354.0) | 10,975.3 (7304.4;15,401.6) | 0.3% (−0.3;1.0%) | 9708.5 (6460.3;13,684.9) | 9754.0 (6533.6;13,755.5) | 0.5% (−0.3;1.3%) |
| 10–14 | 32,870.7 (25,391.7;42,431.6) | 32,868.7 (25,484.6;42,417.7) | −0.5% (−1.1;0.0%) | 29,497.2 (22,606.2;37,697.9) | 29,653.3 (22,730.1;37,867.9) | −0.4% (−1.2;0.3%) |
| 15–19 | 31,591.7 (22,560.1;43,096.8) | 31,418.4 (22,458.1;43,017.8) | −0.6% (−1.5;0.3%) | 28,113.1 (19,748.1;39,524.4) | 28,480.9 (20,077.5;39,700.1) | 1.1% * (0.1;2.1%) |
| Location and Age Range | Females | Males | ||||
|---|---|---|---|---|---|---|
| 2007 | 2017 | Variation | 2007 | 2017 | Variation | |
| Global-Migraine | ||||||
| 5–9 | 91.2 (47.5;152.9) | 90.5 (47.3;150.9) | 5.2% (−1.1;11.5%) | 53.3 (25.8;93.3) | 53.2 (25.6;93.3) | 7.3% (−0.6;16.4%) |
| 10–14 | 499.9 (305.7;748.9) | 502.0 (309.3;751.3) | 2.1% (−1.0;5.5%) | 305.2 (182.8;457.3) | 307.3 (182.5;463.6) | 1.4% (−2.5;5.5%) |
| 15–19 | 787.1 (483.0;1178.7) | 817.0 (501.4;1227.1) | 4.4% * (2.1;7.0%) | 489.0 (294.1;737.5) | 507.6 (307.4;768.1) | 2.7% * (0.3;5.6%) |
| Global-TTH | ||||||
| 5–9 | 21.3 (9.0;41.8) | 21.4 (8.9;42.2) | 6.6% * (2.6;10.8%) | 20.0 (8.2;39.6) | 20.1 (8.2;8.2;39.7) | 7.8% * (2.3;13.5%) |
| 10–14 | 73.4 (37.0;130.4) | 74.0 (37.6;130.8) | 2.6% * (0.0;5.5%) | 65.4 (30.9;119.1) | 66.0 (31.3;121.0) | 1.7% (−1.8;5.0%) |
| 15–19 | 104 (56.0;171.3) | 105.9 (57.4;173.3) | 2.5% * (0.3;4.9%) | 82.6 (42.7;139.3) | 83.7 (42.9;140.4) | 0.3% (−2.1;2.5%) |
| African Region-Migraine | ||||||
| 5–9 | 62.6 (31.8;106.1) | 63.6 (32.1;107.5) | 7.0% (−7.1;24.9%) | 39.4 (18.7;69.2) | 40.0 (18.7;69.7) | 8.8% (−11.7;31.6%) |
| 10–14 | 381.4 (235.0;567.0) | 386.5 (239.0;583.0) | 5.8% (−1.5;13.7%) | 246.9 (150.8;368.0) | 248.5 (149.2;368.6) | 5.1% (−4.4;16.0%) |
| 15–19 | 736.3 (452.7;1114.0) | 739.4 (458.1;1116.3) | 5.2% * (0.2;10.7%) | 474.4 (290.1;706.8) | 474.3 (286.5;714.2) | 3.7% (−3.0;10.1%) |
| African Region-TTH | ||||||
| 5–9 | 20.7 (8.8;40.4) | 20.9 (8.8;41.1) | 6.7% (−2.5;16.7%) | 19.4 (8.1;38.4) | 19.6 (7.9;38.8) | 8.2% (−5.5;21.1%) |
| 10–14 | 73.9 (38.5;128.5) | 74.8 (38.5;130.6) | 5.7% (−2.1;13.8%) | 65.8 (32.6;117.4) | 66.2 (32.4;117.7) | 5.1% (−4.2;14.7%) |
| 15–19 | 109.5 (60.0;179.1) | 110.0 (59.8;179.0) | 5.3% (−1.3;12.0%) | 86.1 (45.1;143.4) | 86.2 (45.3;143.3) | 3.9% (−3.3;11.2%) |
| Eastern Mediterranean Region-Migraine | ||||||
| 5–9 | 97.2 (53.4;159.3) | 97.4 (53.0;160.3) | 5.5% (−11.7;25.7%) | 66.5 (35.1;111.4) | 66.8(34.8;110.8) | 2.4% (−19.5;28.3%) |
| 10–14 | 543.6 (335.0;806.4) | 539.1 (329.4;811.1) | 1.2% (−6.1;8.8%) | 385.4 (232.5;576.2) | 379.5 (228.8;562.3) | −1.5% (−19.5;28.3%) |
| 15–19 | 953.2 (585.2;1418.7) | 918.8 (562.4;1379.8) | −1.5% (−6.8;4.3%) | 661.2 (399.9;995.5) | 632.1 (385.8;953.7) | 3.6% (−8.5;1.9%) |
| Eastern Mediterranean Region-TTH | ||||||
| 5–9 | 21.3 (9.1;42.2) | 21.3 (9.3;41.4) | 5.4% (−8.8;20.0%) | 20.6 (8.1;40.0) | 20.4 (8.1;39.7) | 1.3% (−8.6;23.3%) |
| 10–14 | 73.1 (38.0;128.5) | 73.2 (37.7;128.0) | 2.5% (−5.8;11.8%) | 66.2 (31.6;120.0) | 66.2 (31.9;116.7) | 0.0% (−11.6;11.7%) |
| 15–19 | 111.5 (60.2;180.8) | 19.6 (59.7;178.8) | 0.5% (−7.7;8.5%) | 88.8 (47.2;145.6) | 87.4 (45.6;146.3) | −0.8% (−8.8;7.3%) |
| European Region-Migraine | ||||||
| 5–9 | 100.2 (53.5;165.6) | 101.7 (54.0;168.2) | 2.4% (−5.5;10.4%) | 54.3 (26.7;95.0) | 54.5 (27.0;93.5) | 2.5% (−9.5;15.8%) |
| 10–14 | 559.4 (342.7;828.1) | 568.0 (350.3;846.2) | 2.6% (−2.0;6.8%) | 309.7 (186.6;469.2) | 312.6 (187.9;471.5) | 1.7% (−3.2;6.9%) |
| 15–19 | 968.2 (602.7;1446.4) | 979.9 (610.0;1476.2) | 0.7% (−2.2;3.8%) | 518.5 (317.4;782.9) | 522.0 (315.5;791.4) | 1.2% (−2.7;4.9%) |
| European Region-TTH | ||||||
| 5–9 | 20.4 (8.7;39.5) | 20.6 (8.7;40.3) | 2.3% (−3.9;8.5%) | 21.2 (8.6;41.4) | 21.4 (8.7;42.4) | 2.9% (−3.9;11.0%) |
| 10–14 | 76.9 (40.6;131.6) | 76.7 (40.0;131.9) | 0.8% (−3.4;5.7%) | 68.6 (33.5;122.8) | 68.5 (33.0;123.6) | 0.7% (−4.0;5.5%) |
| 15–19 | 127.4 (70.4;204.9) | 123.6 (67.7;199.1) | −3.4% (−7.2;0.6%) | 88.2 (46.8145.9) | 85.5 (44.7;140.3) | −2.5% (−6.5;1.5%) |
| Region of the Americas-Migraine | ||||||
| 5–9 | 150.1 (83.0;243.2) | 150.7 (83.0;245.0) | 0.3% (−6.4;7.6%) | 79.2 (40.0;133.4) | 78.1 (39.4;132.0) | −0.9% (−9.9;9.2%) |
| 10–14 | 762.1 (465.2;1140.3) | 726.7 (470.0;1139.2) | −1.1% (−4.9;3.4%) | 417.5 (254.6;628.6) | 413.8 (250.0;624.2) | −1.4% (−6.3;4.0%) |
| 15–19 | 1070.4 (651.2;1604.7) | 1075.9 (654.0;1600.4) | 2.1% (−1.3;5.7%) | 575.0 (345.0;873.2) | 579.0 (350.4;878.3) | 1.6% (−2.2;5.8%) |
| Region of the Americas-TTH | ||||||
| 5–9 | 20.9 (8.7;41.2) | 20.9 (8.7;41.5) | 0.1% (−6.0;6.0%) | 20.7 (8.5;41.4) | 20.6 (8.3;40.9) | 0.2% (−6.7;7.4%) |
| 10–14 | 69.5 (34.1;124.2) | 69.8 (34.1;124.0) | −0.7% (−4.8;3.3%) | 64.0 (29.6;116.9) | 64.7 (29.8;117.2) | 0.5% (−3.9;5.4%) |
| 15–19 | 96.8 (51.3;160.1) | 96.5 (51.4;159.9) | 1.3% (−2.7;5.0%) | 80.7 (40.6;136.8) | 79.8 (40.4;135.3) | −0.2% (−3.9;3.8%) |
| South-East Asia Region-Migraine | ||||||
| 5–9 | 102.1 (51.3;172.9) | 102.1 (52.9;178.2) | 17.6% * (3.1;34.3%) | 58.6 (26.3;109.4) | 59.3 (26.9;108.1) | 23.0% * (6.6;43.0%) |
| 10–14 | 552.5 (334.0;826.9) | 552.8 (340.6;833.7) | 7.4% (−1.4;15.9%) | 340.7 (202.1;511.0) | 341.6 (202.1;518.0) | 6.6% (−2.9;16.9%) |
| 15–19 | 843.3 (514.8;1263.2) | 852.9 (517.8;1277.1) | 7.4% * (1.4;13.5%) | 557.8 (330.2;858.5) | 558.3 (331.1;858.3) | 1.8% (−3.8;7.8%) |
| South-East Asia Region-TTH | ||||||
| 5–9 | 23.3 (9.6;46.5) | 23.4 (9.6;46.3) | 18.1% * (10.7;25.9%) | 21.6 (8.8;43.3) | 21.6 (8.6;43.5) | 21.9% * (13.0;31.8%) |
| 10–14 | 79.6 (39.1;144.2) | 79.9 (39.9;144.9) | 7.6% * (2.8;12.9%) | 71.1 (32.9;131.0) | 71.3 (32.7;131.7) | 6.7% (−0.2;13.4%) |
| 15–19 | 113.5 (60.2;189.1) | 114.5 (60.4;191.0) | 7.2% * (2.6;12.3%) | 90.6 (46.2;156.0) | 90.8 (45.6;155.9) | 1.9% (−2.5;6.5%) |
| Western Pacific Region-Migraine | ||||||
| 5–9 | 52.5 (22.9;98.6) | 52.6 (22.7;97.3) | −2.1% (−13.6;10.7%) | 33.0 (14.4;61.3) | 32.2 (15.0;62.0) | −0.7% (−17.1;17.7%) |
| 10–14 | 300.3 (179.0;458.3) | 304.0 (183.2;465.6) | 0.6% (−4.4;6.1%) | 189.6 (111.8;291.3) | 192.9 (113.7;298.3) | 1.2% (−4.9;7.7%) |
| 15–19 | 486.3 (291.8;744.7) | 511.0 (304.7;708.1) | 3.9% (−0.2;8.5%) | 307.9 (185.1;467.0) | 328.4 (199.7;501.7) | 4.1% (−0.6;9.1%) |
| Western Pacific Region-TTH | ||||||
| 5–9 | 19.1 (7.9;38.0) | 19.2 (7.8;37.5) | −1.8% (−7.7;4.3%) | 16.7 (6.7;33.3) | 16.8 (6.8;34.1) | −0.8% (−8.5;6.5%) |
| 10–14 | 64.9 (31.4;118.4) | 64.9 (31.7;117.3) | −0.5% (−4.9%4.0%) | 56.1 (25.9;102.0) | 56.3 (26.3;102.5) | −0.1% (−4.8;5.0%) |
| 15–19 | 83.0 (43.3;138.9) | 83.3 (43.4;140.0) | −0.7% (−5.4;4.3%) | 68.9 (34.7;118.5) | 69.5 (118.6) | −1.7% (−6.2;3.2%) |
Publisher’s Note: MDPI stays neutral with regard to jurisdictional claims in published maps and institutional affiliations. |
© 2020 by the authors. Licensee MDPI, Basel, Switzerland. This article is an open access article distributed under the terms and conditions of the Creative Commons Attribution (CC BY) license (http://creativecommons.org/licenses/by/4.0/).
Share and Cite
Leonardi, M.; Grazzi, L.; D’Amico, D.; Martelletti, P.; Guastafierro, E.; Toppo, C.; Raggi, A. Global Burden of Headache Disorders in Children and Adolescents 2007–2017. Int. J. Environ. Res. Public Health 2021, 18, 250. https://0-doi-org.brum.beds.ac.uk/10.3390/ijerph18010250
Leonardi M, Grazzi L, D’Amico D, Martelletti P, Guastafierro E, Toppo C, Raggi A. Global Burden of Headache Disorders in Children and Adolescents 2007–2017. International Journal of Environmental Research and Public Health. 2021; 18(1):250. https://0-doi-org.brum.beds.ac.uk/10.3390/ijerph18010250
Chicago/Turabian StyleLeonardi, Matilde, Licia Grazzi, Domenico D’Amico, Paolo Martelletti, Erika Guastafierro, Claudia Toppo, and Alberto Raggi. 2021. "Global Burden of Headache Disorders in Children and Adolescents 2007–2017" International Journal of Environmental Research and Public Health 18, no. 1: 250. https://0-doi-org.brum.beds.ac.uk/10.3390/ijerph18010250