Article

PM2.5 and Trace Elements in Underground Shopping Districts in the Seoul Metropolitan Area, Korea

1
Indoor Environment and Noise Research Division, National Institute of Environmental Research, Incheon 22689, Korea
2
Department of Environmental Science, Hankuk University of Foreign Studies, Yongin, Gyeonggi 17035, Korea
*
Author to whom correspondence should be addressed.
Int. J. Environ. Res. Public Health 2021, 18(1), 297; https://0-doi-org.brum.beds.ac.uk/10.3390/ijerph18010297
Submission received: 1 December 2020 / Revised: 25 December 2020 / Accepted: 29 December 2020 / Published: 3 January 2021
(This article belongs to the Special Issue Outdoor and Indoor Air Quality)

Abstract

:
We measured PM2.5 in 41 underground shopping districts (USDs) in the Seoul metropolitan area from June to November 2017, and associated 18 trace elements to determine the sources and assess the respiratory risks. The PM2.5 concentrations were 18.0 ± 8.0 μg/m3 inside USDs, which were lower than 25.2 ± 10.6 μg/m3 outside. We identified five sources such as indoor miscellanea, soil dust, vehicle exhaust/cooking, coal combustion, and road/subway dust, using factor analysis. Almost 67% of the total trace element concentration resulted from soil dust. Soil dust contribution increased with the number of stores because of fugitive dust emissions due to an increase in passers-by. Vehicle exhaust/cooking contribution was higher when the entrances of the USDs were closed, whereas coal combustion contribution was higher when the entrances of the USDs were open. Although miscellanea and coal combustion contributions were 3.4% and 0.7%, respectively, among five elements with cancer risk, Cr and Ni were included in miscellanea, and Pb, Cd, and As were included in coal combustion. The excess cancer risk (ECR) was the highest at 67 × 10−6 for Cr, and the ECR for Pb was lower than 10−6, a goal of the United States Environmental Protection Agency for hazardous air pollutants.

1. Introduction

PM2.5 refers to particular matter (PM) having a diameter less than 2.5 μm. PM2.5 introduced in the human body through breathing may cause respiratory and cardiovascular diseases and even premature death by infiltrating the lungs, alveoli, and blood vessels [1]. Every 10 μg/m3 increase in short-term exposure to PM2.5 concentrations caused a 0.38% increase in mortality owing to respiratory and cardiovascular diseases [2,3]. In addition, PM2.5 acts as a medium that introduces toxic substances in the human body because it facilitates the binding of polycyclic aromatic hydrocarbons, trace elements, bacteria, and viruses to large surface areas with high absorptivity [4]. Water-soluble metals in PM are reported to increase cancer risks by causing oxidant damage to the DNA of human airway epithelial cells [5].
People living in cities spend approximately 80–90% of their time indoors in houses, schools, public transportation, and shopping malls, which increases their exposure to pollutants emitted from construction materials, home appliances, and electronic products [6,7]. The construction of subway stations and large buildings due to the development of large-scale downtown areas has boosted the need for efficient space utilization in Korea. Underground shopping districts (USDs) have been popular in the country since the 1970s; they are used for pedestrian traffic and as evacuation facilities. USDs are “public-use facilities” managed by the Ministry of Environment (MOE) since 1996 under the Indoor Air Quality Control Act [8]. The term “public-use facilities” refers to facilities used by the general public. Indoor air quality is currently managed for 10 pollutants: PM10, PM2.5, CO2, formaldehyde, total airborne bacteria, CO, NO2, radon, total volatile organic compounds (TVOC), and mold. As per the Korean indoor air quality standards for USDs, the 24 h average PM10 concentration should not exceed 100 μg/m3 (until 1999, this value was 250 μg/m3). Since 2018, the corresponding standard for PM2.5 is 50 μg/m3. Notably, different standards exist for indoor and outdoor air. The 24 h standards for outdoor air are 100 μg/m3 for PM10 and 35 μg/m3 for PM2.5 [9]; the PM2.5 standard was tightened from 50 μg/m3 in March 2018, reflecting public concern. The government has been making considerable efforts to manage PM pollution because it is designated as a Group 1 carcinogen by the International Agency for Research on Cancer, and the public is significantly affected by high PM concentrations.
Studies on indoor air pollution have typically focused on gaseous pollutants (e.g., VOCs, formaldehyde, and CO2 in department stores and large shopping malls) [10,11,12,13,14] and the sick building syndrome [15,16,17,18]. Research on indoor pollution sources, such as cooking and smoking, has also been consistently conducted, but the number of such studies is limited [19,20,21,22,23,24,25]. According to Karagulian et al. [26], approximately 200 studies are related to the estimation of atmospheric pollution sources, but few focus on indoor air pollution [27,28], reporting on the effects of indoor and outdoor sources for residences and schools. In addition, the health risks of trace elements have been investigated consistently since the 2000 s [29,30,31,32]. Despite very low concentrations, some elements such as As, Cd, Cr, and Pb pose high health risks [33,34,35]. However, research related to indoor sources of trace elements and their health risks is insufficient. Thus, in this study, we measured PM2.5 and associated trace elements in USDs in the Seoul metropolitan area (SMA), Korea (Figure 1), whose indoor air quality is managed by the government. We estimated sources of trace elements using factor analysis, and examined the effects of the outdoor emissions (vs. the generation within USDs) and anthropogenic emissions (vs. crustal origin). Finally, we attempted to assess the excess cancer risk (ECR) caused by respiratory exposure to selected elements in USDs.

2. Experimental Method
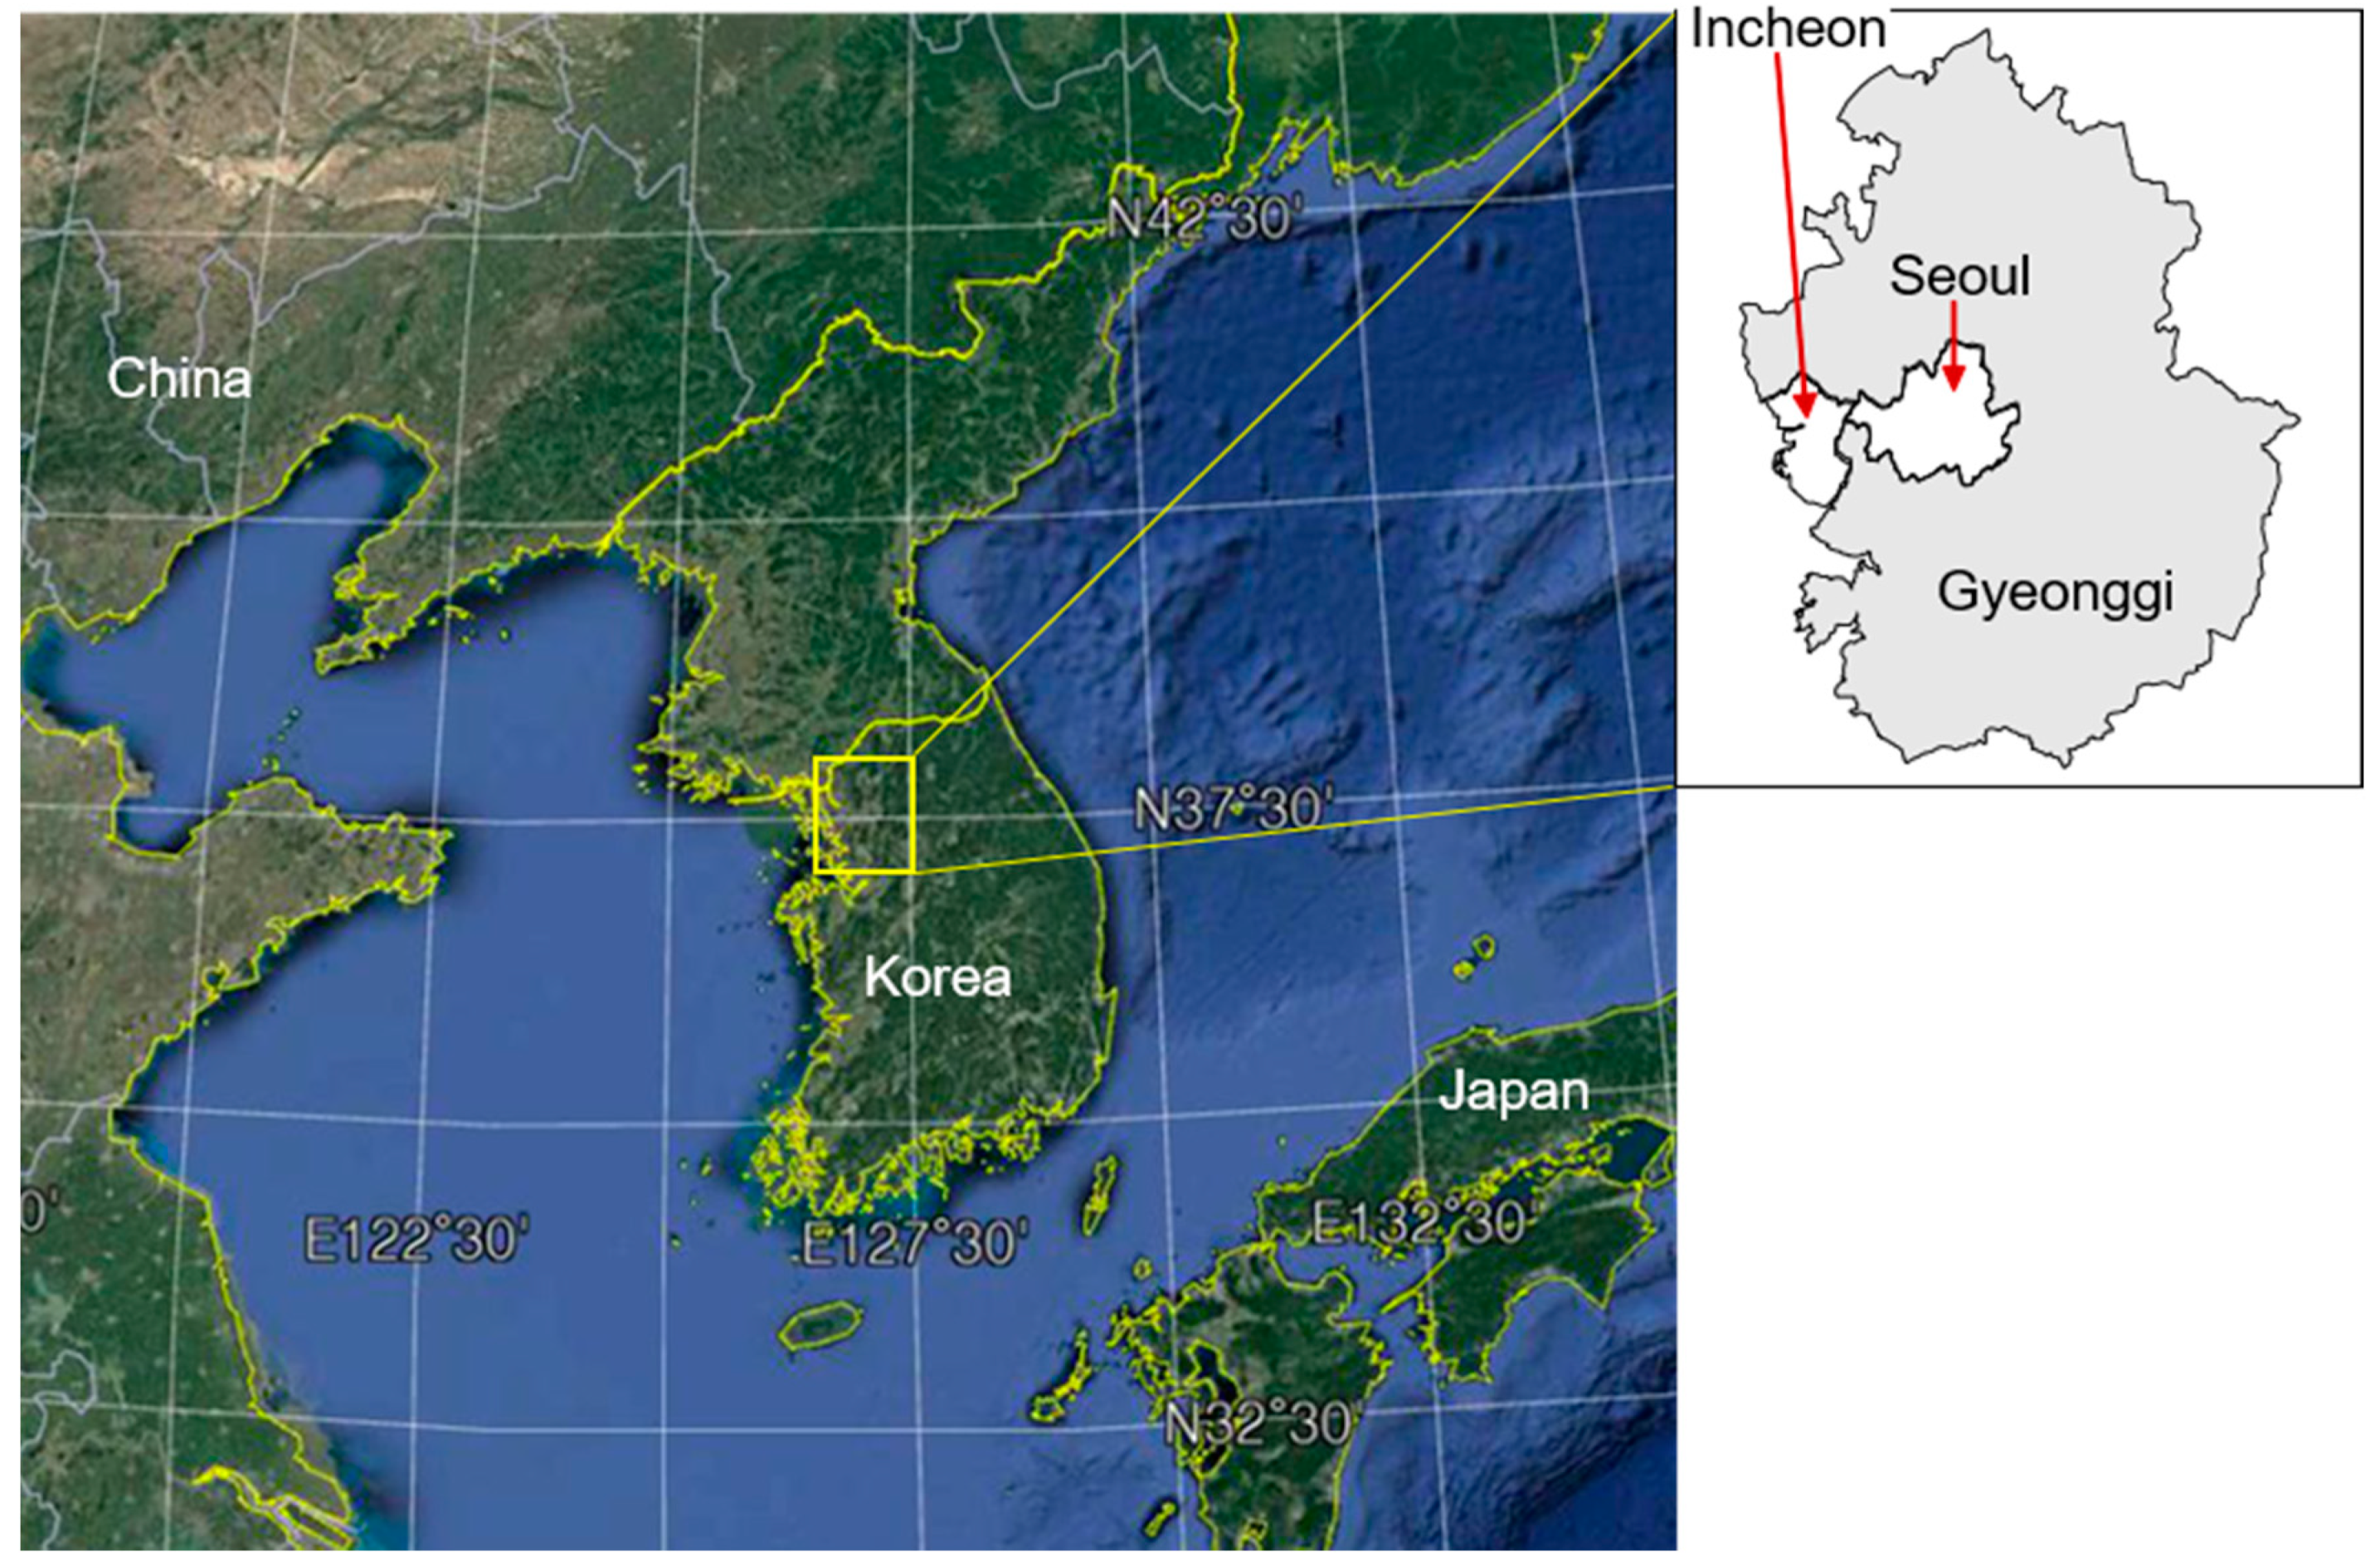
2.1. Study Sites

The SMA in the northwestern part of Korea includes Seoul proper, Incheon, and Gyeonggi (Figure 1). According to the Korean Statistical Information Service, as of 2018, the populations of Seoul, Incheon, and Gyeonggi were 9,673,936, 2,936,117, and 13,103,188, respectively, with a total country population of 51,629,512 [36]. Thus, approximately 50% of the total population was concentrated in SMA. Accordingly, a larger number of public-use facilities are also located in SMA. Among 64 USDs managed by the MOE, 42 (25 in Seoul, 15 in Incheon, and 2 in Gyeonggi) are located in SMA. The area of each USD ranges from 777 to 31,566 m2, with the corresponding years of construction spanning from 1967 to 2009. Depending on the facility size, there are 15 to 624 stores in each USD. We divided USDs into “open,” “semi-open,” and “closed” types, based on the style of entrances. The majority of the stores (approximately 76%) sold sundry goods such as clothes, shoes, or bags, followed by cellphone stores (6%), cosmetics (5%), snack bars (3%), and nail shops (3%). We also divided USDs into “open,” “mixed,” and “closed,” depending on the entrance type between the stores and the passageways. For closed-type facilities, stores are separated from the passageway, whereas for the open-type facilities, stores are connected directly to a passageway and have no entrance. Mixed-type facilities have stores with and without entrances to the passageways. Of the 42 USDs, 23 were connected to subway underground stations.

2.2. PM2.5 Sampling

As the entrance, store type, areas, and number of passers-by differ considerably across the USDs, we determined the number of sampling points according to the standard methods for indoor air quality specified by the National Institute of Environmental Research, Korea [37]. The number of sampling points was two for an area smaller than 10,000 m2, three for an area between 10,000 and 20,000 m2, and four for an area larger than 20,000 m2. We sampled outdoor air at one point near the entrance of each USD. The sampling period spanned from June to November 2017, and sampling was performed on three consecutive days for each USD. One of the 42 USDs was excluded from sampling due to extensive renovations.
We performed sampling for 24 h at a flow rate of 5 L/min using a mini-volume air sampler (TAS, Airmetrics, Springfield, OR, USA) equipped with a two-stage particle size separation device. Particles less than 2.5 μm were collected on the filter, the coating film on the surface of the first impactor separated particles larger than 10 μm, and those larger than 2.5 μm were separated by the second impactor. We applied a thick coat of suspending solution prepared by dissolving grease in 30 mL of hexane to the impactor surface for efficient attachment of particles. A ZeflourTM Teflon filter (Pall Corp., Port Washington, NY, USA, pore size: 2.0 μm, diameter: 47 mm) was used for sampling.

2.3. Determination of PM2.5 and Trace Element Concentrations

We determined the PM2.5 concentration by weighing the filter using an electronic balance (Sartorius M2P, Goettingen, Germany) capable of measuring to 0.001 mg after conditioning the filter in a desiccator for 24 h. We repeated the weighing at least three times and used the mean values. Filters with the collected samples were stored at −20 °C to prevent volatilization.
We analyzed 18 trace elements (As, Ba, Ag, Sr, V, Cr, Mn, Fe, Co, Ni, Cu, Zn, Pb, Cd, Si, Al, Se, and Ti) according to the United States Environmental Protection Agency (US EPA) Compendium Method IO−3.5 [38]. 18 trace elements were carefully selected based on previous studies which identified various sources using those markers in PM2.5 [26,27,28]. A Teflon filter was placed in a Teflon vessel with a diameter of 3.5 cm, and the cap was closed after adding 15 mL of 5% HNO3. The vessel was placed in a microwave oven (MARS Xpress, CEM, USA), and the temperature was increased from 25 to 200 °C at a rate of 10 °C/min, and maintained for 20 min. The eluate was filtered, transferred to a 15 mL tube, and analyzed using inductively coupled plasma-mass spectrometry (NexION 300D, PerkinElmer, Waltham, MA, USA). The analysis gas was 99.99% pure Ar, and the elements were detected with a quadrupole ion deflector equipped with a triple cone interface. The dynamic reaction cell (DRC-e) function was used for some elements, where ammonia gas was injected into the spray chamber before passing through the plasma to reduce the interference effect of elements with similar masses. Multi-Element Calibration Standard 3 and 5 (PerkinElmer, Waltham, MA, USA) were used for standard solutions. The following are the method detection limits for each element (μg/L): As (0.006), Ba (0.054), Ag (0.004), Sr (0.020), V (0.001), Cr (0.026), Mn (0.002), Fe (0.225), Co (0.005), Ni (0.013), Cu (0.010), Zn (0.311), Pb (0.001), Cd (0.003), Si (2.331), Al (0.860), Se (0.035), and Ti (1.172).

2.4. Data Analysis

PM2.5 is largely composed of inorganic ions, carbonaceous materials, and trace elements. While most inorganic ions are secondarily produced and carbonaceous materials originate from combustion sources, trace elements are generated from a variety of natural and anthropogenic sources [39,40,41]. Thus, they have been used to estimate a wide range of PM2.5 sources, which is advantageous for investigating the effects of harmful sources, as a significant portion of PM2.5 risk is caused by trace elements [42,43,44]. In this study, we conducted a varimax rotated factor analysis for the sum of trace element concentrations, which was regarded as a surrogate of the PM2.5 concentration, using SPSS for Windows 20.0 (IBM, Armonk, NY, USA). We analyzed 41 samples for 18 elements, which exceeds the minimum number of samples (n) suggested by Henry et al. as follows: n > 30 + (V + 3)/2 = 40.5, where V is the number of variables (elements in this study) [45].
We used the enrichment factor (EF) to distinguish anthropogenic influence from crustal origin [42,43,46,47]. Using Si, a representative element of the Earth’s crust, we calculated the EF using the relative ratio of an individual trace element to Si in PM2.5 to that in the Earth’s crust as follows:
EF = (X/Si)PM/(X/Si)crust
where X and Si denote the concentrations of the trace element and Si, respectively, and the subscripts PM and crust denote PM2.5 and the Earth’s crust, respectively [2,39]. The values provided in Taylor were used for determining the trace element concentrations in the Earth’s crust [48]. If EF is close to 1, the element is considered to be of crustal origin. EF becomes greater than 1 when X is greater than the crustal origin concentration because of anthropogenic influence. Here, we assumed that Si was not emitted from anthropogenic sources.
As trace elements contained in PM may cause cancer when introduced into the human body through respiration, ECR was assessed using the following equation:
ECR = Xecr × (toxicity value)
where Xecr denotes the 95th percentile concentration of the element [49]. The inhalation value provided by the Integrated Risk Information System (IRIS) [50] was used for the toxicity value. For Cr, ECR was calculated using the Cr(VI) concentration, which exhibits a high risk among all Cr concentrations, as Cr/7 because Cr(III) and Cr(VI) typically occur in a 6:1 ratio [51]. For Pb, we used the value provided by the Office of Environmental Health Hazard Assessment, California Environmental Protection Agency, because no quantitative risk was presented by IRIS [52].

3. Results and Discussion

3.1. PM2.5 and Trace Element Concentrations in Indoor and Outdoor Air

Table 1 shows the mean concentrations of PM2.5 and trace elements in indoor and outdoor air measured at the 41 USDs. The mean indoor PM2.5 concentration is 18.0 μg/m3, which is lower than the 24-h average standard mandated by the Indoor Air Quality Control Act (50 μg/m3). Furthermore, all the indoor PM2.5 concentrations measured at the 41 USDs complied with the standard. However, the mean outdoor PM2.5 concentration is 25.2 μg/m3, but approximately 20% (8 of 41 USDs) was exceeded the 24-h average standard for outdoor air (35 μg/m3 at the time of measurement). This shows that indoor PM2.5 concentrations in the USDs met the standard even with outdoor air quality being exceeded on multiple days. An indoor air quality study of USDs in Korea also reported that PM concentrations typically met the standard because indoor air quality was managed with air-conditioning using pre- and medium filters that facilitated the control of PM [53]. Yu et al. suggested that it is essential to provide air circulation (i.e., replace indoor polluted air with fresh air) in underground buildings because the indoor air is of lower quality compared to the indoor air quality of buildings at ground level [54].
The indoor-to-outdoor (I/O) ratio for PM2.5 concentration was calculated to be 0.76. Hu and Li measured PM2.5 at various points in shopping malls and reported that the I/O ratio ranged from 0.46 to 0.52, which is less than the values in Table 1 [55]. However, they observed outdoor PM concentrations of approximately 300 μg/m3, which is significantly greater than the concentrations observed in this study. However, Klinmalee et al. reported a PM2.5 I/O ratio of 1.5 for a department store, indicating a strong indoor source associated with the crowded conditions, despite a busy traffic outside [56]. Jones et al. measured PM concentrations in houses located close to roads and found that the I/O ratio was 1.0 ± 1.3, a value comparable to our results [57].
Trace elements accounted for 13.6% of indoor PM2.5 and 10.8% of outdoor PM2.5 concentrations. Ti was detected in the highest concentrations in both indoor and outdoor air, followed by Fe, Si, Zn, and Al. Ti accounted for approximately 50% of the total trace element concentrations. The sum of the top five elements (Ti, Fe, Si, Zn, and Al) was found to be approximately 90% of the total trace element amount. The sum of As, Cd, Cr, Ni, and Pb, all of which present high cancer risks, was 0.25% and 0.20% of the indoor and outdoor PM2.5 concentrations, respectively. These values are greater than those reported in the United States but less than those measured in Europe [34,35,58].

3.2. Trace Element Sources

The results from a varimax rotated factor analysis are summarized in Table 2. We identified five factors with eigenvalues greater than 1, explaining 83.8% of the total variance. Prior to specifying the source for each factor, we examined the characteristics of each factor using the correlation between indoor and outdoor concentrations, I/O ratio, and EF in Table 3. We used the concentration sum of the marker elements with high loading in Table 2 for the concentration of each factor by assuming that the marker elements only exist in that factor. For outdoor concentrations, we used the sum of all 18 element concentrations to calculate the correlation coefficient, while we used the sum of the marker element concentrations to calculate the I/O ratio. We used geometric means to calculate the EFs listed in Table 1 for factors because element EFs differ by orders of magnitude.
In Table 3, factor 1 has the lowest correlation with outdoor air (albeit a higher p-value than that of a statistical significance), and the I/O ratio is greater than 1. This implies that the indoor concentrations were higher than the outdoor concentrations, and mainly varied with the influences of indoor sources. Additionally, EF is the second highest after factor 4, indicating that the associated elements were largely enriched by anthropogenic sources. In addition to outdoor air, factors 2 and 4 exhibit lower correlations with factors 1, which have the first and second highest correlations with the outdoor air, respectively. The highest correlation of factor 2 with the outdoor air was because the variations in the element concentrations of factor 2 were closely related to those of the outdoor air. However, the lowest I/O ratio and highest EF for factor 4 suggests that the outdoor concentrations became higher than the indoor concentrations mainly due to anthropogenic influences. For factors 2 and 5, EFs are low and the I/O ratios are close to 1. Elements associated with these factors were mostly of crustal origin, and were ubiquitous in both indoor and outdoor air.
Factor 1 has high loadings for Cu, Cr, Se, Ni, Mn, and Ag, and accounts for 28% of the total variance. Considering the higher I/O ratios for elements such as Ag and Ni, and larger EF values for elements such as Se and Ag (Table 1), strong effects of anthropogenic indoor sources shown by factor 1 in Table 3 are plausible. As the number of marker elements is large, various sources can be considered. For example, we can consider soil dust as a source of Mn, and coal combustion for Se [2,59,60,61]. According to an extensive review conducted by Chow, Cr, Ni, and Mn are related to vehicle exhaust, and Cu and Ag are released from incinerators [39]. However, these sources are not specific to outdoor settings. Since all elements are metals, they are commonly used in the manufacturing of electric devices, cooking appliances, plastics, and jewelry, and used for pigments, painting, electroplating, and cosmetics [25,28,32]. Considering the nature of USDs, these elements appear to be associated with stores that stock and sell aforementioned types of manufactured products. These elements, except for Ag, are also found in cigarette smoke [62,63,64]. Cigarette smoke is likely a major source because its effects are more significant indoors than outdoors.
Factor 2 is heavily loaded with Sr, Si, and Ti, and exhibits 19% of the total variance. Ti and Si are representative crust constituents along with Al, Ca, Fe, and Mn [2,39,48,65,66]. In East Asia, concentrations of these elements are high during the Asian dust period [67,68,69]. In Table 1, Sr has the lowest EF except for Si and Al, indicating a representative crustal element. Despite contributing a small fraction, Sr is found in bare land, roadways, agricultural fields, construction sites, and deteriorated building materials [27,39,42,70]. In Table 3, the I/O ratio for factor 2 is 0.96, showing minimal differences between indoor and outdoor concentrations. We assume a significant amount of fugitive dust indoors as well as outdoors due to the large number of passers-by.
Factor 3 is responsible for 14% of the total variance, and is heavily loaded with Co, Zn, and V. Zn is widely used as a marker for vehicle exhaust and V originates from oil combustion [39,71,72,73,74]. Co is also associated with residual oil and fossil fuel combustion [39,75,76]. Because oil is not used as fuel in USDs, oil combustion as well as vehicle exhaust is not considered as an indoor source. However, Table 3 reveals that factor 3 has the second lowest correlation with outdoor air following factor 1. Among all factors, albeit lower than that with factor 4, factor 3 is highly correlated with factor 1, which shows a strong indoor influence. The fractions of Co, Zn, and V in gas combustion emissions were higher than those in other combustion emissions; therefore, the gas combustion can be considered a source of these elements [40,77]. These elements are presumed to be emitted from metals in the boiler and its associated ducting rather than from the fuel itself. Zn is also reported to be released during cooking with gas stoves [78,79,80,81]. However, in Table 3, unlike factor 1, the I/O ratio for factor 3, which is slightly lower than 1, indicates that the effects of the outdoor sources are larger than those of the indoor sources.
Factor 4 is responsible for 12% of the total variance. It shows high loadings for As, Pb, and Cd. As mentioned earlier, factor 4 represents anthropogenic outdoor sources, whereas factor 1 represents anthropogenic indoor sources. In addition, considering a high correlation with factor 3, we can consider a combustion-related source for factor 4. Since V and Ni, which are related to oil combustion [2,39,82,83] are excluded, factor 4 is likely to be associated with coal combustion [60,70,71,84,85]. In Korea, As, Pb, and Se are used as tracers of coal combustion emissions [61,86,87], and are presumed to result from long-range transport from China where a large amount of coal is consumed [88,89,90,91]. This suggests why factor 4 is the least correlated with factor 1 in Table 3. It is worth noting that all the elements in factor 4 have high carcinogenic risk and were used to calculate the ECR in this study.
Finally, factor 5 shows high loadings for Ba, Fe, and Al and accounts for 11% of the total variance. In Table 1, Fe and Al are classified as crustal elements because of their low EFs. Thus, the characteristics of factor 5 are similar to those of factor 2, but the correlation with the outdoor air is less than that for factor 2. Ba is used in brake pads, tire wear, and lubrication oil and is emitted as vehicle exhaust; hence, it is often found in road dust [11,92,93,94]. Fe is also found in road dust because it is a crustal element; however, Fe is especially high in subways because it is generated by friction and wear in the braking and supply of electricity to subway trains [95,96,97,98]. Despite the high proportion of crust elements, the correlation of factor 5 with outdoor air is lower, presumably because of dust generated in the subway system.

3.3. Contribution of Trace Element Sources by USD Environmental Factor

Table 4 shows PM2.5 concentrations and contributions of trace element sources according to the USD environmental factor. Because the PM2.5 I/O ratio in Table 1 was 0.76 (overall ratio in Table 4), most I/O ratios for PM2.5 are less than 1.0 regardless of the environmental factor. The I/O ratio only approaches 1 when the USD entrance is open and ventilation is prevalent (Table 4c). As the entrance changes to semi-open and closed, the I/O ratio decreases to 0.82 and 0.68, respectively. Overall, the contribution of soil dust is the largest at 67%, that of road/subway dust is 24%, with a combined contribution of approximately 90% (Table 4a). However, coal combustion and miscellanea, which contain harmful elements, contribute only 0.7% and 3.4%, respectively. The contribution of coal combustion composed of elements with high carcinogenic risk is highest in Seoul, followed by Incheon and then Gyeonggi. However, the concentration of coal combustion is the highest in Incheon because the total element concentration is high (Table 4b). Incheon experiences significant amounts of dust because of its proximity to the port and China, and because a large coal-fired power plant is located approximately 30 km southwest [99,100]. This causes high concentrations of coal combustion elements even indoors.
The element concentration in Incheon due to indoor miscellanea is twice that of Seoul, but with similar contributions of 3.7% and 3.3% as the element concentration mainly varies with the total concentration. The concentration due to miscellanea increases with the number of stores, but the greatest contribution occurs when the number of stores is 100–199 because the increase in total concentration is larger (Table 4e). The effect of the number of stores is most distinct in soil dust, which accounts for a large portion of the total concentration. As the number of stores increases, both absolute concentration and contribution increase, which is likely due to the increased number of passers-by. The effect on the contribution is most pronounced in the type of stores (Table 4d). As the type of stores changes from open to mix and closed, the contribution of most sources decreases, while soil dust contribution increases. If the stores are closed, the passage area volume in the USD is reduced, which causes the same amount of generated soil dust to have an increased contribution. When the stores are closed, the contribution of miscellanea decreases, but the concentration increases. This phenomenon can result either from the decrease in the volume of the passage area as in soil dust, or from emissions occurring mainly outside the store and not inside. The emissions from miscellanea occur during stocking and handling of various goods. Another significant source of miscellanea includes smoking. If smoking mainly occurs outside the store, the concentration may increase when the stores are closed. However, even taking this into account, the effect of volume reduction of the passage area is presumed to have a greater impact. We confirm this by observing decreases in vehicle exhaust/cooking and road/subway dust contributions, comprising both indoor and outdoor emissions, as well as in miscellanea.
The effects of indoor and outdoor emissions are more easily distinguished by examining the variation based on USD exit type (Table 4c). In contrast to miscellanea and soil dust, whose variations are unclear, the contributions of vehicle exhaust/cooking and coal combustion increase and decrease, respectively, when the USD exit is closed. This demonstrates that indoor emissions are more impacted by vehicles exhaust/cooking, whereas outdoor emissions are impacted by coal combustion. The effect of road/subway dust is most evident in Table 4f when comparing if a USD is connected to the subway. When connected to the subway, the concentrations by most sources except miscellanea decrease because of the increase in the volume of the passage area, but the concentration of road/subway dust increases by 1.7 times and the contribution increases by more than 10%.

3.4. Excess Cancer Risk (ECR)

We calculated the ECR through respiration using the 95th percentile concentrations and toxicity values for five elements with carcinogenic risk, as shown in Table 5. The carcinogenic risk caused by inhaling the elements was greatest in Cr followed by As, Cd, Ni, and Pb. We suggest in Section 3.2 that As, Cd, and Pb result from coal combustion, and Cr and Ni result from indoor miscellanea. The concentrations of Cr and Ni from indoor miscellanea are high indoors, whereas those of As and Cd from coal combustion are high outdoors. Pb has an outdoor air quality standard of 5 μg/m3 per year in Korea. Despite using the 95th percentile, the concentration in Table 5 is 0.7% of the standard.
The ECR is 0.3–67 indoors and 0.4–60 outdoors per million people. The US EPA sets a goal for ECR of 10−6 and 10−4 based on the maximum concentration near the pollutant source (1 and 100 persons per million, respectively) [101]. However, Table 5 shows that the ECR for Pb is less than 10−6, and even the highest ECR for Cr is less than 10−4. In Korea, ECRs were investigated only for the outdoors. ECRs for Cr, As, and Cd in Seoul were 25–54 per million people [102], which are comparable to those listed in Table 5. ECRs for Cd, Cr, and Ni in Ulsan were 8.4–35 per million people, which do not exceed those listed in Table 5, even though the study area is industrial [51].

4. Summary and Conclusions

We investigated the characteristics of PM2.5 and trace elements in underground shopping districts (USDs) located in the Seoul metropolitan area. We estimated their sources and assessed the cancer risk from respiratory exposure of these trace elements for workers and users in USDs.
PM2.5 concentrations in 41 USDs did not exceed the standard established by the Indoor Air Quality Control Act. The PM2.5 I/O ratio was 0.76, indicating that the indoor concentration was lower than the outdoor value. Among the PM2.5 trace elements, Ti, a substance originating from the Earth’s crust, exhibited the highest concentration, followed by Fe, Si, and Zn. Using a varimax rotated factor analysis, we identified five sources for the elements: indoor miscellanea, soil dust, vehicle exhaust/cooking, coal combustion, and road/subway dust. The overall contribution of miscellanea, which has a strong effect on indoor sources, was 3%, whereas that of soil dust, which is of crustal origin, was 67%. Vehicle exhaust/cooking and road/subway dust are composed of both outdoor (vehicle exhaust, road dust) and indoor (cooking, subway dust) sources. Higher contribution of vehicle exhaust/cooking when the USD entrance was closed indicated a larger effect of indoor emissions. However, we determined that road/subway dust concentration and contribution were greater when the USD was connected to the subway. The contribution of coal combustion is higher in Incheon, which is near the border with China as well as large-scale coal-fired power plants. Coal combustion contributions increased when the USD entrance was changed from closed to semi-open and open. Both implied that the effects of outdoor emissions are larger for coal combustion. The effects of indoor and outdoor emissions were almost the same for soil dust, but the increase in the contribution to the number of stores was evident, presumably due to the increase in fugitive emissions with an increase in the number of passers-by.
The influence of anthropogenic emissions that were investigated using the enrichment factor was higher for miscellanea and coal combustion. Among the elements having carcinogenic risk, Cr and Ni were included in miscellanea, and Pb, Cd, and As were included in coal combustion. The excess cancer risk (ECR) using the 95th percentile concentration was the highest at 67 × 10−6 for Cr, but less than 10−4, and the ECR for Pb was lower than 10−6. In Korea, ECRs were estimated outdoors in Seoul and Ulsan (an industrial area), which were comparable to and support the study results.

Author Contributions

Conceptualization, I.-K.S.; methodology, validation, and formal analysis, S.R.W., H.A.J. and Y.L.; writing—original draft, S.R.W.; writing—review and editing, J.K., J.L. and Y.S.G.; supervision and validation, Y.S.G. All authors have read and agreed to the published version of the manuscript.

Funding

This study was supported by the National Institute of Environmental Research funded by the Ministry of Environment (NIER-2017-01-01-181). Y.S.G. was supported by the Hankuk University of Foreign Studies Research Fund.

Institutional Review Board Statement

Not applicable.

Informed Consent Statement

Not applicable.

Conflicts of Interest

The authors declare no conflict of interest.

References

  1. US Environmental Protection Agency. Risk Assessment to Support the Review of the PM Primary National Ambient Air Quality Standard (External Review Draft EPA 452-P-09-006); Office of Air Quality Planning and Standards, Health and Environmental Impacts Division, Ambient Standards Group, Research Triangle Park: Durham, NC, USA, 2009.
  2. Laden, F.; Neas, L.M.; Dockery, D.W.; Schwartz, J. Association of fine particulate matter from different sources with daily mortality in six U.S. cities. Environ. Health Perspect 2000, 108, 941–947. [Google Scholar] [CrossRef]
  3. Shang, Y.; Sun, Z.; Cao, J.; Wang, X.; Zhong, L.; Bi, X.; Li, H.; Liu, W.; Zhu, T.; Huang, W. Systematic review of Chinese studies of short-term exposure to air pollution and daily mortality. Environ. Int. 2013, 54, 100–111. [Google Scholar] [CrossRef] [PubMed]
  4. Li, Q.; Liu, H.; Alattar, M.; Jiang, S.; Han, J.; Ma, Y.; Jiang, C. The preferential accumulation of heavy metals in different tissues following frequent respiratory exposure to PM2.5 in rats. Sci. Rep. 2015, 5, 1–8. [Google Scholar] [CrossRef] [PubMed] [Green Version]
  5. Prahalad, A.K.; Inmon, J.; Dailey, L.A.; Madden, M.C.; Ghio, A.J.; Gallagher, J.E. Air pollution particles mediated oxidative DNA base damage in a cell free system and in human airway epithelial cells in relation to particulate metal content and bioreactivity. Chem. Res. Toxicol. 2001, 14, 879–887. [Google Scholar] [CrossRef] [PubMed]
  6. Tham, K.W. Indoor air quality and its effects on humans–A review of challenges and developments in the last 30 years. Energy Build. 2016, 130, 637–650. [Google Scholar] [CrossRef]
  7. Yang, W.; Lee, K.; Yoon, C.; Yu, S.; Park, K.; Choi, W. Determinants of residential indoor and transportation activity times in Korea. J. Expo. Sci. Environ. Epidemiol. 2011, 21, 310–316. [Google Scholar] [CrossRef] [Green Version]
  8. Korea Ministry of Environment. Indoor Air Quality Control Act. Available online: http://law.go.kr/LSW/eng/engLsSc.do?menuId=2&section=lawNm&query=Indoor+air+quality&x=27&y=50#liBgcolor2 (accessed on 13 April 2020).
  9. Korea Ministry of Environment, Enforcement Decree of the Framework Act on Environmental Policy–Article 2 (Environmental Standards). Available online: http://www.law.go.kr/engLsSc.do?menuId=1&subMenuId=21&query=%ED%99%98%EA%B2%BD%EC%A0%95%EC%B1%85%EA%B8%B0%EB%B3%B8#EJ2:0 (accessed on 13 April 2020).
  10. Lee, C.M.; Kim, Y.S.; Nagajyoti, P.C.; Park, W.; Kim, K.Y. Pattern classification of volatile organic compounds in various indoor environments. Water Air Soil Pollut. 2011, 215, 329–338. [Google Scholar] [CrossRef]
  11. Li, J.; Xie, C.J.; Yan, L.S.; Cai, J.; Xie, P. Carbonyl levels and personal exposures in large shopping malls of Nanchang, China. Anal. Lett. 2013, 46, 1025–1043. [Google Scholar] [CrossRef]
  12. Tang, J.; Chan, C.Y.; Wang, X.; Chan, L.Y.; Sheng, G.; Fu, J. Volatile organic compounds in a multi-storey shopping mall in Guangzhou, South China. Atmos. Environ. 2005, 39, 7374–7383. [Google Scholar] [CrossRef]
  13. Tao, H.; Fan, Y.; Li, X.; Zhang, Z.; Hou, W. Investigation of formaldehyde and TVOC in underground malls in Xi’an, China: Concentrations, sources, and affecting factors. Build. Environ. 2015, 85, 85–93. [Google Scholar] [CrossRef]
  14. Wen, Y.; Lian, Z.; Lan, L. Investigation of indoor/outdoor air pollutants at the shopping malls in Wuhan. Int. J. Environ. Pollut. 2011, 45, 268–280. [Google Scholar] [CrossRef]
  15. Kostiainen, R. Volatile organic compounds in the indoor air of normal and sick houses. Atmos. Environ. 1994, 29, 693–702. [Google Scholar] [CrossRef]
  16. Lim, S.; Lee, K.; Seo, S.; Jang, S. Impact of regulation on indoor volatile organic compounds in new unoccupied apartment in Korea. Atmos. Environ. 2011, 45, 1994–2000. [Google Scholar] [CrossRef]
  17. Park, J.S.; Ikeda, K. Variations of formaldehyde and VOC levels during 3 years in new and older homes. Indoor Air 2006, 16, 129–135. [Google Scholar] [CrossRef] [PubMed]
  18. Runeson, R.; Wahlstedt, K.; Wieslander, G.; Norbäck, D. Personal and psychosocial factors and symptoms compatible with sick building syndrome in the Swedish workforce. Indoor Air 2006, 16, 445–453. [Google Scholar] [CrossRef] [PubMed]
  19. Abdullahi, K.L.; Delgado-Saborit, J.M.; Harrison, R.M. Emissions and indoor concentrations of particulate matter and its specific chemical components from cooking: A review. Atmos. Environ. 2013, 71, 260–294. [Google Scholar] [CrossRef]
  20. Bindu, E.S.H.; Reddy, M.V. Indoor air quality in commercial kitchens. Int. J. Sci. Res. 2016, 5, 1337–1340. [Google Scholar]
  21. Cenko, C.; Pisaniello, D.; Esterman, A. A study of environmental tobacco smoke in South Australian pubs, clubs, and cafes. Int. J. Environ. Health Res. 2014, 14, 3–11. [Google Scholar] [CrossRef]
  22. He, C.; Morawska, L.; Hitchins, J.; Gilber, D. Contribution from indoor sources to particle number and mass concentrations in residential houses. Atmos. Environ. 2004, 38, 3405–3415. [Google Scholar] [CrossRef]
  23. Johnsson, T.; Tuomi, T.; Riuttala, H.; Hyvarinen, M.; Rothberg, M.; Reijula, K. Environmental tobacco smoke in Finnish restaurants and bars before and after smoking restrictions were introduced. Ann. Occup. Hyg. 2006, 50, 331–341. [Google Scholar]
  24. Waring, M.S.; Siegel, J.A. An evaluation of the indoor air quality in bars before and after a smoking ban in Austin, Texas. J. Expo. Sci. Environ. Epidemiol. 2007, 17, 260–268. [Google Scholar] [CrossRef] [PubMed] [Green Version]
  25. Zhao, Y.; Liu, L.; Tao, P.; Zhang, B.; Huan, C.; Zhang, X.; Wang, M. Review of effluents and health effects of cooking and the performance of kitchen ventilation. Aerosol Air Qual. Res. 2019, 19, 1937–1959. [Google Scholar] [CrossRef]
  26. Karagulian, F.; Belis, C.A.; Dora, C.F.C.; Prüss-Ustün, A.; Bonjour, S.; Adair-Rohani, H.; Amann, M. Contributions to cities’ ambient particulate matter (PM): A systematic review of local source contributions at global level. Atmos. Environ. 2015, 120, 475–483. [Google Scholar] [CrossRef]
  27. Amato, F.; Rivas, I.; Viana, M.; Moreno, T.; Bouso, L.; Rechen, C.; Alvarez-Pedrerol, M.; Alastuey, A.; Sunyer, J.; Querol, X. Sources of indoor and outdoor PM2.5 concentrations in primary schools. Sci. Total. Environ. 2014, 490, 757–765. [Google Scholar] [CrossRef] [PubMed]
  28. Yli-Tuomi, T.; Lanki, T.; Hoek, G.; Brunekreef, B.; Pekkanen, J. Determination of the sources of indoor PM2.5 in Amsterdam and Helsinki. Environ. Sci. Technol. 2008, 42, 4440–4446. [Google Scholar] [CrossRef] [PubMed]
  29. Jaishankar, M.; Tseten, T.; Anbalagan, N.; Mathew, B.B.; Beeregowda, K.N. Toxicity, mechanism and health effects of some heavy metals. Interdiscip. Toxicol. 2014, 7, 60–72. [Google Scholar] [CrossRef] [Green Version]
  30. Kampa, M.; Castanas, E. Human health effects of air pollution. Environ. Pollut. 2008, 151, 362–367. [Google Scholar] [CrossRef]
  31. Mahurpawar, M. Effects of heavy metals on human health: Social issues and environmental problems. Int. J. Res. Granthalaaya. 2015, 3, 1–7. [Google Scholar]
  32. Martin, S.; Griswold, W. Human health effects of heavy metals. Environ. Sci. Technol. Briefs Citiz. 2009, 15, 1–6. [Google Scholar]
  33. Liang, C.-S.; Duan, F.-K.; He, K.-B.; Ma, Y.-L. Review on recent progress in observations, source identifications and countermeasures of PM2.5. Environ. Int. 2016, 86, 150–170. [Google Scholar] [CrossRef]
  34. Greene, N.A.; Morris, V.R. Assessment of public health risks associated with atmospheric exposure to PM2.5 in Washington, DC, USA. Int. Environ. Res. Public Health 2006, 3, 86–97. [Google Scholar] [CrossRef] [PubMed]
  35. Sánchez-Soberón, F.; Rovira, J.; Mari, M.; Sierra, J.; Nadal, M.; Domingo, J.L.; Schuhmacher, M. Main components and human health risks assessment of PM10, PM2.5, and PM1 in two areas influenced by cement plants. Atmos. Environ. 2015, 120, 109–116. [Google Scholar]
  36. Korean Statistical Information Service. Population/Household, Population Census, Population Sector, Population, Household and Housing Units, Total Population. Available online: http://kosis.kr/eng/statisticsList/statisticsListIndex.do?menuId=M_01_01&vwcd=MT_ETITLE&parmTabId=M_01_01&statId=1962001&themaId=#SelectStatsBoxDiv (accessed on 2 February 2020).
  37. National Institute of Environmental Research, Environmental Standard Methods for Indoor Air Quality. Available online: http://law.go.kr/admRulSc.do?menuId=5&query=%EC%8B%A4%EB%82%B4%EA%B3%B5%EA%B8%B0%EC%A7%88#liBgcolor2 (accessed on 18 August 2020). (in Korean).
  38. US Environmental Protection Agency. Compendium of Methods for the Determination of Inorganic Compounds in Ambient Air–Compendium Method IO-3.5–Determination of metals in ambient particulate matter using inductively coupled plasma/mass spectrometry(ICP/MS) (EPA/625/R-96/010a); Office of Research and Development: Cincinnati, OH, USA, 1999.
  39. Chow, J.C.; Watson, J.G.; Lowenthal, D.H. Sources and chemistry of PM10 aerosol in Santa Barbara County, CA. Atmos. Environ. 1995, 30, 1489–1499. [Google Scholar] [CrossRef]
  40. Watson, J.G.; Zhu, T.; Chow, J.C.; Engelbrecht, J.; Fujita, E.M.; Wilson, W.E. Receptor modeling application framework for particle source apportionment. Chemosphere 2002, 49, 1093–1136. [Google Scholar] [CrossRef] [Green Version]
  41. Watson, J.G.; Chen, L.-W.A.; Chow, J.C.; Doraiswamy, P.; Lowenthal, D.H. Source apportionment: Findings from the U.S. Supersites Program. J. Air Waste Manag. Assoc. 2008, 58, 265–288. [Google Scholar] [CrossRef] [PubMed]
  42. Arditsoglou, A.; Samara, C. Levels of total suspended particulate matter and major trace elements in Kosovo: A source identification and apportionment study. Chemosphere 2005, 59, 669–678. [Google Scholar] [CrossRef]
  43. Rajšić, S.; Mijić, Z.; Tasić, M.; Radenković, M.; Jksić, J. Evaluation of the levels and sources of trace elements in urban particulate matter. Environ. Chem. Lett. 2008, 6, 95–100. [Google Scholar] [CrossRef]
  44. Xie, J.; Jin, L.; Cui, J.; Luo, X.; Li, J.; Zhang, G.; Li, X. Health risk-oriented source apportionment of PM2.5-associated trace metals. Environ. Pollut. 2020, 262, 114655. [Google Scholar] [CrossRef]
  45. Henry, R.C.; Lewis, C.W.; Hopke, P.K.; Williamson, H.J. Review of receptor model fundamentals. Atmos. Environ. 1984, 18, 1507–1515. [Google Scholar] [CrossRef]
  46. Gao, Y.; Nelson, E.D.; Field, M.P.; Ding, Q.; Li, H.; Sherrell, R.M.; Gigliotti, C.L.; Van Ry, D.A.; Glenn, T.R.; Eisenreich, S.J. Characterization of atmospheric trace elements on PM2.5 particulate matter over the New York–New Jersey harbor estuary. Atmos. Environ. 2002, 36, 1077–1086. [Google Scholar] [CrossRef]
  47. Basha, S.; Jhala, J.; Thorat, R.; Geol, S.; Trivedi, R.; Shah, K.; Menon, G.; Gaur, P.; Mody, K.H.; Jha, B. Assessment of heavy metal content in suspended particulate matter of coastal industrial town, Mithapur, Gujarat, India. Atmos. Environ. 2010, 97, 257–265. [Google Scholar] [CrossRef]
  48. Taylor, S.R. Abundance of chemical elements in the continental crust: A new table. Geochim. Cosmochim. Acta. 1964, 28, 1273–1285. [Google Scholar] [CrossRef]
  49. US Environmental Protection Agency. Risk Assessment Guidance for Superfund Volume I Human Health Evaluation Manual (Part A) (Interim Final) (EPA/540/1-89/002); Office of Emergency and Remedial Response: Washington, DC, USA, 1989.
  50. US Environmental Protection Agency. IRIS Advanced Search. Available online: http://cfpub.epa.gov/ncea/iris/search/index.cfm (accessed on 2 February 2020).
  51. Hieu, N.T.; Lee, B.-K. Characteristics of particulate matter and metals in the ambient air from a residential area in the largest industrial city in Korea. Atmos. Res. 2010, 98, 526–537. [Google Scholar] [CrossRef]
  52. Lloyd, A.C.; Denton, J.E. Air Toxics Hot Spots Program Risk Assessment Guidelines–Part II: Technical Support Document for Describing Available Cancer Potency Factors; Office of Environmental Health Hazard Assessment, California Environmental Protection Agency: Washington, DC, USA, 2005; p. B-311. [Google Scholar]
  53. Kim, K.; Lee, Y.G. Measurement on the indoor air quality in the public facility of underground market. J. Odor. Indoor Environ. 2018, 17, 168–173. (in Korean). [Google Scholar] [CrossRef]
  54. Yu, J.; Kang, Y.; Zhai, Z. Advances in research for underground buildings: Energy, thermal comfort and indoor air quality. Energy Build. 2020, 215, 109916. [Google Scholar] [CrossRef]
  55. Hu, J.; Li, N. Variation of PM2.5 concentrations in shopping malls in autumn, Chansha. Procedia Eng. 2015, 121, 692–698. [Google Scholar] [CrossRef] [Green Version]
  56. Klinmalee, A.; Srimongkol, K.; Oanh, N.T.K. Indoor air pollution levels in public buildings in Thailand and exposure assessment. Environ. Monit. Assess. 2009, 156, 581–594. [Google Scholar] [CrossRef]
  57. Jones, N.C.; Thornton, C.A.; Mark, D.; Harrison, R.M. Indoor/outdoor relationships of particulate matter in domestic homes with roadside, urban and rural locations. Atmos. Environ. 2000, 34, 2603–2612. [Google Scholar] [CrossRef]
  58. Bell, M.L.; Dominici, F.; Ebisu, K.; Zeger, S.; Samet, J.M. Spatial and temporal variation in PM2.5 chemical composition in the United States for health effects studies. Environ. Health Perspec. 2007, 115, 989–995. [Google Scholar] [CrossRef] [Green Version]
  59. Chow, J.C.; Watson, J.G.; Kuhns, H.; Etyemezian, V.; Lowenthal, D.H.; Crow, D.; Kohl, S.D.; Engelbrecht, J.P.; Green, M.C. Source profiles for industrial, mobile, and area sources in the Big Bend Regional Aerosol Visibility and Observational study. Chemosphere 2004, 54, 185–208. [Google Scholar] [CrossRef]
  60. Tan, J.; Zhang, L.; Zhou, X.; Duan, J.; Li, Y.; Hu, J.; He, K. Chemical characteristics and source apportionment of PM2.5 in Lanzhou, China. Sci. Total. Environ. 2017, 601–602, 1743–1752. [Google Scholar] [CrossRef] [PubMed]
  61. Park, M.-B.; Lee, T.-J.; Lee, E.-S.; Kim, D.-S. Enhancing source identification of hourly PM2.5 data in Seoul based on a dataset segmentation scheme by positive matrix factorization (PMF). Atmos. Pollut. Res. 2019, 10, 1042–1059. [Google Scholar] [CrossRef]
  62. Chiba, M.; Masironi, R. Toxic and trace elements in tobacco and tobacco smoke. Bull. World Health Organ. 1992, 70, 269–275. [Google Scholar] [PubMed]
  63. Bernhard, D.; Rossmann, A.; Wick, G. Metals in cigarette smoke. Life 2005, 57, 805–809. [Google Scholar] [CrossRef]
  64. Armendáriz, C.R.; Garcia, T.; Soler, A.; Fernández, A.J.G.; Glez-Weller, D.; González, G.L.; de la Torre, A.H.; Gironés, C.R. Heavy metals in cigarettes for sale in Spain. Environ. Res. 2015, 143, 162–169. [Google Scholar] [CrossRef]
  65. Watson, J.G. Visibility: Science and Regulation. J. Air Waste Manag. Assoc. 2002, 52, 628–713. [Google Scholar] [CrossRef] [Green Version]
  66. Chow, J.C.; Lowenthal, D.H.; Chen, L.-W.A.; Wang, X.; Watson, J.G. Mass reconstruction methods for PM2.5: A review. Air Qual. Atmos. Health 2015, 8, 243–263. [Google Scholar] [CrossRef] [Green Version]
  67. Nishikawa, M.; Hao, Q.; Morita, M. Preparation and evaluation of certified reference materials for Asian mineral dust. Glob. Environ. Res. 2000, 1, 103–113. [Google Scholar]
  68. Arimoto, R.; Kim, Y.J.; Kim, Y.P.; Quinn, P.K.; Bates, T.S.; Anderson, T.L.; Gong, S.; Uno, I.; Chin, M.; Huebert, B.J.; et al. Characterization of Asian Dust during ACE-Asia. Glob. Planet. Change 2006, 52, 23–56. [Google Scholar] [CrossRef]
  69. Ghim, Y.S.; Choi, Y.; Chang, Y.-S.; Kim, J. Natural and anthropogenic influences on heavy metals in airborne particles over the Korean Peninsula. Environ. Sci. Pollut. Res. 2014, 21, 10713–10724. [Google Scholar] [CrossRef]
  70. Li, W.; Dryfhout-Clark, H.; Hung, H. PM10-bound trace elements in the Great Lake Basin (1988–2017) indicates effectiveness of regulatory actions, variations in sources and reduction in human health risks. Environ. Int. 2020, 143, 106008. [Google Scholar] [CrossRef] [PubMed]
  71. Pacyna, J.M.; Pacyna, E.G. An assessment of global and regional emissions of trace metals to the atmosphere from anthropogenic sources worldwide. Environ. Rev. 2001, 9, 269–298. [Google Scholar] [CrossRef]
  72. Wang, X.; Sato, T.; Xing, B. Size distribution and anthropogenic sources apportionment of airborne trace metals in Kanazawa, Japan. Chemosphere 2006, 65, 2440–2448. [Google Scholar] [CrossRef] [PubMed]
  73. Wang, X.; Bi, X.; Sheng, G.; Fu, J. Chemical composition and sources of PM10 and PM2.5 aerosols in Guangzhou, China. Env. Monit. Assess. 2006, 119, 425–439. [Google Scholar] [CrossRef]
  74. Pui, D.Y.H.; Chen, S.-C.; Zuo, Z. PM2.5 in China: Measurements, sources, visibility and health effects, and mitigation. Particuology 2014, 13, 1–26. [Google Scholar] [CrossRef]
  75. Allen, A.G.; Nemitz, E.; Shi, J.P.; Harrison, R.M.; Greenwood, J.C. Size distributions of trace metals in atmospheric aerosols in the United Kingdom. Atmos. Environ. 2001, 35, 4581–4591. [Google Scholar] [CrossRef]
  76. Wu, Y.; Zhang, J.; Ni, Z.; Liu, S.; Jiang, Z.; Huang, X. Atmospheric deposition of trace elements to Daya Bay, South China Sea: Fluxes and sources. Mar. Pollut. Bull. 2018, 127, 672–683. [Google Scholar] [CrossRef]
  77. American Petroleum Institute. Gas Fired Boiler-Test Report Refinery Site A–Characterization of Fine Particulate Emission Factors and Speciation Profiles from Stationary Petroleum Industry Combustion Sources; Regulatory and Scientific Affairs: Washington, DC, USA, 2001. [Google Scholar]
  78. Hollowell, C.D.; Budnitz, R.J.; Case, G.D.; Traynor, G.W. Combustion-Generated Indoor Air Pollution-I. Field measurements 8/75–10/75; Lawrence Berkeley National Laboratory: Berkeley, CA, USA, 1976. [Google Scholar]
  79. See, S.W.; Balasubramanian, R. Risk assessment of exposure to indoor aerosols associated with Chinese cooking. Environ. Res. 2006, 102, 197–204. [Google Scholar] [CrossRef]
  80. Taner, S.; Pekey, B.; Pekey, H. Fine particulate matter in the indoor air of barbeque restaurants: Elemental compositions, sources and health risks. Sci. Total. Environ. 2013, 454–455, 79–87. [Google Scholar] [CrossRef]
  81. Yang, Y.; Liu, L.; Xu, C.; Li, N.; Liu, Z.; Wang, Q.; Xu, D. Source apportionment and influencing factor analysis of residential indoor PM2.5 in Beijing. Int. J. Environ. Res. Public Health 2018, 15, 686. [Google Scholar] [CrossRef] [Green Version]
  82. Chao, C.Y.; Wong, K.K. Residential indoor PM10 and PM2.5 in Hong Kong and the elemental composition. Atmos. Environ. 2002, 36, 265–277. [Google Scholar] [CrossRef]
  83. Chow, J.C.; Watson, J.G. Review of PM2.5 and PM10 apportionment for fossil fuel combustion and other sources by the chemical mass balance receptor model. Energy Fuels 2002, 16, 222–260. [Google Scholar] [CrossRef]
  84. Tian, H.; Liu, K.; Zhou, J.; Lu, L.; Hao, L.; Hao, J.; Qie, P.; Gao, J.; Zhu, C.; Wang, K.; et al. Atmospheric emission inventory of hazardous trace elements from China’s coal-fired power plants – Temporal trends and spatial variation characteristics. Environ. Sci. Technol. 2014, 48, 3575–3582. [Google Scholar] [CrossRef] [PubMed]
  85. Wang, Q.; Qiao, L.; Zhou, M.; Zhu, S.; Griffith, S.; Li, L.; Yu, J.Z. Source apportionment of PM2.5 using hourly measurements of elemental tracers and major constituents in an urban environment: Investigation of time-resolution influence. J. Geophys. Res. Atmos. 2018, 123, 5284–5300. [Google Scholar] [CrossRef]
  86. Han, J.S.; Moon, K.J.; Ryu, S.Y.; Kim, Y.J.; Perry, K.D. Source estimation of anthropogenic aerosols collected by a DRUM sampler during spring of 2002 at Gosan, Korea. Atmos. Environ. 2005, 39, 3113–3125. [Google Scholar] [CrossRef]
  87. Kim, S.; Kim, T.-Y.; Yi, S.-M.; Heo, J. Source apportionment of PM2.5 using positive matrix factorization (PMF) at a rural site in Korea. Environ. Manag. 2008, 214, 325–334. [Google Scholar] [CrossRef] [PubMed]
  88. Lee, J.Y.; Kim, Y.P.; Kang, C.-H.; Ghim, Y.S.; Kaneyasu, N. Temporal trend and long-range transport of particulate polycyclic aromatic hydrocarbons at Gosan in northeast Asia between 2001 and 2004. J. Geophys. Res. 2006, 111, D11303. [Google Scholar] [CrossRef] [Green Version]
  89. Kim, J.Y.; Lee, J.Y.; Choi, S.-D.; Kim, Y.P.; Ghim, Y.S. Gaseous and particulate polycyclic aromatic hydrocarbons at the Gosan background site in East Asia. Atmos. Environ. 2012, 49, 311–319. [Google Scholar] [CrossRef]
  90. Ghim, Y.S.; Kim, J.Y.; Chang, Y.S. Concentration variations in particulate matter in Seoul associated with Asian dust and smog episode. Aerosol Air Qual. Res. 2017, 17, 3128–3140. [Google Scholar] [CrossRef] [Green Version]
  91. Jung, J.; Ghim, Y.S.; Lyu, Y.; Lim, Y.; Park, J.; Sung, M. Quantification of regional contributions to fine particles at downwind areas under Asian continental outflows during winter 2014. Atmos. Environ. 2019, 210, 231–240. [Google Scholar] [CrossRef]
  92. Monaci, F.; Moni, F.; Lanciotti, E.; Grechi, D.; Bargagli, R. Biomonitoring of airborne metals in urban environments: New tracers of vehicle emission, in place of lead. Environ. Pollut. 2000, 107, 321–327. [Google Scholar] [CrossRef]
  93. Bem, H.; Gallorini, M.; Rizzio, E.; Krzemińska, M. Comparative studies on the concentrations of some elements in the urban air particulate matter in Lodz City of Poland and in Milan, Italy. Environ. Int. 2003, 29, 423–428. [Google Scholar] [CrossRef]
  94. Chen, S.-C.; Tsai, C.-J.; Huang, C.-Y.; Chen, H.-D.; Chen, S.-J.; Lin, C.-C.; Tsai, J.-H.; Chou, C.C.-K.; Lung, S.-C.C.; Huang, W.-R.; et al. Chemical mass closure and chemical characteristics of ambient ultrafine particles and other PM fractions. Aerosol Sci. Technol. 2010, 44, 713–723. [Google Scholar] [CrossRef]
  95. Furuya, K.; Kudo, Y.; Okinaga, K.; Yamuki, M.; Takahashi, S.; Araki, Y.; Hisamatsu, Y. Seasonal variation and their characterization of suspended particulate matter in the air of subway stations. J. Trace. Microprobe. Tech. 2001, 19, 469–485. [Google Scholar] [CrossRef]
  96. Kang, S.; Hwang, H.; Park, Y.; Kim, H.; Ro, C.-U. Chemical compositions of subway particles in Seoul, Korea determined by a quantitative single particle analysis. Environ. Sci. Technol. 2008, 42, 9051–9057. [Google Scholar] [CrossRef] [PubMed]
  97. Jung, H.-J.; Kim, B.; Ryu, J.; Maskey, S.; Kim, J.-C.; Sohn, J.; Ro, C.-U. Source identification of particulate matter collected at underground subway stations in Seoul, Korea using quantitative single-particle analysis. Atmos. Environ. 2010, 44, 2287–2293. [Google Scholar] [CrossRef]
  98. Park, D.; Oh, M.; Yoon, Y.; Park, E.; Lee, K. Source identification of PM10 pollution in subway passenger cabins using positive matrix factorization. Atmos. Environ. 2012, 49, 180–185. [Google Scholar] [CrossRef]
  99. Han, S.; Youn, J.-S.; Kim, W.-J.; Seo, Y.-H.; Jung, Y.-W. Estimation of air pollutant emissions from port-related sources in th port of Incheon. J. Korean Soc. Atmos. Environ. 2011, 27, 460–471. (in Korean). [Google Scholar] [CrossRef]
  100. Son, M.; Kim, Y.; Myllyvirta, L. Silent Killer: Fine Particulate Matter; Greenpeace: Seoul, Korea, 2015. [Google Scholar]
  101. US Environmental Protection Agency. Air Toxics Risk Assessment Reference Library Volume 1 Technical Resource Manual; Office of Air Quality Planning and Standards Emissions Standard Division, Research Triangle Park: Durham, NC, USA, 2004.
  102. Park, E.; Kim, D.; Park, K. Monitoring of ambient particles and heavy metals in a residential area of Seoul, Korea. Environ. Monit. Assess. 2008, 137, 441–449. [Google Scholar] [CrossRef]
Figure 1. Locations of Seoul metropolitan area (SMA; yellow box in left figure), including Seoul proper, Incheon, and Gyeonggi (right panel). The background map was obtained from © Google Maps.
Ijerph 18 00297 g001
Table 1. Concentrations of PM2.5 (μg/m3) and trace elements (ng/m3) in indoor and outdoor air (mean ± standard deviation).
IndoorOutdoorI/O Ratio aR bEF c
PM2.518.0 ± 8.025.2 ± 10.60.76 ± 0.310.72 **-
Ag0.337 ± 0.4730.337 ± 0.7171.41 ± 1.480.082170
Ni9.22 ± 8.269.46 ± 7.171.34 ± 1.160.1678
Ti1240 ± 13801380 ± 20201.16 ± 0.650.38 *134
Al73.2 ± 64.196.1 ± 84.61.15 ± 1.180.48 **1
Zn129 ± 85123 ± 601.11 ± 0.680.51 **1248
Co1.61 ± 1.711.46 ± 1.041.07 ± 0.390.78 **40
Fe486 ± 376482 ± 2631.07 ± 0.820.45 **6
Cr18.5 ± 23.315.8 ± 11.81.03 ± 0.320.31107
Cd2.29 ± 1.122.65 ± 1.961.01 ± 0.420.63 **8178
Mn20.3 ± 12.422.3 ± 11.40.95 ± 0.440.68 **15
Sr2.64 ± 1.933.10 ± 2.780.93 ± 0.270.86 **5
Cu21.2 ± 18.925.9 ± 19.20.90 ± 0.590.22259
Se14.0 ± 12.317.1 ± 13.00.89 ± 0.490.31 *166,960
Si379 ± 179481 ± 2910.87 ± 0.310.78 **1
Ba17.2 ± 15.621.9 ± 10.10.81 ± 0.650.34 *26
V5.87 ± 6.558.23 ± 9.110.75 ± 0.210.86 **21
As1.98 ± 1.262.96 ± 2.020.69 ± 0.210.89 **721
Pb13.5 ± 6.720.1 ± 9.30.69 ± 0.190.80 **771
a Indoor/outdoor ratio. Trace elements are arranged in descending order of I/O ratio. b Correlation coefficient, p-value: ** p < 0.01, * p < 0.05. c Geometric mean of enrichment factor for indoor elements.
Table 2. Factor loadings from principal component analysis with varimax rotation. Boldface denotes high factor loadings considered as marker elements.
Factor 1Factor 2Factor 3Factor 4Factor 5
Cu0.9560.078 0.115 0.086 0.135
Cr a0.9380.117 0.099 0.139 0.073
Se0.8930.102 0.323 0.095 0.149
Ni a0.835−0.021 0.231 −0.066 −0.040
Mn0.7400.143 0.347 0.308 0.043
Ag0.7160.332 −0.247 −0.088 −0.036
Ti0.133 0.9440.204 0.071 0.072
Sr0.105 0.9270.102 0.195 0.211
Si0.193 0.8080.001 0.393 0.236
Co0.236 0.050 0.859−0.107 0.154
Zn0.325 0.259 0.6880.104 0.151
V0.042 0.020 0.6830.258 −0.244
As a−0.065 0.120 0.146 0.8830.122
Cd a0.261 0.290 −0.018 0.7680.079
Pb a0.121 0.451 0.534 0.581−0.101
Ba−0.025 0.116 −0.075 0.056 0.948
Al0.191 0.542 0.114 0.212 0.667
Fe0.611 0.295 0.151 0.057 0.645
Eigenvalue7.553.022.081.331.12
% variance28.218.513.612.211.4
Cumulative % variance28.246.760.372.483.8
Possible sourceIndoor miscellaneaSoil dustVehicle exhaust/cookingCoal combustionRoad/subway dust
a Of high carcinogenicity; hence, used to assess the excess cancer risk.
Table 3. Correlations between factors and outdoor air a, mean indoor-to-outdoor (I/O) ratios, and enrichment factors (EFs).
Factor 1Factor 2Factor 3Factor 4Factor 5
Factor 11
Factor 20.301
Factor 30.49 **0.42 **1
Factor 40.34 *0.56 **0.52 **1
Factor 50.66 **0.50 **0.43 **0.32 *1
Outdoor 0.260.86 **0.31 *0.60 **0.41 **
I/O ratio b1.100.990.980.801.01
EF c470910316564
a Used the sum of the marker element concentrations for each factor and the total of all 18 element concentrations for the outdoor air. p-value: ** p < 0.01, * p < 0.05. b Used the sum of the marker element concentrations for outdoor air as well. c For indoor elements.
Table 4. PM2.5 concentrations and contributions of trace element sources a by underground shopping district (USD) environmental factor.
Number of Data PointsPM2.5 (μg/m3) Element Concentration (ng/m3) b Contribution (%) c
IndoorOutdoorI/O ratioTotalIndoor Miscel.Soil DustVex/ Cook.Coal Comb.Rd/sw dustIndoor Miscel.Soil DustVex/ Cook.Coal Comb.Rd/sw Dust
(a) Overall4118.025.20.762439831625136185763.4266.65.590.7323.6
(b) Location
Seoul2417.925.10.721964641278101145083.2565.05.150.6925.9
Incheon1518.225.80.8133631232286205257233.6668.06.100.7521.5
Gyeonggi216.521.80.7512002284144122811.7970.13.671.0223.4
(c) Type of USD
Open330.231.21.002037691316102205313.4064.64.980.9726.1
Semi-open1517.022.50.8227711061904143235953.8368.75.140.8321.5
Closed2317.026.10.682274711483137145703.1065.26.010.6225.0
(d) Type of stores
Open2317.024.40.772461971537152196563.9362.56.160.7826.7
Mix320.327.60.721868581315100153793.1270.45.360.8120.3
Closed1514.019.00.8751261073851200209492.0875.13.890.3818.5
(e) Number of stores
<991720.528.10.751781581116101144923.2862.65.640.7827.7
100–1991114.724.90.601851681246128183913.6867.36.890.9721.1
>2001317.521.70.9037961292612191238423.4068.85.020.6022.2
(f) Connection to subway
Yes2317.123.60.782465891522131177073.6161.75.300.6728.7
No1819.027.20.722405771757143194093.1873.15.960.8017.0
a Indoor miscel., indoor miscellanea; Vex/cook., vehicle exhaust/cooking; Coal comb., coal combustion; Rd/sw dust, road/subway dust. b Sum of the marker element concentrations for each source. c Concentration by source divided by the total element concentration.
Table 5. Excess cancer risks (ECR) of carcinogenic elements.
IARC Classification GroupTumor
Type
Toxicity Value
(m3/μg)
Concentration (ng/m3) aECR (10−6)
IndoorOutdoorIndoorOutdoor
Cr(IV) bALung 1.2 × 10−25.6 5.0 66.659.9
AsALung 4.3 × 10−34.3 5.4 18.523.2
CdB1Lung, trachea, and bronchus1.8 × 10−34.3 6.8 7.812.2
NiALung 2.4 × 10−423.0 17.2 5.54.1
PbB2Lung 1.2 × 10−525.1 34.7 0.30.4
a 95th percentile. b Cr/7.
Publisher’s Note: MDPI stays neutral with regard to jurisdictional claims in published maps and institutional affiliations.

