Article

Mortality Risk from Respiratory Diseases Due to Non-Optimal Temperature among Brazilian Elderlies

by
Ludmilla da Silva Viana Jacobson
1,2,*,
Beatriz Fátima Alves de Oliveira
3,
Rochelle Schneider
4,5,6,
Antonio Gasparrini
4,5,7 and
Sandra de Souza Hacon
2,3
1
Department of Statistics, Fluminense Federal University, Niterói 24210-201, RJ, Brazil
2
Brazilian Research Network on Global Climate Change–Rede Clima, São José dos Campos 12227-010 SP, Brazil
3
Nacional School of Public Health, Oswaldo Cruz Foundation, Rio de Janeiro 21041-210, RJ, Brazil
4
Department of Public Health, Environments and Society, London School of Hygiene & Tropical Medicine, London WC1E7HT, UK
5
Centre for Statistical Methodology, London School of Hygiene & Tropical Medicine, London WC1E7HT, UK
6
Forecast Department, European Centre for Medium-Range Weather Forecast, Reading RG29AX, UK
7
The Centre on Climate Change and Planetary Health, London School of Hygiene & Tropical Medicine, London WC1E7HT, UK
*
Author to whom correspondence should be addressed.
Int. J. Environ. Res. Public Health 2021, 18(11), 5550; https://0-doi-org.brum.beds.ac.uk/10.3390/ijerph18115550
Submission received: 22 February 2021 / Revised: 16 April 2021 / Accepted: 28 April 2021 / Published: 22 May 2021

Abstract

:
Over the past decade, Brazil has experienced and continues to be impacted by extreme climate events. This study aims to evaluate the association between daily average temperature and mortality from respiratory disease among Brazilian elderlies. A daily time-series study between 2000 and 2017 in 27 Brazilian cities was conducted. Data outcomes were daily counts of deaths due to respiratory diseases in the elderly aged 60 or more. The exposure variable was the daily mean temperature from Copernicus ERA5-Land reanalysis. The association was estimated from a two-stage time series analysis method. We also calculated deaths attributable to heat and cold. The pooled exposure–response curve presented a J-shaped format. The exposure to extreme heat increased the risk of mortality by 27% (95% CI: 15–39%), while the exposure to extreme cold increased the risk of mortality by 16% (95% CI: 8–24%). The heterogeneity between cities was explained by city-specific mean temperature and temperature range. The fractions of deaths attributable to cold and heat were 4.7% (95% CI: 2.94–6.17%) and 2.8% (95% CI: 1.45–3.95%), respectively. Our results show a significant impact of non-optimal temperature on the respiratory health of elderlies living in Brazil. It may support proactive action implementation in cities that have critical temperature variations.

1. Introduction

The process of climate change is directly related to the atmospheric emission of greenhouse gases (GHGs) caused by human activities. All population will be affected by climate change, but the health risks vary, depending on the place and how the exposed people live. Global warming has accelerated in the last decade and has been linked to the increased frequency of extreme weather-related events and the unusual temporal and spatial distribution of precipitation, humidity, and wind speed. Additionally, climate change has caused an increase in global average temperatures. All of these factors have important implications for human health and have motivated the exponential increase in the number of studies on the effect of temperature on health outcomes in the last 10 years [1].
The Intergovernmental Panel on Climate Change (IPCC) has emphasized the importance of studies on the association between temperature and health outcomes, especially concerning the most vulnerable populations. In the report of the IPCC [2], the priority of the Climate and Health theme was reinforced due to projections of a global average temperature increase between 2 and 4.5 °C by the end of the 21st century.
In recent decades, temperature has been identified as a risk factor for communicable and non-communicable diseases, either by direct exposure or indirect exposure caused by environmental imbalance [3]. Studies have been evaluating the effects of temperature on different health outcomes and population subgroups [4,5]. Additionally, extreme temperatures may increase the risk of hospitalizations and deaths due to respiratory diseases, not only because of exposure to heat but also due to exposure to cold temperatures [6,7,8].
The impact of climate variability on populations’ health is widespread; however, some groups are more vulnerable than others [9]. Studies suggest that the elderly are one of the groups most vulnerable to climate change, because of physiological and social factors [10]. Investigations point to an increased risk of mortality as a result of both high temperatures and low temperatures [11].
In Brazil, in 2010, the elderly (60 years old or more) represented approximately 11% of the Brazilian population and projections indicate that by 2060 this age group will represent around 25% of the population (IBGE—https://www.ibge.gov.br/apps/population/projection//index.html, accessed 12 June 2019). Few studies investigated the effects of temperature exposure on respiratory disease in the Brazilian elderly, and they were in the city of São Paulo [12,13,14]. It is important to have evidence for the different regions of Brazil, as they have different environmental, socioeconomic, health, and political characteristics.
Modeling studies related to Brazilian projections of the Eta-HadGEM2S Regional Model show that an increase in average temperatures of 1.5 °C has already taken place in Brazil since the end of 2010 [15]. Over the past decade, Brazil has experienced and continues to be impacted by extreme climate events such as droughts in the southeast, northeast, and northern regions, particularly in the Amazon [16,17]. Additionally, in the south and southeast regions, global warming has affected the average daily temperature and the daily amplitude and few studies have been conducted in Brazil to evaluate the effects of rising temperatures on human health [18,19].
Therefore, this study aimed to evaluate the association between daily average temperature and mortality caused by respiratory diseases among the elderly in the Brazilian capital cities, considering the aging of the Brazilian population as well as the fact that this group is more vulnerable to climate change.

2. Materials and Methods

2.1. Study Area and Period

We performed an ecological time-series study from 1 January 2000 to 31 December 2017 in the Brazilian capitals. Brazil is divided into 26 states and the Federal District, and each one has a capital. The capital is usually the most important city of the state according to economic, social, and cultural indicators. All of the capital cities and the Federal District were included in the analysis.

2.2. Data

Health outcomes were daily counts of deaths due to respiratory diseases in the elderly aged 60 or more, registered in Brazil’s National Unified Health System (SUS). Data were provided by the Brazilian Health Informatics Department (DATASUS) classified as respiratory diseases (J00-J99), according to the Tenth Revision of the International Classification of Diseases (ICD-10).
The exposure variable was the daily mean of 2 m temperature modeled and produced by the European Centre for Medium-Range Weather Forecasts (ECMWF) ERA5-Land climate reanalysis. The ERA5-Land reanalysis is available at a grid resolution of 9 km and hourly temporal frequency and we calculated the daily average using the weighted average of the grids covered for each municipality polygon by apportionment methods. Thus, the daily series of temperature for each municipality was obtained by calculating the average of the pixel values weighted by the proportion of the area of the municipality covered by the pixel. The relative humidity was estimated from the daily mean of the temperature and dew point temperature from the ERA5-Land database using the package HeatStress of the Program R [20].

2.3. Statistical Analysis
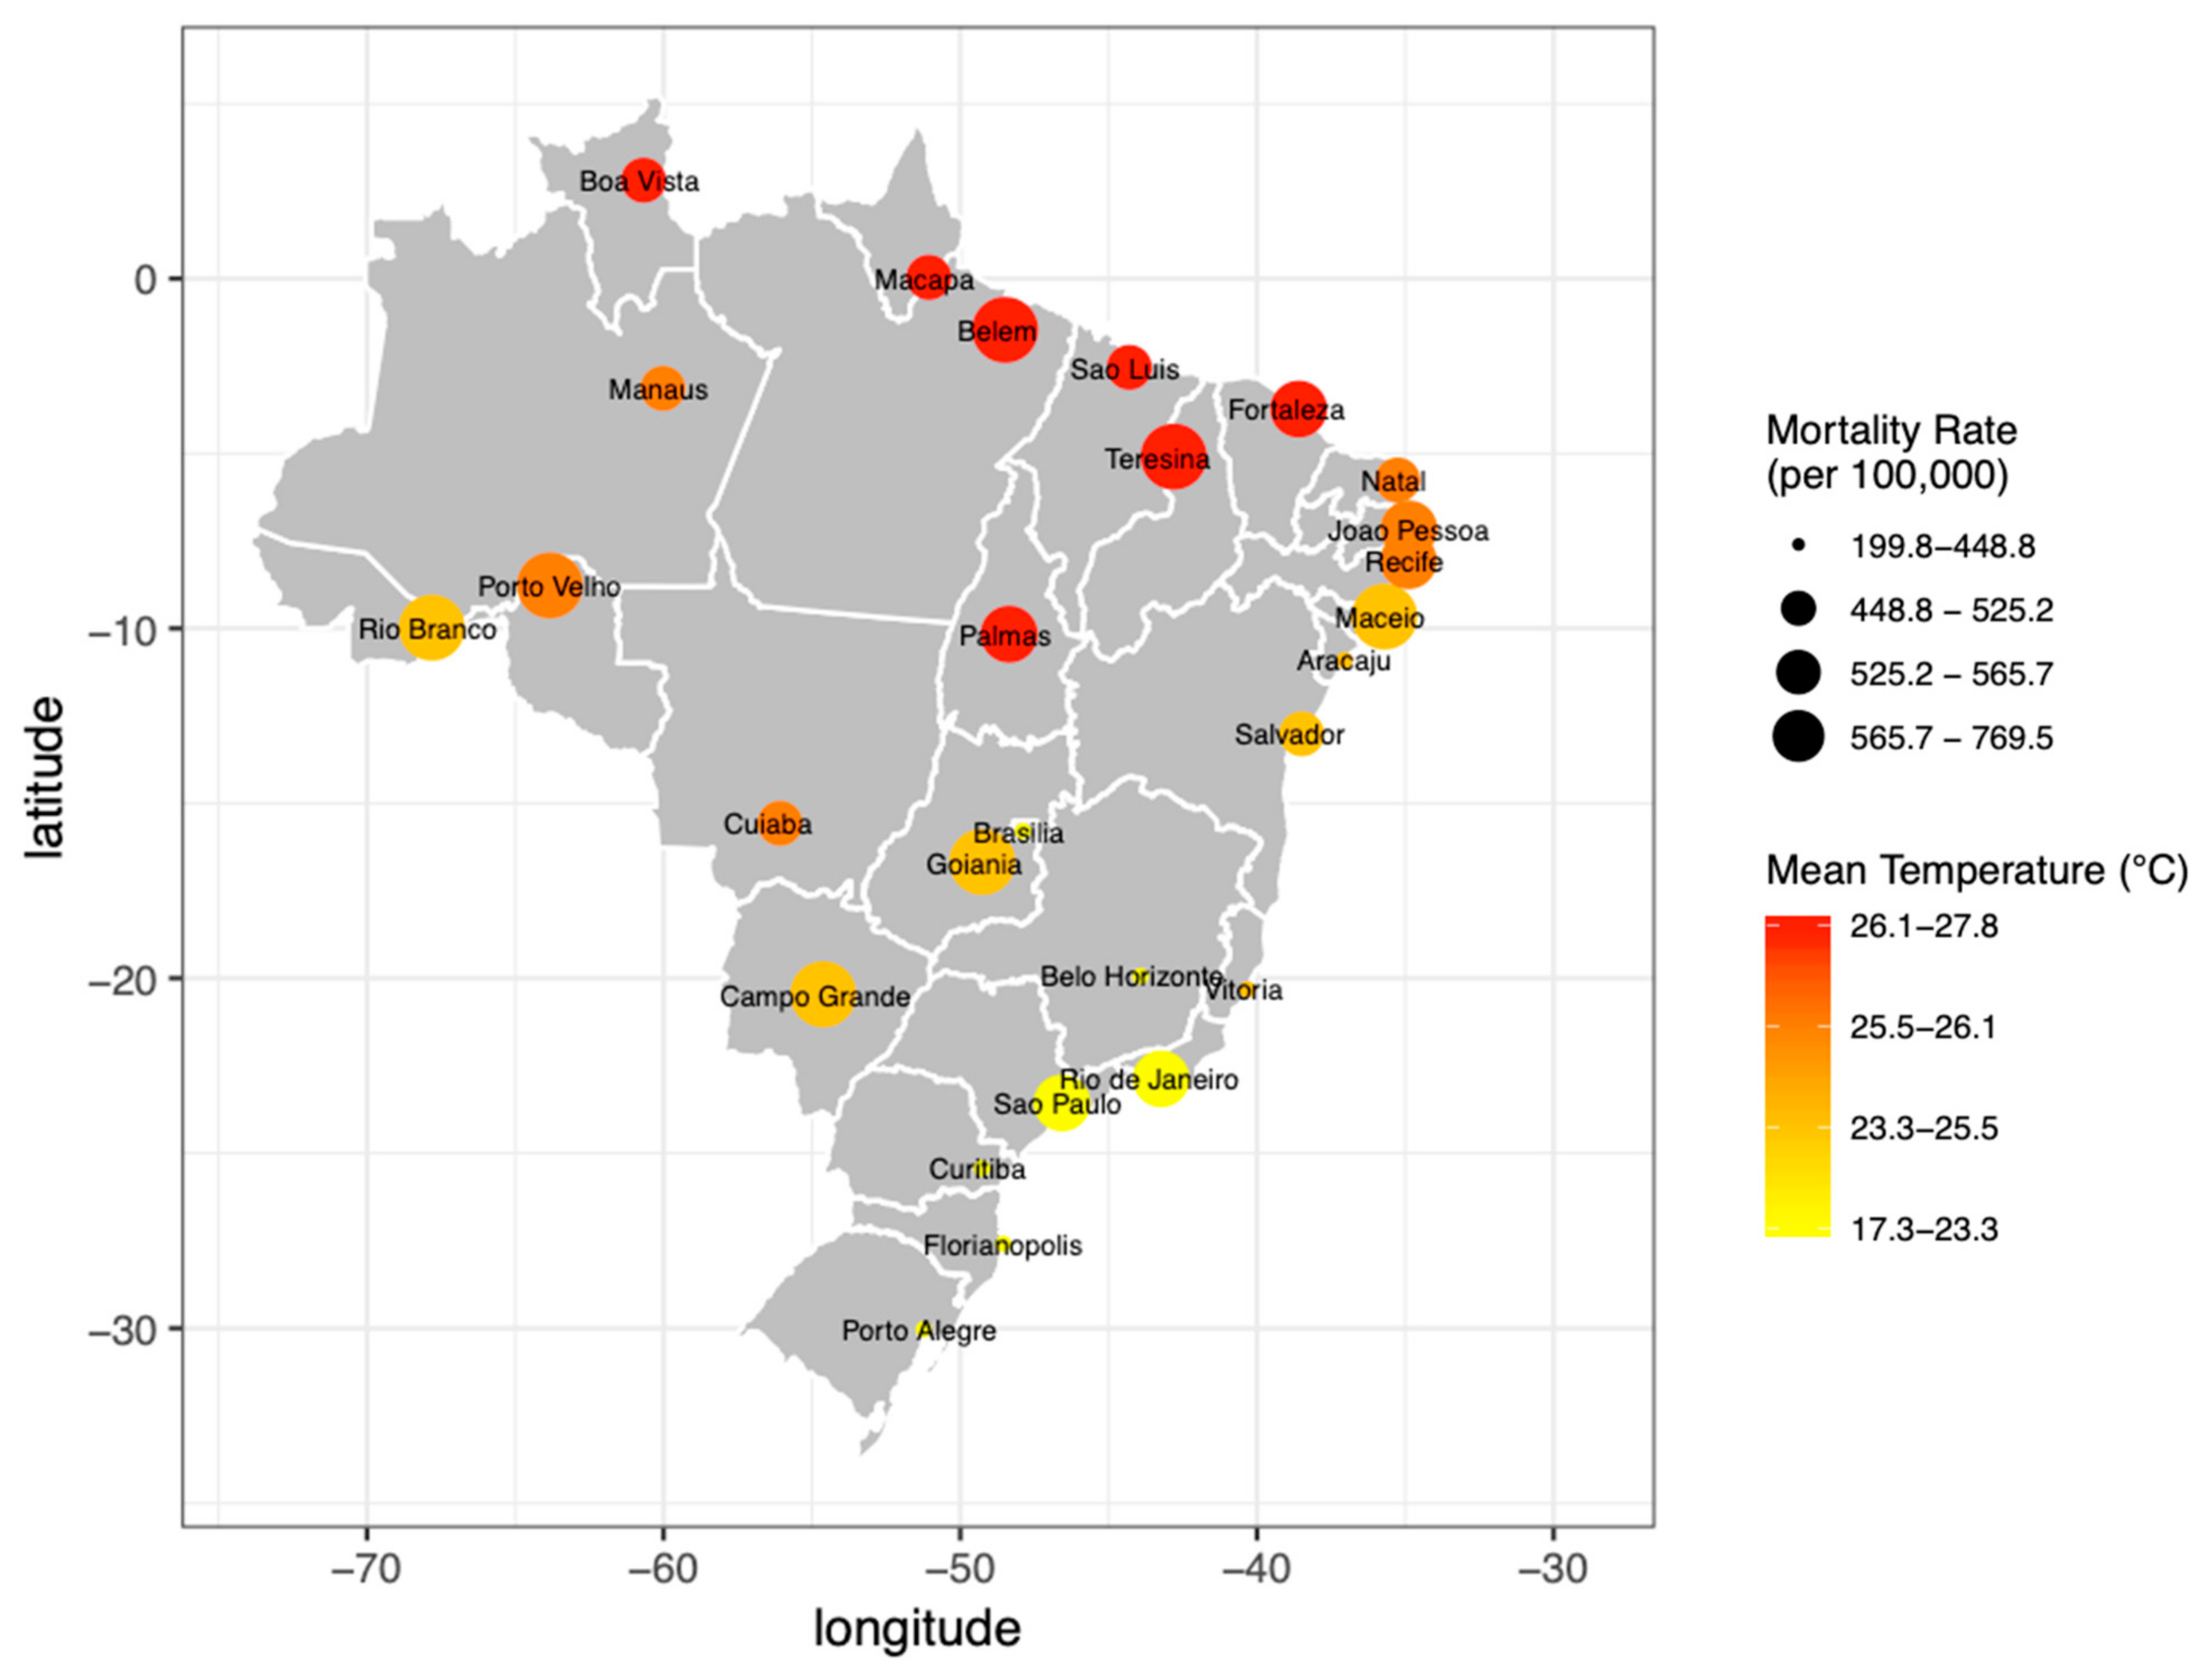
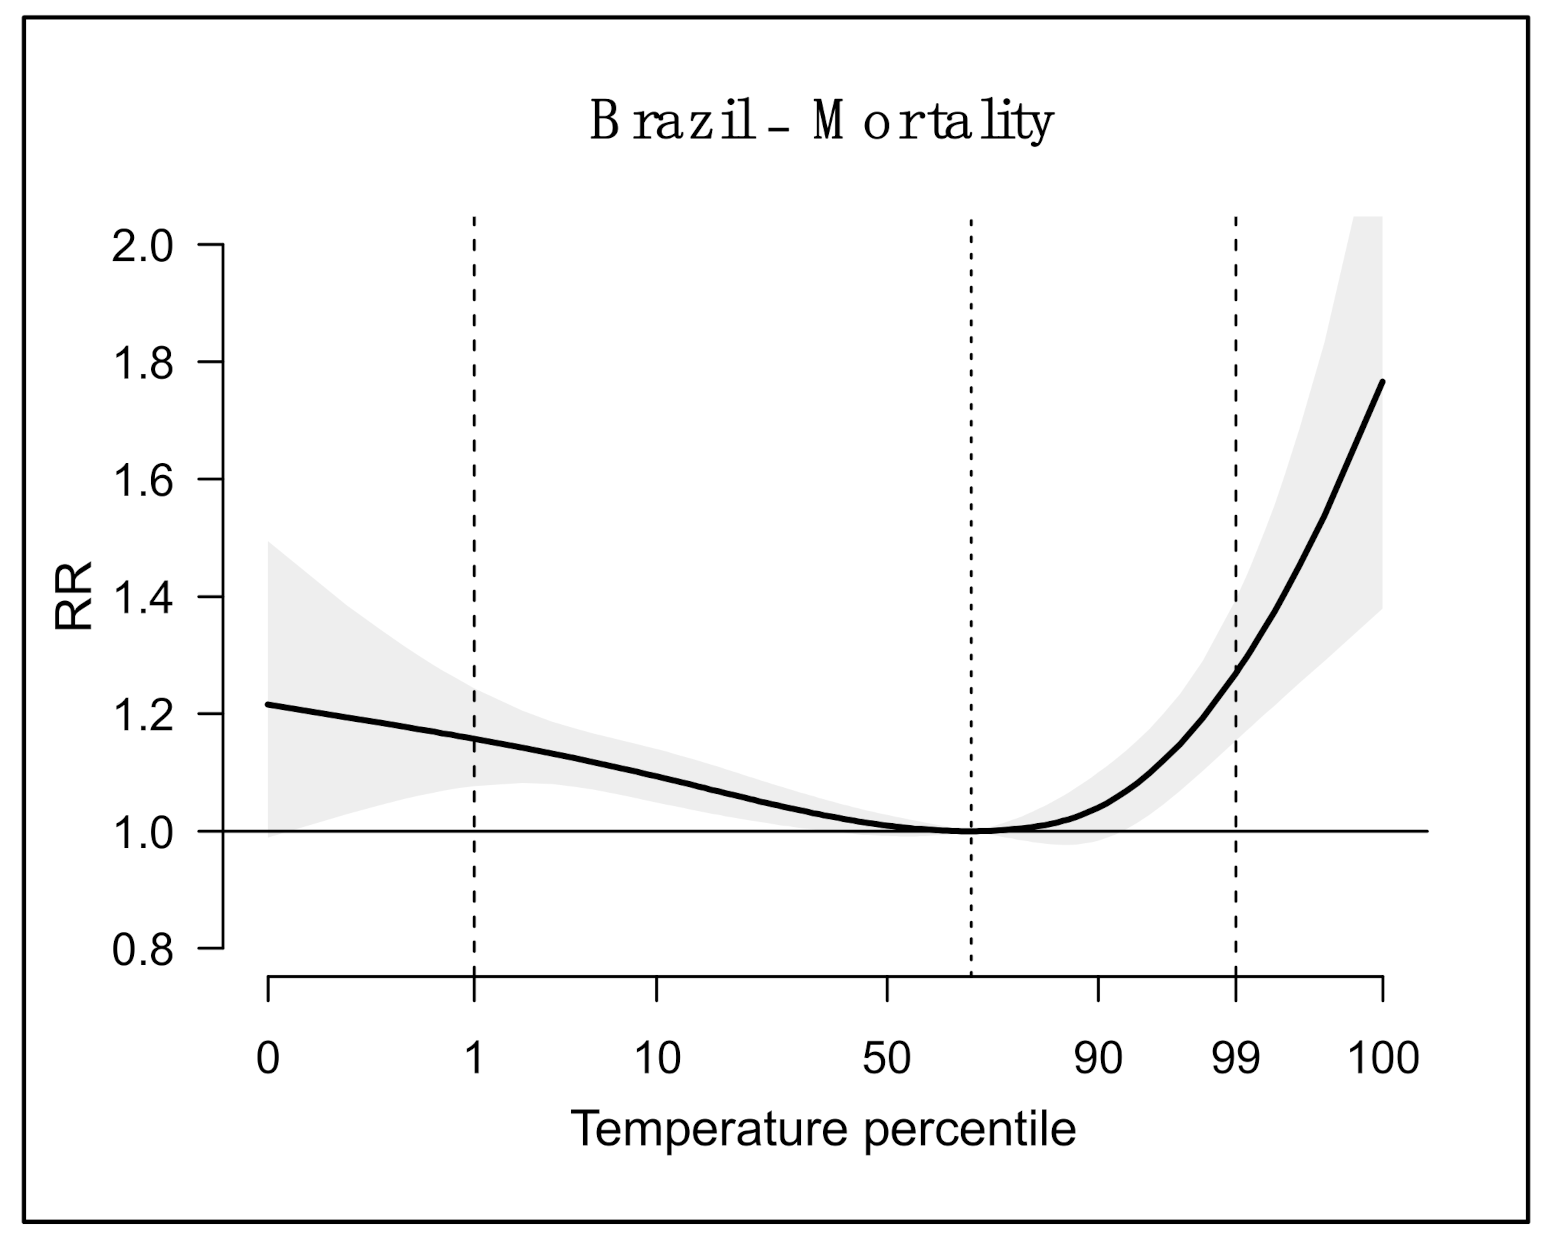
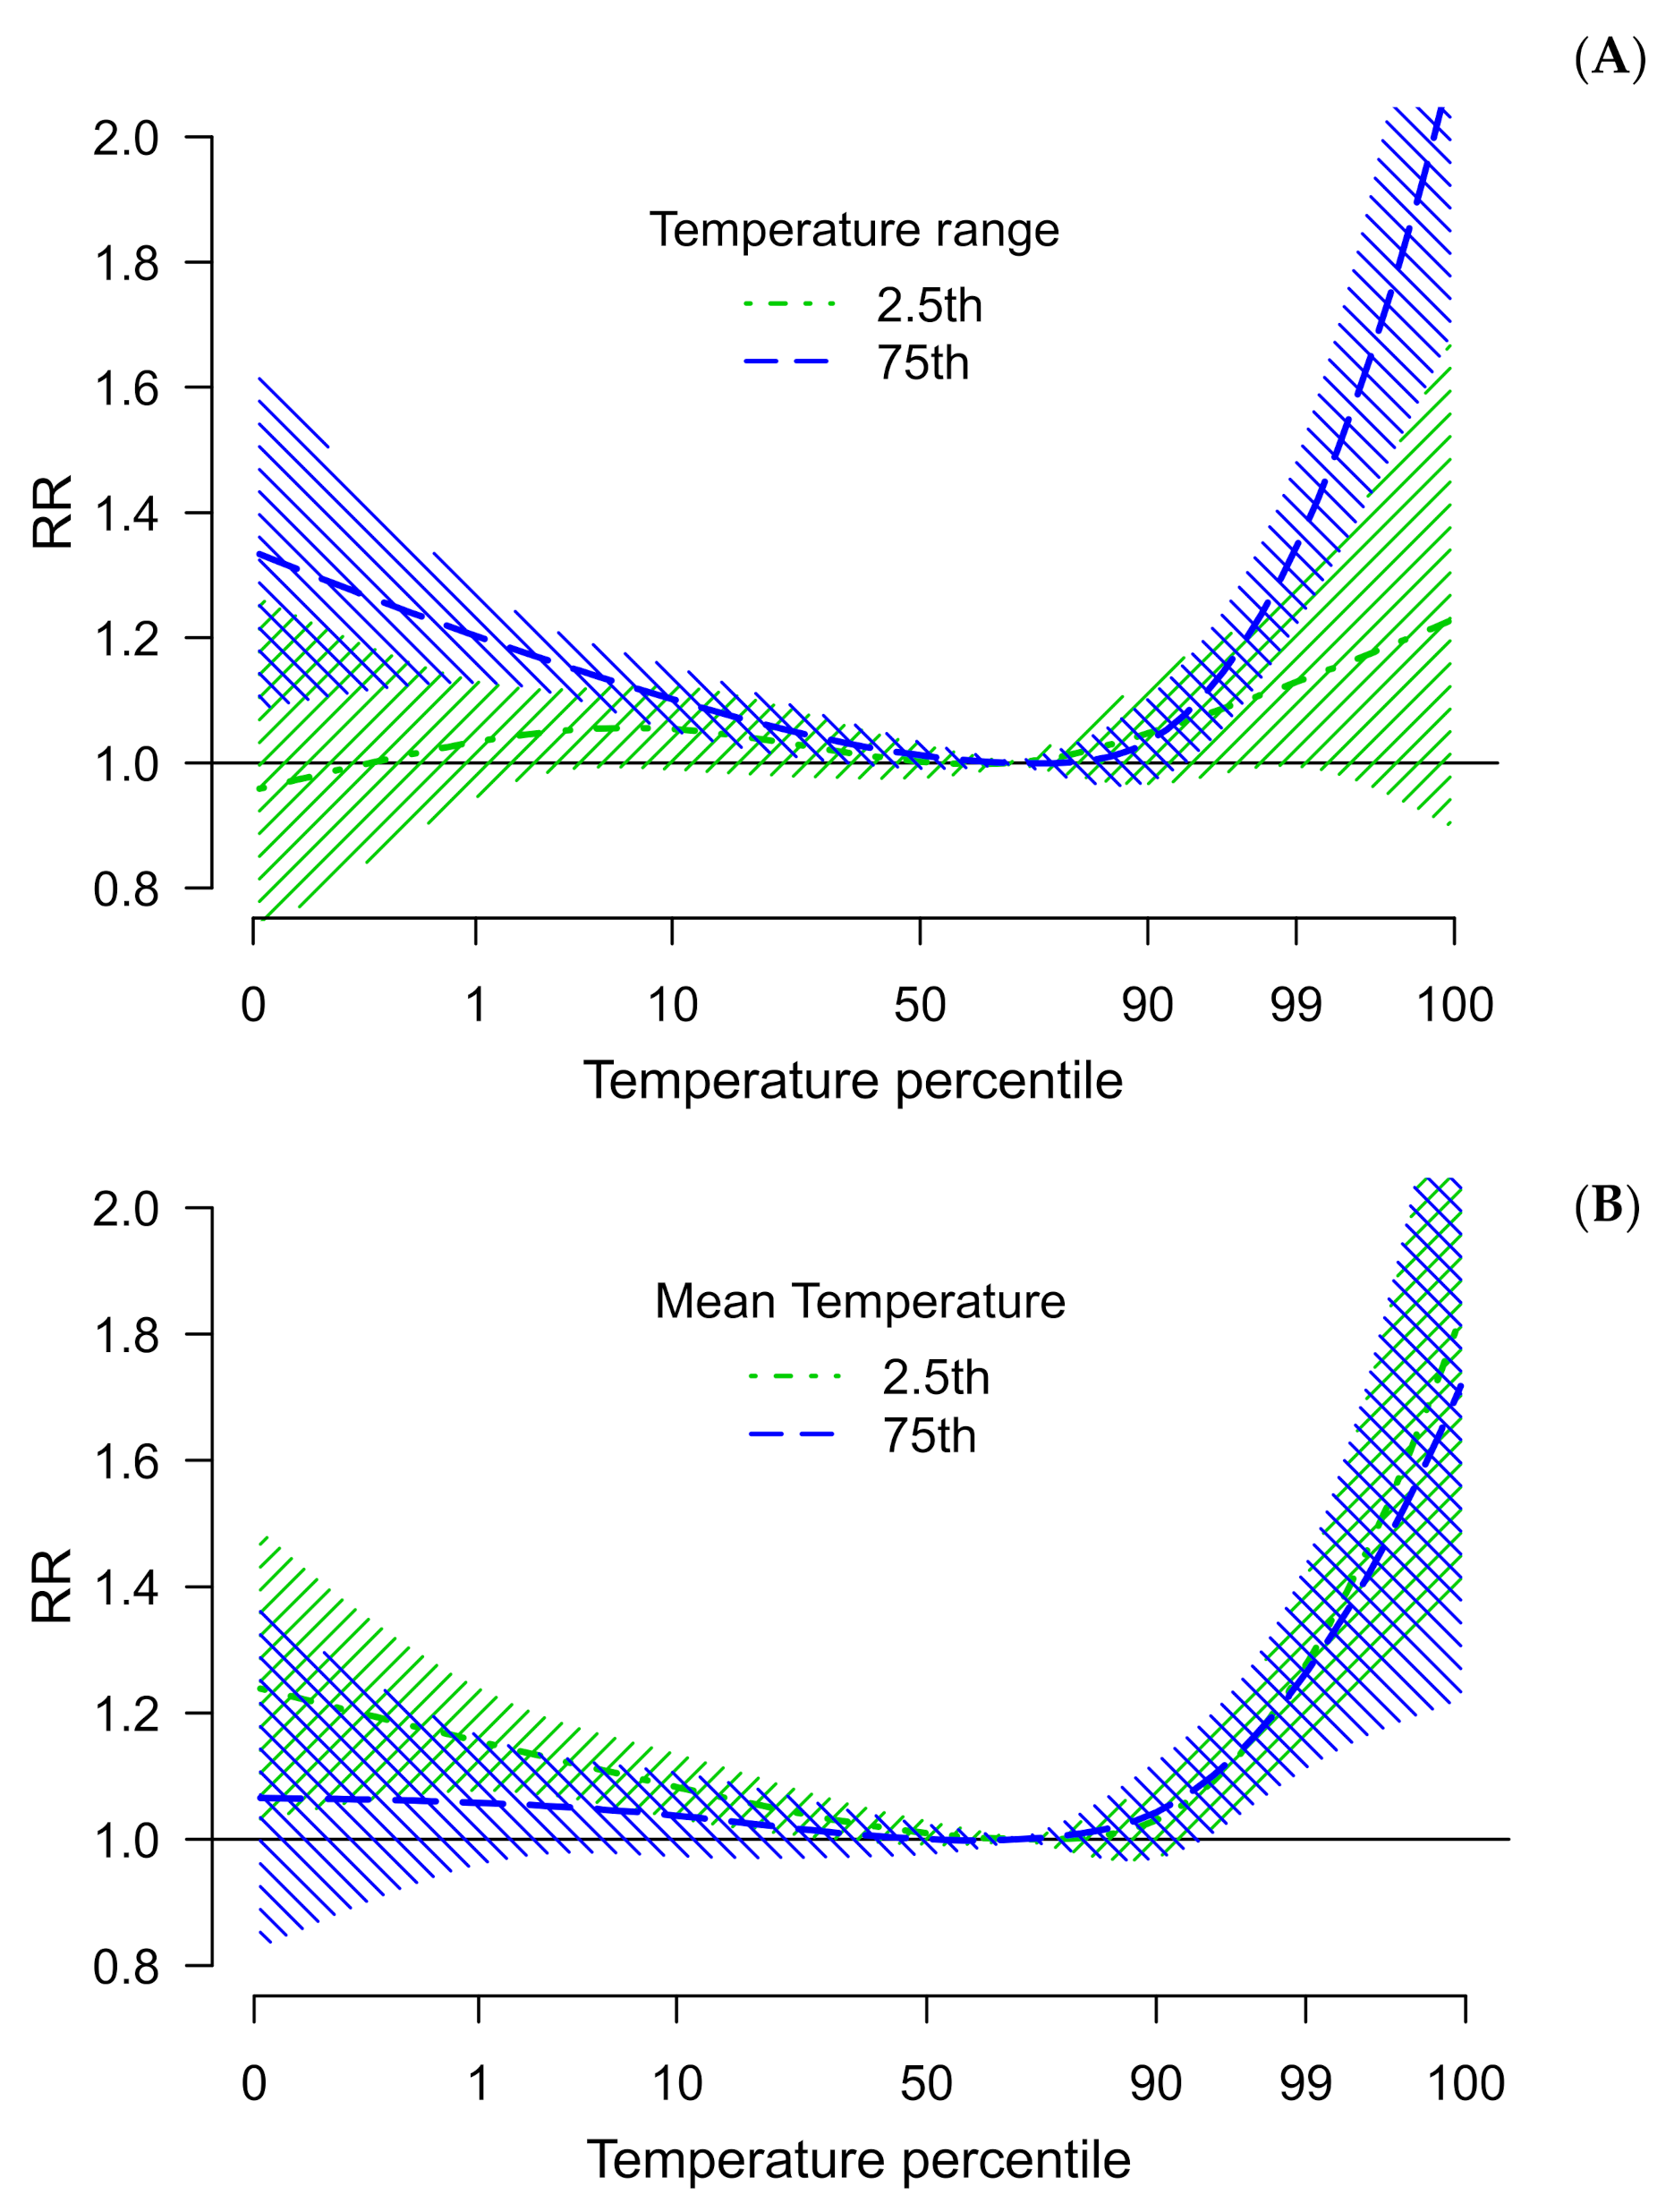
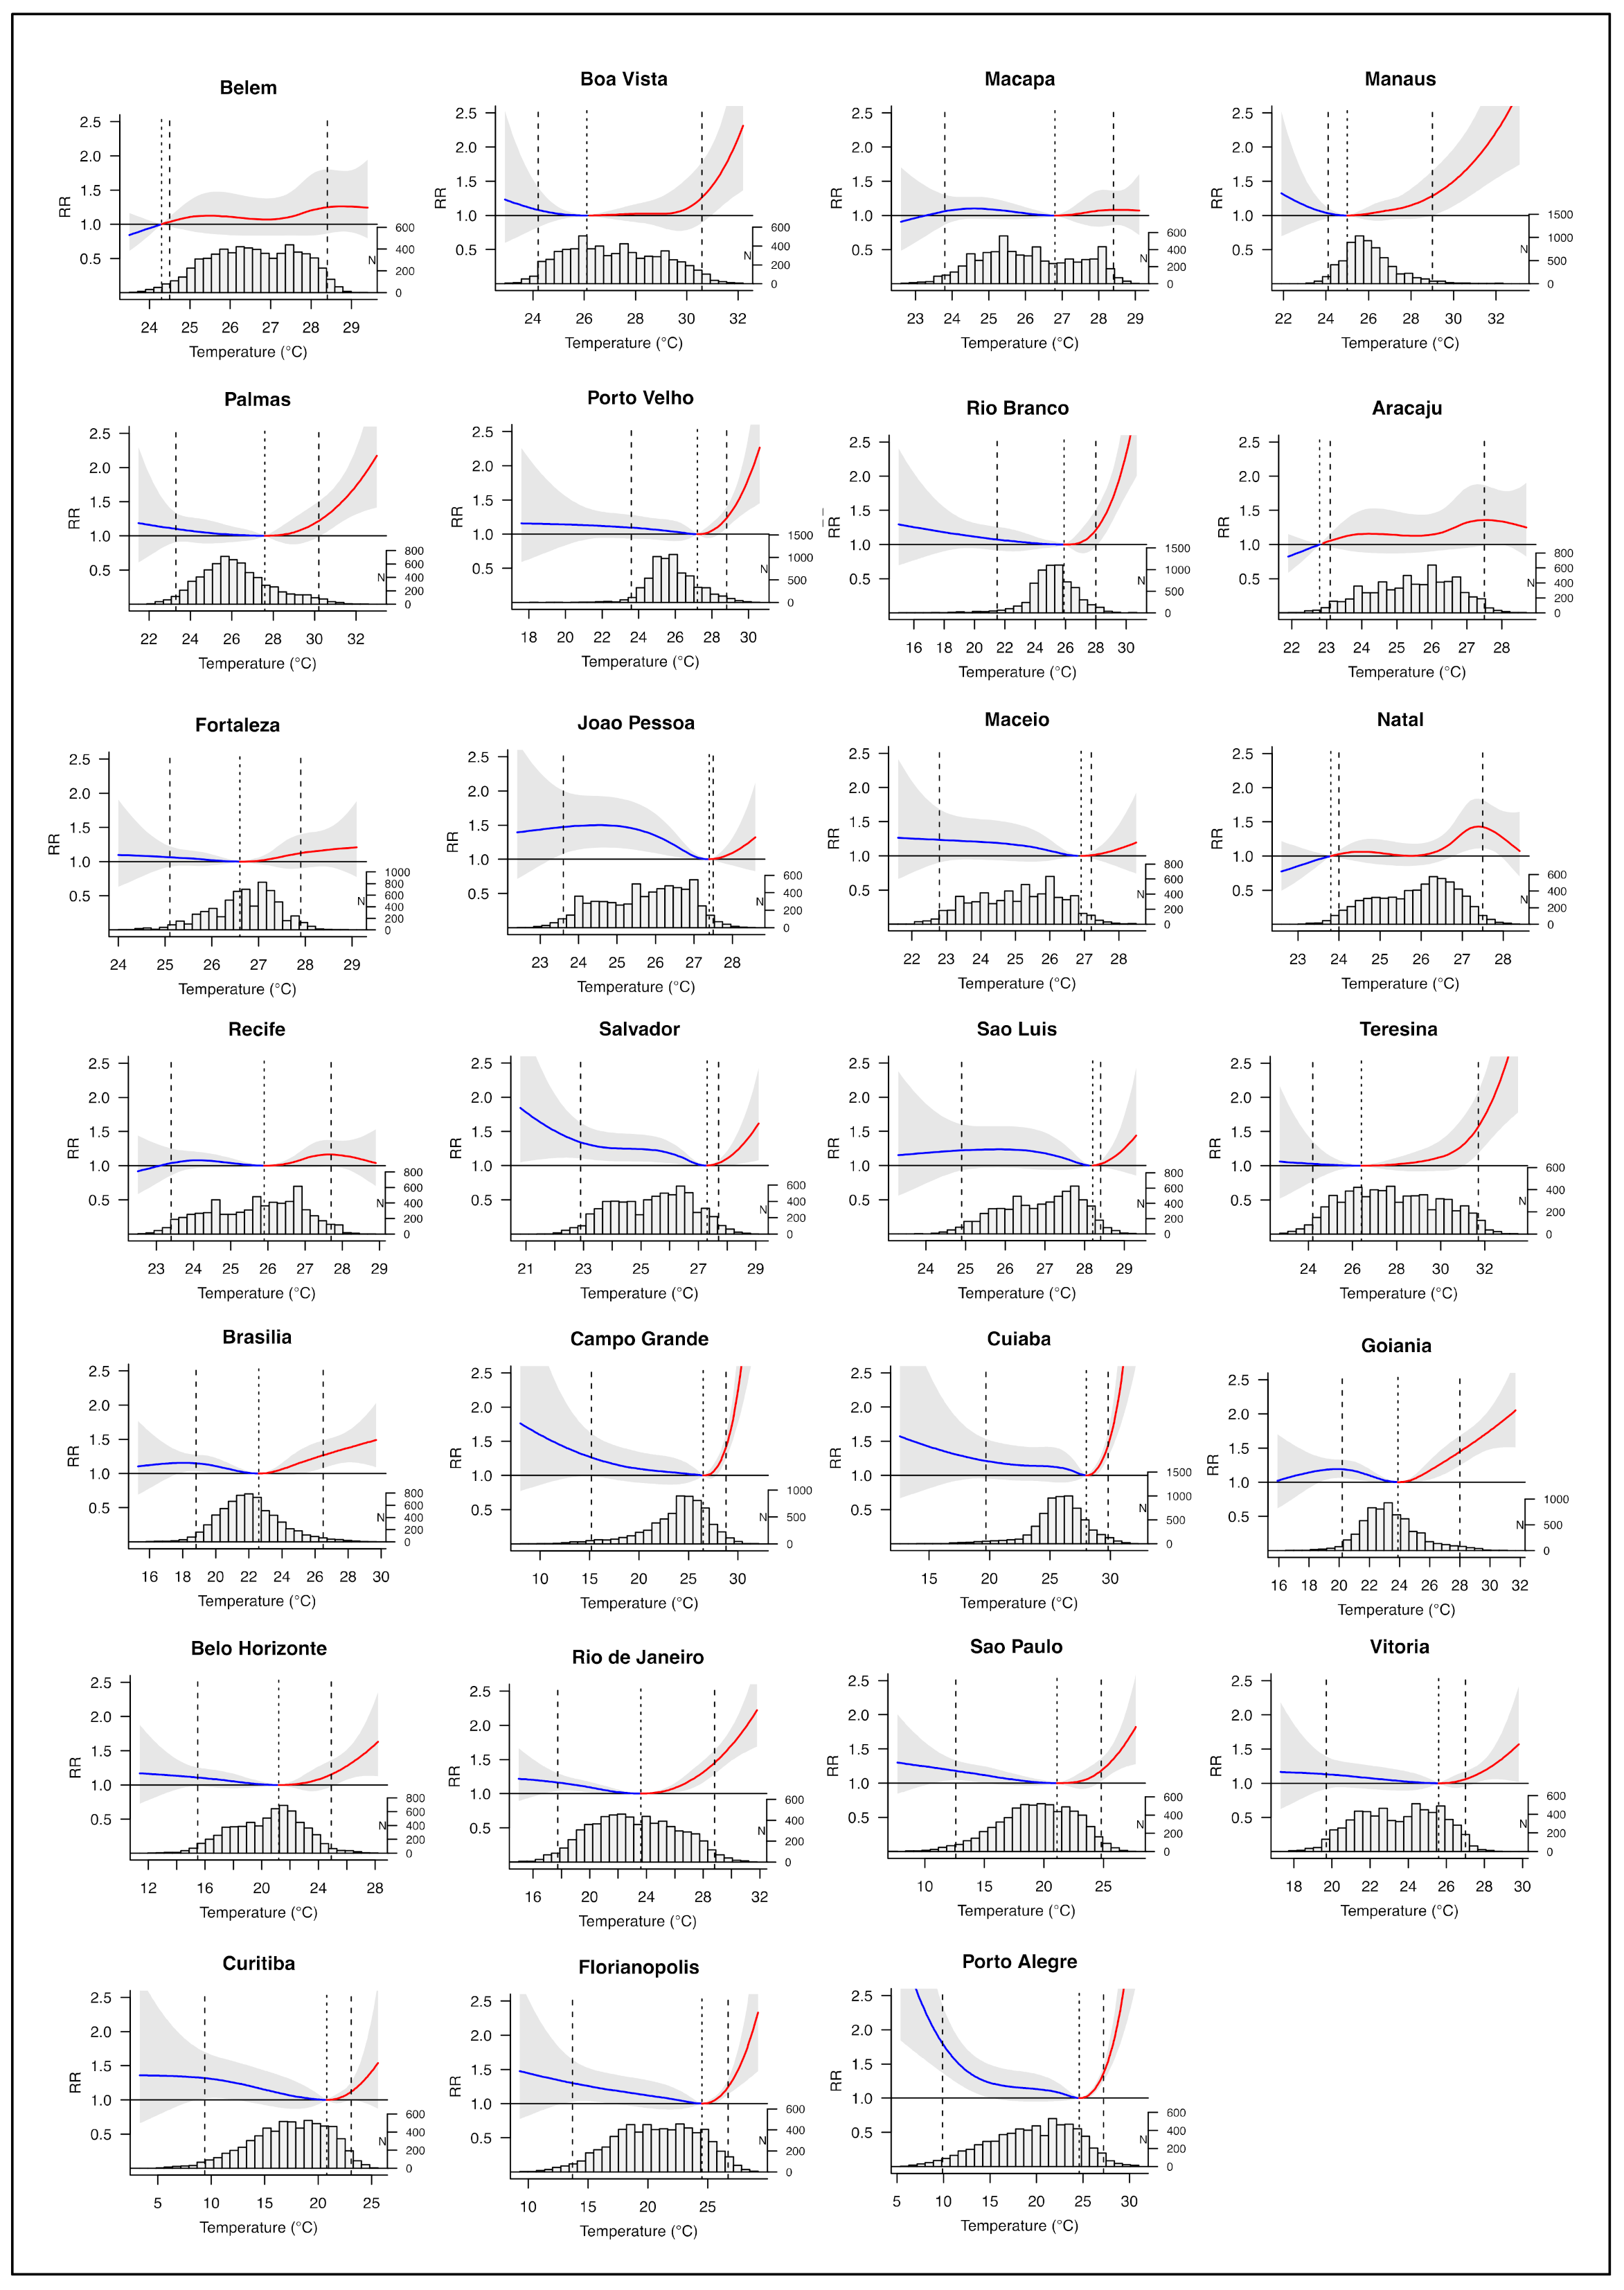
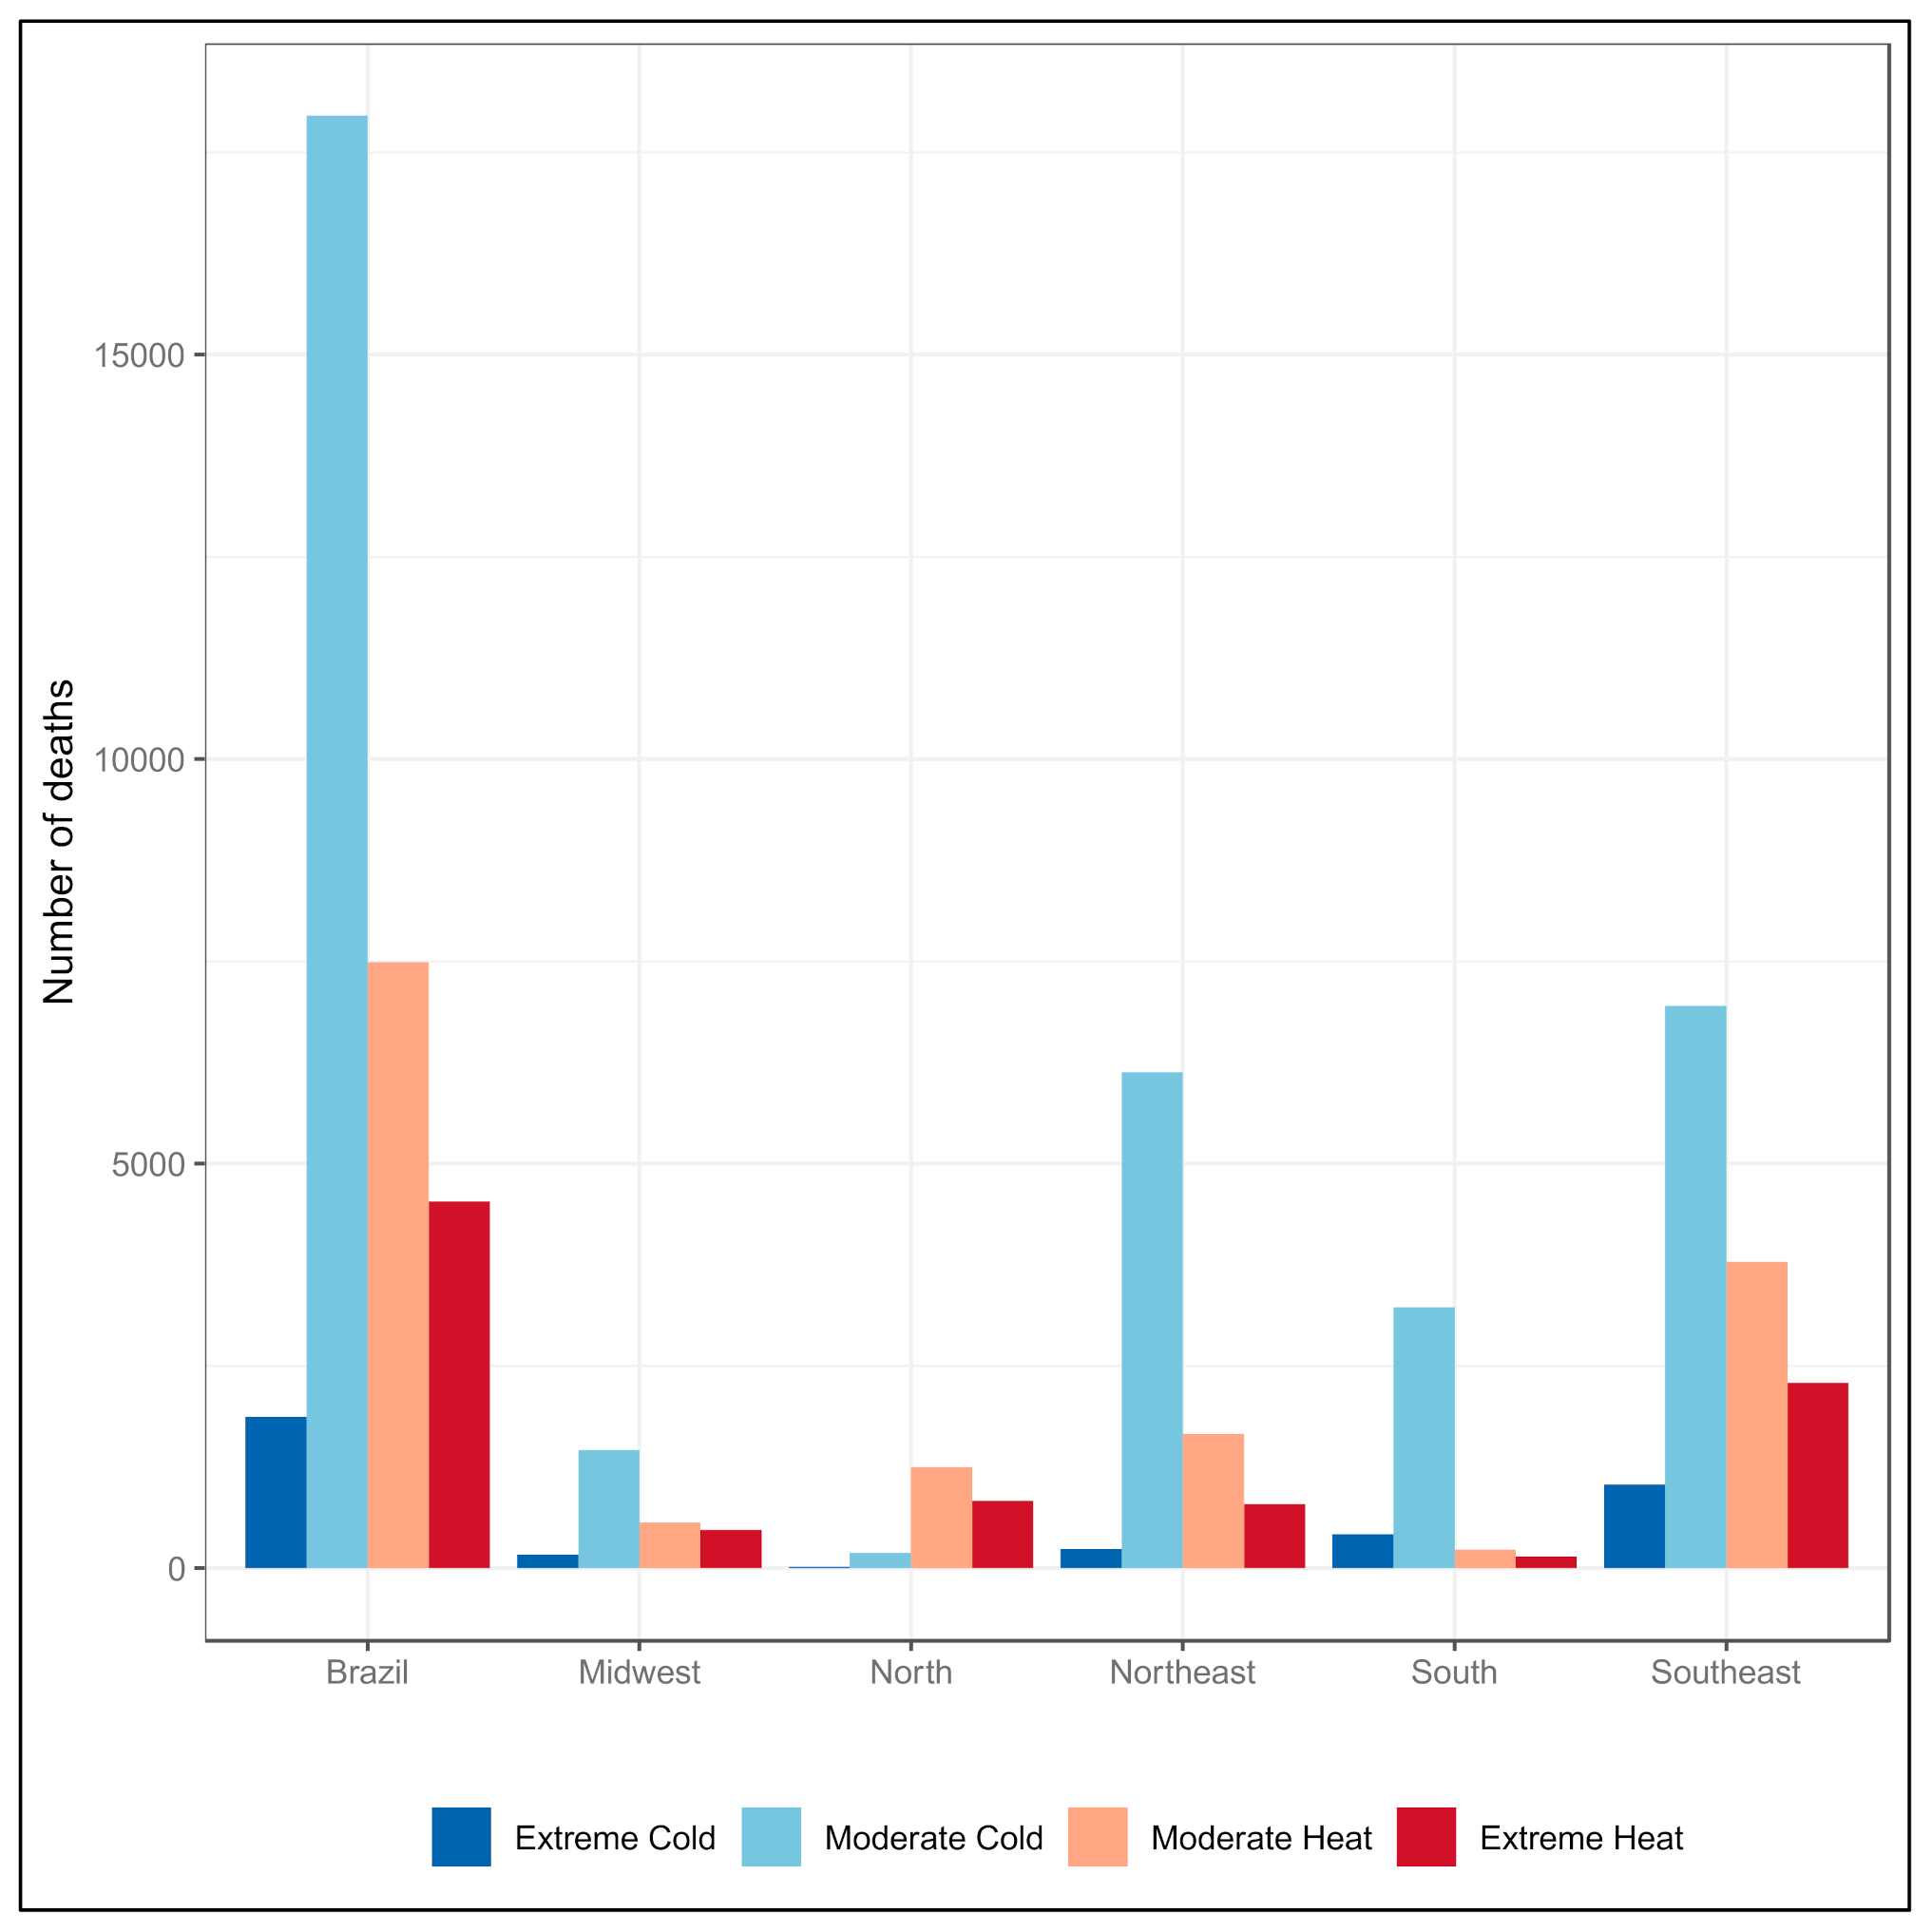
The associations between the mean daily temperature and mortality were estimated from a two-stage time series analysis method. In the first stage, a generalized linear regression model with a quasi-Poisson family, combined with a distributed lag non-linear model (DLNM), were performed for each city. Models were adjusted for seasonal and long-term trends using natural cubic splines of the time variable with city-specific degrees of freedom per year, daily relative humidity using a natural cubic spline function with 3 degrees of freedom, and day of the week as an indicator variable [21]. To evaluate non-linear and lag effects of temperature on mortality we used a DLNM. The exposure–response association was modeled using a natural cubic spline with three internal knots placed at the 10th, 75th, and 90th percentiles of the city-specific temperature distribution, regarding changes in the effect estimates at extreme temperatures; and the lag-response association was modeled with a natural cubic spline and three internal knots placed at equally spaced values in the log scale. Lag period was 21 days according to what has been described in other studies [18,19].
Other possibilities for model fitting were evaluated, varying knots placement, lags, and the number of degrees of freedom. The goodness-of-fit was assessed by visual inspection of the residuals and also based on the minimization of a modified Akaike information criteria [22].
In the second stage, a multivariate meta-regression was used to model heterogeneity between cities using city-specific mean temperature and temperature range (maximum–minimum daily temperature) as the meta-predictors. Multivariate Wald test and residual heterogeneity were evaluated through the Cochran Q test and I2 statistic. Subsequently, the best linear unbiased prediction (BLUP) was applied [23].
The results were presented as net effects across the 21 days of lag. We present the relative risks with a 95% confidence interval (CI) in each city related to local mean temperature versus minimum mortality temperature (MMT). MMT is the reference value that corresponds to the optimum temperature where the mortality risk is at its minimum, and was derived from best linear unbiased predictions in each location. The pooled overall cumulative exposure–response curve was presented for all of Brazil.
Moreover, the impacts associated with temperature exposure were estimated in terms of the attributable fraction of death [18]. We calculated the total attributable fraction and the contribution related to days with temperatures below (cold effect) or above (heat effect) the city-specific MMT. To evaluate uncertainties, empirical confidence intervals were calculated for the attributable fractions based on Monte Carlo simulations. Extreme cold and heat attributable mortality was also investigated as described by Gasparrini et al. [18].
All analyses were performed in R software (R Foundation for Statistical Computing, Vienna, Austria) [24], version 3.4.1., using the packages dlnm [21] and mvmeta [23]. Estimated effects with p < 0.05 were considered statistically significant.

3. Results

Figure 1 presents the average mortality rates for respiratory diseases in the elderly and the mean temperature from 2000 to 2017 in the capitals of Brazil. The total number of deaths in Brazil was 422,642. The mortality rates per 100,000 inhabitants were higher in the capitals of Rio Branco (769.5), Belém (743.0), Campo Grande (593.6), Porto Velho (593.6), Maceio (592.9) and Teresina (581.2).
The capitals of the North and Northeast regions had mean daily temperatures around 26 °C, higher than the capitals of the other regions. In the Midwestern region, the average temperatures ranged from 22 to 26 °C, while in the Southeast and South the average temperatures were approximately 22 °C and 19 °C, respectively. As for the temperature range, Porto Alegre was the capital with the largest variation and Fortaleza was the capital with the lowest variability in the period. Table 1 shows descriptive results according to capitals of Brazilian states.
Figure 2 shows the pooled exposure–response curve for respiratory deaths in Brazil, which suggest a J-shaped format. The minimum risk temperature in Brazil was 25.4 °C (68th percentile). The exposure to extreme heat (99th percentile vs. minimum mortality percentile—MMP) increased the risk of mortality by 27% (relative risk (RR): 1.27; 95% CI: 1.15–1.39). On the other hand, exposure to extreme cold (first percentile vs. MMP) also increased the risk of mortality (RR = 1.16; 95% CI: 1.08–1.24), but the intensity was smaller.
Results from multivariate meta-regression analysis suggest significant residual heterogeneity, even after adjustment for city-specific mean temperature and temperature range (I2 = 61.4%). Both predictors significantly modify the temperature mortality association in the full model, but the temperature range accounts for a higher proportion of heterogeneity in single-predictor models (Figure 3A,B).
The exposure–response curves of each capital estimated using BLUP are shown in Figure 4. The overall cumulative effect of 21 days of exposure was significant for all cities of the Southeast region with J-shaped curves, but higher heat effects were observed in Rio de Janeiro. In the South region, the curves were J-shaped for Florianópolis and Curitiba, while for Porto Alegre the estimated curve was U-shaped. All capitals of the Midwest region had significant results and estimated J-shaped curves, with higher heat effects in Campo Grande and Cuiabá. In the North region, most of the capitals presented J-shaped curves and cumulative effects significant only for temperatures above MMT. In the Northeast region, only Teresina presented significant heat effects with a J-shaped curve. On the other hand, Salvador and João Pessoa presented significant cold effects.
Table 2 shows the estimated attributable fraction of mortality and the MMT according to capital cities and Brazil. On average, the MMT was around 25 °C between cities, with the lowest MMT in Curitiba (20.8 °C) and the highest MMT in São Luis (28.2 °C). The total fraction of deaths in Brazil was 7.5% (95% CI: 5.4, 9.2), with the highest attributable risk caused by temperatures below 25.9 °C. This fraction varied widely between capitals, but the greatest values were mainly in the South and Northeast region, highlighting the cities Porto Alegre, João Pessoa, and Salvador. These last capitals also presented the highest cold attributable fractions. As for the fraction attributable to heat, Rio de Janeiro and Goiânia were the capitals with significant and highest fractions, although results gave Aracaju, Belém, Natal and Teresina greater fractions.
The effects of cold and heat were also separated into two components, i.e., moderate and extreme. Extreme cold was related to city-specific temperatures lower than the 2.5th percentile and extreme heat higher was related to temperatures than the 97.5th percentile. In Brazil, the fractions attributable to moderate and extreme cold were 4.3% and 0.4%, respectively. Moreover, the fractions attributable to moderate and extreme heat were 1.8% and 1.1%, respectively. Among cities, Porto Alegre showed the highest percentage fraction attributable to extreme cold and Teresina the highest percentage fraction attributable to extreme heat (Figure S1).
On the other hand, in terms of the absolute number of deaths attributable to extreme temperatures, the Southeast region had the greatest impact associated with extreme cold (deaths = 1032.9) and also with extreme heat (deaths = 2292.4). São Paulo presented the highest impact of extreme cold (deaths = 596) and Rio de Janeiro the highest impact of extreme heat (deaths = 2276) (Figure 5).

Sensitivity Analysis

Table S1 and Figure S2 in the Supplementary Materials show the total attributable fraction calculated for each capital and the entire Brazil, according to different model adjustments. In these results, natural cubic splines of the time with fixed degrees of freedom per year (df = 4) or city-specific degrees of freedom per year were used to control seasonal and long-term trends. Besides that, the exposure was adjusted by natural cubic spline or quadratic B-spline with three internal knots placed at the 10th, 75th, and 90th percentiles of city-specific temperature distributions. In general, the estimated total attributable fractions did not differ statistically between models. However, the uncertainties were greater in the models where the exposure was adjusted by quadratic B-spline.

4. Discussion

Our results show a significant association between exposure to temperature and mortality from respiratory diseases in the elderly in the Brazilian capital cities from 2000 to 2017. The associations were observed for both low and high temperatures, depending on the capital’s climatic characteristics. Most capitals had accumulated effects estimated by J or U-shaped exposure–response curves. In general, the associations were stronger, with higher relative risks, for heat. Regarding extreme temperatures in all capitals, except for the South region, extreme heat was more strongly associated with death than extreme cold.
The significant association between exposure to temperature and mortality from respiratory diseases in the elderly has also been found in other studies. In addition to the average daily temperature, other exposure indicators were evaluated, among which are the minimum daily temperature, maximum daily temperature, apparent temperature and diurnal temperature range [25,26,27].
Lin et al. [28] assessed exposure to extremes of temperature and its effects on mortality among the elderly in Taiwanese cities. In contrast to our results, the risks of death from respiratory diseases were higher for low average daily temperatures when compared to high temperatures. In China, a study in Beijing estimated the effects of two-day cumulative exposure (by moving average) to average daily temperatures in the periods of heat (April to September) and cold (October to March) on mortality from respiratory diseases in the elderly aged 65 and over [29]. In the heat period, the risk of death was 8% (95% CI: 1% to 15%) for each 5 °C increase in the two-day temperature average, and in the cold period, the increase was 13% (95% CI: 6% to 20%). Probably, the physiological resilience of individuals should influence these results, as well as past illnesses.
In the elderly, the physiological changes resulting from the aging process may hinder thermoregulation, making the physiological capacity to adapt slower in this group than in younger age groups [10]. Besides that, the elderly have co-morbidities that make them more likely to be susceptible the impacts of extreme temperatures and their variations. Han et al. [8] showed that the elderly are more vulnerable to extreme events such as heat waves than younger groups and that, on the other hand, vulnerability to cold is the same for the entire population regardless of age and sex.
In all regions of Brazil, the fractions of deaths attributable to exposure to temperature suggest an increase in the number of deaths attributable to heat and cold. The total impact of temperature was significant in capitals that have historically experienced extreme temperatures of heat and cold. The temperature range seems to be an important indicator to explain the heterogeneity among cities. In absolute numbers, the impact will be greater in the Southeast region, which concentrates 44% of the Brazilian population, with the capital Rio de Janeiro being the most impacted by the increase in temperature.
In some capitals, mainly in the northeast, the minimum mortality temperature was approximately 26 °C. This explains why the fraction attributable to heat was lower than that of cold. It is worth mentioning that the excess of deaths in the moderate cold is associated with temperatures on average between 22 °C and MMT, except for the cities in the South and Southeast. Although the results point to a higher impact of cold, it is worth mentioning that for Brazil this impact corresponds to exposure to temperatures below 26 °C differently from other places in Europe and China, where minimum temperatures were below 0 °C [6,29]. In some capitals, mainly in the North and Northeast regions, for example, the average daily temperatures were above 20 °C.
Even though the risk of death is greater at extremes of temperature, the health impact is lower in these ranges. The reason is that the frequency of days with extreme temperatures is lower. It is worth noting that with climate change, it is very likely that the temperature distribution will shift to higher temperatures and, therefore, the impact on health will be greater.
The capitals of the North and Northeast regions had a greater impact related to temperature. These are regions with high temperatures all year round and with lower temperature variability than other regions in Brazil, favoring an adaptive response of this population. Thus, as the populations residing in these places may be more used to high temperatures and for longer periods, they would be more adapted to the heat, not evolving to a more fatal outcome. This lower susceptibility to exposure to heat due to the adaptation of populations living in hot regions has already been suggested by some studies [30,31,32].
In any case, this potential adaptive response can also be associated with issues of collective vulnerability, health services and social determinants and conditions [33]. Hacon et al. [34] pointed out a precarious human development condition in the municipalities of the North and Northeast regions and with limited capacity to face climate change. Additionally, these two regions had the worst performance index of the Unified Health System in 2010 (http://i3geo.saude.gov.br/i3geo/sage/abremapa.php?id=1, last access 18 October 2019) and the highest percentage of elderly patients hospitalized in the last 12 months for 24 h or more [35,36]. Therefore, investments will be necessary to expand the response capacity of health services, such as specific outpatient services to assist patients with signs and symptoms resulting from increased temperature. For this, it will be necessary to improve the capacity of health services and the management of health services. Climate change brings new challenges for medical services, impacting mainly on elderly people in marginal living conditions.
Even though Brazil is a complex country that is territorially extensive, multifaceted, with great cultural, socioeconomic, ecological and climatic heterogeneity, the life expectancy of Brazilians is on an increasing trend. It is estimated that between 2010 and 2050, the elderly population will triple in the country, increasing the burden of disease [37]. Synergistically with an increase in life expectancy, temperature variability can intensify pre-existing morbidities and cause complications from flu and allergies, such as pneumonia, asthma, and chronic obstructive pulmonary disease (COPD), particularly on smoking people. In this sense, the results present the human health dimensions and can be strategic for the organization of health services, such as the elaboration of a care protocol, the training of health professionals and actions that favor the mitigation and/or adaptation of the population in the occurrence of extreme events. Additionally, measures and actions that improve the quality of homes are needed, to improve air circulation and, when possible, propose the use of environmental cooling equipment. In other words, this study highlights the need to develop effective policies and to mobilize public engagement to improve health services for the elderly in Brazil, because the strengthening of public health services needs to be a central component of adaptation to climate change.
This study has some limitations, including the lack of adjustment of risk estimates for air pollutants and infectious diseases, such as influenza epidemics that are expected in cold months, mainly in the Southern region. However, these variables apparently act as mediators of the causal pathways between temperature and mortality for respiratory diseases [38]. At any rate, some studies have already studied the role of these variables in the relationship between temperature and health outcomes [14,39,40]. O’Neil et al. [30], for example, showed that the associations between climate and health persisted even with control of air pollution and respiratory epidemics, but risk assessment and adaptation programs to climate change are better when the analyses consider these factors. In addition, the risk of mortality from respiratory diseases was higher at high temperatures, when the level of pollution (PM10) was around 60 μg/m3, as shown by Pinheiros et al. [14]. Additional, one should consider synergic effects, such as high temperatures raising the levels of ozone and other air pollutants that exacerbate respiratory disease.

5. Conclusions

Our results show a significant impact of non-optimal temperature on the respiratory health of the elderlies living in Brazil. The associations were observed for both low and high temperatures, depending on the city’s climatic characteristics. Regarding extreme temperatures, except for the South region, extreme heat was more strongly associated with death than extreme cold. Our results may contribute to national climate change policy, because the health impact of non-optimal temperatures on the elderly is evidenced, which allows the decision makers to implement proactive action related to respiratory diseases in the cities that have critical temperature variations. Considering the diversity of the various regions of the country, experimental studies seeking signs and early symptoms of the impact of temperature on the health of the elderly, both from heat and cold, are recommended.

Supplementary Materials

The following are available online at https://0-www-mdpi-com.brum.beds.ac.uk/article/10.3390/ijerph18115550/s1, Figure S1: Moderate and extreme attributable fraction of mortality (%). Brazil, 2000 to 2017, Figure S2: Total attributable fraction (AF) of mortality (%) according to model adjustment. Brazil, 2000 to 2017, Table S1: Total attributable fraction (AF) of mortality (%), according to model adjustment, by capital cities and the entire Brazil, from 2000 to 2017.

Author Contributions

Conceptualization, L.d.S.V.J., B.F.A.d.O., R.S., A.G. and S.d.S.H.; Data curation, L.d.S.V.J. and B.F.A.d.O.; Formal analysis, L.d.S.V.J.; Funding acquisition, S.d.S.H.; Writing—original draft, L.d.S.V.J.; Writing—review and editing, L.d.S.V.J., B.F.A.d.O., R.S., A.G. and S.d.S.H. All authors have read and agreed to the published version of the manuscript.

Funding

This work was supported by the Brazilian Research Network on Global Climate Change FINEP/ Rede CLIMA grant number 01.13.0353-00.

Institutional Review Board Statement

Not applicable.

Informed Consent Statement

Not applicable.

Data Availability Statement

Publicly available datasets were analyzed in this study. This data canbe found here: https://datasus.saude.gov.br.

Acknowledgments

The authors thank Washington Junger and Ismael Henrique Silveira from UERJ/ IMS for the help in information technology, the Post-Graduate Program of Public Health and Environment at National School of Public Health/FIOCRUZ and the National Council of Technological and Scientific Development (CNPq, Brazil) for the postdoctoral internship. This paper is a contribution the Brazilian Research Network on Global Climate Change FINEP/ Rede CLIMA (Grant 01.13.0353-00). This work received kind support from Rochelle Schneider and Antonio Gasparrini. This work was generated using Copernicus Climate Change Service (C3S) information [2000–2017]. The authors would like to thank the European Centre for Medium-Range Weather Forecasts (ECMWF) that implements the C3S on behalf of the European Union.

Conflicts of Interest

The authors declare no conflict of interest.

References

  1. Rossati, A. Global Warming and Its Health Impact. Int. J. Occup. Environ. Med. 2017, 8, 7–20. [Google Scholar] [CrossRef] [PubMed] [Green Version]
  2. IPCC. Global Warming of 1.5 °C. An IPCC Special Report on The Impacts of Global Warming of 1.5 °C above Pre-Industrial Levels and Related Global Greenhouse Gas Emission Pathways, in The Context of Strengthening The Global Response to The Threat of Climate Change, Sustainable Development, And Efforts To Eradicate Poverty; Masson-Delmotte, V., Zhai, P., Pörtner, H.-O., Roberts, D., Skea, J., Shukla, P.R., Pirani, A., Moufouma-Okia, W., Péan, C., Pidcock, R., et al., Eds.; IPCC: Geneva, Switzerland, 2018; Available online: https://www.ipcc.ch/sr15/download/#full (accessed on 3 May 2021).
  3. De Sousa, T.C.M.; Amancio, F.; Hacon, S.D.S.; Barcellos, C. Doenças sensíveis ao clima no Brasil e no mundo: Revisão sistemática. Rev. Panam. Salud Pública 2018, 42, e85. [Google Scholar] [CrossRef] [PubMed] [Green Version]
  4. Gasparrini, A.; Armstrong, B.; Kovats, S.; Wilkinson, P. The effect of high temperatures on cause-specific mortality in England and Wales. Occup. Environ. Med. 2011, 69, 56–61. [Google Scholar] [CrossRef] [PubMed]
  5. Zanobetti, A.; O’Neill, M.S. Longer-Term Outdoor Temperatures and Health Effects: A Review. Curr. Epidemiol. Rep. 2018, 5, 125–139. [Google Scholar] [CrossRef]
  6. Antunes, L.; Silva, S.P.; Marques, J.; Nunes, B.; Antunes, S. The effect of extreme cold temperatures on the risk of death in the two major Portuguese cities. Int. J. Biometeorol. 2016, 61, 127–135. [Google Scholar] [CrossRef]
  7. Fuhrmann, C.M.; Sugg, M.M.; Konrad, C.E.; Waller, A. Impact of Extreme Heat Events on Emergency Department Visits in North Carolina (2007–2011). J. Community Health 2015, 41, 146–156. [Google Scholar] [CrossRef]
  8. Han, J.; Liu, S.; Zhang, J.; Zhou, L.; Fang, Q.; Zhang, J.; Zhang, Y. The impact of temperature extremes on mortality: A time-series study in Jinan, China. BMJ Open 2017, 7, e014741. [Google Scholar] [CrossRef]
  9. Son, J.-Y.; Liu, J.C.; Bell, M.L. Temperature-related mortality: A systematic review and investigation of effect modifiers. Environ. Res. Lett. 2019, 14, 073004. [Google Scholar] [CrossRef]
  10. Bunker, A.; Wildenhain, J.; Vandenbergh, A.; Henschke, N.; Rocklöv, J.; Hajat, S.; Sauerborn, R. Effects of Air Temperature on Climate-Sensitive Mortality and Morbidity Outcomes in the Elderly; a Systematic Review and Meta-analysis of Epidemiological Evidence. EBioMedicine 2016, 6, 258–268. [Google Scholar] [CrossRef] [Green Version]
  11. Yu, W.; Mengersen, K.; Wang, X.; Ye, X.; Guo, Y.; Pan, X.; Tong, S. Daily average temperature and mortality among the elderly: A meta-analysis and systematic review of epidemiological evidence. Int. J. Biometeorol. 2011, 56, 569–581. [Google Scholar] [CrossRef] [Green Version]
  12. Gouveia, N.; Hajat, S.; Armstrong, B. Socioeconomic differentials in the temperature–mortality relationship in São Paulo, Brazil. Int. J. Epidemiol. 2003, 32, 390–397. [Google Scholar] [CrossRef] [Green Version]
  13. Silva, E.N.; Ribeiro, H. Impact of urban atmospheric environment on hospital admissions in the elderly. Rev. Saude Publica 2002, 46, 694–701. [Google Scholar] [CrossRef] [Green Version]
  14. Pinheiro, S.D.L.L.D.A.; Saldiva, P.H.N.; Schwartz, J.; Zanobetti, A. Isolated and synergistic effects of PM10 and average temperature on cardiovascular and respiratory mortality. Rev. Saúde Pública 2014, 48, 881–888. [Google Scholar] [CrossRef] [Green Version]
  15. Chou, S.C.; Lyra, A.D.A.; Mourão, C.; Dereczynski, C.P.; Pilotto, I.L.; Gomes, J.; Bustamante, J.; Tavares, P.; Silva, A.; Rodrigues, D.; et al. Assessment of Climate Change over South America under RCP 4.5 and 8.5 Downscaling Scenarios. Am. J. Clim. Chang. 2014, 3, 512–527. [Google Scholar] [CrossRef] [Green Version]
  16. Sanches, F.; Verdum, R.; Fisch, G.; Gass, S.L.B.; Rocha, V.M. Extreme Rainfall Events in the Southwest of Rio Grande do Sul (Brazil) and Its Association with the Sandization Process. Am. J. Clim. Chang. 2019, 8, 441–453. [Google Scholar] [CrossRef] [Green Version]
  17. De Carvalho, A.A.; Montenegro, A.A.D.A.; Da Silva, H.P.; Lopes, I.; De Morais, J.E.F.; Da Silva, T.G.F. Trends of rainfall and temperature in Northeast Brazil. Rev. Bras. Eng. Agrícola Ambient. 2020, 24, 15–23. [Google Scholar] [CrossRef] [Green Version]
  18. Gasparrini, A.; Guo, Y.; Hashizume, M.; Lavigne, E.; Zanobetti, A.; Schwartz, J.; Tobias, A.; Tong, S.; Rocklöv, J.; Forsberg, B.; et al. Mortality risk attributable to high and low ambient temperature: A multicountry observational study. Lancet 2015, 386, 369–375. [Google Scholar] [CrossRef]
  19. Silveira, I.H.; Oliveira, B.F.A.; Cortes, T.R.; Junger, W.L. The effect of ambient temperature on cardiovascular mortality in 27 Brazili-an cities. Sci. Total Environ. 2019, 691, 996–1004. [Google Scholar] [CrossRef]
  20. Dee, D.P.; Uppala, S.M.; Simmons, A.J.; Berrisford, P.; Poli, P.; Kobayashi, S.; Andrae, U.; Balmaseda, M.A.; Balsamo, G.; Bauer, P.; et al. The ERA-Interim reanalysis: Configuration and performance of the data assimilation system. Q. J. R. Meteorol. Soc. 2011, 137, 553–597. [Google Scholar] [CrossRef]
  21. Gasparrini, A. Distributed lag linear and non-linear models in R: The package dlnm. J. Stat. Softw. 2011, 43, 1–20. Available online: http://www.jstatsoft.org/v43/i08/ (accessed on 3 May 2021). [CrossRef] [Green Version]
  22. Peng, R.D.; Dominici, F.; Louis, T.A. Model choice in time series studies of air pollution and mortality. J. R. Stat. Soc. Ser. A Stat. Soc. 2006, 169, 179–203. [Google Scholar] [CrossRef] [Green Version]
  23. Gasparrini, A.; Armstrong, B.; Kenward, M.G. Multivariate meta-analysis for non-linear and other multi-parameter associations. Stat. Med. 2012, 31, 3821–3839. [Google Scholar] [CrossRef] [PubMed] [Green Version]
  24. R Core Team. R: A Language and Environment for Statistical Computing; R Foundation for Statistical Computing, Vienna, Austria. 2013. Available online: http://www.R-project.org/ (accessed on 11 March 2021).
  25. Carreras, H.; Zanobetti, A.; Koutrakis, P. Effect of daily temperature range on respiratory health in Argentina and its modification by impaired socio-economic conditions and PM10 exposures. Environ. Pollut. 2015, 206, 175–182. [Google Scholar] [CrossRef] [PubMed] [Green Version]
  26. Lin, S.; Insaf, T.Z.; Luo, M.; Hwang, S.-A. The effects of ambient temperature variation on respiratory hospitalizations in summer, New York State. Int. J. Occup. Environ. Health 2012, 18, 188–197. [Google Scholar] [CrossRef] [PubMed]
  27. Michelozzi, P.; Accetta, G.; De Sario, M.; D’Ippoliti, D.; Marino, C.; Baccini, M.; Biggeri, A.; Anderson, H.R.; Katsouyanni, K.; Ballester, F.; et al. High Temperature and Hospitalizations for Cardiovascular and Respiratory Causes in 12 European Cities. Am. J. Respir. Crit. Care Med. 2009, 179, 383–389. [Google Scholar] [CrossRef] [PubMed] [Green Version]
  28. Lin, Y.-K.; Ho, T.-J.; Wang, Y.-C. Mortality risk associated with temperature and prolonged temperature extremes in elderly populations in Taiwan. Environ. Res. 2011, 111, 1156–1163. [Google Scholar] [CrossRef] [PubMed]
  29. Liu, L.; Breitner, S.; Pan, X.; Franck, U.; Leitte, A.M.; Wiedensohler, A.; Von Klot, S.; Wichmann, H.-E.; Peters, A.; Schneider, A. Associations between air temperature and cardio-respiratory mortality in the urban area of Beijing, China: A time-series analysis. Environ. Health 2011, 10, 51. [Google Scholar] [CrossRef] [PubMed] [Green Version]
  30. Basu, R. High ambient temperature and mortality: A review of epidemiologic studies from 2001 to 2008. Environ. Health 2009, 8, 40. [Google Scholar] [CrossRef] [PubMed] [Green Version]
  31. Ye, X.; Wolff, R.; Yu, W.; Vaneckova, P.; Pan, X.; Tong, S. Ambient temperature and morbidity: A review of epidemiological evi-dence. Environ. Health Perspect. 2012, 120, 19–28. [Google Scholar] [CrossRef] [Green Version]
  32. Zhao, Q.; Li, S.; Coelho, M.D.S.Z.S.; Saldiva, P.H.N.; Xu, R.; Huxley, R.R.; Abramson, M.J.; Guo, Y. Ambient heat and hospitalisation for COPD in Brazil: A nationwide case-crossover study. Thorax 2019, 74, 1031–1036. [Google Scholar] [CrossRef]
  33. Marandola, E., Jr.; Hogan, D.J. Vulnerabilidade do lugar vs. vulnerabilidade sociodemográfica: Implicações metodológicas de uma velha questão. Rev. Bras. Estud. Popul. 2009, 26, 161–181. [Google Scholar]
  34. Hacon, S.; Barcellos, C.; Xavier, D.R.; Gracie, R.; Oliveira, B.F.A.; Artaxo, P.; Ignotti, E. Capítulo 5: Saúde. Mudanças Climáticas em Rede: Um Olhar Interdisciplinar; Nobre, C.A., Marengo, J.A., Eds.; INCT: São José dos Campos, SP, Brazil, 2016. [Google Scholar]
  35. IBGE. Pesquisa Nacional de Saúde: 2013: Ciclos de Vida: Brasil e Grandes Regiões/IBGE, Coordenação deTrabalho e Rendimento; IBGE: Rio de Janeiro, Brazil, 2015.
  36. Stopa, S.R.; Malta, D.C.; Monteiro, C.N.; Szwarcwald, C.L.; Goldbaum, M.; Galvão Cesar, C.L. Use of and access to health services in Brazil, 2013 National Health Survey. Rev. Saude Publica 2017, 51, 3s. [Google Scholar] [CrossRef]
  37. da Silveira, D.P.; Araujo, D.V.; Gomes, G.H.G.; Lima, K.C.; Estrella, K.; Oliveira, M.; Veras, R.; Neves, R.V.d.; Assalim, V.M. Idoso Na Saúde Suplementar: Uma Urgência Para A Saúde da Sociedade e Para A Sustentabilidade do Setor. Rio de Janeiro: Agência Nacional de Saúde Suplementar. 2016. Available online: http://www.ans.gov.br/images/stories/Materiais_para_pesquisa/Materiais_por_assunto/web_final_livro_idosos.pdf (accessed on 13 July 2020).
  38. Buckley, J.P.; Samet, J.M.; Richardson, D.B. Does air pollution confound studies of temperature? Epidemiology 2014, 25, 242–245. [Google Scholar] [CrossRef]
  39. O’Neill, M.S.; Hajat, S.; Zanobetti, A.; Ramirez-Aguilar, M.; Schwartz, J. Impact of control for air pollution and respiratory epidem-ics on the estimated associations of temperature and daily mortality. Int. J. Biometeorol. 2005, 50, 121–129. [Google Scholar] [CrossRef] [Green Version]
  40. Anderson, G.B.; Dominici, F.; Wang, Y.; McCormack, M.C.; Bell, M.L.; Peng, R.D. Heat-related Emergency Hospitalizations for Respiratory Diseases in the Medicare Population. Am. J. Respir. Crit. Care Med. 2013, 187, 1098–1103. [Google Scholar] [CrossRef] [Green Version]
Figure 1. Mean temperature (ERA5-Land) and mortality rate (per 100,000 inhabitants) by capitals. Brazil, from 2000 to 2017.
Ijerph 18 05550 g001
Figure 2. Pooled overall cumulative exposure–response association curve between temperature and mortality. Brazil, capitals, 2000 to 2017. Note: dotted line is the percentile of the minimum risk temperature; dashed lines at 1st and 99th percentiles of the temperature distribution.
Ijerph 18 05550 g002
Figure 3. Pooled overall cumulative exposure–response association curve between Table 2. 5th and 75th percentiles of the meta-variables temperature range (A) and mean (B). Brazil, capitals, 2000 to 2017.
Ijerph 18 05550 g003
Figure 4. Overall cumulative exposure–response association in Brazilian capitals, 2000 to 2017. Note: exposure–response associations as best linear unbiased prediction (with 95% empirical CI, shaded grey), with related temperature distributions. Solid grey lines are minimum mortality temperatures and dashed grey lines are the 2.5th and 97.5th percentiles. RR = relative risk. N = number of deaths.
Ijerph 18 05550 g004
Figure 5. Number of deaths attributable to moderate and extreme temperatures according to region. Brazil, 2000 to 2017.
Ijerph 18 05550 g005
Table 1. Descriptive statistics, total number of deaths and temperature distribution, by state capitals and the entire Brazil, 2000 to 2017.
CitiesTotal Deaths
(n)
Temperature (°C)
AverageMinimumP25P50P75Maximum
Midwest
Brasilia12,51022.115.320.821.923.1529.7
Campo Grande754423.98.022.324.526.032.1
Cuiaba401125.812.624.825.927.132.3
Goiânia11,93223.415.922.123.224.431.7
North
Belem15,56926.623.525.826.627.529.4
Boa Vista97027.222.925.727.028.632.2
Macapa146326.122.625.126.027.229.1
Manaus862826.021.925.225.826.733.1
Palmas59326.221.525.026.027.233.0
Porto Velho234425.917.625.025.726.630.6
Rio Branco256825.115.024.425.226.130.7
Northeast
Aracaju373525.421.924.525.626.428.7
Fortaleza19,31526.724.026.226.827.229.1
João Pessoa619925.722.424.825.926.628.6
Maceió711525.121.624.125.22628.5
Natal617625.922.625.126.126.728.4
Recife16,59925.722.524.725.826.628.9
Salvador19,44225.420.824.325.526.529.1
São Luis560226.923.326.127.027.729.3
Teresina568627.822.726.127.729.533.5
South
Curitiba13,17517.33.314.917.620.125.6
Florianopolis265120.79.318.220.823.529.2
Porto Alegre14,88819.55.416.320.023.231.0
Southeast
Belo Horizonte20,27420.411.418.520.722.228.2
Rio de Janeiro90,88723.215.020.823.025.531.8
São Paulo121,45919.47.717.319.621.827.7
Vitória130723.517.321.823.625.229.8
Brazil422,64224.33.322.925.226.633.5
Table 2. Attributable fraction (AF) of mortality (%) and minimum mortality temperature (MMT) by capital cities and the entire Brazil, 2000 to 2017.
CitiesMMTTotalColdHeat
%°CAF%(95% IC)AF%(95% IC)AF%(95% IC)
Midwest
Brasília6522.66.02(1.56, 10.09)3.4(−0.22, 6.47)2.62(0.18, 4.77)
Campo Grande8126.56.84(−5.48, 16.66)4.64(−7.29, 14.88)2.2(1.07, 3.20)
Cuiabá8728.010.69(−5.56, 22.69)8.35(−8.05, 21.53)2.34(1.57, 3.02)
Goiânia6623.98.08(3.47, 12.76)4.33(1.05, 7.54)3.75(1.84, 5.60)
North
Belém124.310.06(−18.81, 29.89)−0.05(−0.16, 0.04)10.11(−15.26, 29.90)
Boa Vista3326.13.55(−5.85, 11.54)0.85(−2.67, 3.7)2.7(−6.78, 9.49)
Macapá6726.85.15(−0.42, 10.77)4.00(−3.48, 10.5)1.15(−3.38, 4.97)
Manaus18254.55(−2.50, 10.8)0.22(−0.35, 0.81)4.33(−2.95, 10.51)
Palmas8027.64.12(−3.30, 10.84)2.46(−6.66, 10.78)1.66(−1.07, 3.98)
Porto Velho8527.25.11(−4.64, 13.45)3.77(−7.4, 14.27)1.34(0.33, 2.31)
Rio Branco7025.92.73(−1.68, 6.37)1.01(−2.98, 4.77)1.72(−1.7, 4.60)
Northeast
Aracajú122.814.55(−9.66, 33.21)−0.05(−0.14, 0.03)14.6(−11.5, 32.00)
Fortaleza3826.62.91(−2.55, 7.63)0.87(−1.34, 2.93)2.05(−3.04, 6.2)
Joao Pessoa9627.422.95(8.94, 34.16)22.84(8.64, 34.79)0.11(−0.14, 0.31)
Maceió9526.911.53(−6.16, 25.75)11.44(−6.32, 25.42)0.09(−0.25, 0.37)
Natal123.89.3(−7.37, 22.18)−0.06(−0.17, 0.05)9.36(−6.25, 21.97)
Recife5225.94.96(0.54, 8.81)2.12(−1.4, 5.59)2.84(−0.93, 6.31)
Salvador9327.315.25(5.04, 24.57)14.92(4.09, 23.28)0.33(0.01, 0.63)
Sao Luís9328.212.86(−3.51, 25.64)12.61(−4.67, 25.18)0.25(−0.14, 0.63)
Teresina2926.46.85(−2.11, 14.35)0.28(−2.79, 2.91)6.57(−1.37, 13.41)
South
Curitiba8220.89.8(−4.12, 21.13)9.14(−4.05, 21.25)0.66(−0.18, 1.43)
Florianopolis8424.511.24(−0.58, 22.22)9.82(−2.68, 20.63)1.41(0.82, 1.97)
Porto Alegre8624.616.36(4.41, 26.63)14.65(1.88, 25.19)1.70(1.26, 2.08)
Southeast
Belo Horizonte5821.23.7(−1.20, 8.01)2.33(−1.43, 6.12)1.37(−1.74, 3.99)
Rio de Janeiro5623.67.91(4.56, 10.99)3.33(0.83, 5.6)4.57(2.31, 6.45)
São Paulo6721.14.99(1.07, 8.59)3.64(−0.84, 7.72)1.35(−0.89, 3.55)
Vitória8125.64.71(−4.75, 12.65)4.25(−5.89, 13.88)0.46(−0.68, 1.5)
Brazil67 *25.9 *7.54(5.36, 9.21)4.69(2.94, 6.17)2.84(1.45, 3.95)
* Median.
Publisher’s Note: MDPI stays neutral with regard to jurisdictional claims in published maps and institutional affiliations.

