
Comparison of Joint Effect of Acute and Chronic Toxicity for Combined Assessment of Heavy Metals on Photobacterium sp.NAA-MIE

 ,
,
Abstract
:1. Introduction
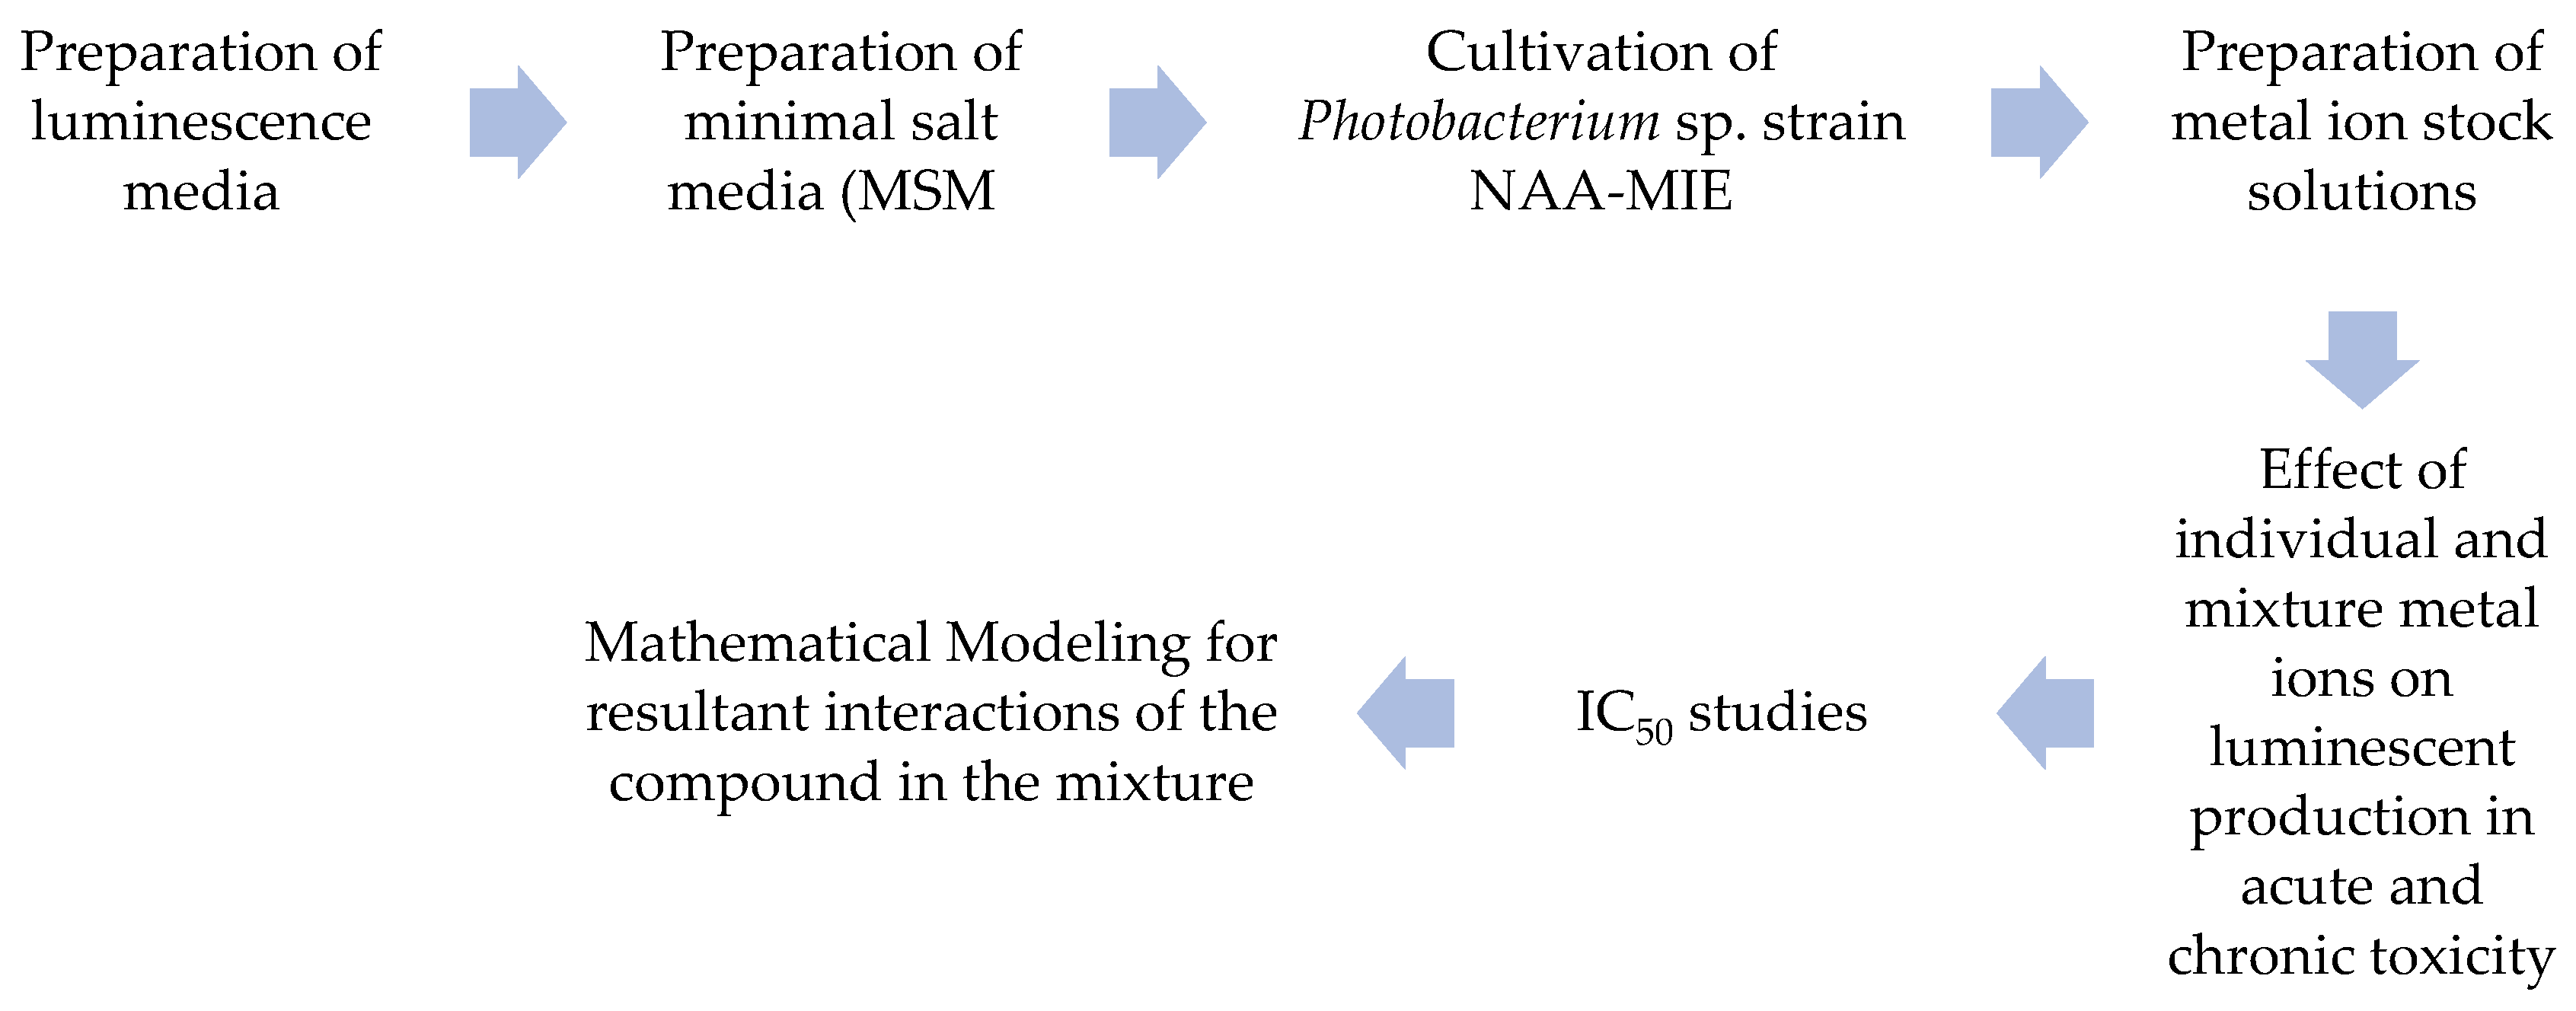
2. Materials and Methods
2.1. Preparation of Bacterial Culture and Media for Toxicity Assay
2.2. Preparation of Heavy Metal Solutions
2.3. Acute and Chronic Toxicity Assay of Single Metals
2.4. Acute and Chronic Toxicity Assay of Metal Mixture
2.5. Data Analysis
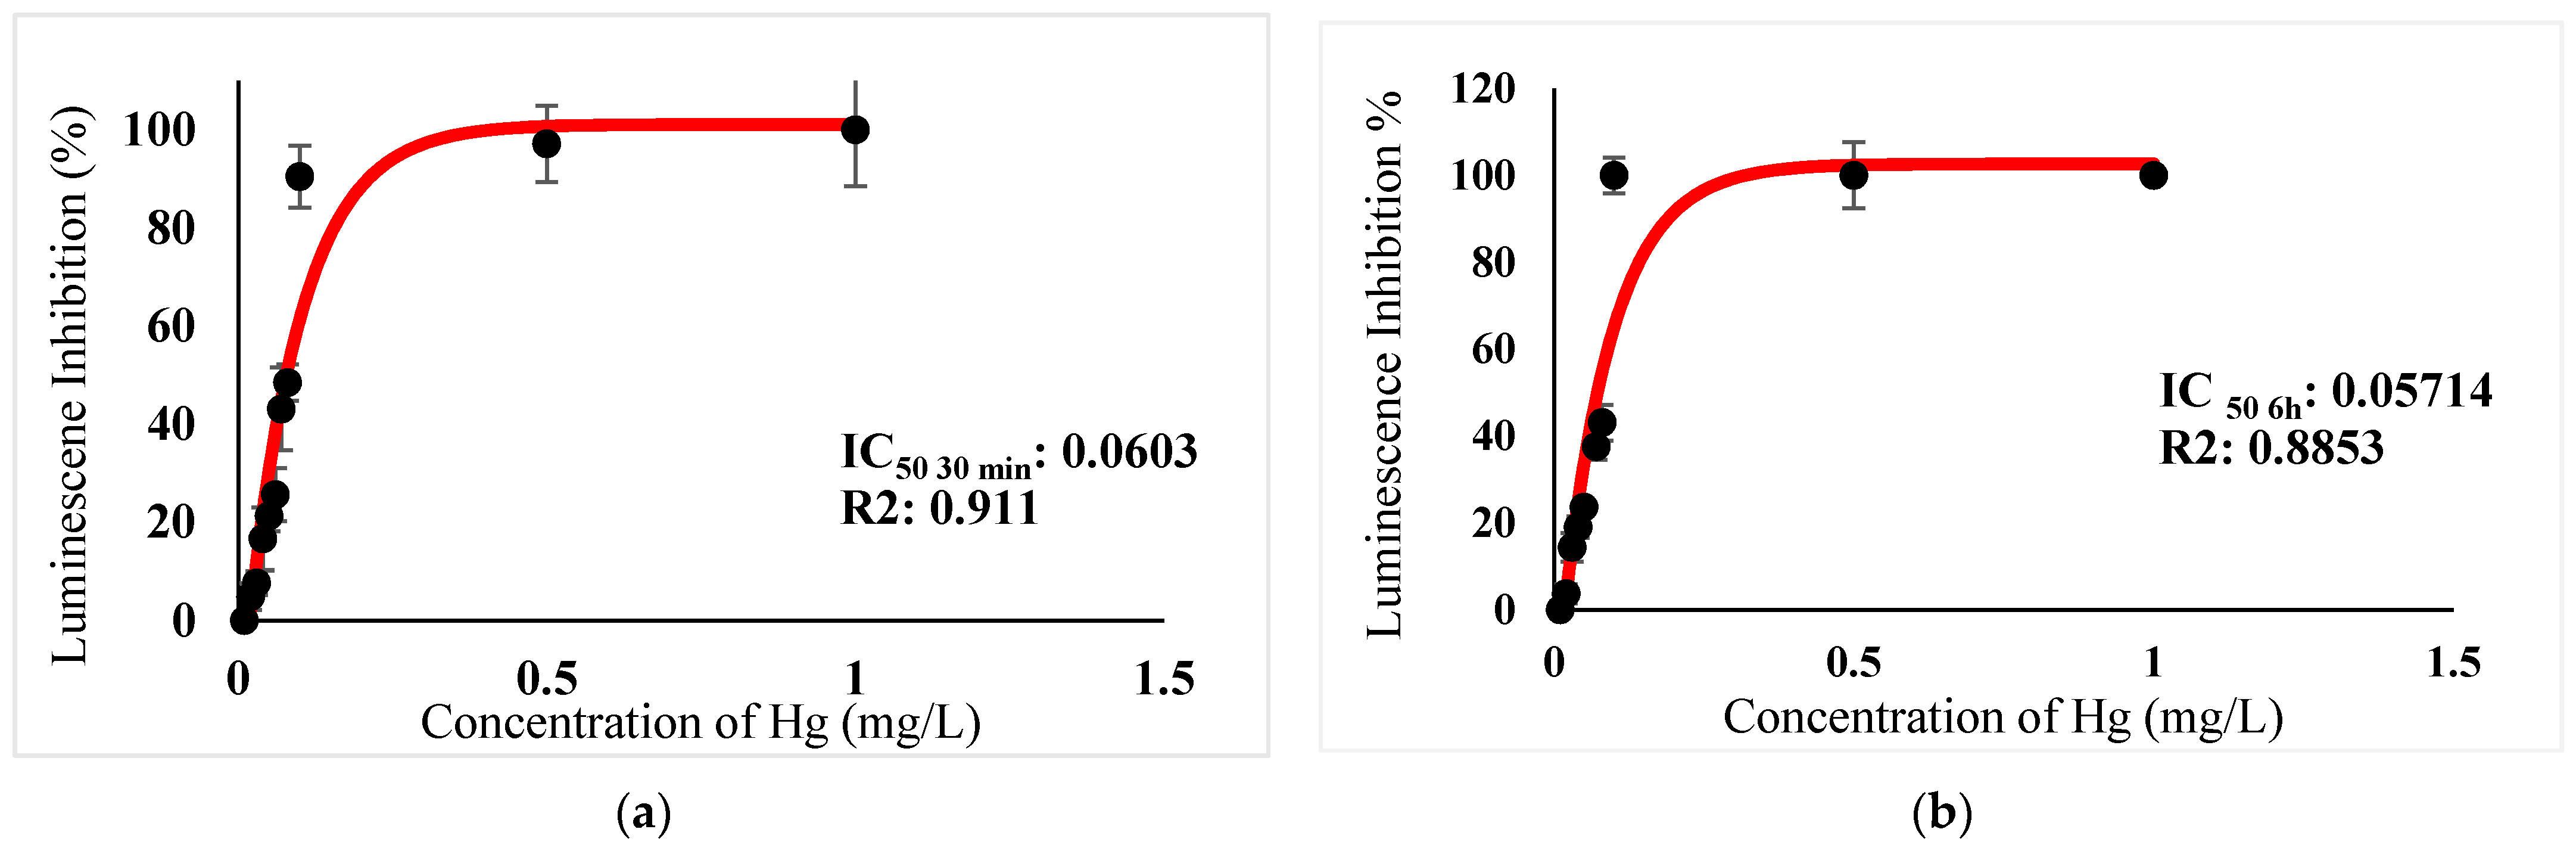
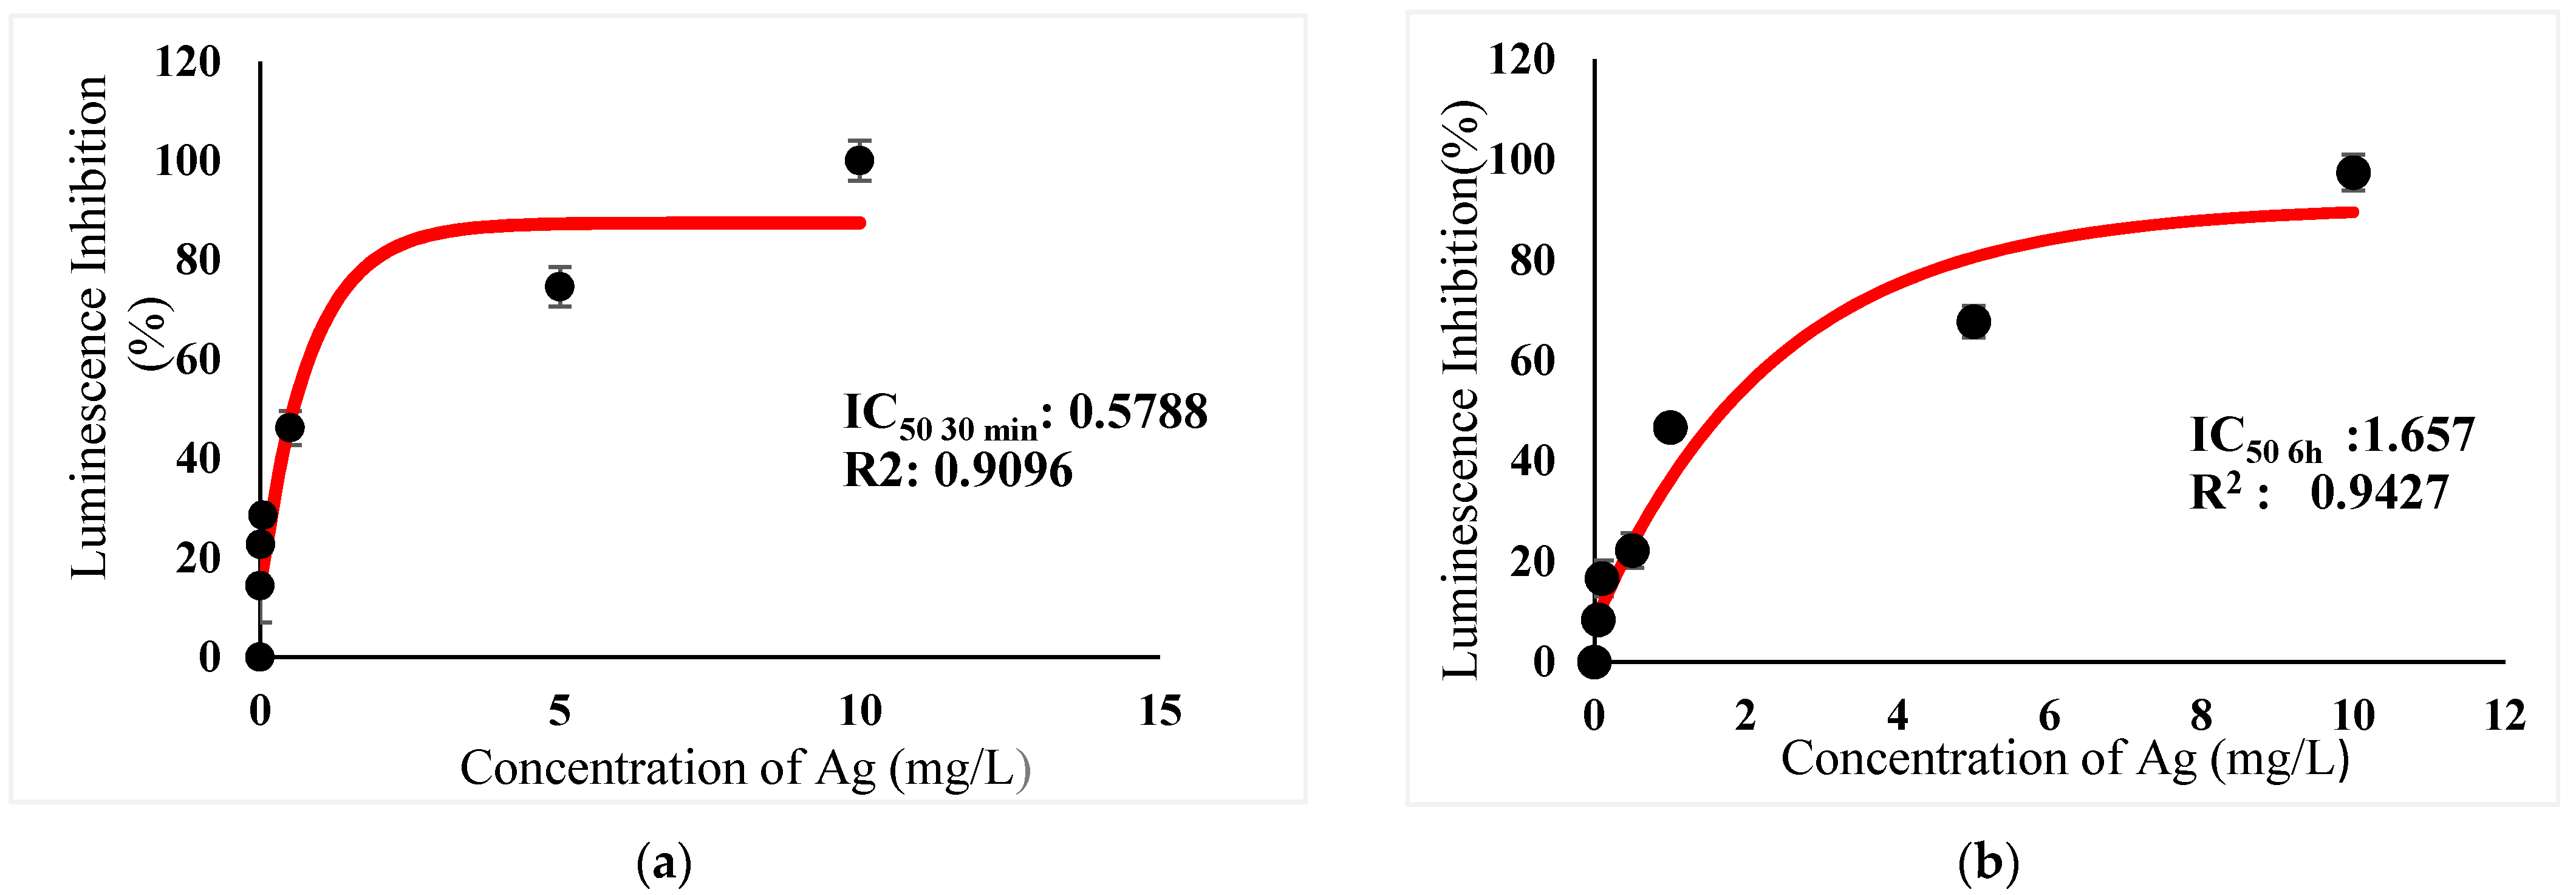
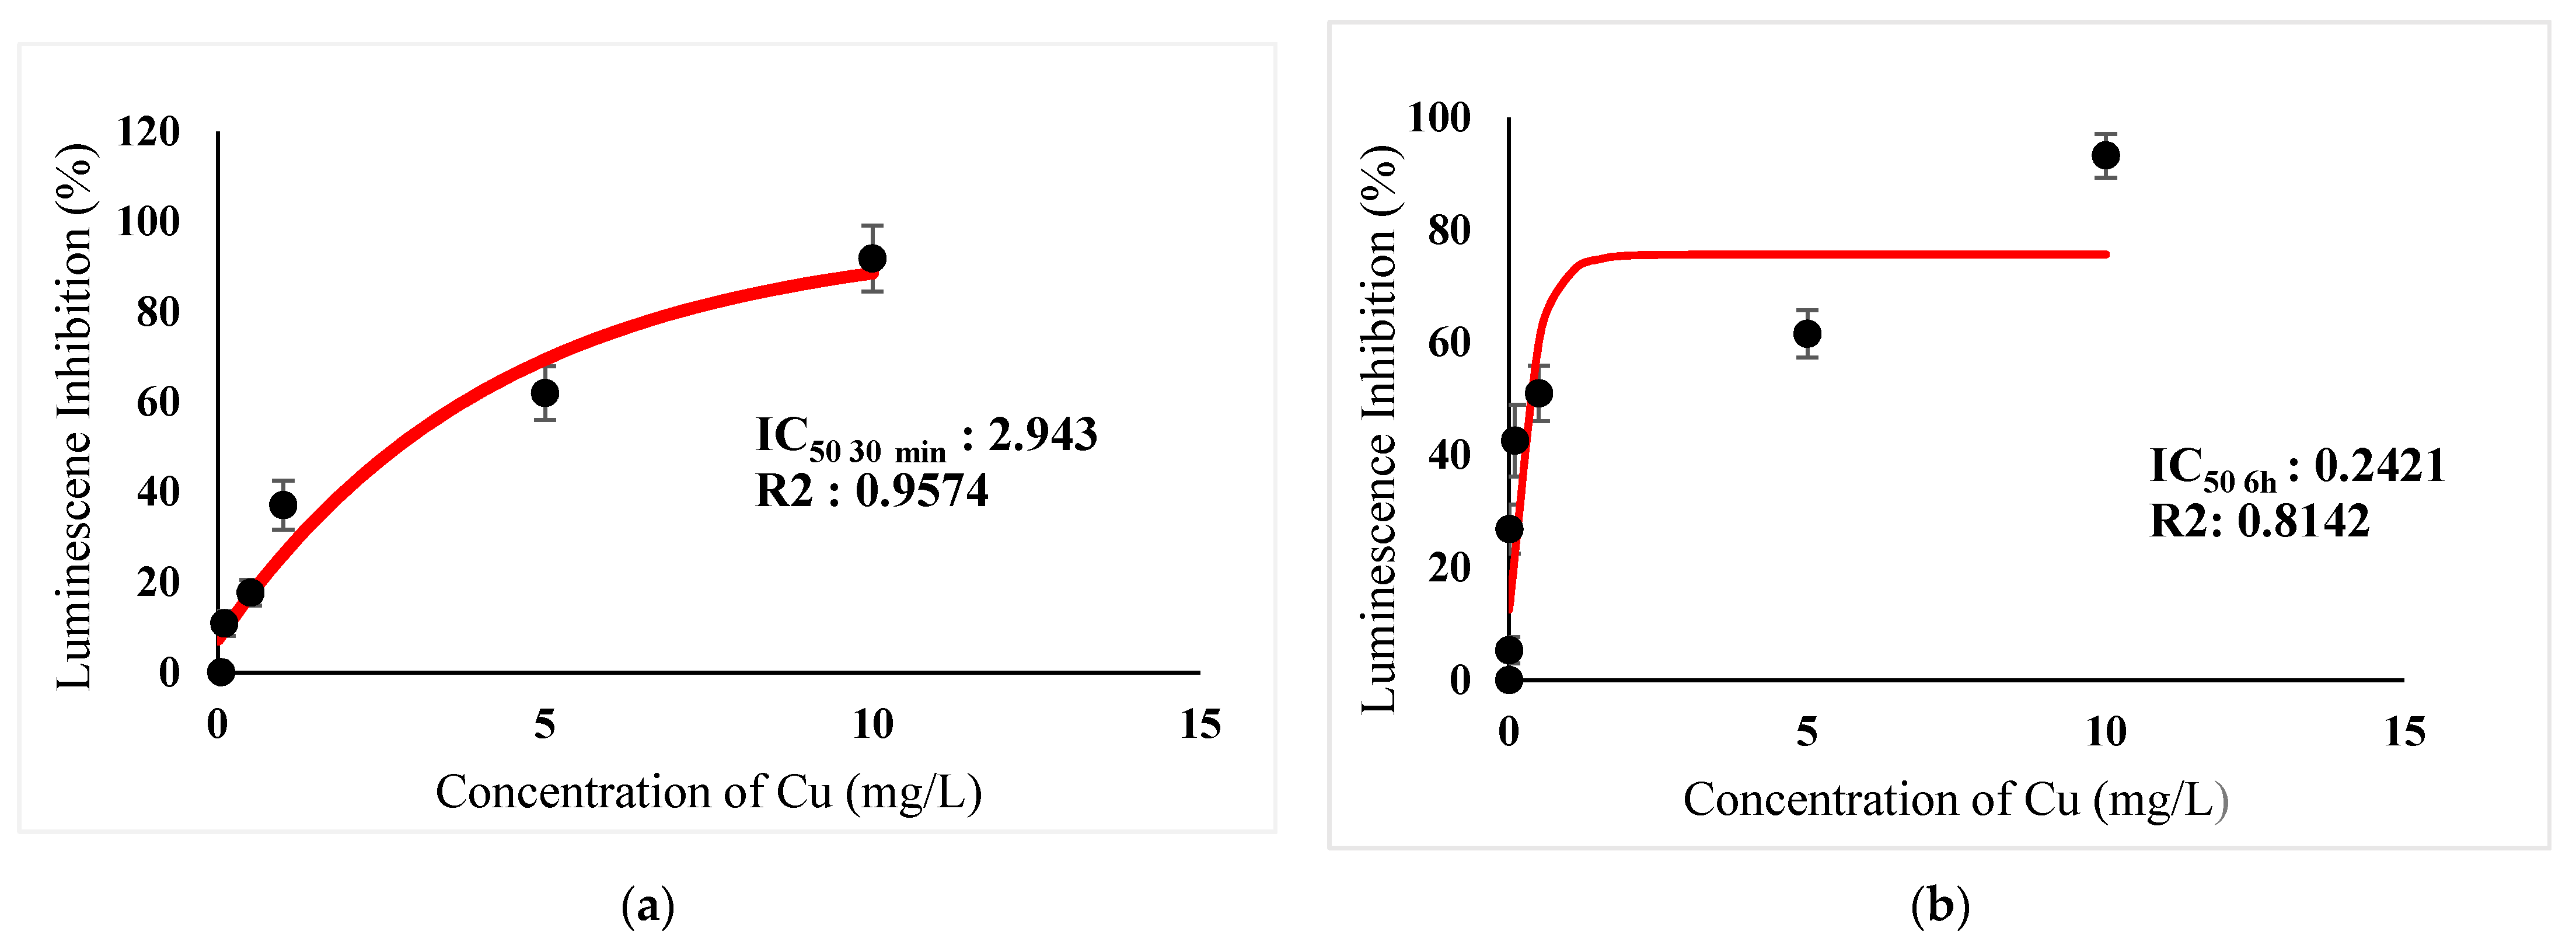
2.5.1. Half Maximal Inhibitory Concentration (IC50) Study of Metals Toxicant on Luminescence Production
2.5.2. Measurement of the Luminescence Inhibition
2.5.3. Mathematical Modeling for Assessment of Combined Heavy Metals Toxicity
Toxicity Unit (TU)
Mixture Toxic Index (MTI)
3. Results
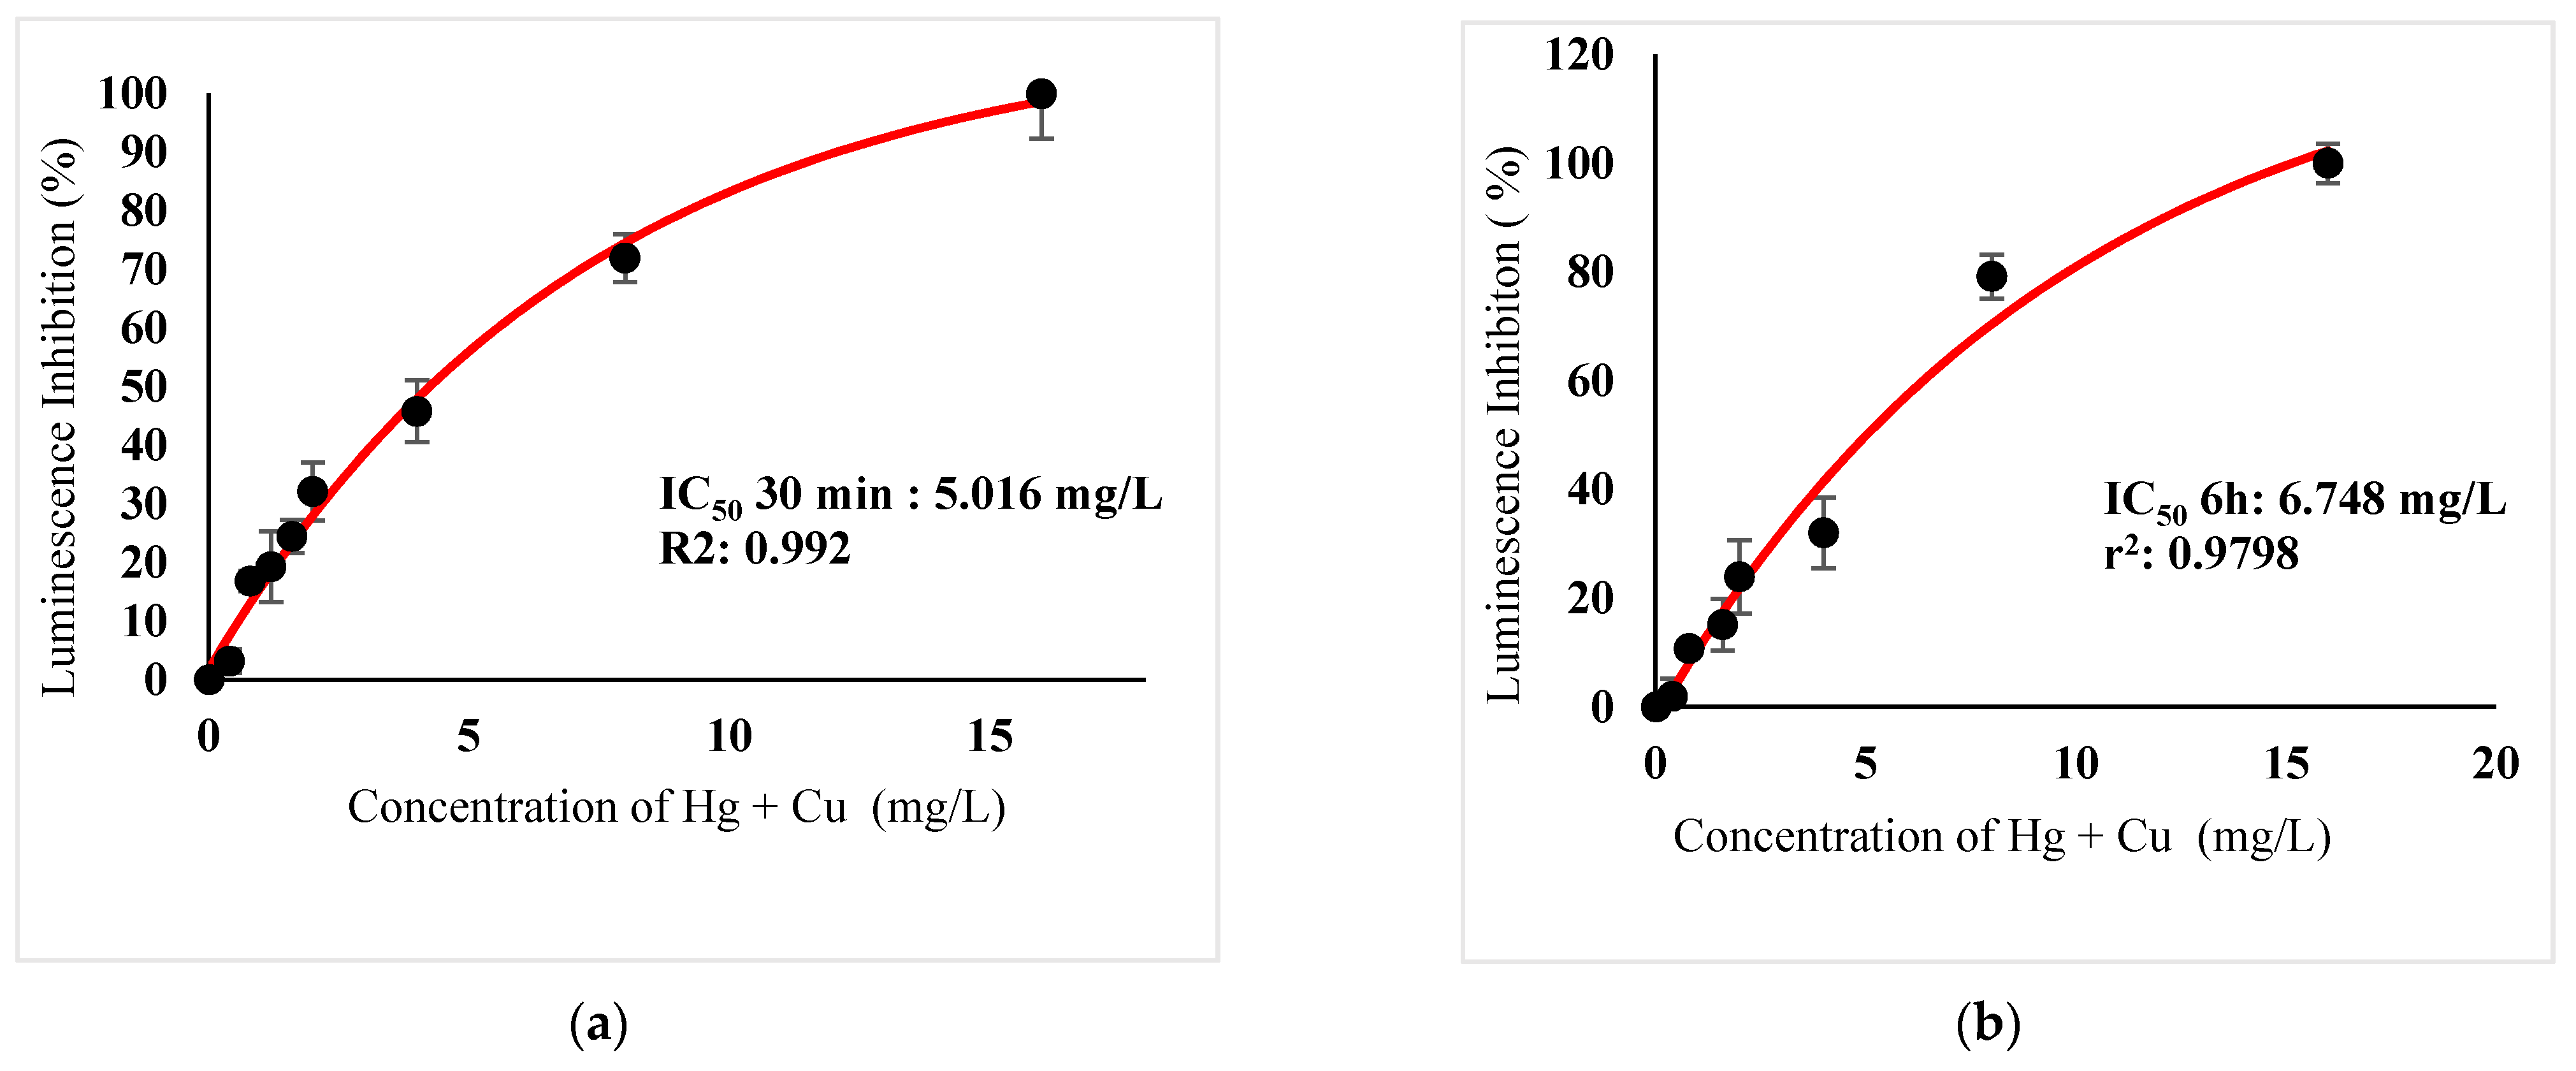
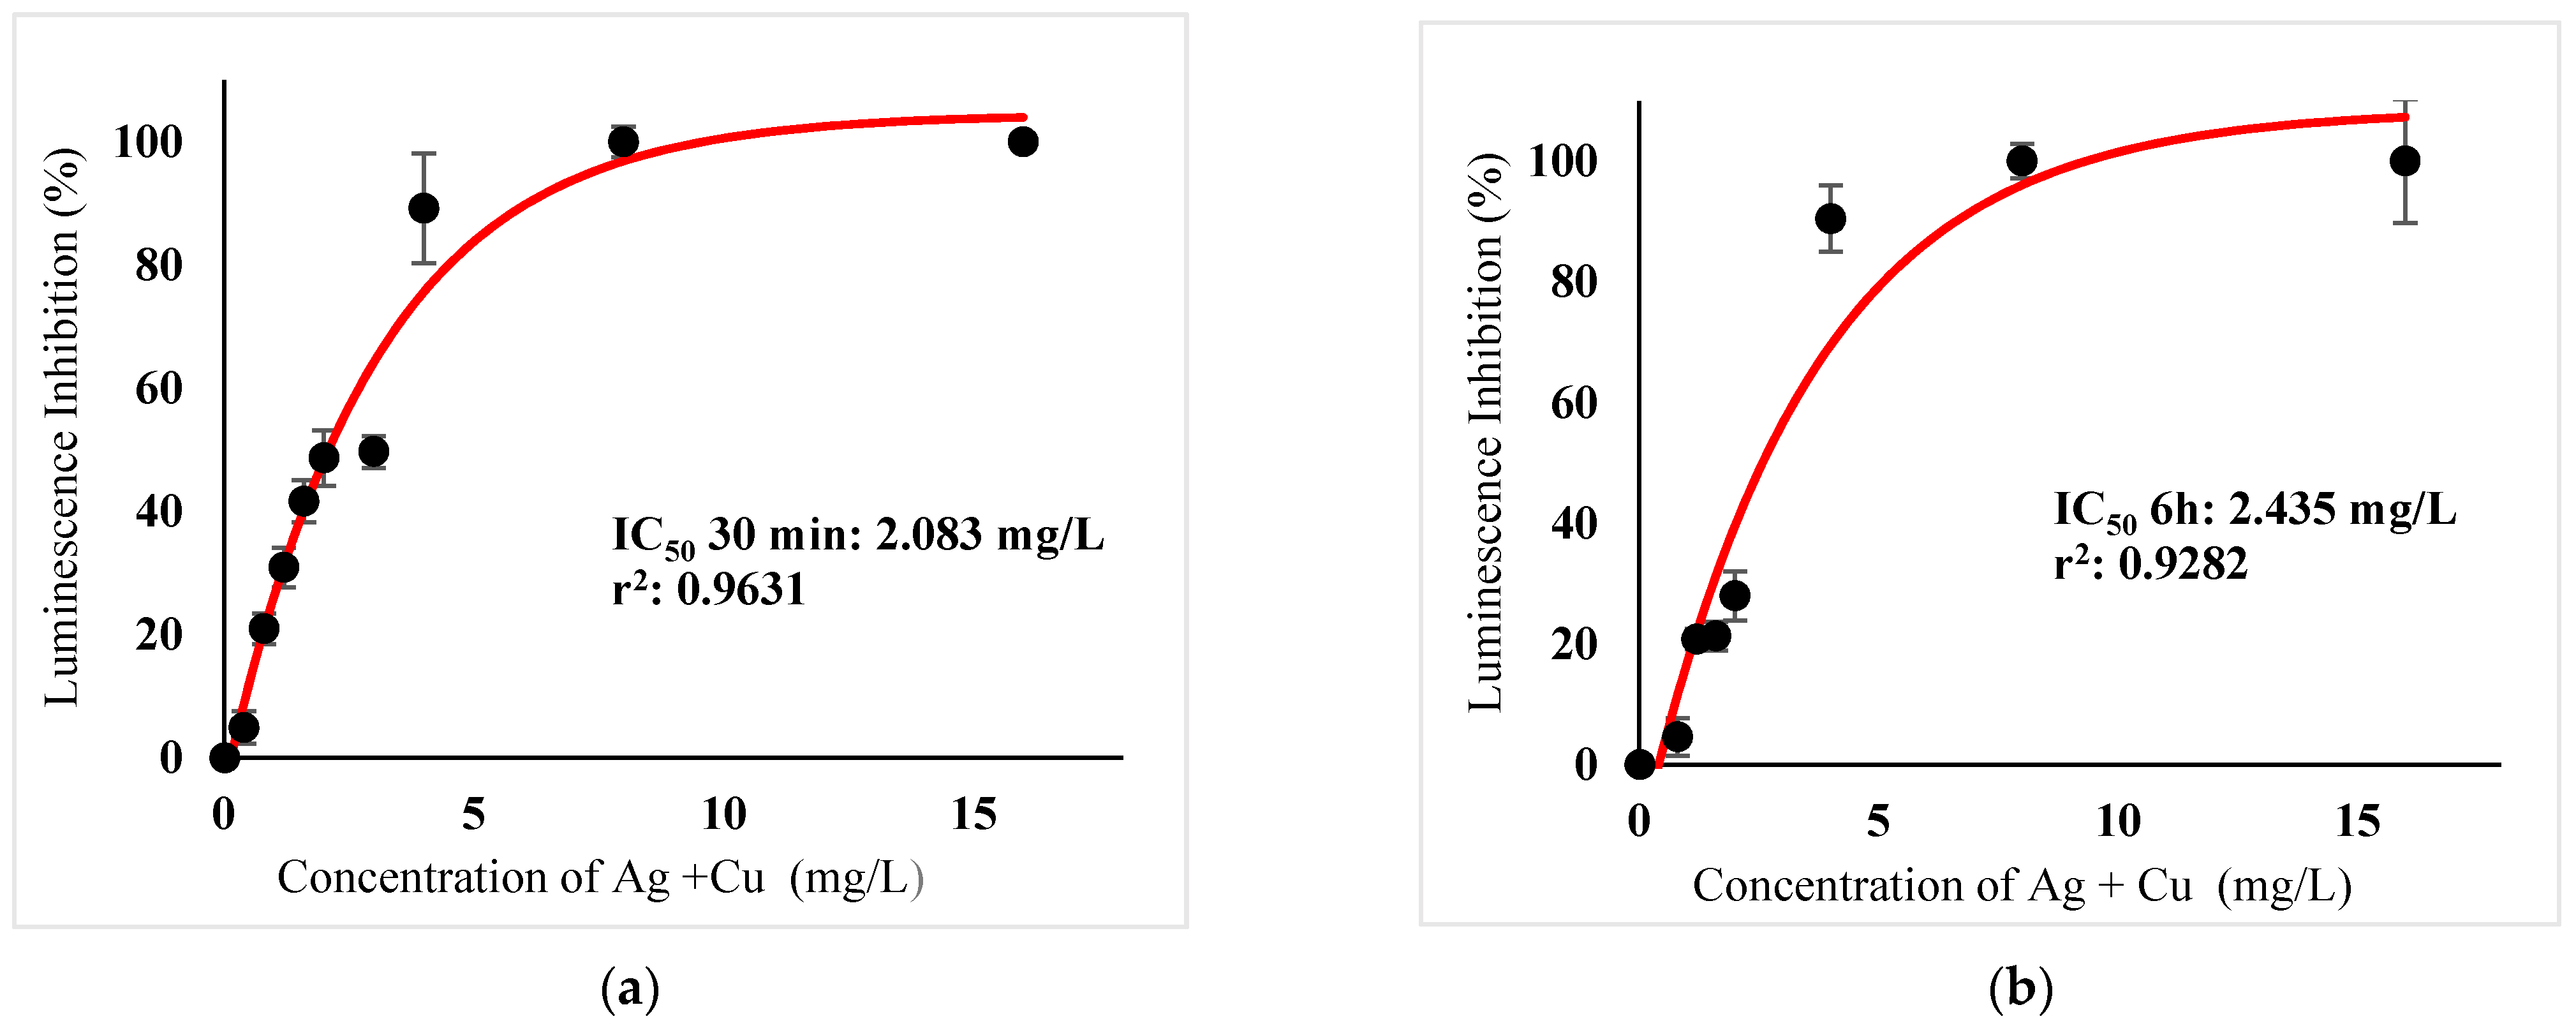
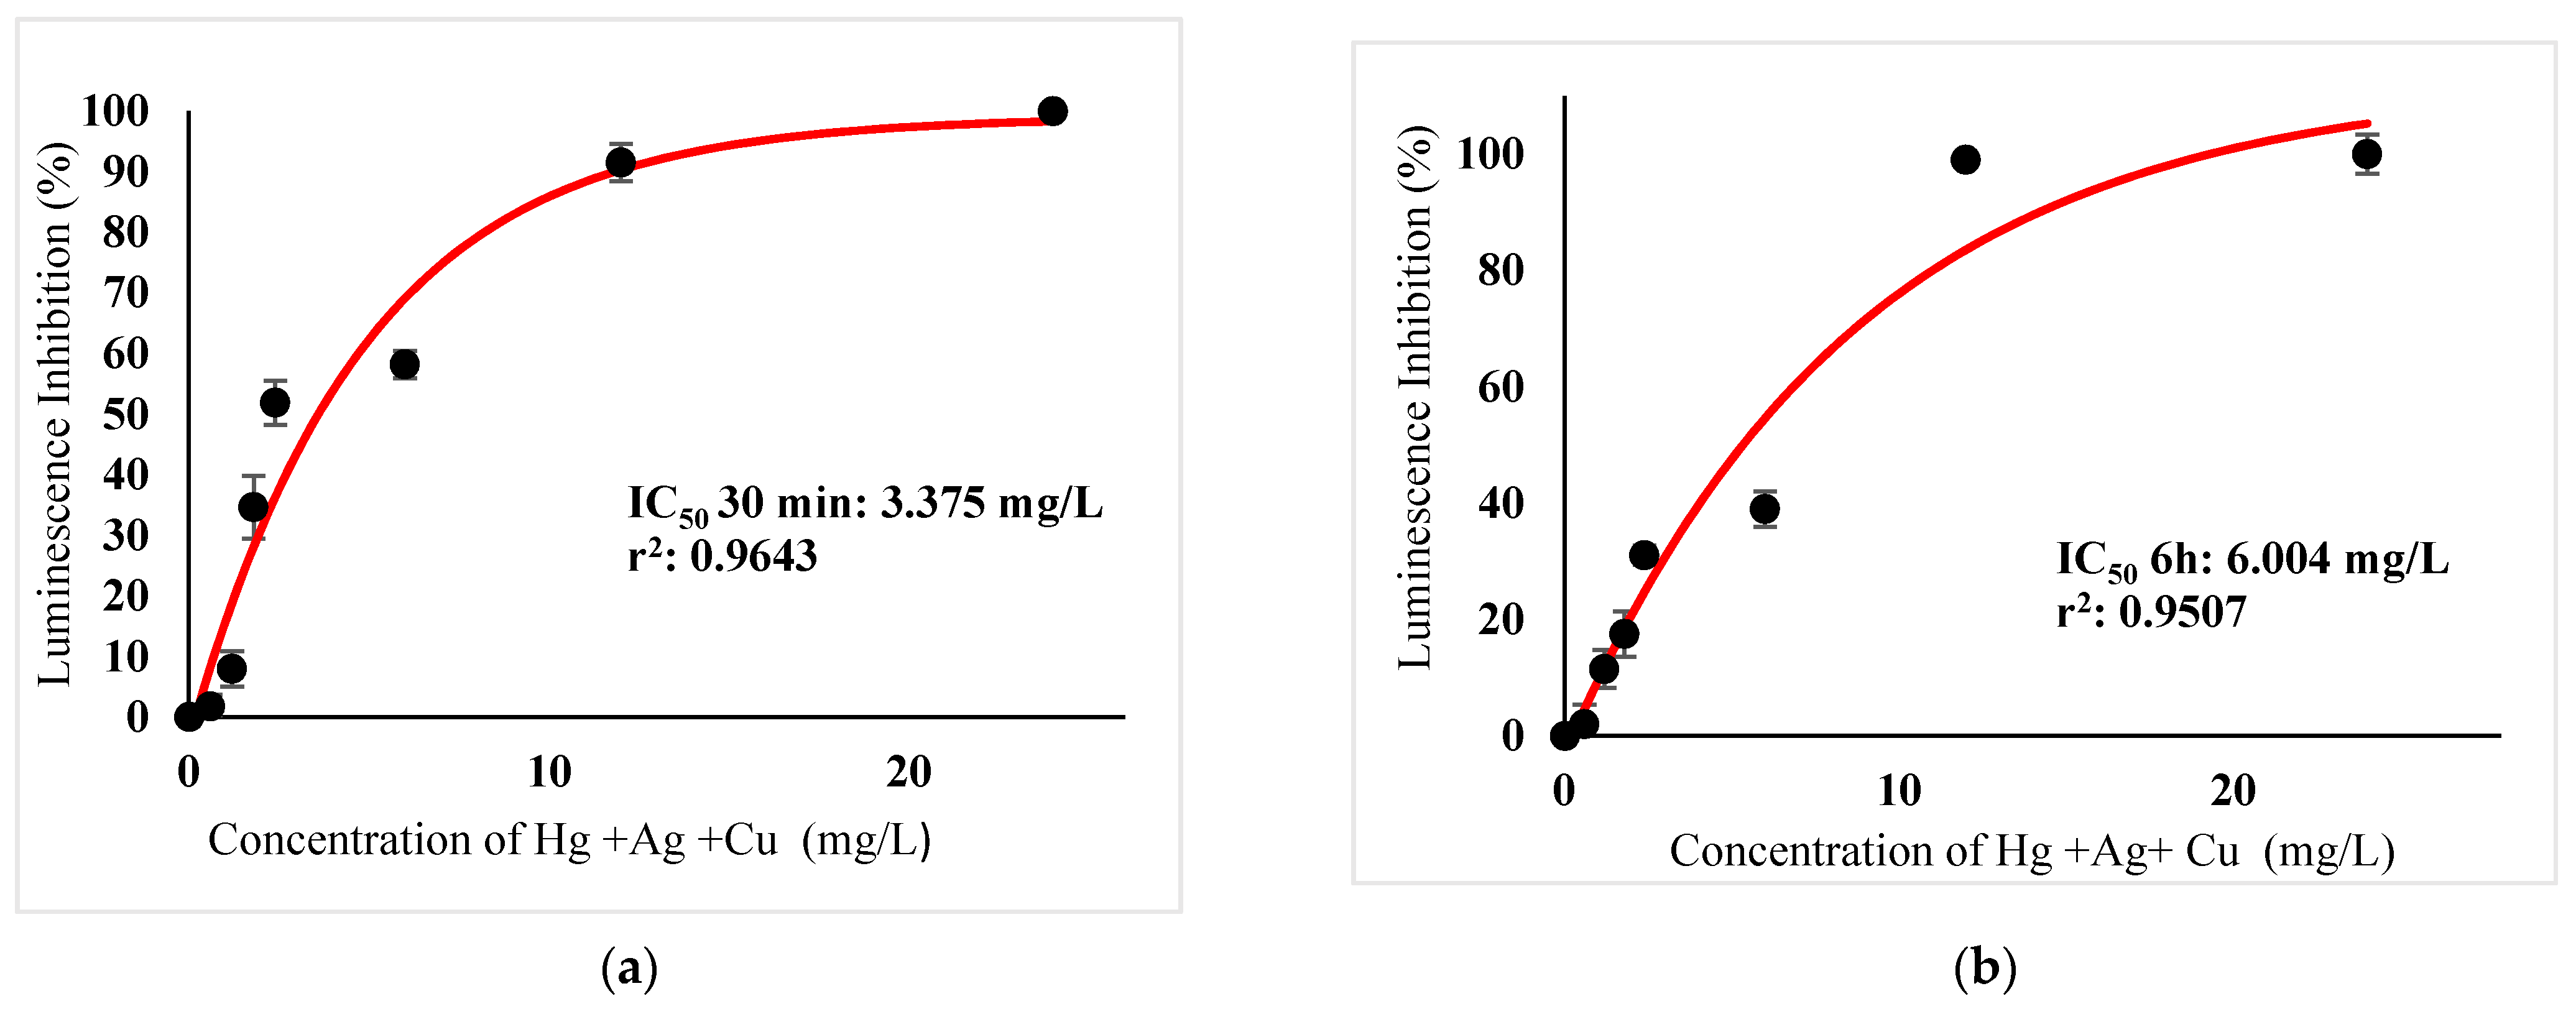
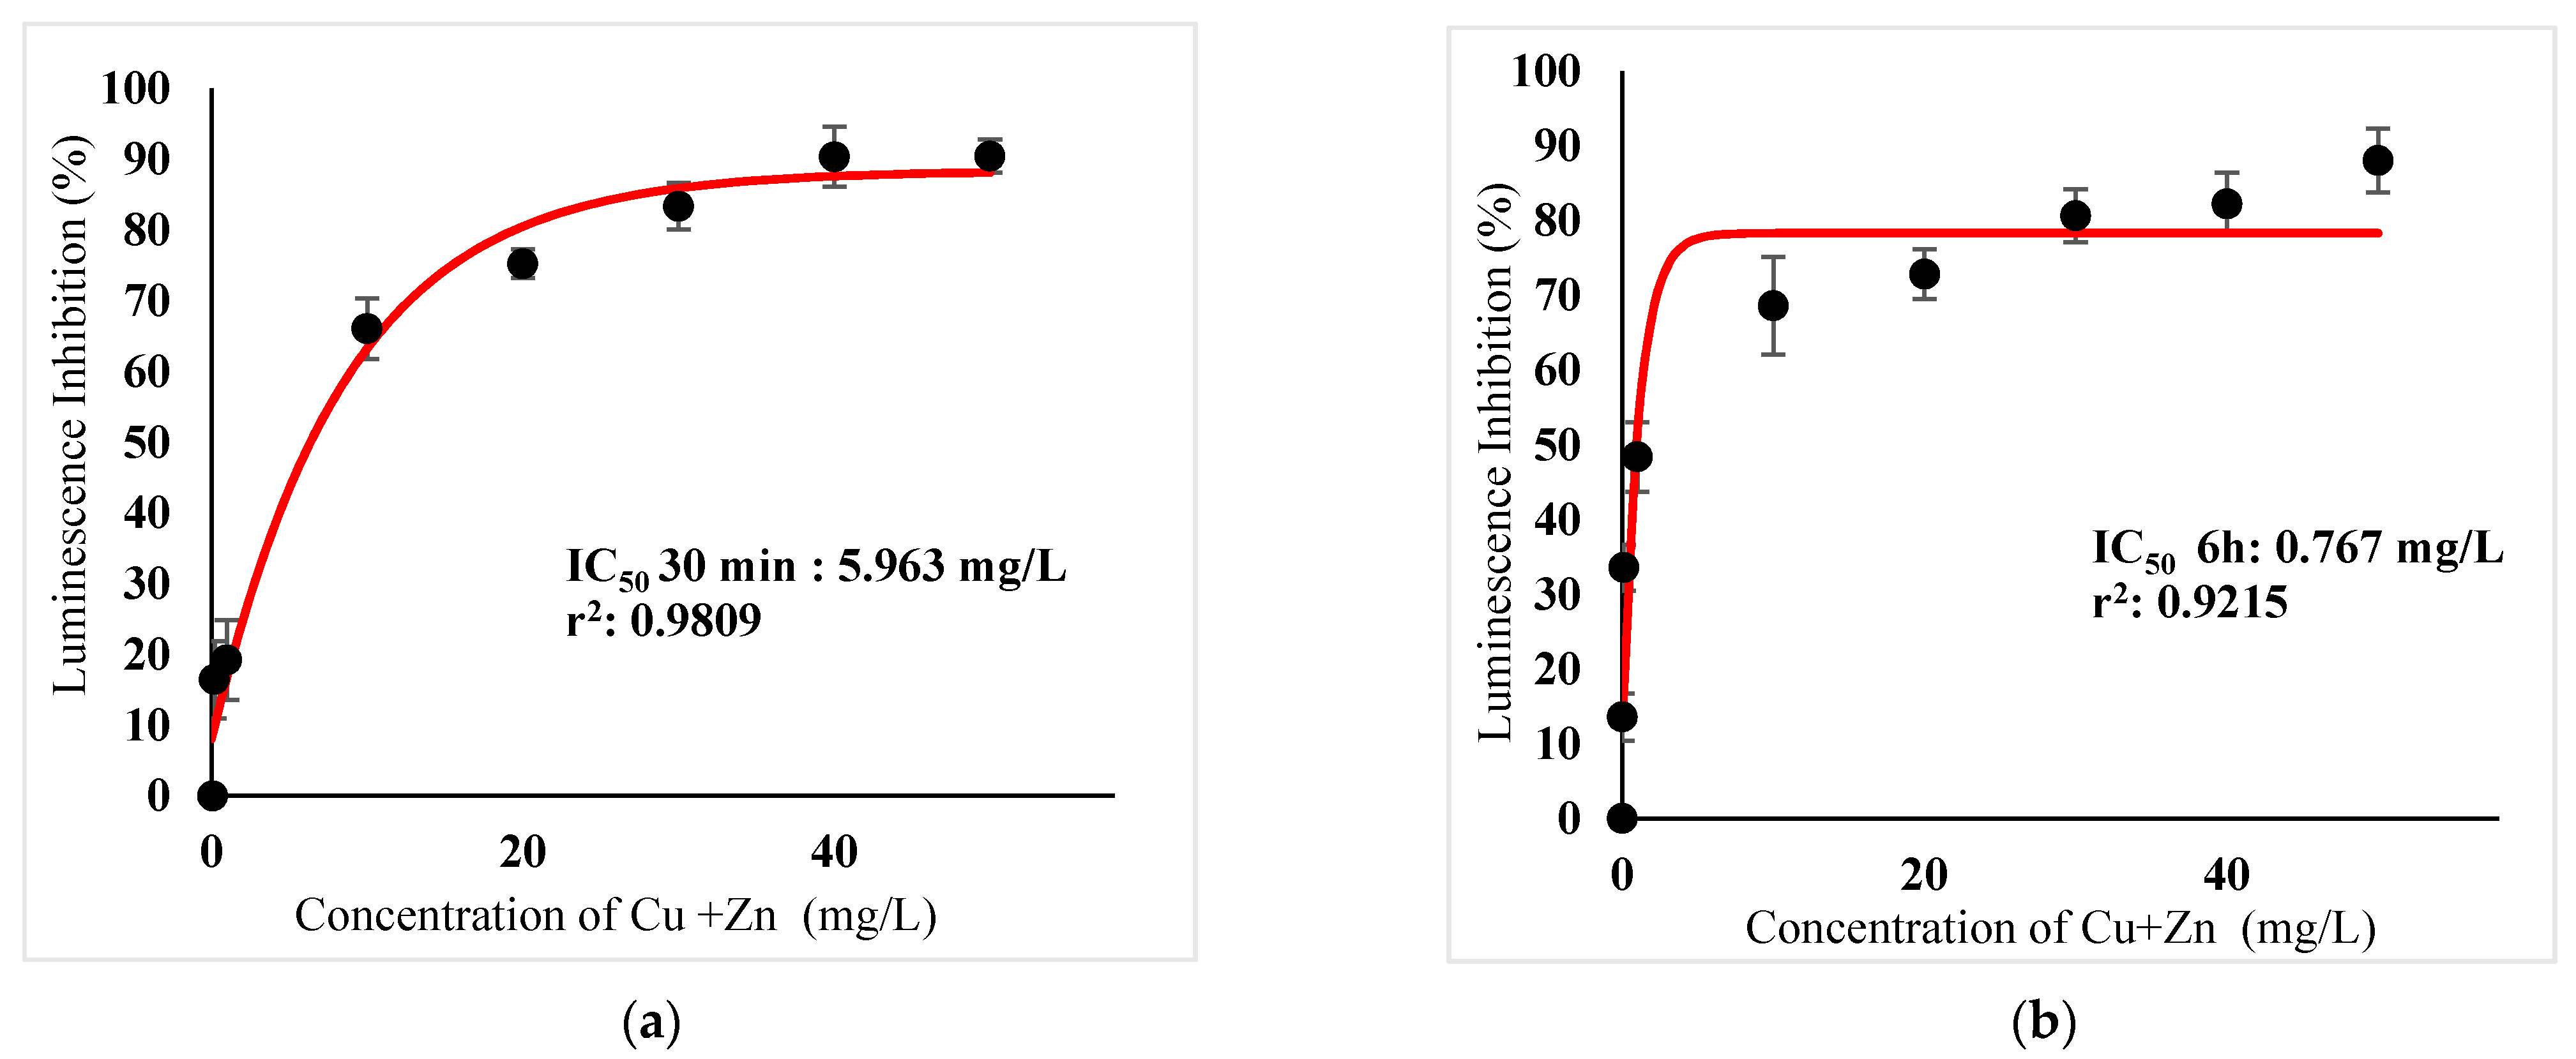
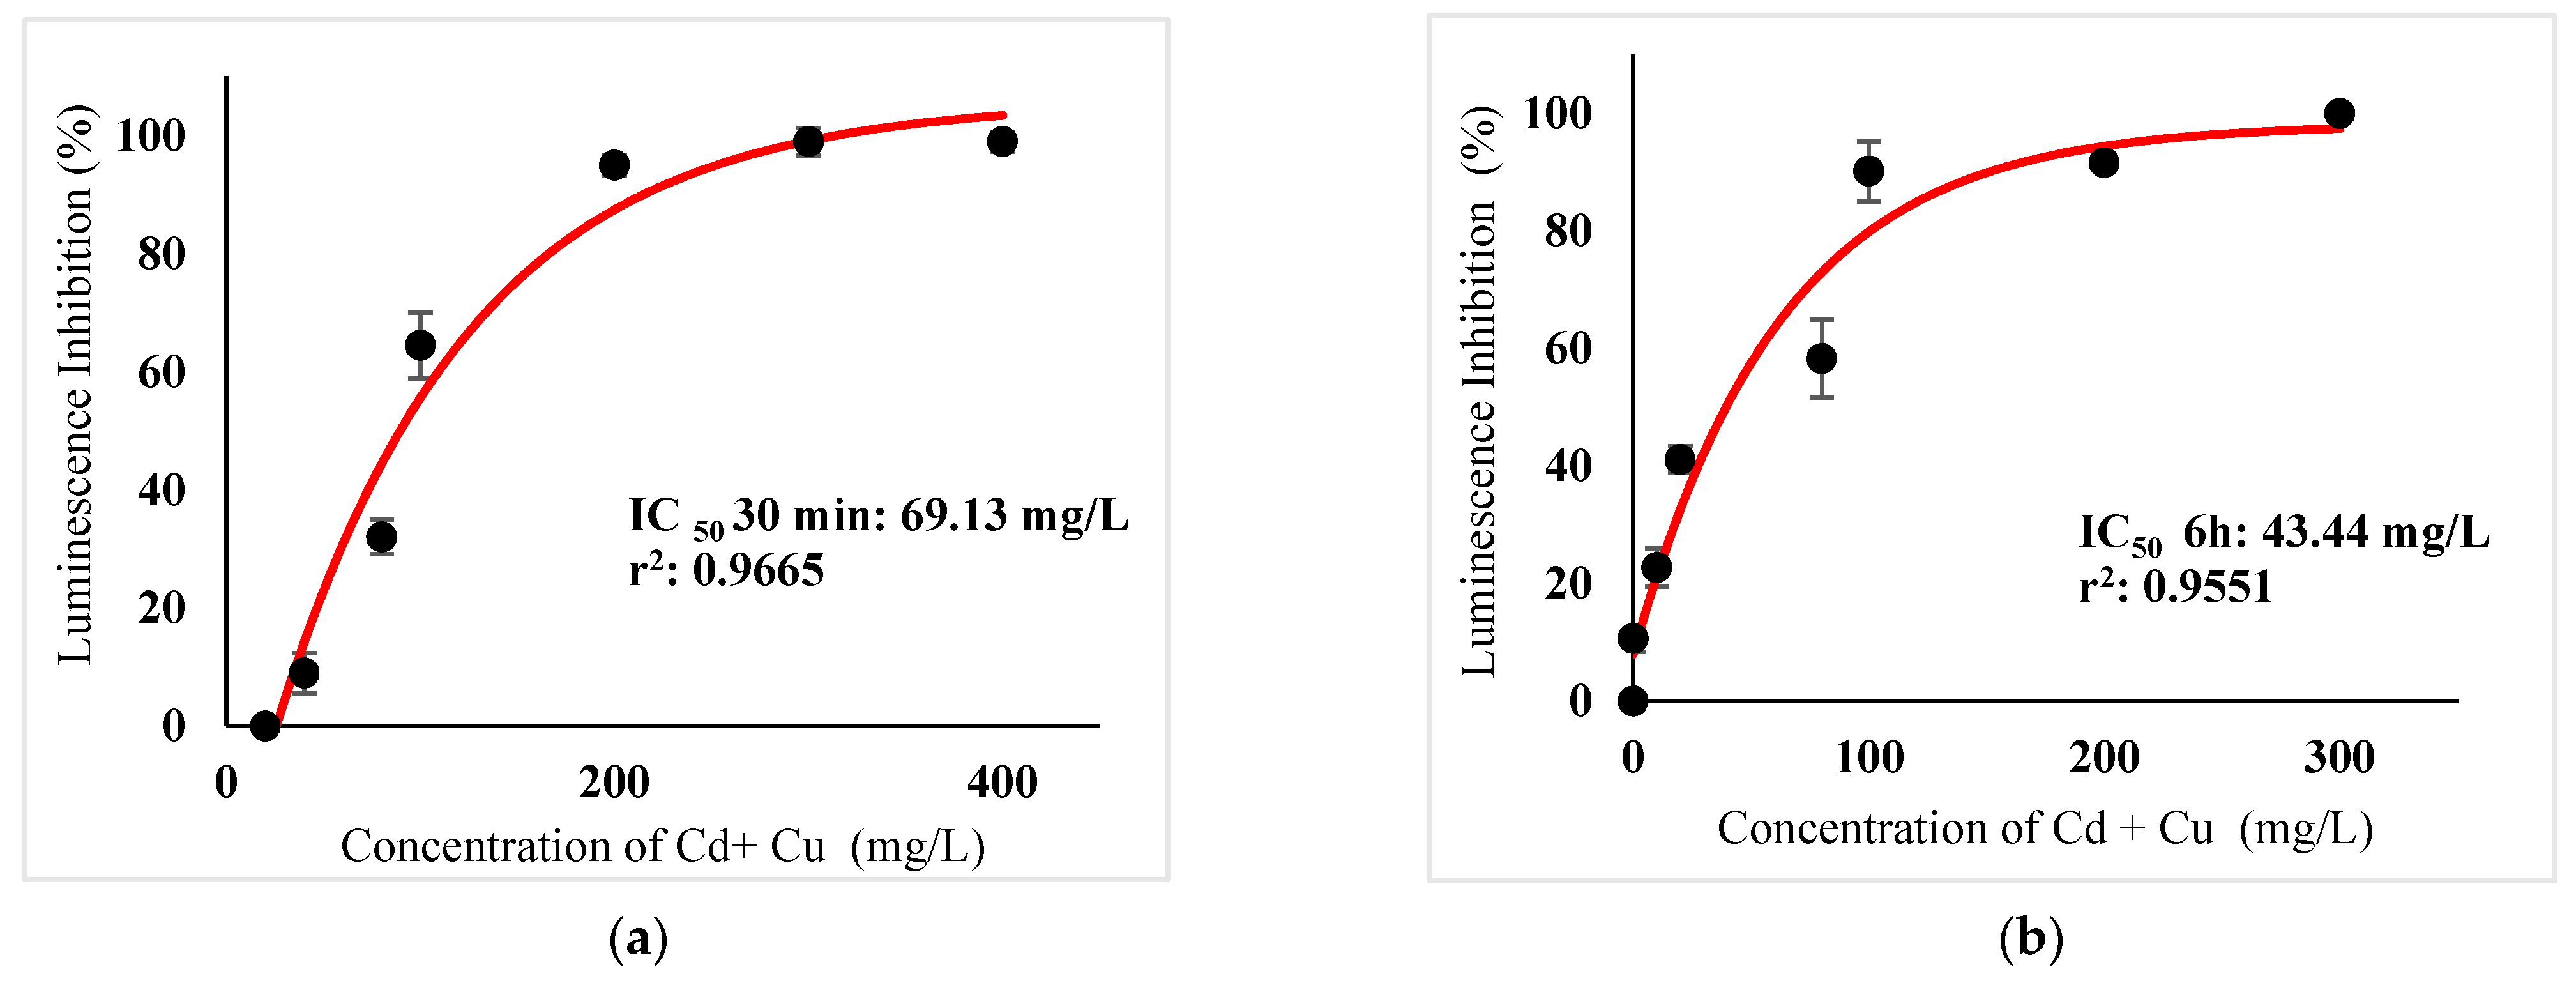
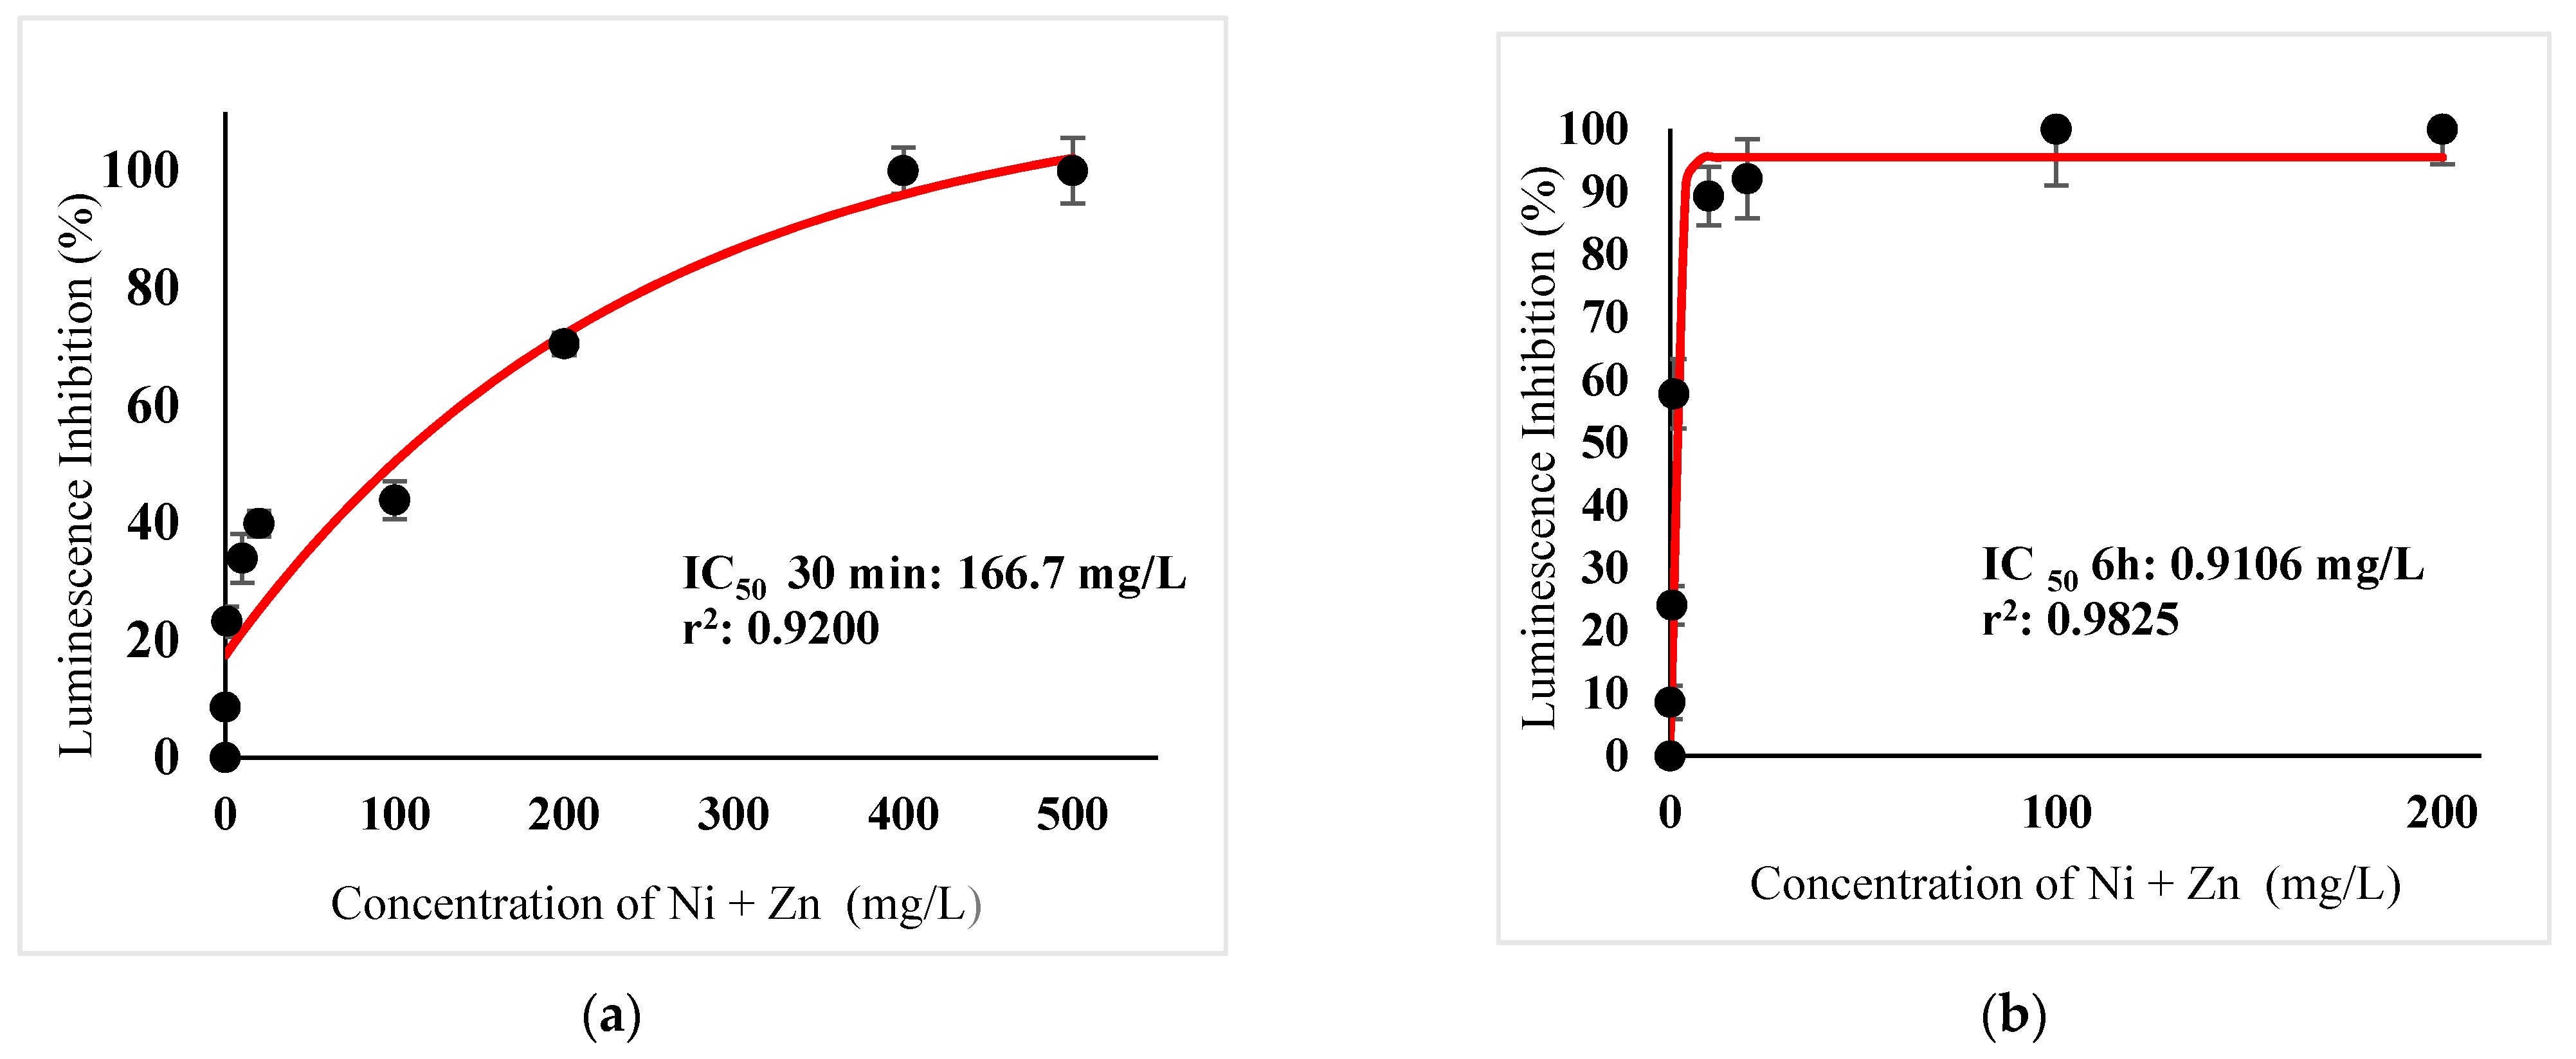
3.1. Acute Toxicity of Combined Heavy Metals Toxicity
3.2. Chronic Toxicity of Combined Heavy Metals Toxicity
4. Discussion
4.1. Acute and Chronic Action for Individual Metals on Photobacterium sp.NAA-MIE
4.2. Comparison of Acute and Chronic Action for Metal Mixtures on Photobacterium sp.NAA- MIE
5. Conclusions
Author Contributions
Funding
Institutional Review Board Statement
Informed Consent Statement
Data Availability Statement
Conflicts of Interest
References
- Ali, H.; Khan, E.; Ilahi, K. Environmental Chemistry and Ecotoxicology of Hazardous Heavy Metals: Environmental Persistence, Toxicity, and Bioaccumulation. J. Chem. 2019, 2019, 6730305. [Google Scholar] [CrossRef] [Green Version]
- Leizou, K.E.; Horsfall, M.J.; Spiff, A.I. Speciation of some heavy metals in sediments of the Pennington River, Bayelsa State, Nigeria. Am. Chem. Sci. J. 2015, 5, 238–246. [Google Scholar]
- Davis, J.A.; Looker, R.E.; Yee, D.; Marvin-Di Pasquale, M.; Grenier, J.L.; Austin, C.M.; McKee, L.J.; Greenfield, B.K.; Brodberg, R.; Blum, J.D. Reducing methylmercury accumulation in the food webs of San Francisco Bay and its local watersheds. Environ. Resour. 2012, 119, 3–26. [Google Scholar] [CrossRef] [PubMed] [Green Version]
- Foster, K.L.; Stern, G.A.; Pazerniuk, M.A.; Hickie, B.; Walkusz, W.; Wang, F.; Macdonald, R.W. Mercury biomagnification in marine zooplankton food webs in Hudson Bay. Environ. Sci. Technol. 2012, 46, 12952–12959. [Google Scholar] [CrossRef] [PubMed]
- Wang, X.; Qu, R.J.; Wei, Z.B.; Yang, X.; Wang, Z.Y. Effect of water quality on mercury toxicity to Photobacterium phosphoreum: Model development and its application in natural waters. Ecotoxicol. Environ. Saf. 2014, 104, 231–238. [Google Scholar] [CrossRef] [PubMed]
- Cheng, H.F.; Hu, Y.A. China needs to control mercury emissions from municipal solid waste (MSW) incineration. Environ. Sci. Technol. 2010, 44, 7994–7995. [Google Scholar] [CrossRef]
- Nansai, K.; Oguchi, M.; Suzuki, N.; Kida, A.; Nataami, T.; Tanaka, C.; Haga, M. High Resolution inventory of Japanese anthropogenic mercury emissions. Environ. Sci. Technol. 2012, 46, 4933–4940. [Google Scholar] [CrossRef]
- Ahmed, A.M.; Lyautey, E.; Bonnineau, C.; Dabrin, A.; Pesce, S. Environmental concentrations of copper, alone or in mixture with arsenic, can impact river sediment microbial community structure and functions. Metals Effects Sediment Microorg. 2018, 9, 1852. [Google Scholar]
- Bereswill, R.; Golla, B.; Streloke, M.; Schulz, R. Entry and toxicity of organic pesticides and copper in vineyard streams: Erosion rills jeopardise the efficiency of riparian buffer strips. Agric. Ecosyst. Environ. 2013, 172, 49–50. [Google Scholar] [CrossRef]
- Sany, S.E.T.; Salleh, A.; Rezayi, M.; Saadati, N.; Narimany, L.; Tehrani, G.M. Distribution and Contamination of Heavy Metal in the Coastal Sediments of Port Klang, Selangor, Malaysia. Water Air Soil Pollut. 2013, 224, 1476. [Google Scholar] [CrossRef]
- Yang, X.P.; Yan, J.; Wang, F.F.; Xu, J.; Liu, X.Z.; Ma, K.; Hu, X.M.; Ye, J.B. Comparison of organics and heavy metals acute toxicities to Vibrio fischeri. J. Serb. Chem. Soc. 2016, 81, 697–705. [Google Scholar] [CrossRef]
- Nweke, C.O.; Ike, C.C.; Ibegbulem, C.O. Toxicity of quaternary mixtures of phenolic compounds and formulated glyphosate to microbial community of river water. Ecotoxicol. Environ. Contam. 2016, 11, 63–71. [Google Scholar] [CrossRef]
- Zeb, B.S.; Ping, Z.; Mahmood, Q.; Lin, Q.; Pervez, A.; Irshad, M.; Bilal, M.; Bhatti, Z.A.; Shaheen, S. Assessment of combined toxicity of heavy metals from industrial wastewaters on Photobacterium phosphoreum T3S. Appl. Water Sci. 2016, 7, 2043–2050. [Google Scholar] [CrossRef] [Green Version]
- Cobbina, S.J.; Duwiejuah, A.B.; Quansah, R.; Obiri, S.; Bakobie, N. Comparative Assessment of Heavy Metals in Drinking Water Sources in Two Small-Scale Mining Communities in Northern Ghana. Int. J. Environ. Res. Public Health 2015, 12, 1062–1063. [Google Scholar] [CrossRef] [PubMed] [Green Version]
- Nwanyanwu, C.E.; Adieze, I.E.; Nweke, C.O.; Nzeh, B.C. Combined effects of metals and chlorophenols on dehydrogenase activity of bacterial consortium. Int. Resour. J. Biol. Sci. 2017, 6, 10–20. [Google Scholar]
- Lopes, S.; Pinheiro, C.; Soares, A.M.V.M.; Louriero, S. Joint toxicity prediction of nanoparticles and ionic counterparts: Simulating toxicity under a fate scenario. J. Hazard. Mater. 2016, 320, 1–9. [Google Scholar] [CrossRef] [PubMed]
- Wang, T.; Liu, Y.W.; Wang, D.; Lin, Z.; An, Q.Q.; Yin, C.H.; Liu, Y. The joint effects of sulfonamides and quorum sensing inhibitors on Vibrio fischeri: Differences between the acute and chronic mixed toxicity mechanisms. J. Hazard. Mater. 2016, 310, 56–67. [Google Scholar] [CrossRef]
- Pablos, M.V.; García-Hortigüela, P.; Fernández, C. Acute and chronic toxicity of emerging contaminants, alone or in combination, in Chlorella vulgaris and Daphnia Magna. Environ. Sci. Pollut. Resour. 2015, 22, 5417–5424. [Google Scholar] [CrossRef]
- Abbas, M.; Adi, M.; Haque, S.E.; Munir, B.; Yameen, M.; Ghaffar, A.; Shar, G.A.; Tahir, M.A.; Iqbal, M. Vibrio fischeri bioluminescence inhibition assay for ecotoxicity assessment: A review. Sci. Total Environ. 2018, 626, 1295–1309. [Google Scholar] [CrossRef]
- Chen, S.S.; Sun, Y.; Tsang, D.C.; Graham, N.J.; Ok, Y.S.; Feng, Y. Potential impact of flowback water from hydraulic fracturing on agricultural soil quality: Metal/metalloid bioaccessibility, Microtox bioassay, and enzyme activities. Sci. Total Environ. 2017, 579, 1419–1426. [Google Scholar] [CrossRef]
- Yamamuro, Y. Social behavior in laboratory rats: Applications for psycho-neuroethology studies. Anim. Sci. J. 2006, 77, 386–394. [Google Scholar] [CrossRef]
- Cheng, C.Y.; Kuo, J.-T.; Yu, C.; Lin, Y.-C.; Liao, Y.-R.; Chung, Y.-C. Comparisons of Vibrio fischeri, Photobacterium phosphoreum, and recombinant luminescent using Escherichia coli as BOD measurement. J. Environ. Sci. Health 2010, 45, 233–238. [Google Scholar] [CrossRef]
- Mansour, S.A.; Abdel-Hamid, A.A.; Ibrahim, A.W.; Mahmoud, N.H.; Moselhy, W.A. Toxicity of Some Pesticides, Heavy Metals and Their Mixtures to Vibrio fischeri Bacteria and Daphnia magna: Comparative Study. J. Biol. Life Sci. 2015, 6, 221–240. [Google Scholar] [CrossRef]
- Halmi, M.I.E.; Jirangon, H.; Johari, W.L.W.; Abdul Rachman, A.R.; Shukor, M.Y.; Syed, M.A. Comparison of Microtox and Xenoassay light as a near real time river monitoring assay for heavy metals. Sci. World J. 2014, 2014, 834202. [Google Scholar] [CrossRef]
- Wong, C.L.; Liew, J.; Yusop, Z.; Ismail, T.; Venneker, R.; Uhlenbrook, S. Rainfall characteristics and regionalization in Peninsular Malaysia based on a high resolution gridded data set. Water 2016, 8, 500. [Google Scholar] [CrossRef] [Green Version]
- Dewhurst, R.; Wheeler, J.; Chummun, K.; Mather, J.; Callaghan, A.; Crane, M. The comparison of rapid bioassays for the assessment of urban groundwater quality. Chemosphere 2002, 47, 547–554. [Google Scholar] [CrossRef]
- Halmi, M.I.E.; Kassim, A.; Shukor, M.Y. Assessment of heavy metal toxicity using a luminescent bacterial test based on Photobacterium sp. strain MIE. Rendi Fis. Acc. Lincei 2019, 30, 589–601. [Google Scholar] [CrossRef]
- Blasco, J.; Del Valls, A. Impact of emergent contaminant in the environment: Environmental Risk Assessment. In Emerging Contaminants from Industrial and Municipal Waste; Springer: Berlin/ Heidelberg, Germany, 2008; Volume 5, pp. 169–188. [Google Scholar]
- Wang, D.; Gu, Y.; Zheng, M.; Zhang, W.; Lin, Z.; Liu, Y. A Mechanism-based QSTR Model for Acute to Chronic Toxicity Extrapolation: A Case Study of Antibiotics on Luminous Bacteria. Sci. Rep. 2017, 7, 6022. [Google Scholar] [CrossRef] [PubMed] [Green Version]
- Adnan, N.A.; Halmi, M.I.E.; Shukor, M.Y.; Gani, S.S.A.; Zaidan, U.H.; Radziah, O. Statistical Modeling for the Optimization of Bioluminescence Production by Newly Isolated Photobacterium sp. NAA-MIE. Proc. Natl. Acad. Sci. India Sect. B Biol. Sci. 2020, 90, 797–810. [Google Scholar] [CrossRef]
- Chun, U.-H.; Simonov, N.; Chen, Y.; Britz, M.L. Continuous pollution monitoring using Photobacterium phosphoreum, Resour. Conserv. Recycl. 1996, 18, 25–40. [Google Scholar] [CrossRef]
- Hong, Y.; Chen, Z.; Zhang, B.; Zhai, Q. Isolation of Photobacterium sp. LuB-1 and its application in rapid assays for chemical toxicants in water. Lett. Appl. Microbiol. 2010, 51, 308–312. [Google Scholar] [CrossRef] [PubMed]
- Damian, E.C.; Obinna, O.M.; Ndidi, O.C. Predictive Modelling of Heavy Metal-Metal Interactions in Environmental Setting: Laboratory Simulative Approach. Environ. Ecol. Res. 2014, 2, 248–252. [Google Scholar]
- Villaescusa, I.; Martinez, M.; Murat, J.C.; Costa, C. Cadmium species toxicity on luminescent bacteria, Fresen. J. Anal. Chem. 1996, 354, 566–570. [Google Scholar]
- Shukor, Y.; Baharom, N.A.; Rahman, F.A.; Abdullah, M.P.; Shamaan, N.A.; Syed, M.A. Development of a heavy metals enzymatic-based assay using papain. Anal. Chim. Acta 2006, 566, 283–289. [Google Scholar] [CrossRef]
- Girotti, S.; Bolelli, L.; Roda, A.; Gentilomi, G.; Musiani, M. Improved detection of toxic chemicals using bioluminescent bacteria. Anal. Chim. Acta 2002, 471, 113–120. [Google Scholar] [CrossRef]
- Girotti, S.; Ferri, E.N.; Fumo, M.G.; Maiolini, E. Monitoring of environmental pollutants by bioluminescent bacteria. Anal. Chim. Acta 2008, 608, 2–29. [Google Scholar] [CrossRef] [PubMed]
- Calabrese, E.J. Multiple Chemical Interactions; Lewis Publishers: Chelsea, MI, USA, 1991. [Google Scholar]
- Zheng, P.; Feng, X.S. Biotechnology for Waste Treatment; Higher Education Press: Beijing, China, 2006. [Google Scholar]
- Marking, L.; Dawson, V.K. Method of assessment of toxicity or efficacy of mixture of chemical. Investig. Fish Control 1975, 67, 1–8. [Google Scholar]
- Broderius, S.J.; Kahl, M.D.; Hoglund, M.D. Use of joint toxic response to define the primary mode of toxic action for diverse industrial organic chemicals. Environ. Toxicol. Chem. 1995, 14, 1591–1605. [Google Scholar] [CrossRef]
- Konemann, H. Fish toxicity tests with mixtures of more than 2 chemicals-a proposal for a quantitative approach and experimental results. Toxicology 1981, 19, 229–238. [Google Scholar] [CrossRef]
- Jan, A.T.; Azam, M.; Siddiqui, K.; Ali, A.; Choi, I.; Haq, Q.M.R. Heavy Metals and Human Health: Mechanistic Insight into Toxicity and Counter Defense System of Antioxidants. Int. Mol. Sci. 2015, 16, 29592–29630. [Google Scholar] [CrossRef] [PubMed] [Green Version]
- Chen, C.W.; Chen, C.F.; Dong, C.D. Distribution and Accumulation of Mercury in Sediments of Kaohsiung River Mouth, Taiwan. APCBEE Procedia 2012, 1, 153–158. [Google Scholar] [CrossRef] [Green Version]
- Hintelmann, H. Organomercurials: Their formation and pathways in the environment. Met. Ions Life Sci. 2010, 7, 365–401. [Google Scholar] [PubMed]
- Bauda, P.; Block, J.C. Role of envelops of Gram negative bacteria in cadmium binding and toxicity. Toxic. Assess. 1990, 5, 47–60. [Google Scholar] [CrossRef]
- Fulladosa, E.; Murat, J.C.; Martınez, M.; Villaescusa, I. Patterns of metals and arsenic poisoning in Vibrio fischeri bacteria. Chemistry 2005, 60, 43–48. [Google Scholar] [CrossRef]
- Kungolos, A.; Hadjispyrou, S.; Petala, M.; Tsiridis, V.; Samaras, P.; Sakellaropoulos, G.P. Toxic properties of metals and organotin compounds and their interactions on Daphnia magna and Vibrio fischeri. Water Air Soil Pollut. 2004, 4, 101–110. [Google Scholar] [CrossRef]
- Bao, V.W.W.; Leung, K.M.A.; Kwok, K.W.H.; Zhang, A.Q.; Lui, G.C. Synergistic toxic effects of zinc pyrithione and copper to three marine species: Implications on setting appropriate water quality criteria, Mar. Pollut. Bull. 2008, 57, 616–623. [Google Scholar] [CrossRef]
- Sfakianakis, D.G.; Renieri, E.; Kentouri, M.; Tsatsakis, A.M. Effect of heavy metals on fish larvae deformities: A review. Environ. Res. 2005, 137, 246–255. [Google Scholar] [CrossRef]
- Li, L.; Tian, X.L.; Yu, X.; Dong, S.L. Effects of Acute and Chronic Heavy Metal (Cu, Cd, and Zn) Exposure on Sea Cucumbers (Apostichopus japonicus). Biomed. Res. Int. 2016, 13. [Google Scholar] [CrossRef] [Green Version]
- Singh, N.; Yeh, P. Suppressive drug combinations and their potential to combat antibiotic resistance. J. Antibiot. 2017, 70, 1033–1042. [Google Scholar] [CrossRef]
- Bryan, G.W.; Gibbs, P.E. Heavy metals in the Fal estuary, Cornwall: A study of long term contamination by mining waste and its effects on estuarine organisms, Occasional Publications. Mar. Biol. Assoc. U. K. 1983. [Google Scholar]
- Paulson, K.; Lunderberg, K. Treatment of mercury contaminated fish by selenium Addition. WaterAir Soil Pollut. 1991, 56, 833–841. [Google Scholar] [CrossRef]
- Utkigar, V.P.; Chaudhary, N.; Koeniger, A.; Tabak, H.H.; Haines, J.R.; Govind, R. Toxicity of metals and metal mixtures: Analysis of concentration and time dependence for zinc and copper. Water Resour. 2004, 38, 3651–3658. [Google Scholar]
- Lynch, N.R.; Hoang, T.C.; O’Brien, T.E. Acute Toxicity of Binary-Metal mixtures of Copper, Zinc and Nickel to Pimephales Promelas: Evidence of More than Additive Effect. Environ. Toxicol. Chem. 2016, 35, 446–457. [Google Scholar] [CrossRef] [PubMed]
- Nys, C.; Asselman, J.; Hochmuth, J.D.; Janssen, C.R.; Blust, R.; Smolders, E.; De Schamphelaere, K.A.C. Mixture toxicity of nickel and zinc to Daphnia magna is non interactive at low effect sizes but becomes synergistic at high effect sizes: Interactive effects in a binary Ni-Zn mixture. Environ. Toxicol. Chem. 2015, 5, 1091–1102. [Google Scholar] [CrossRef] [PubMed]
- Padrtova, R.R.; Marsalek, B.; Holoubek, I. Evaluation of alternative and standard toxicity assays for screening of environ-mental samples: Selection of an optimal test battery. Chemosphere 1998, 37, 495–507. [Google Scholar] [CrossRef]
- Cedergreen, N. Quantifying Synergy: A Systematic Review of Mixture Toxicity Studies within Environmental Toxicology. PLoS ONE 2014, 9, e96580. [Google Scholar] [CrossRef]
- Gao, Y.F.; Feng, J.F.; Kang, L.; Xu, X.; Zhu, L. Concentration addition and independent action model: Which is better in predicting the toxicity for metal mixtures on zebrafish larvae. Sci. Total Environ. 2018, 610, 442–450. [Google Scholar] [CrossRef]
- Anyanwu, B.O.; Ezejiofor, A.N.; Igweze, Z.N.; Orisakwe, O.E. Heavy Metal Mixture Exposure and Effects in Developing Nations: An Update. Toxics 2018, 6, 65. [Google Scholar] [CrossRef] [Green Version]
- Alsop, D.; Wood, C. Metal uptake and acute toxicity in zebrafish: Common mechanisms across multiple metals. Aquat. Toxicol. 2011, 105, 385–393. [Google Scholar] [CrossRef]
- Olajuyigbe, O.O.; Animashaun, T. Synergistic Activities of Amoxicillin and Erythromycin against Bacteria of Medical Importance. Pharmacologia 2012, 3, 450–455. [Google Scholar] [CrossRef]
- Loewe, S. The problem of synergism and antagonism of combined drugs. Arznei-mittel-Forsc Drug Resour. 1953, 3, 285–290. [Google Scholar]


| M (Sum of Toxic Unit) | Interaction |
|---|---|
| M < 0.8 | Synergism |
| M between 0.8–1.2 | Additive |
| M > 1.2 | Antagonism |
| MTI (Mixture Toxicity Index) | Interaction |
|---|---|
| MTI < 0 | Antagonistic |
| MTI = 0 | No addition |
| 0 < MTI < 1 | Partial additive |
| MTI = 1 | Additive |
| MTI > 1 | Synergistic (Supra-additive) |
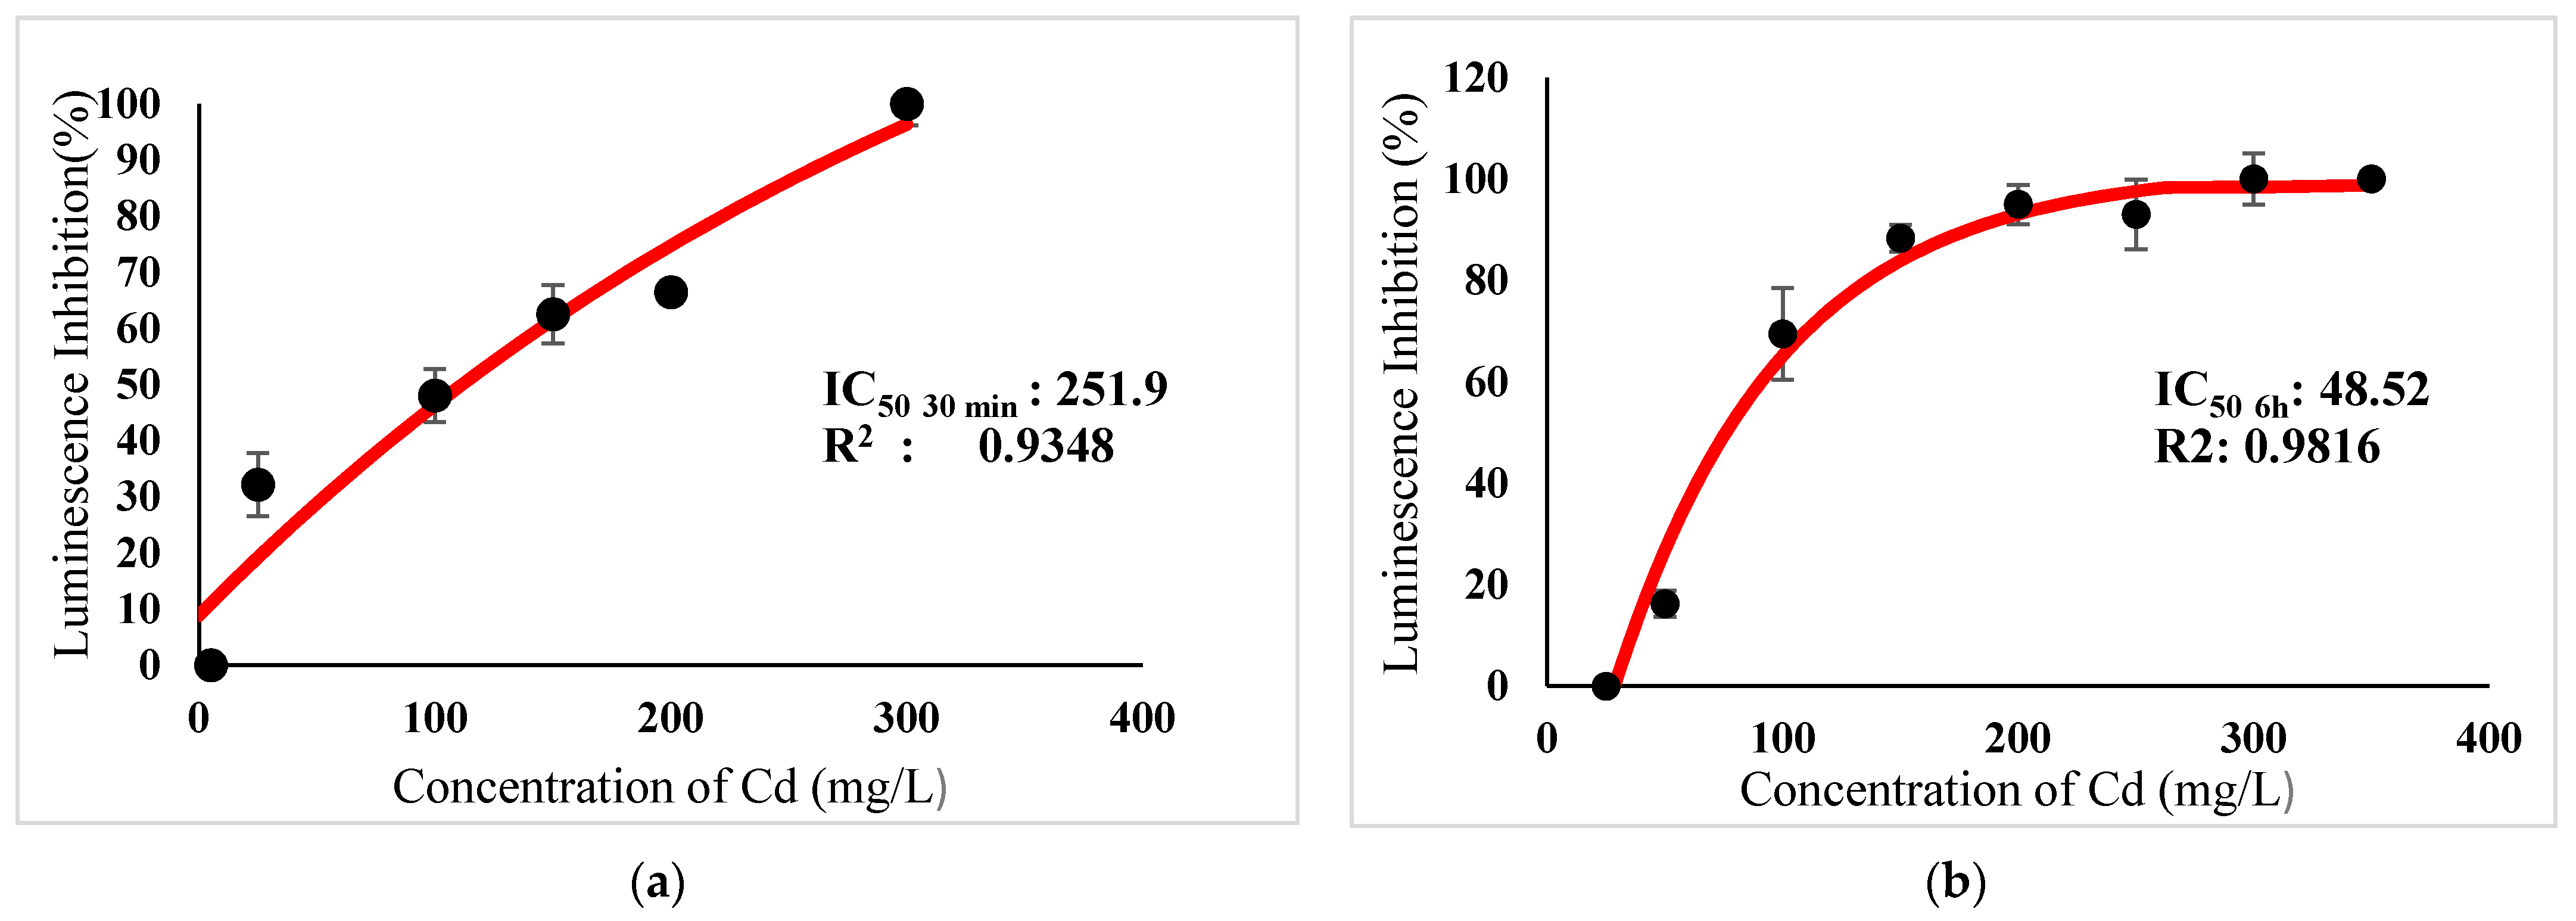
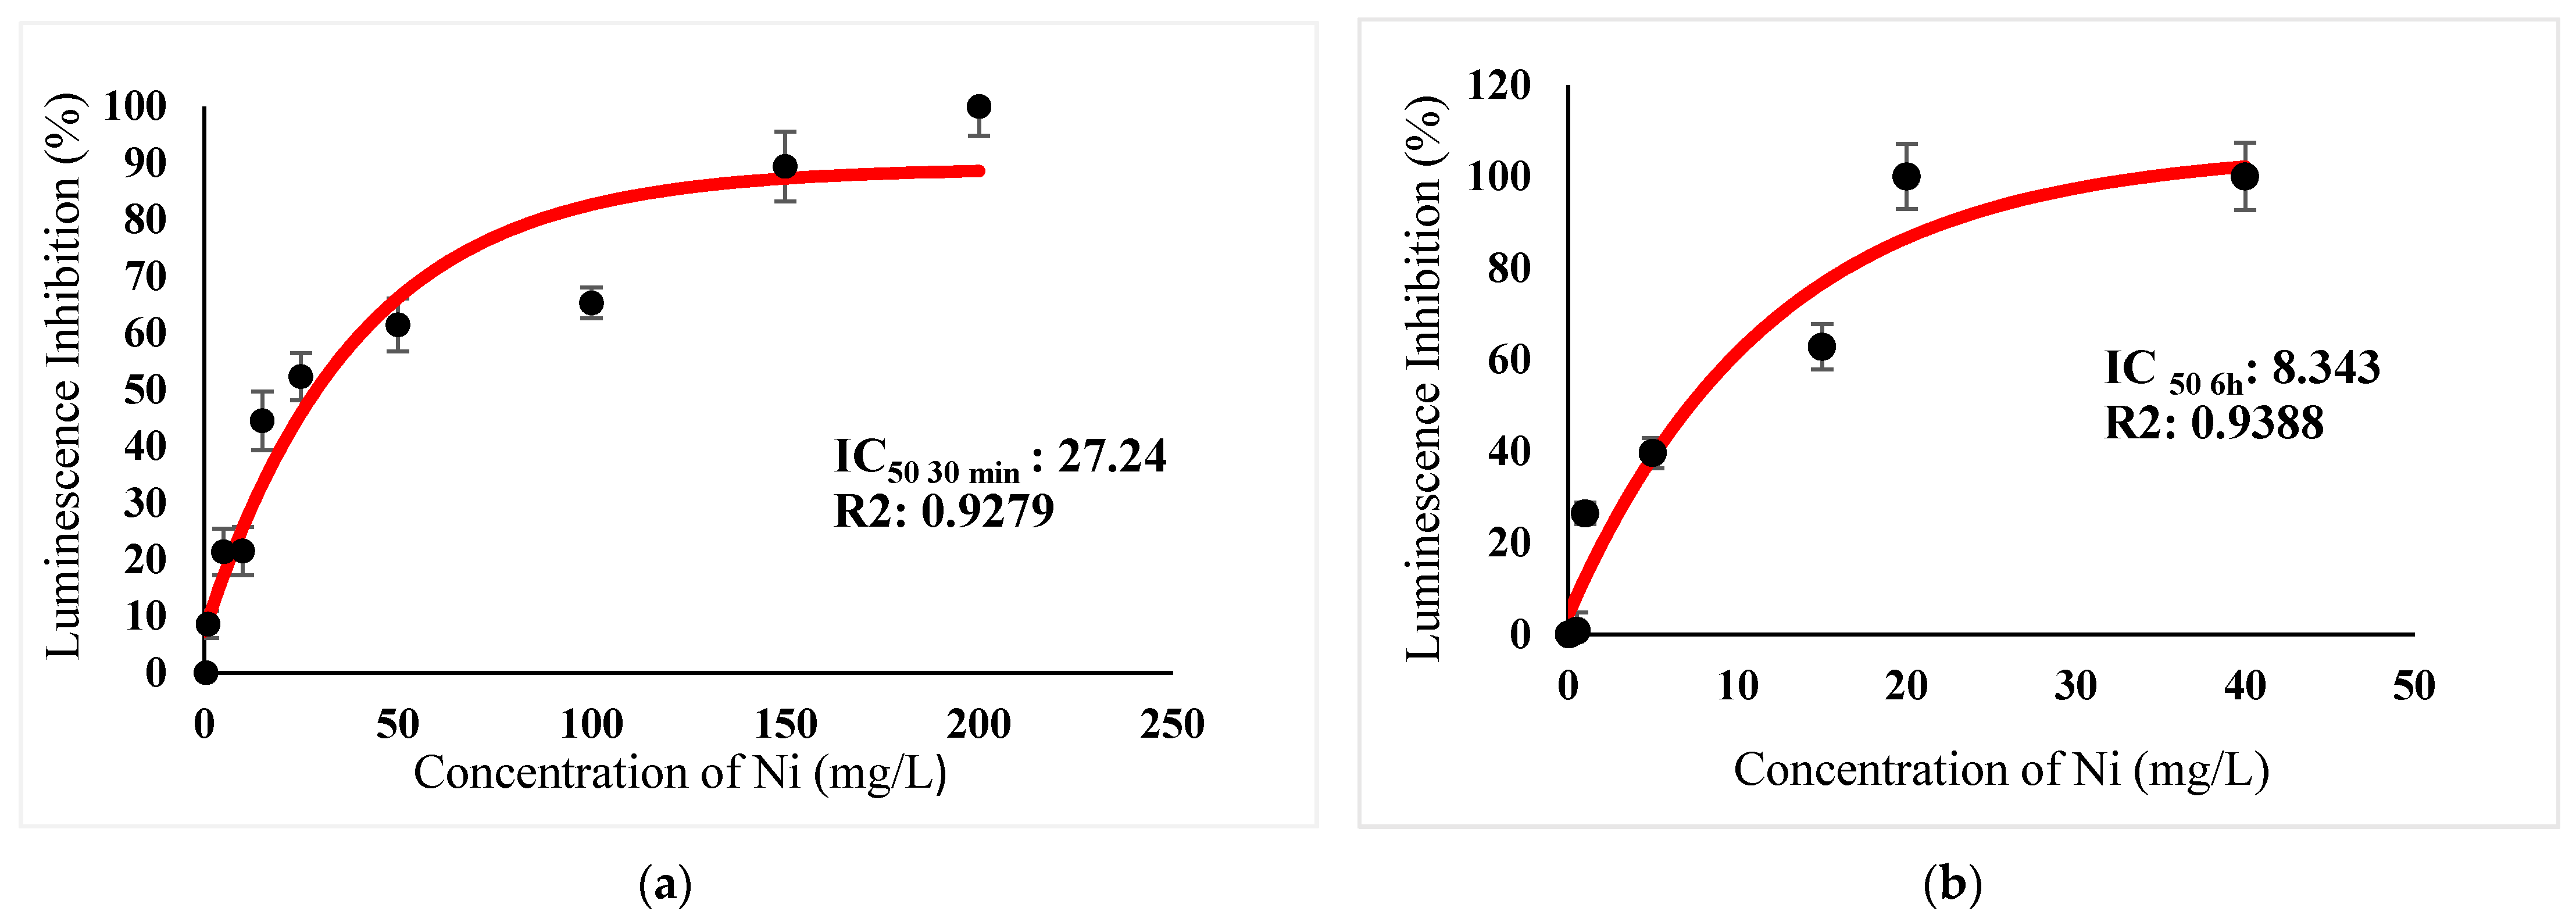
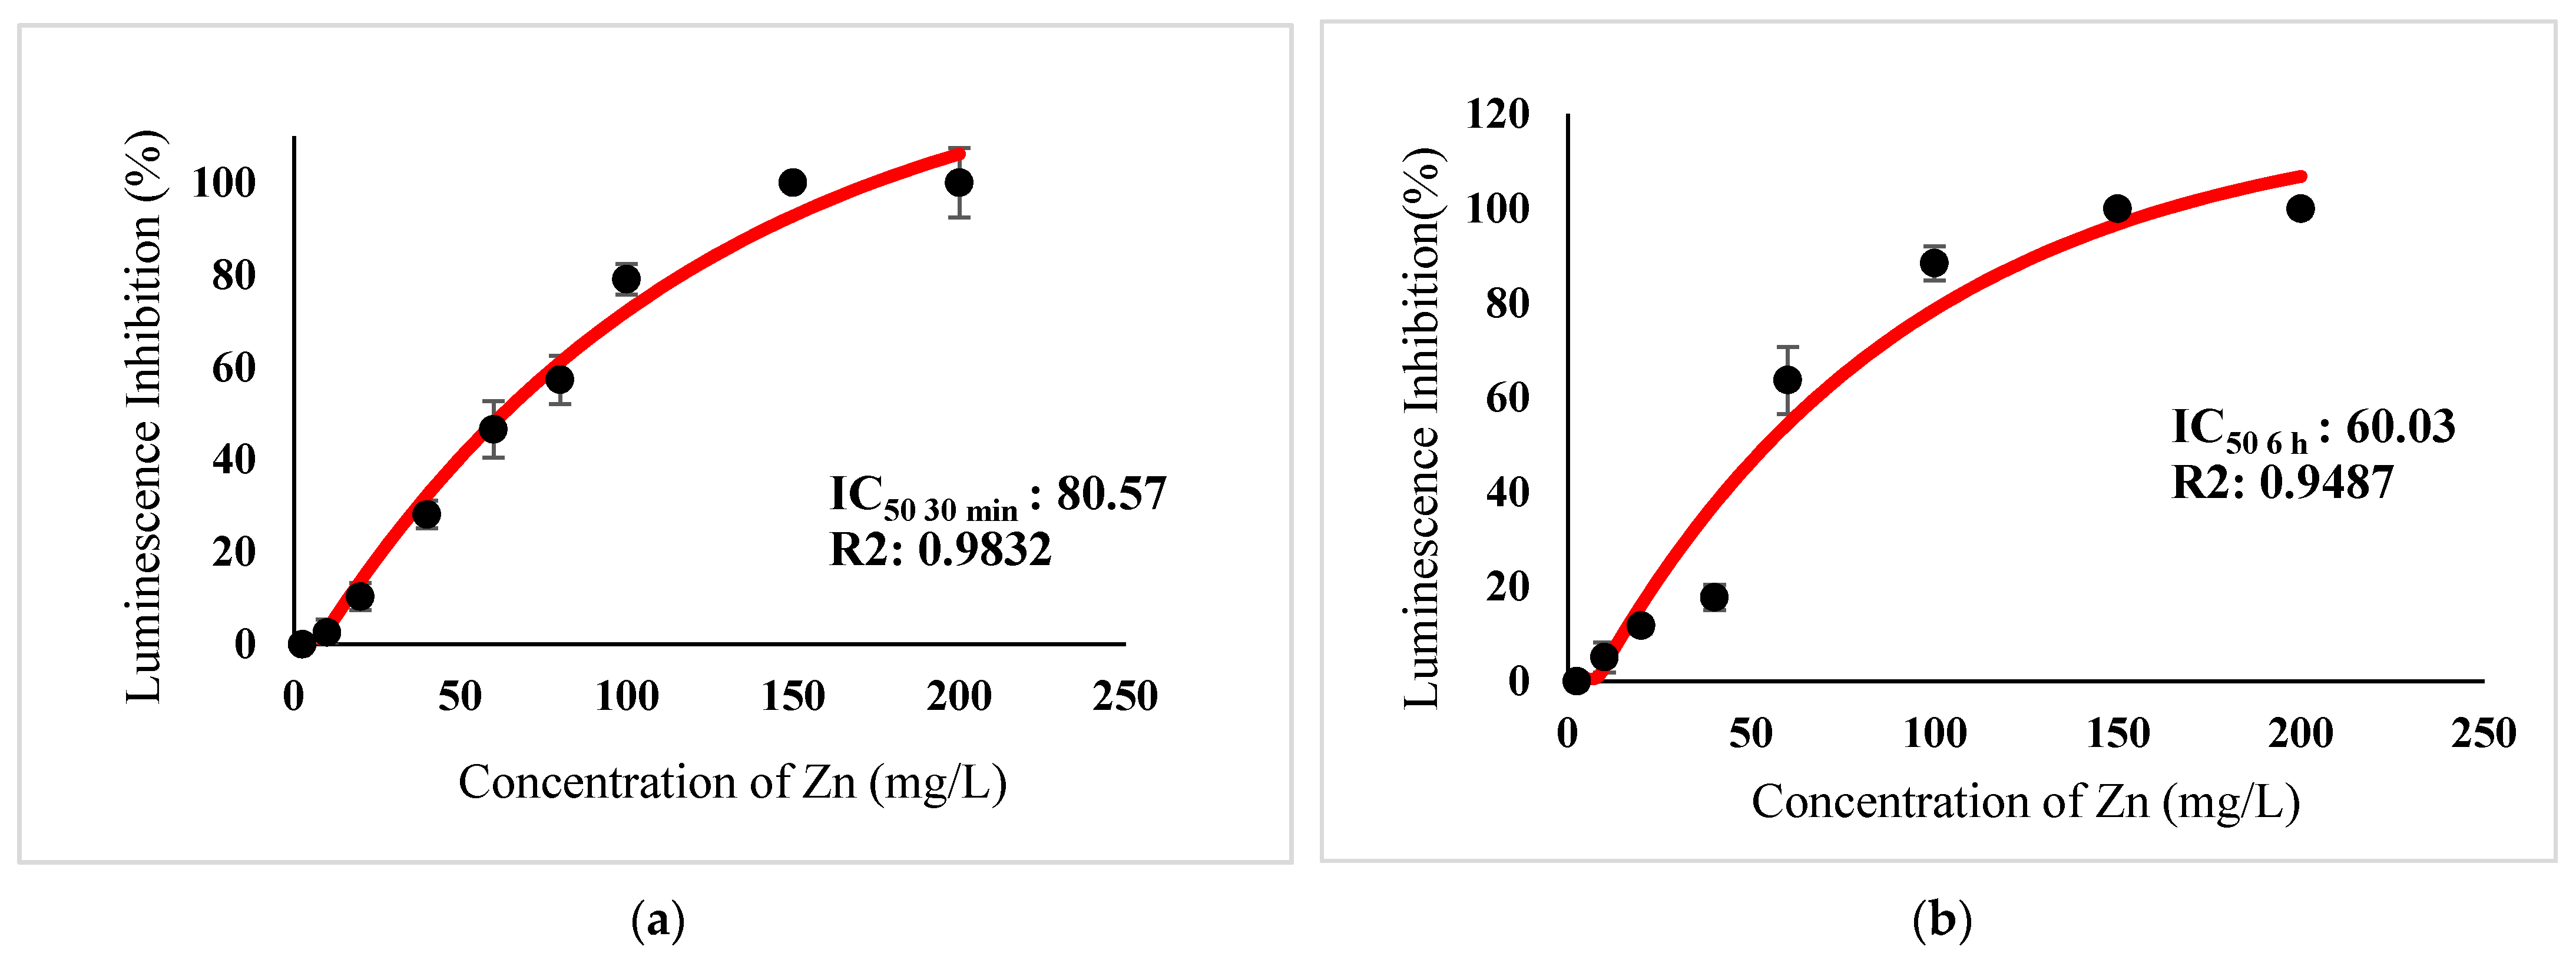
| Metal | Photobacterium sp.NAA-MIE IC 50 30 min (mg/L) | R2 | Photobacterium sp.NAA-MIE IC 50 6 h (mg/L) | R2 |
|---|---|---|---|---|
| Hg2+ | 0.0603 | 0.911 | 0.05714 | 0.8853 |
| Ag+ | 0.5788 | 0.9096 | 1.657 | 0.9427 |
| Cu2+ | 2.943 | 0.9574 | 0.2421 | 0.8142 |
| Cd2+ | 251.9 | 0.9348 | 48.52 | 0.9816 |
| Ni2+ | 27.24 | 0.9279 | 8.343 | 0.9388 |
| Zn2+ | 80.57 | 0.9832 | 60.03 | 0.9487 |
| Mixture | IC50 (30 min) | Toxic Unit of Individual Heavy Metals | Sum of Toxic Units in a Mixture (M) | |||||
|---|---|---|---|---|---|---|---|---|
| TU Hg | TU Ag | TU Cu | TU Cd | TU Zn | TU Ni | |||
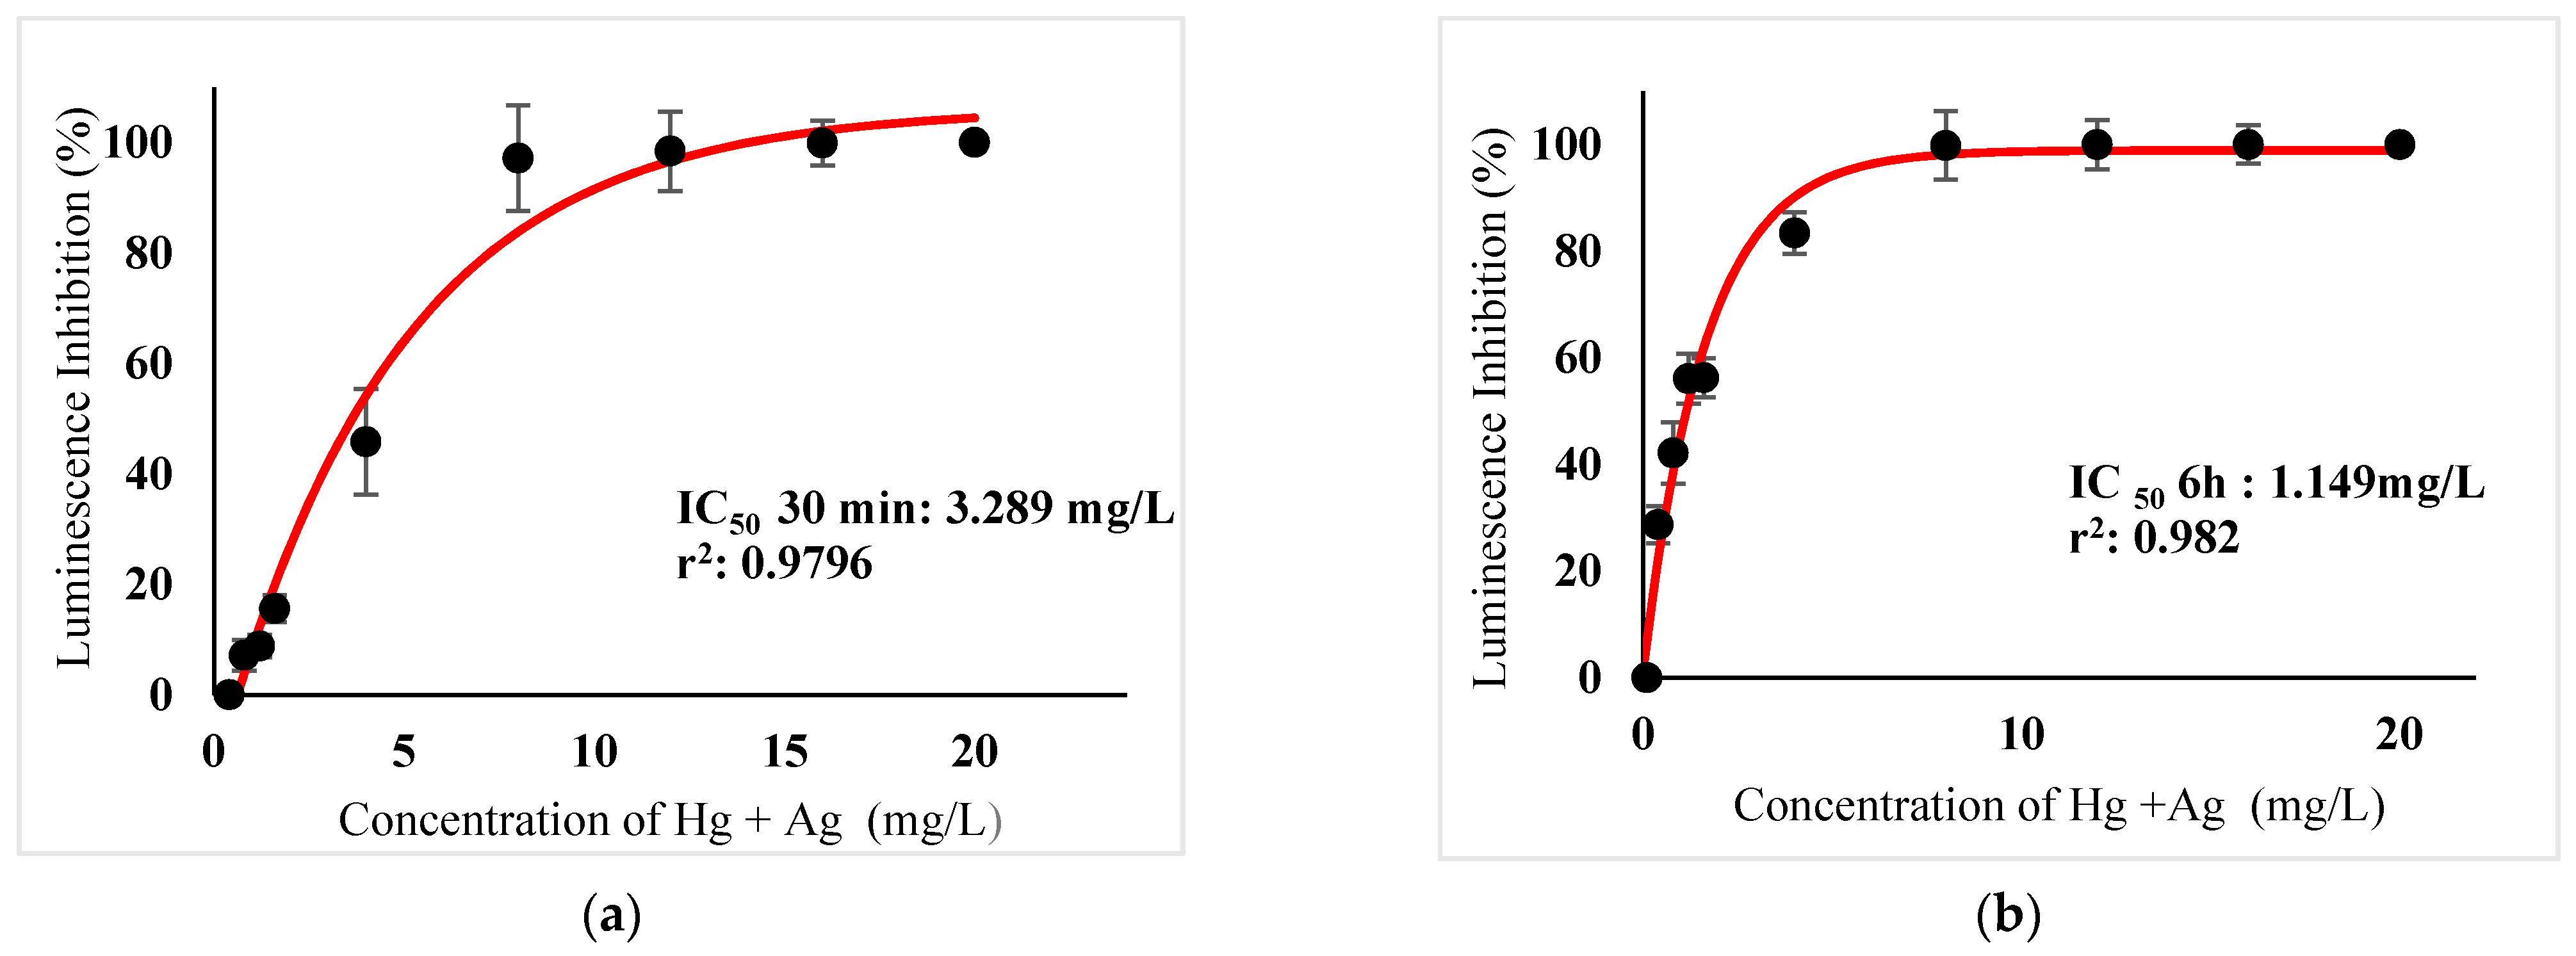
| Hg2+ + Ag+ | 3.289 | 27.272 | 2.840 | - | - | - | - | 30.112 |
| Hg2+ + Cu2+ | 5.016 | 41.592 | - | 0.8522 | - | - | - | 42.444 |
| Ag+ + Cu2+ | 2.083 | - | 1.799 | 0.3539 | - | - | - | 2.153 |
| Hg2+ + Ag+ + Cu2+ | 3.375 | 18.657 | 1.944 | 0.3823 | - | - | - | 20.983 |
| Cu2+ + Zn2+ | 5.963 | - | - | 1.013 | - | 0.037 | - | 1.050 |
| Cd2+ + Cu2+ | 69.13 | - | - | 11.745 | 0.1372 | - | - | 11.882 |
| Ni2+ + Zn2+ | 166.7 | - | - | - | - | 1.035 | 3.060 | 4.095 |
| Mixture | Acute Toxicity | |||
|---|---|---|---|---|
| M | Interactive Effect | MTI | Interactive Effect | |
| Hg2+ + Ag+ | 30.112 | Antagonistic | −33.4 | Antagonistic |
| Hg2+ + Cu2+ | 42.444 | Antagonistic | −188.25 | Antagonistic |
| Ag+ + Cu2+ | 2.153 | Antagonistic | −3.265 | Antagonistic |
| Hg2+ + Ag+ + Cu2+ | 20.983 | Antagonistic | −24.843 | Antagonistic |
| Cu2+ + Zn2+ | 1.050 | Additive | 1 | Additive |
| Cd2+ + Cu2+ | 11.882 | Antagonistic | −206.473 | Antagonistic |
| Ni2+ + Zn2+ | 4.095 | Antagonistic | −3.842 | Antagonistic |
| Mixture | IC50 (6 h) | Toxic Unit of Individual Heavy Metals | Sum of Toxic Units in a Mixture (M) | |||||
|---|---|---|---|---|---|---|---|---|
| TU Hg | TU Ag | TU Cu | TU Cd | TU Zn | TU Ni | |||
| Hg2+ + Ag+ | 1.149 | 10.061 | 0.3467 | - | - | - | - | 10.408 |
| Hg2+ + Cu2+ | 6.748 | 59.048 | - | 13.936 | - | - | - | 72.984 |
| Ag+ + Cu2+ | 2.435 | - | 0.7351 | 5.031 | - | - | - | 5.766 |
| Hg2+ + Ag+ + Cu2+ | 6.004 | 35.019 | 1.208 | 8.265 | - | - | - | 44.492 |
| Cu2+ + Zn2+ | 0.7675 | - | - | 1.585 | - | 0.006 | - | 1.591 |
| Cd2+ + Cu2+ | 43.44 | - | - | 89.715 | 0.447 | - | - | 90.162 |
| Ni2+ + Zn2+ | 0.9106 | - | - | - | - | 0.008 | 0.055 | 0.063 |
| Mixture | Chronic Toxicity | |||
|---|---|---|---|---|
| M | Interactive Effect | MTI | Interactive Effect | |
| Hg2+ + Ag+ | 10.408 | Antagonistic | −22.666 | Antagonistic |
| Hg2+ + Cu2+ | 72.984 | Antagonistic | −19.429 | Antagonistic |
| Ag+ + Cu2+ | 5.766 | Antagonistic | −11.856 | Antagonistic |
| Hg2+ + Ag+ + Cu2+ | 44.492 | Antagonistic | −14.827 | Antagonistic |
| Cu2+ + Zn2+ | 1.591 | Antagonistic | −115.32 | Antagonistic |
| Cd2+ + Cu2+ | 90.162 | Antagonistic | −901.58 | Antagonistic |
| Ni2+ + Zn2+ | 0.063 | Synergistic | 22.342 | Synergistic |
| Mixture | Acute Toxicity | Chronic Toxicity | ||||||
|---|---|---|---|---|---|---|---|---|
| M | Interactive Effect | MTI | Interactive Effect | M | Interactive Effect | MTI | Interactive Effect | |
| Hg2+ + Ag+ | 30.112 | Antagonistic | −33.4 | Antagonistic | 10.408 | Antagonistic | −22.666 | Antagonistic |
| Hg2+ + Cu2+ | 42.444 | Antagonistic | −188.25 | Antagonistic | 72.984 | Antagonistic | −19.429 | Antagonistic |
| Ag+ + Cu2+ | 2.153 | Antagonistic | −3.265 | Antagonistic | 5.766 | Antagonistic | −11.856 | Antagonistic |
| Hg2+ + Ag+ + Cu2+ | 20.983 | Antagonistic | −24.843 | Antagonistic | 44.492 | Antagonistic | −14.827 | Antagonistic |
| Cu2+ + Zn2+ | 1.050 | Additive | 1 | Additive | 1.591 | Antagonistic | −115.32 | Antagonistic |
| Cd2+ + Cu2+ | 11.882 | Antagonistic | −206.472 | Antagonistic | 90.162 | Antagonistic | −901.58 | Antagonistic |
| Ni2+ + Zn2+ | 4.095 | Antagonistic | −3.842 | Antagonistic | 0.063 | Synergistic | 22.342 | Synergistic |
| Mixture | 30-min Acute Toxicity Photobacterium sp.NAA-MIE | 6 h-Chronic Toxicity Photobacterium sp.NAA-MIE | Other Studies | |
|---|---|---|---|---|
| Interactive Effect | Interactive Effect | Organism | Interactive Effect | |
| Hg + Ag | Antagonistic | Antagonistic | Not applicable | - |
| Hg + Cu | Antagonistic | Antagonistic | Not applicable | - |
| Ag + Cu | Antagonistic | Antagonistic | Not applicable | - |
| Hg + Ag + Cu | Antagonistic | Antagonistic | Not applicable | - |
| Cu + Zn | Additive | Antagonistic | Clariasgariepinus [33] Thalassiosira pseudonana, Hydroides elegan, and Elasmopus rapax [49] Vibrio fischeri [55] | Antagonistic a Synergistic a Synergistic a |
| Cd + Cu | Antagonistic | Antagonistic | P. phosphoreum [13] Vibrio fischeri [21] | Antagonistic a Antagonistic a |
| Ni + Zn | Antagonistic | Synergistic | Pimephales promelas [56] Daphnia magna [57] | Synergistic a Antagonistic b |
Publisher’s Note: MDPI stays neutral with regard to jurisdictional claims in published maps and institutional affiliations. |
© 2021 by the authors. Licensee MDPI, Basel, Switzerland. This article is an open access article distributed under the terms and conditions of the Creative Commons Attribution (CC BY) license (https://creativecommons.org/licenses/by/4.0/).
Share and Cite
Adnan, N.A.; Halmi, M.I.E.; Abd Gani, S.S.; Zaidan, U.H.; Abd Shukor, M.Y. Comparison of Joint Effect of Acute and Chronic Toxicity for Combined Assessment of Heavy Metals on Photobacterium sp.NAA-MIE. Int. J. Environ. Res. Public Health 2021, 18, 6644. https://0-doi-org.brum.beds.ac.uk/10.3390/ijerph18126644
Adnan NA, Halmi MIE, Abd Gani SS, Zaidan UH, Abd Shukor MY. Comparison of Joint Effect of Acute and Chronic Toxicity for Combined Assessment of Heavy Metals on Photobacterium sp.NAA-MIE. International Journal of Environmental Research and Public Health. 2021; 18(12):6644. https://0-doi-org.brum.beds.ac.uk/10.3390/ijerph18126644
Chicago/Turabian StyleAdnan, Nur Adila, Mohd Izuan Effendi Halmi, Siti Salwa Abd Gani, Uswatun Hasanah Zaidan, and Mohd Yunus Abd Shukor. 2021. "Comparison of Joint Effect of Acute and Chronic Toxicity for Combined Assessment of Heavy Metals on Photobacterium sp.NAA-MIE" International Journal of Environmental Research and Public Health 18, no. 12: 6644. https://0-doi-org.brum.beds.ac.uk/10.3390/ijerph18126644