
Assessment of Age-Related Changes on Masticatory Function in a Population with Normal Dentition


Abstract
:1. Introduction
2. Materials and Methods
2.1. Participants
2.2. Study Design
2.2.1. Objective Assessment
Dental Status
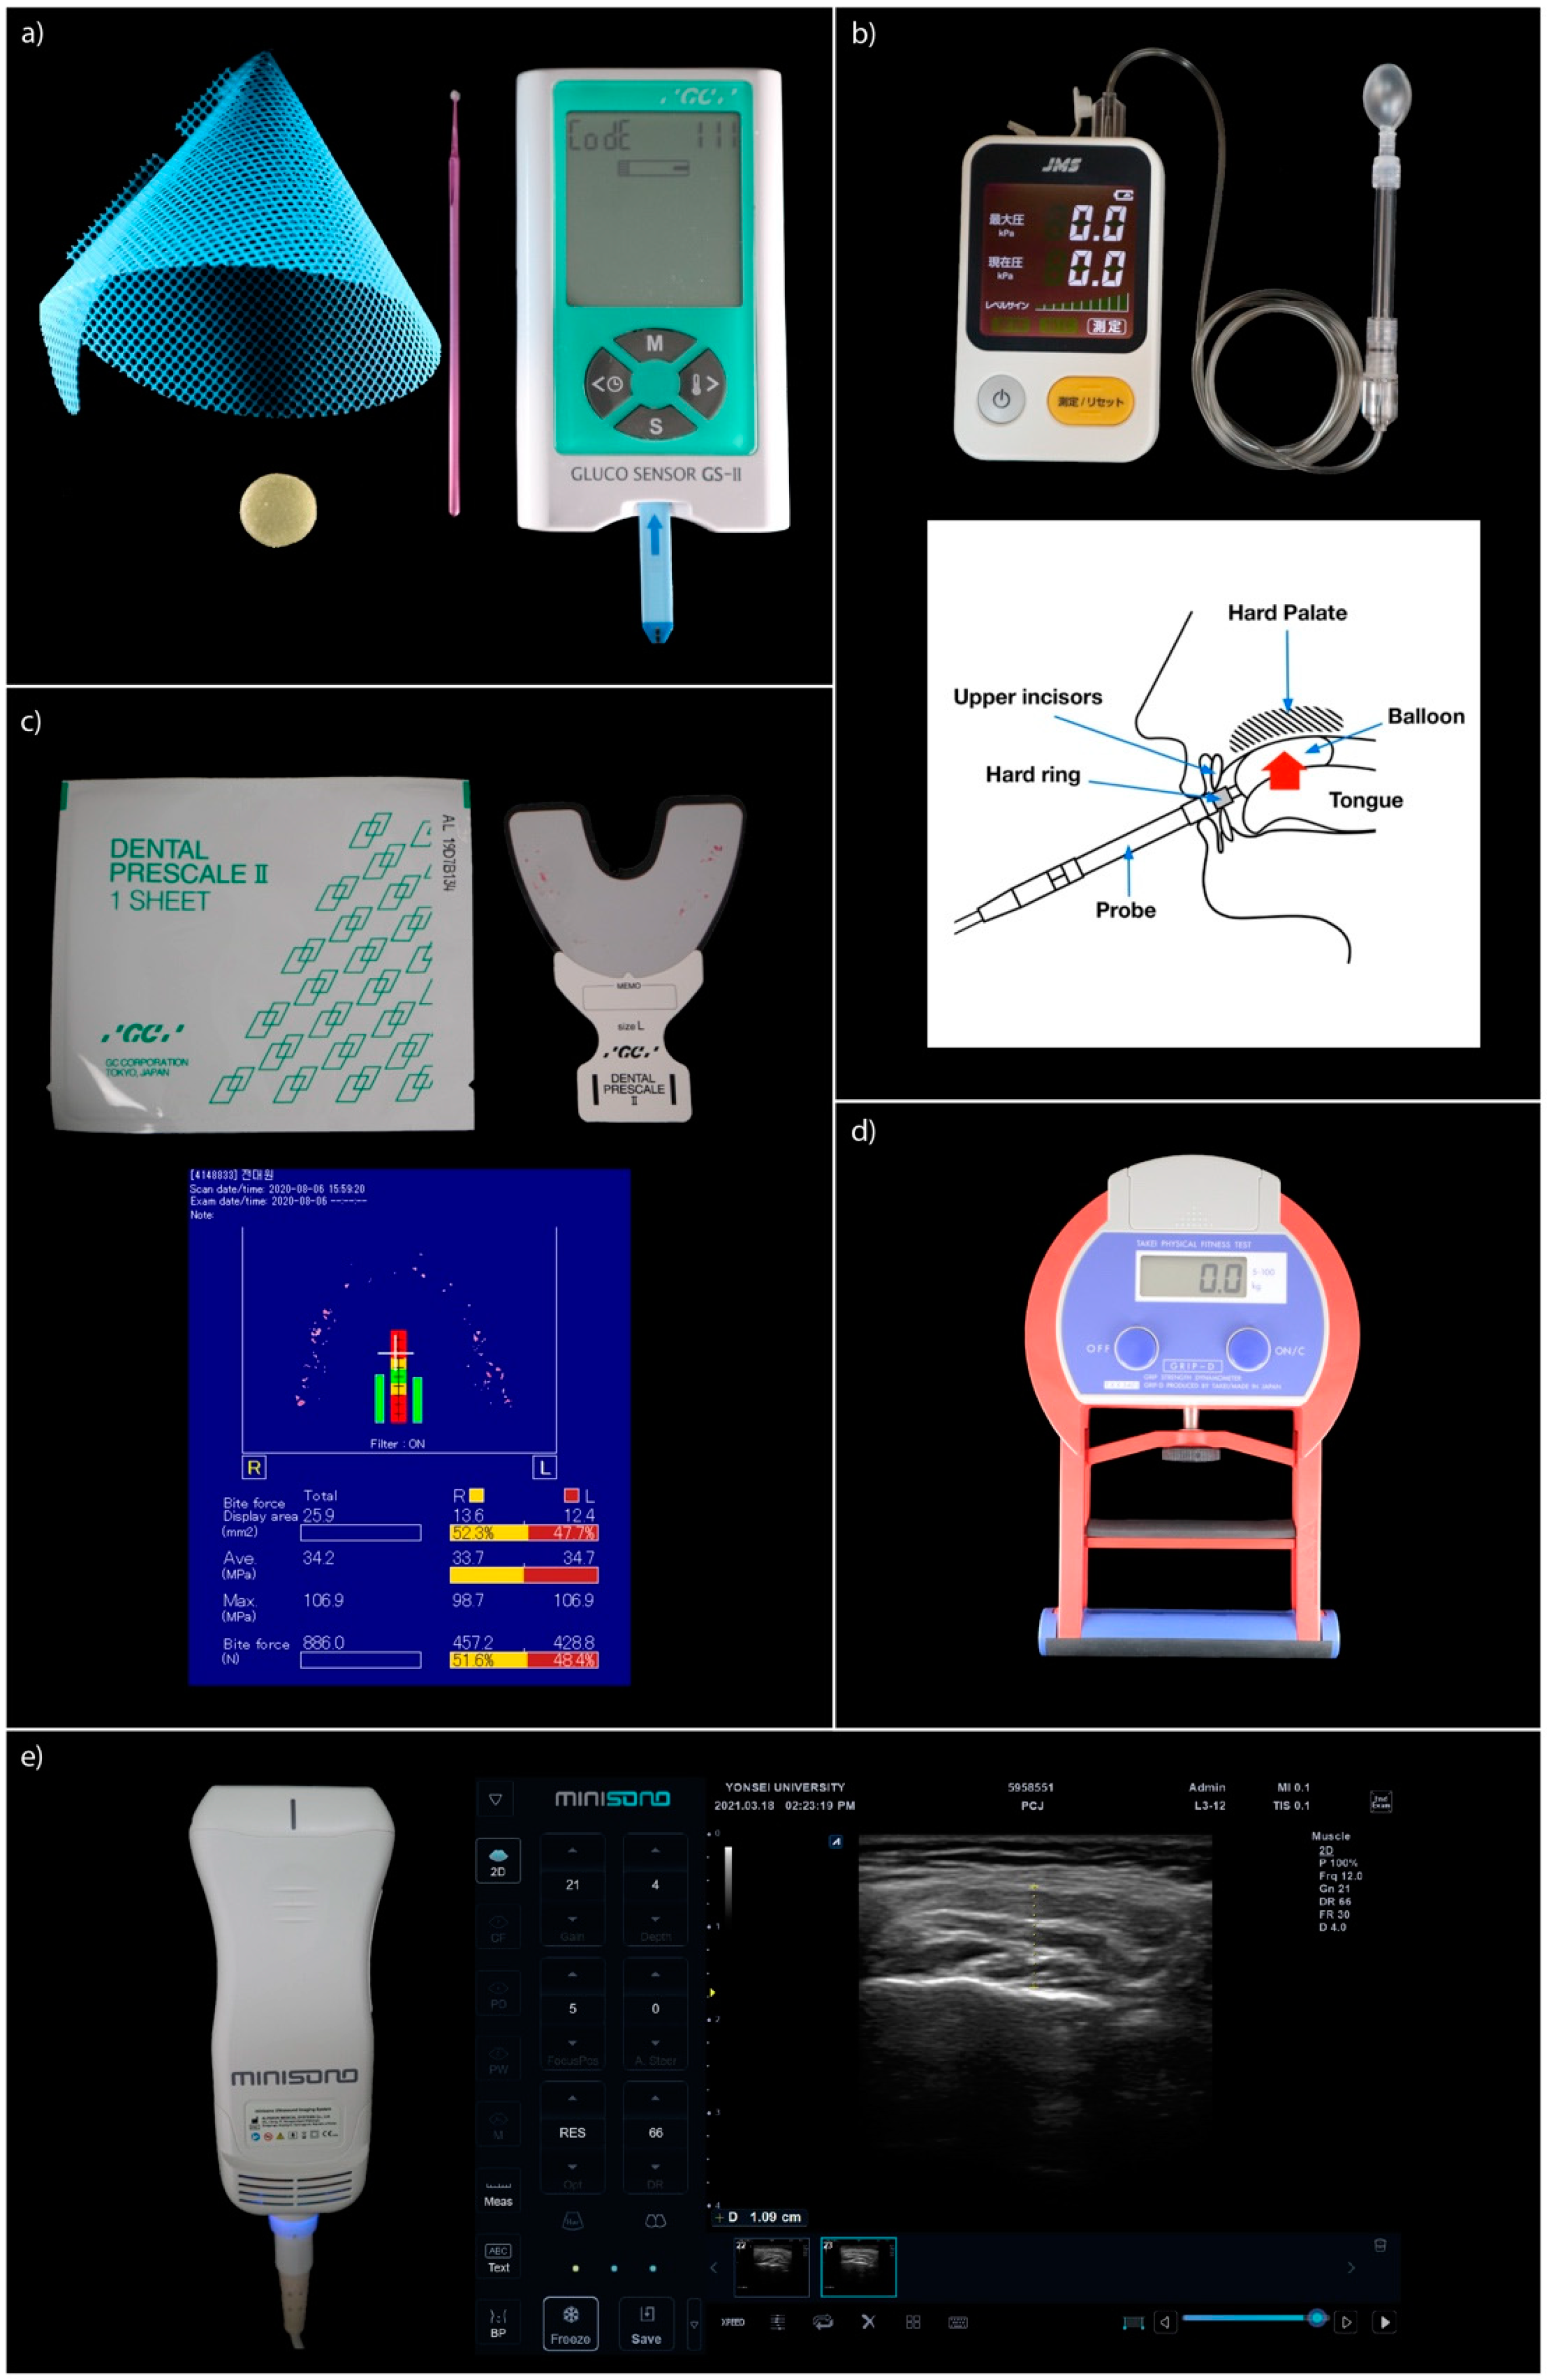
Masticatory Performance
Tongue Pressure
Bite Force and Occluding Bite Area
Handgrip Strength
Masseter Muscle Thickness (MMT)
2.2.2. Subjective Assessment
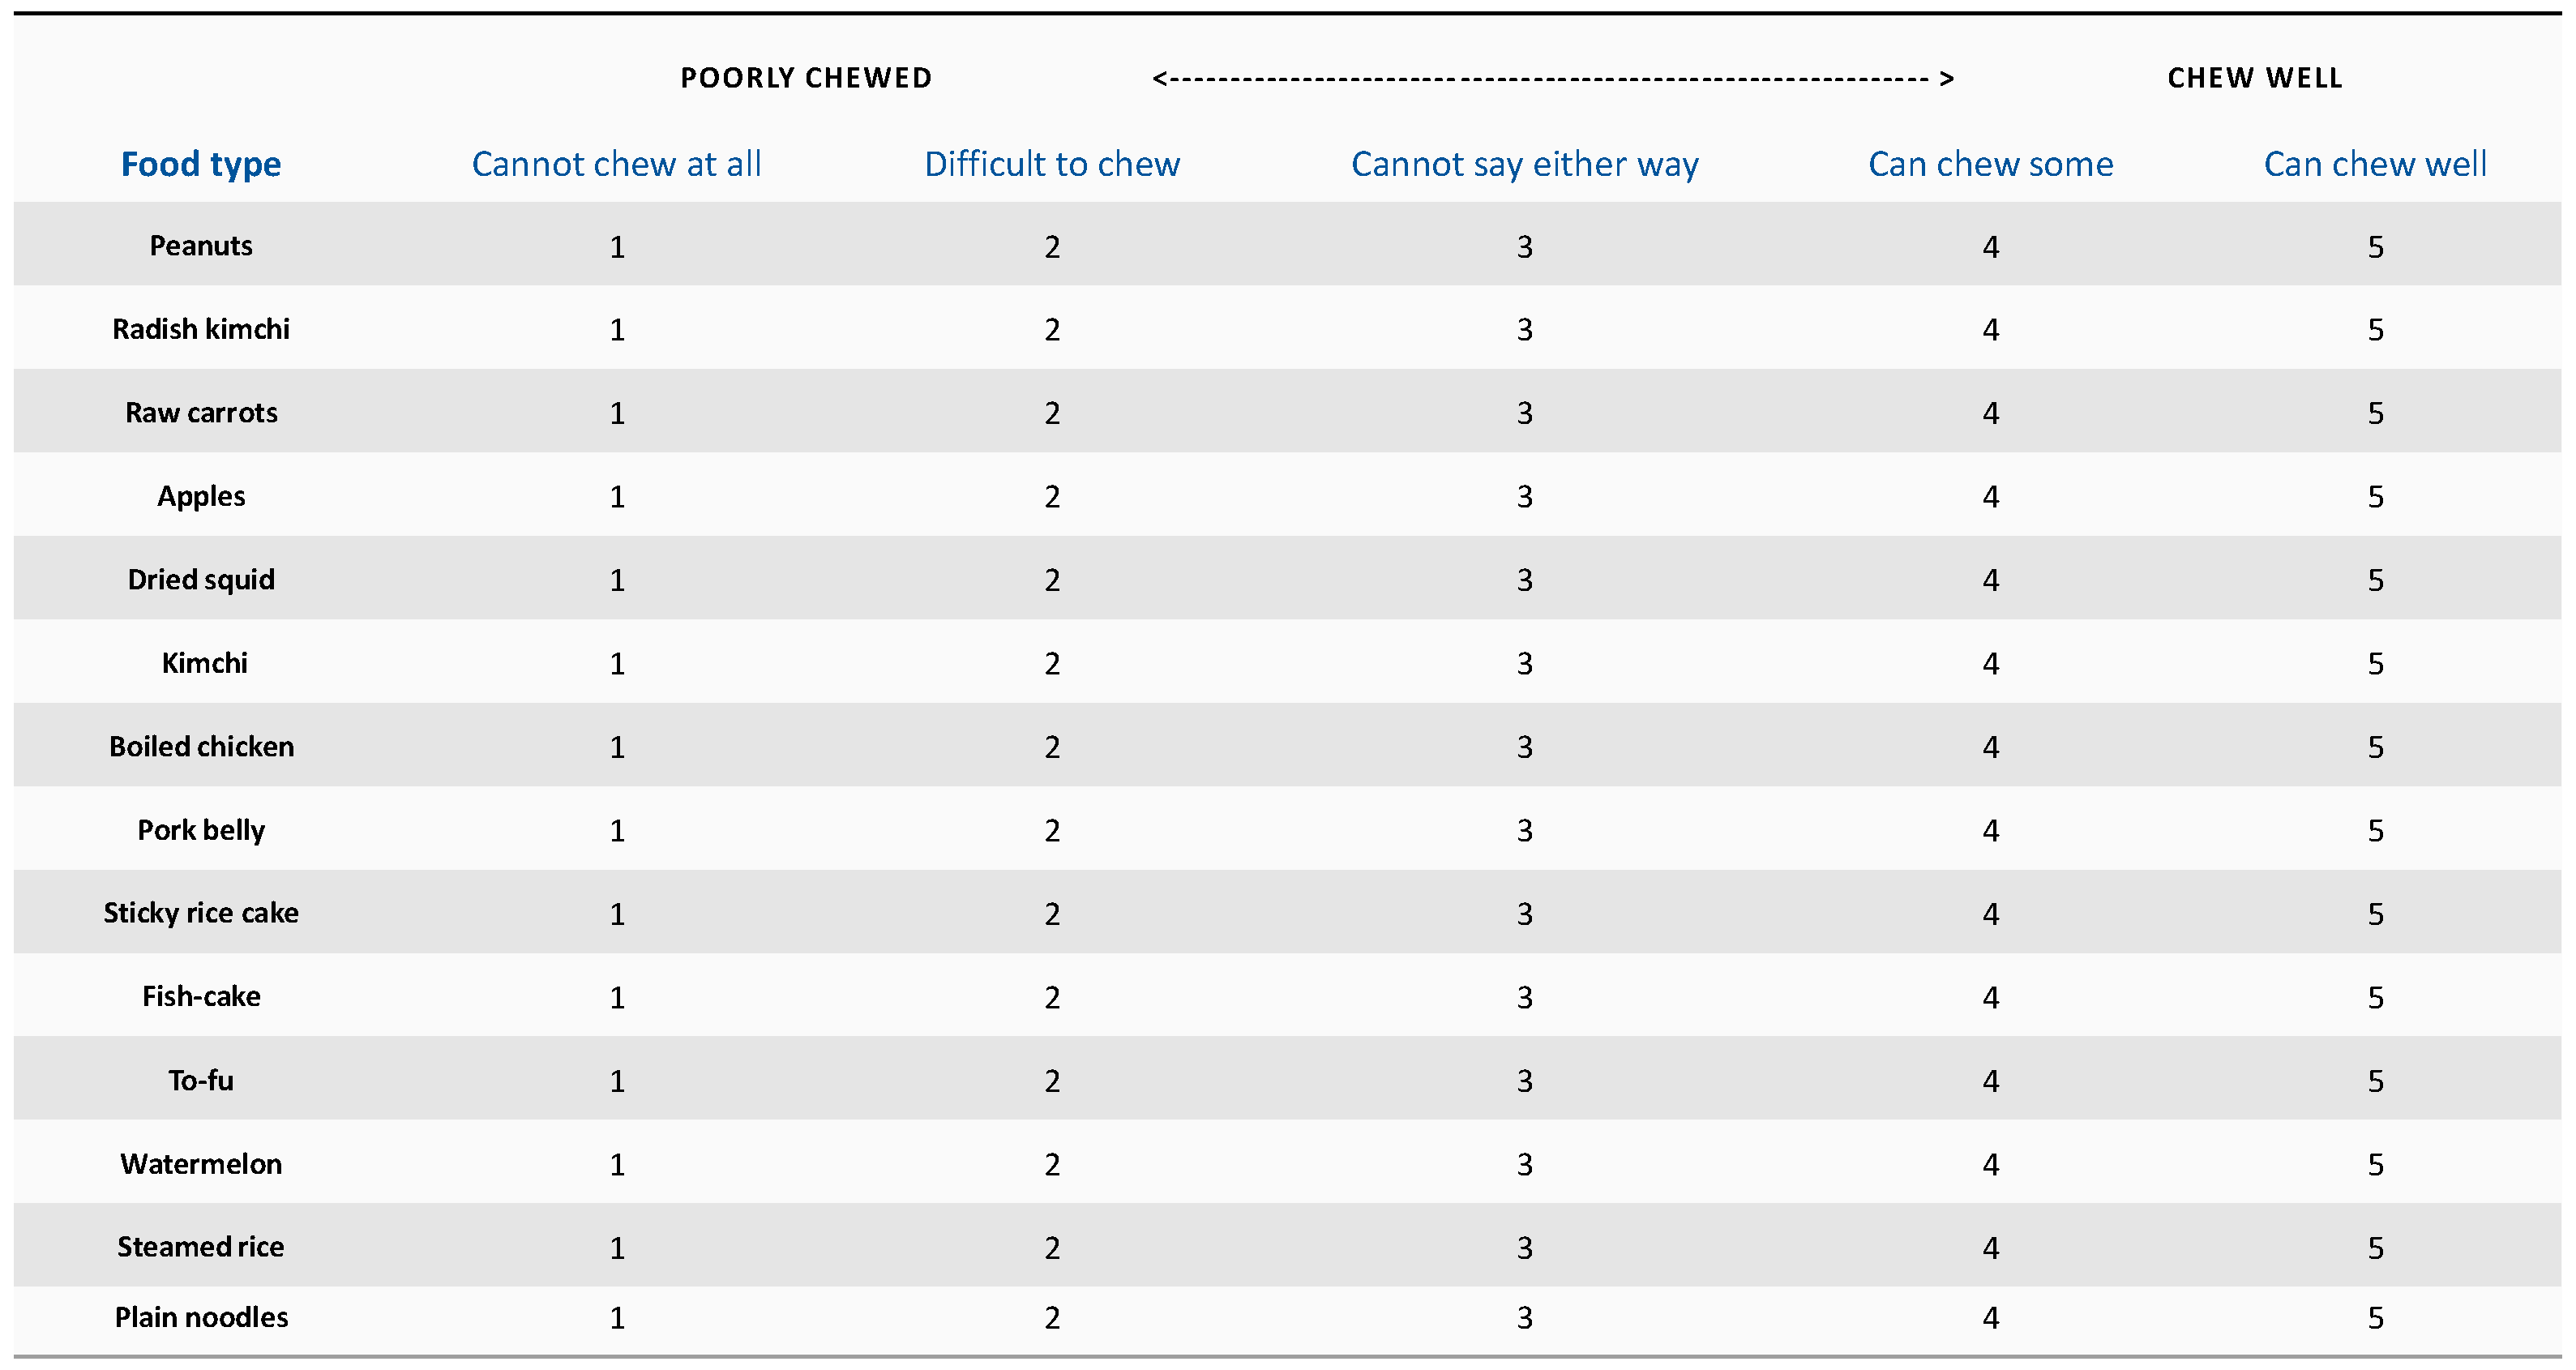
Food Intake Ability (FIA) Questionnaire (14 Items)
OHIP-14
2.3. Statistical Analysis
3. Results
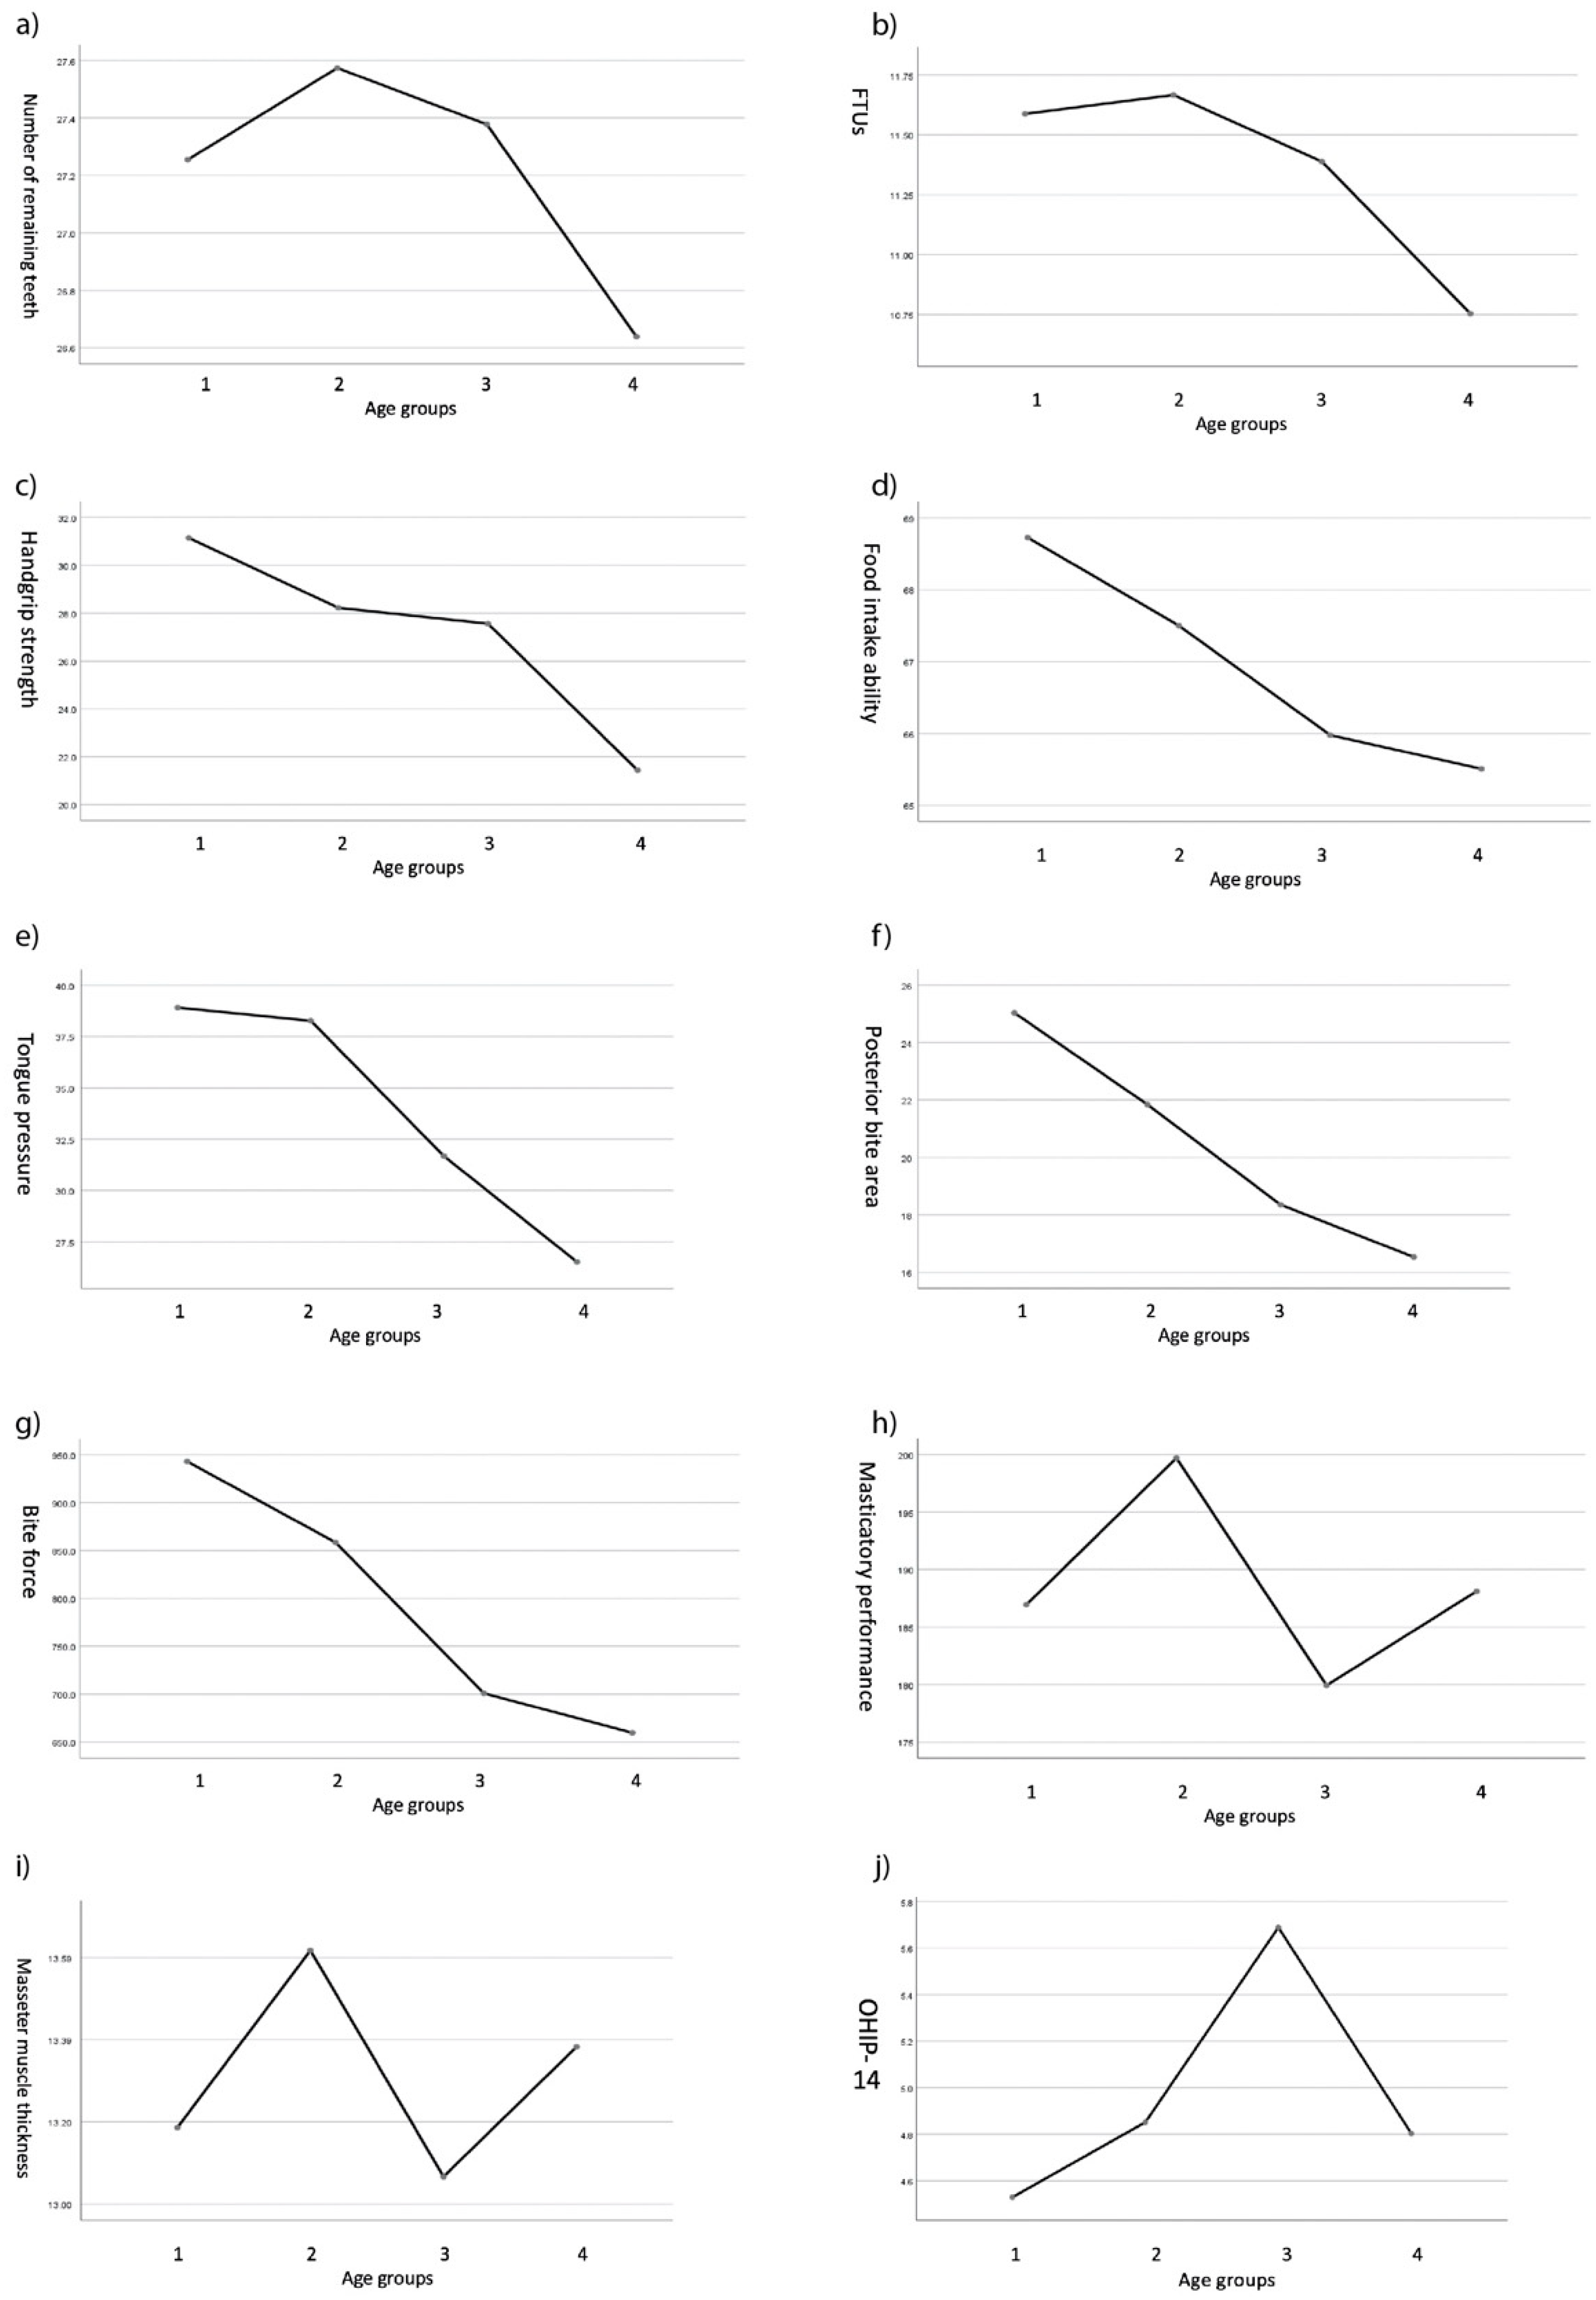
3.1. Differences in Masticatory Function among Different Age Groups
3.2. Bivariate Correlations with Variables
3.3. Multiple Linear Regression Analysis with Masticatory Performance
3.4. Multiple Linear Regression Analysis with Food Intake Ability
3.5. Stepwise Multiple Linear Regression Analysis with Handgrip Strength
4. Discussion
5. Conclusions
Supplementary Materials
Author Contributions
Funding
Institutional Review Board Statement
Informed Consent Statement
Conflicts of Interest
Appendix A

| Age Groups | Shapiro-Wilk | Skewness | Kurtosis | |
|---|---|---|---|---|
| p | ||||
| 20–45 (1) | PBA | 0.180 | 1.002 | 1.031 |
| ABA | 0.596 | 2.205 | 5.675 | |
| RT | 0.000 | −1.441 | 0.670 | |
| FTUs | 0.000 | −1.499 | 0.307 | |
| MP | 0.776 | 0.158 | −0.487 | |
| BF | 0.871 | 0.717 | −0.248 | |
| TP | 0.571 | −0.399 | 0.263 | |
| HG | 0.004 | 0.166 | −1.063 | |
| MMT | 0.284 | 0.000 | −0.705 | |
| FIA | 0.000 | −2.958 | 9.787 | |
| OHIP-14 | 0.000 | 1.119 | −0.217 | |
| 46–60 (2) | PBA | 0.162 | 0.628 | 0.206 |
| ABA | 0.060 | 4.648 | 23.767 | |
| RT | 0.000 | −1.945 | 4.665 | |
| FTUs | 0.000 | −2.211 | 4.066 | |
| MP | 0.300 | 0.235 | −0.739 | |
| BF | 0.068 | 0.541 | −0.299 | |
| TP | 0.621 | −0.281 | −0.137 | |
| HG | 0.054 | 0.140 | −1.058 | |
| MMT | 0.542 | 0.186 | −0.709 | |
| FIA | 0.000 | −2.517 | 5.455 | |
| OHIP-14 | 0.000 | 2.612 | 7.587 | |
| 61–70 (3) | PBA | 0.014 | 0.992 | 1.106 |
| ABA | 0.000 | 6.605 | 44.055 | |
| RT | 0.000 | −2.276 | 5.426 | |
| FTUs | 0.000 | −1.896 | 3.124 | |
| MP | 0.404 | 0.521 | 0.539 | |
| BF | 0.905 | 1.088 | 1.619 | |
| TP | 0.354 | −0.499 | 0.805 | |
| HG | 0.342 | 0.085 | −1.300 | |
| MMT | 0.372 | 0.430 | 0.316 | |
| FIA | 0.000 | −1.765 | 2.114 | |
| OHIP-14 | 0.354 | 1.436 | 1.257 | |
| 71+ (4) | PBA | 0.681 | 0.128 | −0.423 |
| ABA | 0.000 | 2.899 | 9.808 | |
| RT | 0.000 | −0.491 | −0.329 | |
| FTUs | 0.000 | −0.740 | −0.102 | |
| MP | 0.662 | −0.154 | −0.014 | |
| BF | 0.489 | 0.017 | −0.446 | |
| TP | 0.360 | 0.187 | 1.235 | |
| HG | 0.197 | 0.336 | −0.404 | |
| MMT | 0.242 | 0.297 | 0.401 | |
| FIA | 0.000 | −1.618 | 1.798 | |
| OHIP-14 | 0.000 | 1.416 | 1.215 |
| Age | RT | FTUs | MP | TP | HG | PBA | ABA | BF | MMT | FIA | OHIP_14 | |
|---|---|---|---|---|---|---|---|---|---|---|---|---|
| Age | 1 | |||||||||||
| RT | −0.185 ** | 1 | ||||||||||
| FTUs | −0.304 *** | 0.892 *** | 1 | |||||||||
| MP | 0.003 | 0.079 | 0.092 | 1 | ||||||||
| TP | −0.431 *** | 0.132 | 0.156 * | 0.094 | 1 | |||||||
| HG | −0.331 *** | 0.157 * | 0.155 * | 0.099 | 0.570 *** | 1 | ||||||
| PBA | −0.279 *** | 0.252 *** | 0.303 *** | 0.306 *** | 0.342 *** | 0.423 *** | 1 | |||||
| ABA | 0.039 | 0.057 | 0.032 | −0.113 | −0.041 | −0.059 | −0.142 * | 1 | ||||
| BF | −0.278 *** | 0.191 ** | 0.230 *** | 0.287 *** | 0.324 *** | 0.422 *** | 0.870 *** | −0.073 | 1 | |||
| MMT | 0.035 | 0.033 | 0.002 | 0.193 ** | 0.314 *** | 0.509 *** | 0.459 *** | −0.082 | 0.456 *** | 1 | ||
| FIA | −0.237 *** | 0.157 * | 0.253 *** | 0.170 * | 0.260 *** | 0.310 *** | 0.244 *** | 0.025 | 0.268 *** | 0.160 * | 1 | |
| OHIP_14 | 0.043 | 0.009 | −0.057 | −0.142 * | −0.084 | −0.141 * | −0.136 * | 0.002 | −0.158 * | −0.112 | −0.518 *** | 1 |


References
- Lamster, I.B.; Asadourian, L.; Del Carmen, T.; Friedman, P.K. The aging mouth: Differentiating normal aging from disease. Periodontology 2000 2016, 72, 96–107. [Google Scholar] [CrossRef] [PubMed]
- van der Bilt, A. Assessment of mastication with implications for oral rehabilitation: A review. J. Oral Rehabil. 2011, 38, 754–780. [Google Scholar] [CrossRef] [PubMed]
- Hatch, J.P.; Shinkai, R.S.A.; Sakai, S.; Rugh, J.D.; Paunovich, E.D. Determinants of masticatory performance in dentate adults. Arch. Oral Biol. 2001, 46, 641–648. [Google Scholar] [CrossRef]
- Wintergerst, A.M.; Hernández-Sánchez, F. Masticatory performance parameters for young adults with “normal” occlusion. Cranio 2019, 37, 317–322. [Google Scholar] [CrossRef] [PubMed]
- Sato, H.; Fueki, K.; Sueda, S.; Sato, S.; Shiozaki, T.; Kato, M.; Ohyama, T. A new and simple method for evaluating masticatory function using newly developed artificial test food. J. Oral Rehabil. 2003, 30, 68–73. [Google Scholar] [CrossRef]
- Uesugi, H.; Shiga, H. Relationship between masticatory performance using a gummy jelly and masticatory movement. J. Prosthodont. Res. 2017, 61, 419–425. [Google Scholar] [CrossRef] [PubMed]
- Takagi, D.; Watanabe, Y.; Edahiro, A.; Ohara, Y.; Murakami, M.; Murakami, K.; Hironaka, S.; Taniguchi, Y.; Kitamura, A.; Shinkai, S.; et al. Factors affecting masticatory function of community-dwelling older people: Investigation of the differences in the relevant factors for subjective and objective assessment. Gerodontology 2017, 34, 357–364. [Google Scholar] [CrossRef]
- Locker, D.; Matear, D.; Stephens, M.; Lawrence, H.; Payne, B. Comparison of the GOHAI and OHIP-14 as measures of the oral health-related quality of life of the elderly. Community Dent. Oral Epidemiol. 2001, 29, 373–381. [Google Scholar] [CrossRef] [PubMed]
- Käyser, A.F. Shortened dental arches and oral function. J. Oral Rehabil. 1981, 8, 457–462. [Google Scholar] [CrossRef]
- Ueno, M.; Yanagisawa, T.; Shinada, K.; Ohara, S.; Kawaguchi, Y. Masticatory ability and functional tooth units in Japanese adults. J. Oral Rehabil. 2008, 35, 337–344. [Google Scholar] [CrossRef]
- Singh, K.A.; Brennan, D.S. Chewing disability in older adults attributable to tooth loss and other oral conditions. Gerodontology 2012, 29, 106–110. [Google Scholar] [CrossRef]
- Boretti, G.; Bickel, M.; Geering, A.H. A review of masticatory ability and efficiency. J. Prosthet. Dent. 1995, 74, 400–403. [Google Scholar] [CrossRef]
- Ikebe, K.; Morii, K.; Matsuda, K.I.; Nokubi, T. Discrepancy between satisfaction with mastication, food acceptability, and masticatory performance in older adults. Int. J. Prosthodont. 2007, 20, 161–167. [Google Scholar]
- Ikebe, K.; Matsuda, K.I.; Kagawa, R.; Enoki, K.; Yoshida, M.; Maeda, Y.; Nokubi, T. Association of masticatory performance with age, gender, number of teeth, occlusal force and salivary flow in Japanese older adults: Is ageing a risk factor for masticatory dysfunction? Arch. Oral Biol. 2011, 56, 991–996. [Google Scholar] [CrossRef] [PubMed]
- Hiramatsu, T.; Kataoka, H.; Osaki, M.; Hagino, H. Effect of aging on oral and swallowing function after meal consumption. Clin. Interv. Aging 2015, 10, 229. [Google Scholar] [CrossRef] [Green Version]
- Buehring, B.; Hind, J.; Fidler, E.; Krueger, D.; Binkley, N.; Robbins, J. Tongue strength is associated with jumping mechanography performance and handgrip strength but not with classic functional tests in older adults. J. Am. Geriatr. Soc. 2013, 61, 418–422. [Google Scholar] [CrossRef] [PubMed]
- Fujita, Y.; Ichikawa, M.; Hamaguchi, A.; Maki, K. Comparison of masticatory performance and tongue pressure between children and young adults. Clin. Exp. Dent. Res. 2018, 4, 52–58. [Google Scholar] [CrossRef] [Green Version]
- Morita, K.; Tsuka, H.; Kato, K.; Mori, T.; Nishimura, R.; Yoshida, M.; Tsuga, K. Factors related to masticatory performance in healthy elderly individuals. J. Prosthodont. Res. 2018, 62, 432–435. [Google Scholar] [CrossRef]
- Zhang, Q.; Witter, D.J.; Bronkhorst, E.M.; Creugers, N.H. The relationship between masticatory ability, age, and dental and prosthodontic status in an institutionalized elderly dentate population in Qingdao, China. Clin. Oral Investig. 2019, 23, 633–640. [Google Scholar] [CrossRef] [PubMed] [Green Version]
- Faul, F.; Erdfelder, E.; Buchner, A.; Lang, A.G. Statistical power analyses using G* Power 3.1: Tests for correlation and regression analyses. Behav. Res. Methods 2009, 41, 1149–1160. [Google Scholar] [CrossRef] [Green Version]
- Cohen, J. Statistical Power Analysis for the Behavioral Sciences; Academic Press: London, UK, 2013. [Google Scholar]
- Ikebe, K.; Matsuda, K.I.; Murai, S.; Maeda, Y.; Nokubi, T. Validation of the Eichner index in relation to occlusal force and masticatory performance. Int. J. Prosthodont. 2010, 23, 521–524. [Google Scholar]
- Landis, J.R.; Koch, G.G. The Measurement of Observer Agreement for Categorical Data. Biometrics 1977, 33, 159–174. [Google Scholar] [CrossRef] [Green Version]
- Tsuga, K.; Yoshikawa, M.; Oue, H.; Okazaki, Y.; Tsuchioka, H.; Maruyama, M.; Yoshida, M.; Akagawa, Y. Maximal voluntary tongue pressure is decreased in Japanese frail elderly persons. Gerodontology 2012, 29, e1078–e1085. [Google Scholar] [CrossRef]
- Kim, B.I.; Jeong, S.H.; Chung, K.H.; Cho, Y.K.; Kwon, H.K.; Choi, C.H. Subjective food intake ability in relation to maximal bite force among Korean adults. J. Oral Rehabil. 2009, 36, 168–175. [Google Scholar] [CrossRef]
- Takeshima, T.; Fujita, Y.; Maki, K. Factors associated with masticatory performance and swallowing threshold according to dental formula development. Arch. Oral Biol. 2019, 99, 51–57. [Google Scholar] [CrossRef] [PubMed]
- Iwasaki, M.; Yoshihara, A.; Sato, N.; Sato, M.; Minagawa, K.; Shimada, M.; Nishimuta, M.; Ansai, T.; Yoshitake, Y.; Ono, T.; et al. A 5-year longitudinal study of association of maximum bite force with development of frailty in community-dwelling older adults. J. Oral Rehabil. 2018, 45, 17–24. [Google Scholar] [CrossRef]
- Machida, N.; Tohara, H.; Hara, K.; Kumakura, A.; Wakasugi, Y.; Nakane, A.; Minakuchi, S. Effects of aging and sarcopenia on tongue pressure and jaw-opening force. Geriatr. Gerontol. Int. 2017, 17, 295–301. [Google Scholar] [CrossRef]
- Yamaguchi, K.; Tohara, H.; Hara, K.; Nakane, A.; Yoshimi, K.; Nakagawa, K.; Minakuchi, S. Factors associated with masseter muscle quality assessed from ultrasonography in community-dwelling elderly individuals: A cross-sectional study. Arch. Gerontol. Geriatr. 2019, 82, 128–132. [Google Scholar] [CrossRef] [PubMed]
- Bertram, S.; Brandlmaier, I.; Rudisch, A.; Bodner, G.; Emshoff, R. Cross-sectional characteristics of the masseter muscle: An ultrasonographic study. Int. J. Oral Maxillofac. Surg. 2003, 32, 64–68. [Google Scholar] [CrossRef] [PubMed]
- Bakke, M.; Tuxetv, A.; Vilmann, P.; Jensen, B.R.; Vilmann, A.; Toft, M. Ultrasound image of human masseter muscle related to bite force, electromyography, facial morphology, and occlusal factors. Scand. J. Dent. Res. 1992, 100, 164–171. [Google Scholar] [CrossRef]
- Allen, F.; Locker, D. A modified short version of the oral health impact profile for assessing health-related quality of life in edentulous adults. Int. J. Prosthodont. 2002, 15, 446–450. [Google Scholar] [PubMed]
- Mukaka, M.M. Statistics corner: A guide to appropriate use of correlation coefficient in medical research. Malawi Med. J. 2012, 24, 69–71. [Google Scholar] [PubMed]
- Hara, K.; Tohara, H.; Kobayashi, K.; Yamaguchi, K.; Yoshimi, K.; Nakane, A.; Minakuchi, S. Age-related declines in the swallowing muscle strength of men and women aged 20–89 years: A cross-sectional study on tongue pressure and jaw-opening force in 980 subjects. Arch. Gerontol. Geriatr. 2018, 78, 64–70. [Google Scholar] [CrossRef] [PubMed]
- Sagawa, K.; Furuya, H.; Ohara, Y.; Yoshida, M.; Hirano, H.; Iijima, K.; Kikutani, T. Tongue function is important for masticatory performance in the healthy elderly: A cross-sectional survey of community-dwelling elderly. J. Prosthodont. Res. 2019, 63, 31–34. [Google Scholar] [CrossRef]
- Yamada, A.; Kanazawa, M.; Komagamine, Y.; Minakuchi, S. Association between tongue and lip functions and masticatory performance in young dentate adults. J. Oral Rehabil. 2015, 42, 833–839. [Google Scholar] [CrossRef] [PubMed]
- Kikutani, T.; Tamura, F.; Nishiwaki, K.; Kodama, M.; Suda, M.; Fukui, T.; Takahashi, N.; Yoshida, M.; Akagawa, Y.; Kimura, M. Oral motor function and masticatory performance in the community-dwelling elderly. Odontology 2009, 97, 38–42. [Google Scholar] [CrossRef]
- Ciciliot, S.; Rossi, A.C.; Dyar, K.A.; Blaauw, B.; Schiaffino, S. Muscle type and fiber type specificity in muscle wasting. Int. J. Biochem. Cell Biol. 2013, 45, 2191–2199. [Google Scholar] [CrossRef]
- Bhoyar, P.S.; Godbole, S.R.; Thombare, R.U.; Pakhan, A.J. Effect of complete edentulism on masseter muscle thickness and changes after complete denture rehabilitation: An ultrasonographic study. J. Investig. Clin. Dent. 2012, 3, 45–50. [Google Scholar] [CrossRef]
- Ikebe, K.; Matsuda, K.I.; Kagawa, R.; Enoki, K.; Okada, T.; Yoshida, M.; Maeda, Y. Masticatory performance in older subjects with varying degrees of tooth loss. J. Dent. 2012, 40, 71–76. [Google Scholar] [CrossRef] [PubMed]
- Lepley, C.R.; Throckmorton, G.S.; Ceen, R.F.; Buschang, P.H. Relative contributions of occlusion, maximum bite force, and chewing cycle kinematics to masticatory performance. Am. J. Orthod. Dentofac. Orthop. 2011, 139, 606–613. [Google Scholar] [CrossRef]
- Shao, Z.; Guo, X.; Zhang, Q.; Bronkhorst, E.M.; Zou, D.; Creugers, N.H. Masticatory efficiency in patients with partially dentate dentitions. J. Dent. 2018, 75, 41–47. [Google Scholar] [CrossRef] [PubMed]
- Sterenborg, B.A.; Kalaykova, S.I.; Loomans, B.A.; Huysmans, M.C.D. Impact of tooth wear on masticatory performance. J. Dent. 2018, 76, 98–101. [Google Scholar] [CrossRef]
- Fueki, K.; Yoshida, E.; Igarashi, Y. A structural equation model relating objective and subjective masticatory function and oral health-related quality of life in patients with removable partial dentures. J. Oral Rehabil. 2011, 38, 86–94. [Google Scholar] [CrossRef] [PubMed]
- Kamijo, Y.; Kanda, E.; Ono, K.; Maeda, K.; Yanai, A.; Honda, K.; Tsujimoto, R.; Yanagi, M.; Ishibashi, Y.; Yoshida, M. Low tongue pressure in peritoneal dialysis patients as a risk factor for malnutrition and sarcopenia: A cross-sectional study. Ren. Replace. Ther. 2018, 4, 23. [Google Scholar] [CrossRef]


| Total | 20–45 (1) | 46–60 (2) | 61–70 (3) | 71+ (4) | p | ||
|---|---|---|---|---|---|---|---|
| Subjects N (%) | 211 (100) | 51 (24.2) | 54 (25.6) | 45 (21.3) | 61 (28.9) | ||
| Age | 58 ± 17.9 | 32.1 ± 7.4 | 53.5 ± 4.2 | 66.2 ± 2.8 | 77.4 ± 5.2 | ||
| Gender (%) a | male | 95 (45.0) | 25 (49.0) | 26 (48.1) | 21 (46.7) | 23 (37.7) | 0.591 |
| female | 116 (55.0) | 26 (51.0) | 28 (51.9) | 24 (53.3) | 38 (62.3) |
| Adult Group | Elderly Group | p | p for Trend b | Posthoc | ||||
|---|---|---|---|---|---|---|---|---|
| 20–45 (1) | 46–60 (2) | 61–70 (3) | 71+ (4) | |||||
| Number of Remaining teeth | 27.25 ± 1.59 | 27.57 ± 1.06 | 27.38 ± 1.13 | 26.64 ± 1.45 | 0.002 * | 0.007 * | 2, 3 > 4 | |
| FTUs | 11.59 ± 0.80 | 11.67 ± 0.73 | 11.39 ± 1.09 | 10.75 ± 1.25 | <0.001 * | <0.001 * | 1, 2, 3 > 4 | |
| Masticatory performance (mg/dL) | 186.94 ± 55.85 | 199.70 ± 68.37 | 179.93 ± 53.63 | 188.11 ± 58.22 | 0.415 | 0.674 | ||
| Tongue Pressure (kPa) | 38.92 ± 10.93 | 38.28 ± 10.50 | 31.68 ± 7.82 | 26.52 ± 9.74 | <0.001 * | <0.001 * | 1, 2 > 3 > 4 | |
| Handgrip strength (Kg) | 31.14 ± 10.49 | 28.22 ± 8.71 | 27.56 ± 9.29 | 21.44 ± 8.03 | <0.001 * | <0.001 * | 1, 2, 3 > 4 | |
| Posterior bite area (mm2) | 25.03 ± 12.87 | 21.84 ± 12.16 | 18.36 ± 10.45 | 16.54 ± 8.02 | <0.001 * | <0.001 * | 1, 2 > 3,4 | |
| Anterior bite area (mm2) | 3.14 ± 2.38 | 4.34 ± 5.89 | 5.51 ± 17.36 | 3.43 ± 3.72 | 0.548 | 0.794 | ||
| Bite force (N) | 942.95 ± 443.82 | 858.41 ± 432.72 | 700.93 ± 416.20 | 659.85 ± 308.29 | 0.001 * | <0.001 * | 1, 2 > 3,4 | |
| Masseter m. thickness (mm) | 13.19 ± 2.67 | 13.62 ± 2.65 | 13.07 ± 2.18 | 13.38 ± 2.60 | 0.717 | 0.959 | ||
| Food intake ability | 68.73 ± 2.93 | 67.50 ± 4.89 | 65.98 ± 5.99 | 65.51 ± 6.40 | 0.007 * | 0.001 * | 1 > 4 | |
| OHIP-14 | 4.53 ± 6.33 | 4.85 ± 8.21 | 5.69 ± 7.47 | 4.80 ± 6.13 | 0.870 | 0.744 | ||
| Tooth wear (%) a | no | 49 (96.1) | 46 (85.2) | 18 (40.0) | 16 (26.2) | <0.001 * | <0.001 * | |
| yes | 2 (3.9) | 8 (14.8) | 27 (60.0) | 45 (73.8) | ||||
| Group | Age | RT | FTUs | MP | TP | HG | PBA | ABA | BF | MMT | FIA | OHIP-14 | |
|---|---|---|---|---|---|---|---|---|---|---|---|---|---|
| 20–45 (1) | Age | 1 | −0.010 | 0.038 | 0.229 | 0.237 | 0.180 | 0.158 | −0.052 | −0.021 | 0.354 * | 0.073 | 0.033 |
| RT | 1 | 0.962 *** | −0.172 | 0.086 | 0.071 | 0.310 * | 0.238 | 0.275 | 0.031 | −0.097 | 0.219 | ||
| FTUs | 1 | −0.091 | 0.042 | 0.032 | 0.339 * | 0.181 | 0.297 * | 0.027 | −0.108 | 0.146 | |||
| MP | 1 | −0.187 | 0.108 | 0.299 * | −0.033 | 0.261 | 0.174 | 0.128 | −0.356 * | ||||
| TP | 1 | 0.559 *** | 0.135 | 0.226 | 0.029 | 0.402 ** | 0.068 | 0.038 | |||||
| HG | 1 | 0.455 ** | 0.113 | 0.432 ** | 0.736 *** | 0.327 * | 0.018 | ||||||
| PBA | 1 | 0.118 | 0.730 *** | 0.519 *** | 0.194 | −0.092 | |||||||
| ABA | 1 | 0.246 | 0.105 | 0.153 | 0.267 | ||||||||
| BF | 1 | 0.449 ** | 0.229 | −0.034 | |||||||||
| MMT | 1 | 0.291 * | 0.083 | ||||||||||
| FIA | 1 | −0.449 ** | |||||||||||
| OHIP14 | 1 | ||||||||||||
| 46–60 (2) | Age | 1 | 0.137 | 0.082 | 0.014 | −0.077 | 0.106 | 0.054 | 0.172 | 0.034 | 0.098 | −0.126 | −0.058 |
| RT | 1 | 0.872 *** | 0.301 * | −0.085 | 0.073 | 0.085 | 0.108 | 0.037 | 0.041 | 0.268 * | 0.132 | ||
| FTUs | 1 | 0.284 * | −0.032 | 0.014 | 0.202 | 0.118 | 0.166 | 0.029 | 0.447 ** | 0.084 | |||
| MP | 1 | 0.354 ** | 0.171 | 0.412 ** | −0.176 | 0.420 ** | 0.311 * | 0.230 | −0.030 | ||||
| TP | 1 | 0.439 ** | 0.342 * | −0.114 | 0.409 ** | 0.372 ** | 0.248 | −0.048 | |||||
| HG | 1 | 0.261 | −0.165 | 0.375 ** | 0.522 *** | 0.129 | −0.133 | ||||||
| PBA | 1 | −0.269 * | 0.961 *** | 0.452 ** | 0.251 | −0.167 | |||||||
| ABA | 1 | −0.186 | −0.326 * | 0.174 | −0.163 | ||||||||
| BF | 1 | 0.477 *** | .315 * | −0.232 | |||||||||
| MMT | 1 | 0.023 | −0.079 | ||||||||||
| FIA | 1 | −0.422 ** | |||||||||||
| OHIP14 | 1 | ||||||||||||
| 61–70 (3) | Age | 1 | −0.271 | −0.256 | −0.103 | −0.016 | −0.096 | −0.135 | −0.109 | −0.207 | 0.139 | −0.216 | 0.152 |
| RT | 1 | 0.943 *** | 0.169 | 0.090 | 0.009 | 0.032 | 0.079 | −0.047 | −0.197 | 0.199 | −0.074 | ||
| FTUs | 1 | 0.194 | 0.050 | −0.038 | 0.084 | 0.078 | −0.021 | −0.201 | 0.227 | −0.138 | |||
| MP | 1 | 0.038 | 0.036 | 0.301 * | −0.233 | 0.268 | 0.059 | 0.188 | −0.139 | ||||
| TP | 1 | 0.531 *** | 0.095 | −0.085 | 0.180 | 0.307 * | 0.454 ** | −0.291 | |||||
| HG | 1 | 0.183 | −0.098 | 0.205 | 0.541 *** | 0.370 * | −0.282 | ||||||
| PBA | 1 | −0.220 | 0.926 *** | 0.451 ** | 0.139 | −0.043 | |||||||
| ABA | 1 | −0.175 | −0.162 | −0.036 | 0.082 | ||||||||
| BF | 1 | 0.442 ** | 0.175 | −0.069 | |||||||||
| MMT | 1 | 0.280 | −0.137 | ||||||||||
| FIA | 1 | −0.797 *** | |||||||||||
| OHIP14 | 1 | ||||||||||||
| 71+ (4) | Age | 1 | −0.391 ** | −0.304 * | 0.034 | −0.505 *** | −0.316 * | −0.322 * | 0.354 ** | −0.156 | −0.247 | −0.010 | 0.174 |
| RT | 1 | 0.891 *** | 0.068 | 0.032 | 0.162 | 0.396 ** | −0.122 | 0.284 * | 0.139 | 0.135 | −0.250 | ||
| FTUs | 1 | −0.002 | −0.050 | 0.104 | 0.392 ** | −0.238 | 0.257 * | 0.079 | 0.177 | −0.225 | |||
| MP | 1 | 0.039 | 0.085 | 0.203 | 0.106 | 0.161 | 0.138 | 0.136 | −0.117 | ||||
| TP | 1 | 0.469 *** | 0.428 ** | −0.103 | 0.329 ** | 0.306 * | 0.061 | −0.112 | |||||
| HG | 1 | 0.568 *** | −0.076 | 0.466 *** | 0.425 ** | 0.274 * | −0.234 | ||||||
| PBA | 1 | −0.115 | 0.835 *** | 0.531 *** | 0.228 | −0.247 | |||||||
| ABA | 1 | 0.270 * | 0.217 | 0.126 | −0.223 | ||||||||
| BF | 1 | 0.556 ** | 0.208 | −0.293 * | |||||||||
| MMT | 1 | 0.166 | −0.304 * | ||||||||||
| FIA | 1 | −0.491 *** | |||||||||||
| OHIP14 | 1 |
| Multivariate | ||||||
|---|---|---|---|---|---|---|
| B | β | 95% CI | p | R2 | ||
| 20–45 (1) | Age | |||||
| Gender (M) | ||||||
| Gender (F) | ||||||
| RT | ||||||
| FTUs | ||||||
| TP | ||||||
| HG | ||||||
| PBA | 1.164 | 0.268 | 0.032–2.296 | 0.044 * | 0.198 | |
| ABA | ||||||
| BF | ||||||
| MTM | ||||||
| FIA | ||||||
| OHIP-14 | −2.926 | −0.332 | −5.229–−0.623 | 0.014 * | ||
| Tooth wear | ||||||
| 45–60 (2) | Age | |||||
| Gender (M) | ||||||
| Gender (F) | ||||||
| RT | −1.848 | −0.043 | −15.495–11.800 | 0.790 | 0.106 | |
| FTUs | 1.015 | 0.018 | −16.639–18.669 | 0.910 | ||
| TP | −0.170 | −0.032 | −0.943–0.603 | 0.664 | ||
| HG | ||||||
| PBA | 1.146 | 0.219 | −0.308–2.599 | 0.122 | ||
| ABA | ||||||
| BF | 0.012 | 0.087 | −0.026–0.051 | 0.527 | ||
| MTM | 0.425 | 0.018 | −3.724–4.574 | 0.840 | ||
| FIA | ||||||
| OHIP-14 | ||||||
| Tooth wear | ||||||
| 61–70 (3) | Age | |||||
| Gender (M) | ||||||
| Gender (F) | ||||||
| RT | ||||||
| FTUs | ||||||
| TP | ||||||
| HG | ||||||
| PBA | 1.547 | 0.301 | 0.042–3.053 | 0.044 * | 0.091 | |
| ABA | ||||||
| BF | ||||||
| MTM | ||||||
| FIA | ||||||
| OHIP-14 | ||||||
| Tooth wear | ||||||
| 71+ (4) | Age | |||||
| Gender (M) | ||||||
| Gender (F) | ||||||
| RT | ||||||
| FTUs | ||||||
| TP | ||||||
| HG | ||||||
| PBA | ||||||
| ABA | ||||||
| BF | ||||||
| MTM | ||||||
| FIA | ||||||
| OHIP-14 | ||||||
| Tooth wear | ||||||
| Multivariate | ||||||
|---|---|---|---|---|---|---|
| B | β | 95% CI | p | R2 | ||
| 20–45 (1) | Age | |||||
| Gender (M) | ||||||
| Gender (F) | ||||||
| RT | ||||||
| FTUs | ||||||
| TP | ||||||
| HG | 0.057 | 0.203 | −0.043–0.156 | 0.257 | 0.329 | |
| PBA | ||||||
| ABA | ||||||
| BF | ||||||
| MTM | 0.198 | 0.180 | −0.194–0.589 | 0.315 | ||
| MP | ||||||
| OHIP-14 | −0.216 | −0.468 | −0.328–−0.104 | <0.001 * | ||
| Tooth wear | ||||||
| 45–60 (2) | Age | |||||
| Gender (M) | ||||||
| Gender (F) | ||||||
| RT | ||||||
| FTUs | 4.378 | 0.656 | 1.758–6.997 | 0.002 * | 0.447 | |
| TP | ||||||
| HG | ||||||
| PBA | ||||||
| ABA | ||||||
| BF | 0.001 | 0.107 | −0.001–0.004 | 0.356 | ||
| MTM | ||||||
| MP | ||||||
| OHIP-14 | −0.262 | −0.440 | −0.394–−0.130 | <0.001 * | ||
| Tooth wear | ||||||
| 61–70 (3) | Age | |||||
| Gender (M) | ||||||
| Gender (F) | ||||||
| RT | ||||||
| FTUs | ||||||
| TP | 0.168 | 0.220 | 0.002–0.335 | 0.047 * | 0.691 | |
| HG | 0.027 | 0.041 | −0.150–0.203 | 0.761 | ||
| PBA | ||||||
| ABA | ||||||
| BF | ||||||
| MTM | ||||||
| MP | ||||||
| OHIP-14 | −0.573 | −0.715 | −0.732–−0.414 | <0.001 * | ||
| Tooth wear | ||||||
| 71+ (4) | Age | |||||
| Gender(M) | ||||||
| Gender(F) | −3.674 | −0.280 | −7.627–0.279 | 0.068 | 0.310 | |
| RT | ||||||
| FTUs | ||||||
| TP | ||||||
| HG | −0.020 | −0.025 | −0.265–0.226 | 0.872 | ||
| PBA | ||||||
| ABA | ||||||
| BF | ||||||
| MTM | ||||||
| MP | ||||||
| OHIP-14 | −0.483 | −0.462 | −0.720–−0.246 | <0.001 * | ||
| Tooth wear | ||||||
| Group | Dependent Variable | Independent Variable | B | S.E | β | p-Value | F (p-Value) | R2 |
|---|---|---|---|---|---|---|---|---|
| 1 | HG | MMT | 2.397 | 0.380 | 0.610 | 0.000 | 39.838 (p < 0.001) | 0.624 |
| TP | 0.301 | 0.093 | 0.314 | 0.002 | ||||
| 2 | HG | MMT | 1.370 | 0.402 | 0.417 | 0.001 | 13.273 (p < 0.001) | 0.342 |
| TP | 0.235 | 0.101 | 0.284 | 0.024 | ||||
| 3 | HG | MMT | 1.781 | 0.517 | 0.418 | 0.001 | 16.513 (p < 0.001) | 0.440 |
| TP | 0.479 | 0.144 | 0.403 | 0.002 | ||||
| 4 | HG | TP | 0.228 | 0.094 | 0.277 | 0.018 | 18.189 (p < 0.001) | 0.385 |
| PBA | 0.450 | 0.114 | 0.450 | 0.000 |
Publisher’s Note: MDPI stays neutral with regard to jurisdictional claims in published maps and institutional affiliations. |
© 2021 by the authors. Licensee MDPI, Basel, Switzerland. This article is an open access article distributed under the terms and conditions of the Creative Commons Attribution (CC BY) license (https://creativecommons.org/licenses/by/4.0/).
Share and Cite
Kim, S.; Doh, R.-M.; Yoo, L.; Jeong, S.-A.; Jung, B.-Y. Assessment of Age-Related Changes on Masticatory Function in a Population with Normal Dentition. Int. J. Environ. Res. Public Health 2021, 18, 6899. https://0-doi-org.brum.beds.ac.uk/10.3390/ijerph18136899
Kim S, Doh R-M, Yoo L, Jeong S-A, Jung B-Y. Assessment of Age-Related Changes on Masticatory Function in a Population with Normal Dentition. International Journal of Environmental Research and Public Health. 2021; 18(13):6899. https://0-doi-org.brum.beds.ac.uk/10.3390/ijerph18136899
Chicago/Turabian StyleKim, Seonhui, Re-Mee Doh, Leegang Yoo, Sol-Ah Jeong, and Bock-Young Jung. 2021. "Assessment of Age-Related Changes on Masticatory Function in a Population with Normal Dentition" International Journal of Environmental Research and Public Health 18, no. 13: 6899. https://0-doi-org.brum.beds.ac.uk/10.3390/ijerph18136899