Article

Transcriptional Analysis of Microcystis aeruginosa Co-Cultured with Algicidal Bacteria Brevibacillus laterosporus

1
Department of Aquaculture, Fisheries College, Guangdong Ocean University, Zhanjiang 524088, China
2
Shenzhen Research Institute, Guangdong Ocean University, Shenzhen 518108, China
*
Authors to whom correspondence should be addressed.
Int. J. Environ. Res. Public Health 2021, 18(16), 8615; https://0-doi-org.brum.beds.ac.uk/10.3390/ijerph18168615
Submission received: 16 June 2021 / Revised: 9 August 2021 / Accepted: 12 August 2021 / Published: 15 August 2021
(This article belongs to the Special Issue Foodborne Pathogens and Illnesses)

Abstract

:
Harmful algal blooms caused huge ecological damage and economic losses around the world. Controlling algal blooms by algicidal bacteria is expected to be an effective biological control method. The current study investigated the molecular mechanism of harmful cyanobacteria disrupted by algicidal bacteria. Microcystis aeruginosa was co-cultured with Brevibacillus laterosporus Bl-zj, and RNA-seq based transcriptomic analysis was performed compared to M. aeruginosa, which was cultivated separately. A total of 1706 differentially expressed genes were identified, which were mainly involved in carbohydrate metabolism, energy metabolism and amino acid metabolism. In the co-cultured group, the expression of genes mainly enriched in photosynthesis and oxidative phosphorylation were significantly inhibited. However, the expression of the genes related to fatty acid synthesis increased. In addition, the expression of the antioxidant enzymes, such as 2-Cys peroxiredoxin, was increased. These results suggested that B. laterosporus could block the electron transport by attacking the PSI system and complex I of M. aeruginosa, affecting the energy acquisition and causing oxidative damage. This further led to the lipid peroxidation of the microalgal cell membrane, resulting in algal death. The transcriptional analysis of algicidal bacteria in the interaction process can be combined to explain the algicidal mechanism in the future.

1. Introduction

With the increase in water eutrophication, harmful algal blooms (HABs) have frequently occurred worldwide. In HABs, cyanobacteria are the most common group of microalgae, which can produce toxins [1,2,3]. Cyanobacterial blooms can cause serious water environmental problems, such as water oxygen deprivation, odorous substances and toxins, which are harmful to drinking water, aquatic animals, even threatening to human health [4,5,6]. Various methods have been proposed for removing or inhibiting cyanobacterial blooms, which include physical, chemical and biological methods. However, physical and chemical methods are expensive and cause secondary pollution, which is potentially harmful to aquatic ecosystems [7]. In contrast, biological methods are effective strategies to control HABs [8].
Algicidal bacteria are a group of bacteria that can kill or inhibit microalgae. At present, many algicidal bacteria, such as Bacillus [9], Chryseobacterium [10], Sulfitobacter [11], Hahella [12] and Stenotrophomonas [13], have been previously reported. There are two main mechanisms of algicidal bacteria: (1) direct attack: algicidal bacteria directly invade the microalgal cells; (2) indirect attack: algicidal bacteria inhibit microalgal growth by secreting extracellular active substances to lyse them or by competing with them for nutrients. The first study of algicidal bacteria was reported in Myxobacter that inhibited the growth of blue–green algae by secreting some cellulolytic enzymes and digesting the cell wall of the host [14]. Similarly, Furusawa et al. [15] found that Saprospira sp. SS98-5 exhibited an algicidal effect on Chaetoceros ceratosporum, using its filamentous cells to trap the diatom cells and dissolve their cytoderm, which were in contact with the bacteria. The specific or non-specific extracellular substances secreted by algicidal bacteria during their metabolism can destroy the structure of algal cells and lyse them. Extracellular active substances often act through various mechanisms to dissolve the cyanobacteria, including blocking electron transfer, reducing algal photosynthetic system activity, causing oxidative damage, inhibiting intracellular protein and carbohydrate synthesis and disrupting normal cell metabolism and cellular structure [16,17,18]. Yang et al. found that prodigiosin (PG) from Hahella sp. KA22 inhibited Microcystis aeruginosa by generating reactive oxygen species (ROS), which induce lipid peroxidation, disrupt the membrane system and obliterate the function of the photosystem [12]. In addition, many proteins of M. aeruginosa involved in important metabolic processes in response to PG stress were differentially expressed, which may trigger necrotic-like or apoptotic-like cell death with features similar to those in eukaryotes [12].
The algicidal mechanism has been extensively studied by measuring the physiological and biochemical characteristics of microalgae. A few studies have been conducted on the mechanism of algal-lysing at the molecular and protein levels. RNAseq and microarray analysis were determined to study the interactions between Roseobacters and dinoflagellates. The data suggested that at the early mutualistic phase of the symbiosis, polyhydroxyalkanoate (PHA) degradation might be the main carbon and energy source of Dinoroseobacter shibae, supplemented in the light by degradation of dimethylsulfoniopropionate (DMSP) and aerobic anoxygenic photosynthesis [19]. Proteomic analysis was applied to investigate the algicidal process of Trametes versicolor F21a on M. aeruginosa, and 30 fungal enzymes with endo- or exoglycosidase activities were significantly up-regulated, suggesting that these enzymes may degrade lipopolysaccharides, peptidoglycans and alginic acid of algal cells [20]. All these studies were analyzed from the algicidal bacteria or fungi, while the analysis of lysed microalgae at a molecular level may provide a new understanding of the algicidal mechanism.
Brevibacillus laterosporus is a Gram-positive bacterium that can produce antibacterial molecules and other secondary metabolites that have a wide range of biological activities [21]. In a previous study, the B. laterosporus strain Bl-zj was isolated from the intertidal soil of a park in Zhanjiang, which has been proved to have an algae-lytic effect on cyanobacteria, and the potential algicidal factors were screened by genome analysis [22,23].
The research on the mechanism of algicidal bacteria has been mainly conducted using various physiological and biochemical analyses; however, there is a scarcity of reports at the gene level, especially from the lysed microalgae. In this study, the algicidal bacteria B. laterosporus Bl-zj and M. aeruginosa were co-cultured, and transcriptome analyses were performed to investigate the response of M. aeruginosa to algicidal bacteria.

2. Materials and Methods

2.1. Cyanobacteria and Algicidal Bacterium

M. aeruginosa FACHB 905 was purchased from the Freshwater Algae Culture Collection at the Institute of Hydrobiology, Wuhan, China. For inoculum preparation, it was cultured for 7 d to reach the exponential growth phase. It was cultivated in BG11 [24] medium at 28 ± 1 °C under 50 μmol·m−2·s−1 with a photoperiod of 12:12 h light: dark cycle. The concentration of M. aeruginosa was adjusted to 1 × 10⁷ cells/mL for further experiments.
B. laterosporus Bl-zj was isolated and preserved by the Laboratory of Algae Resource Development and Culture Environment Ecological Restoration of Guangdong Ocean University. It was cultured using Beef extract–peptone (BP) medium and incubated for 24 h at 28 °C and 150 rpm to reach the logarithmic growth phase. The concentration of B. laterosporus was adjusted to 1 × 10⁷ cells/mL for further experiments.

2.2. Measurement of the Algicidal Efficiency

Equivalent volumes of microalga and bacterium (10 mL) were mixed, and total culture volume was added to 100 mL with BG11 medium (MB group). The control group was just 10 mL of M. aeruginosa added in BG11 medium to the total volume of 100 mL (BG11 group). Each group contained triplicate samples. The experiment lasted 4 days under the same condition as 2.1 when the MB group culture was turned yellow, and the microalgal biomass was at a low proportion.
Spectrophotometer with a 1 cm light path cuvette was used to measure and calculate chlorophyll a concentration, according to the methods of Jeffrey and Humphrey [25]. In brief, the cultures of each group were harvested at 0, 1, 2, 3, 4 d, and chlorophyll a was extracted with 90% (v/v) acetone for 24 h in the dark. The absorbance of the supernatant at 630 nm, 647 nm and 664 nm was determined. The chlorophyll a concentration was calculated according to the formula: Chl a (mg/L) = (11.85 × A664 − 1.54 × A647 − 0.08 × A630) × V1/V2, where A630, A647 and A664 represent absorbance, V1 and V2 are the volume of 90% (v/v) acetone (mL) and cultures (mL), respectively. The removal rate of microalgal cells (R, %) was represented as the algicidal effect and calculated by the formula: R = (C0 − C1)/C0 × 100%, where C0 and C1 represent the chlorophyll a concentration of BG11 group and MB group, respectively.

2.3. Transcriptomic Samples Preparation

The M. aeruginosa and B. laterosporus were co-cultured at a volume ratio of 1:1 (50 mL M. aeruginosa, 50 mL B. laterosporus and 400 mL BG11 medium). M. aeruginosa was separately cultured as control (50 mL M. aeruginosa and 450 mL BG11 medium). Samples from the control group (named “CMA”) and experimental group were collected on the second and fourth day (named “MB2” and “MB4”, respectively), as the algicidal effect was obviously on the fourth day. The cocultures were centrifuged at 5000 rpm, 4 °C for 10 min to collect the pellets and then quickly frozen in liquid nitrogen and stored at −80 °C. Each group contained triplicate samples.

2.4. Transcriptomic Analysis

Total RNA was extracted using RNAprep Pure Plant Plus Kit (Polysaccharides and Polyphenolics-rich, Tangen, China). Transcriptome sequencing (RNA-seq) was performed by Next-Generation Sequencing on the Illumina HiSeq 4000 platform. To obtain high-quality clean data, the raw reads were filtered by removing adaptor sequences and low-quality reads (Q-value ≤ 20). The clean reads were then mapped onto the M. aeruginosa PCC 7806SL complete genome (NCBI reference sequence, CP020771.1) using Bowtie2 program (http://bowtie-bio.sourceforge.net/bowtie2/index.shtml (version 2.4.1, accessed on 28 February 2020)).
The differences in gene expression were analyzed by HTSeq (version0.6.1p2) for the screening of differentially expressed genes (DEGs) and principal components analysis. The read count mapped to each gene was calculated as the original expression of the gene and the FPKM (Fragments Per Kilo bases per Million fragments) was used to normalize the expression levels. The DEGs screening conditions were as follows: log2|fold change| > 1, p-value < 0.05. DEGs were further annotated to Gene Ontology (GO) database and Kyoto Encyclopedia of Genes and Genomes (KEGG) database.

2.5. Quantitative Real-Time PCR Validation

Quantitative PCR (qPCR) was performed to verify the results of mRNA-seq analysis. The cDNA template was synthesized by reverse transcription using a kit (HiScriptR III RT SuperMix for qPCR (+gDNA wiper), Vazyme Biotechnology Co., LTD., Nanjing, China). The qPCR was performed using SYBR green (AceQ Universal SYBR qPCR Master Mix, Vazyme Biotechnology Co., LTD., Nanjing, China) on a 7500 Fast Real-time PCR System (Applied Biosystems, Foster, CA, USA). The primers were designed according to the gene sequences from M. aeruginosa PCC 7806SL complete genome, with 16S rRNA [26] as the reference gene and synthesized by GENEWIZ (Suzhou, China) (the primers were shown in Supplementary Table S1).

3. Results

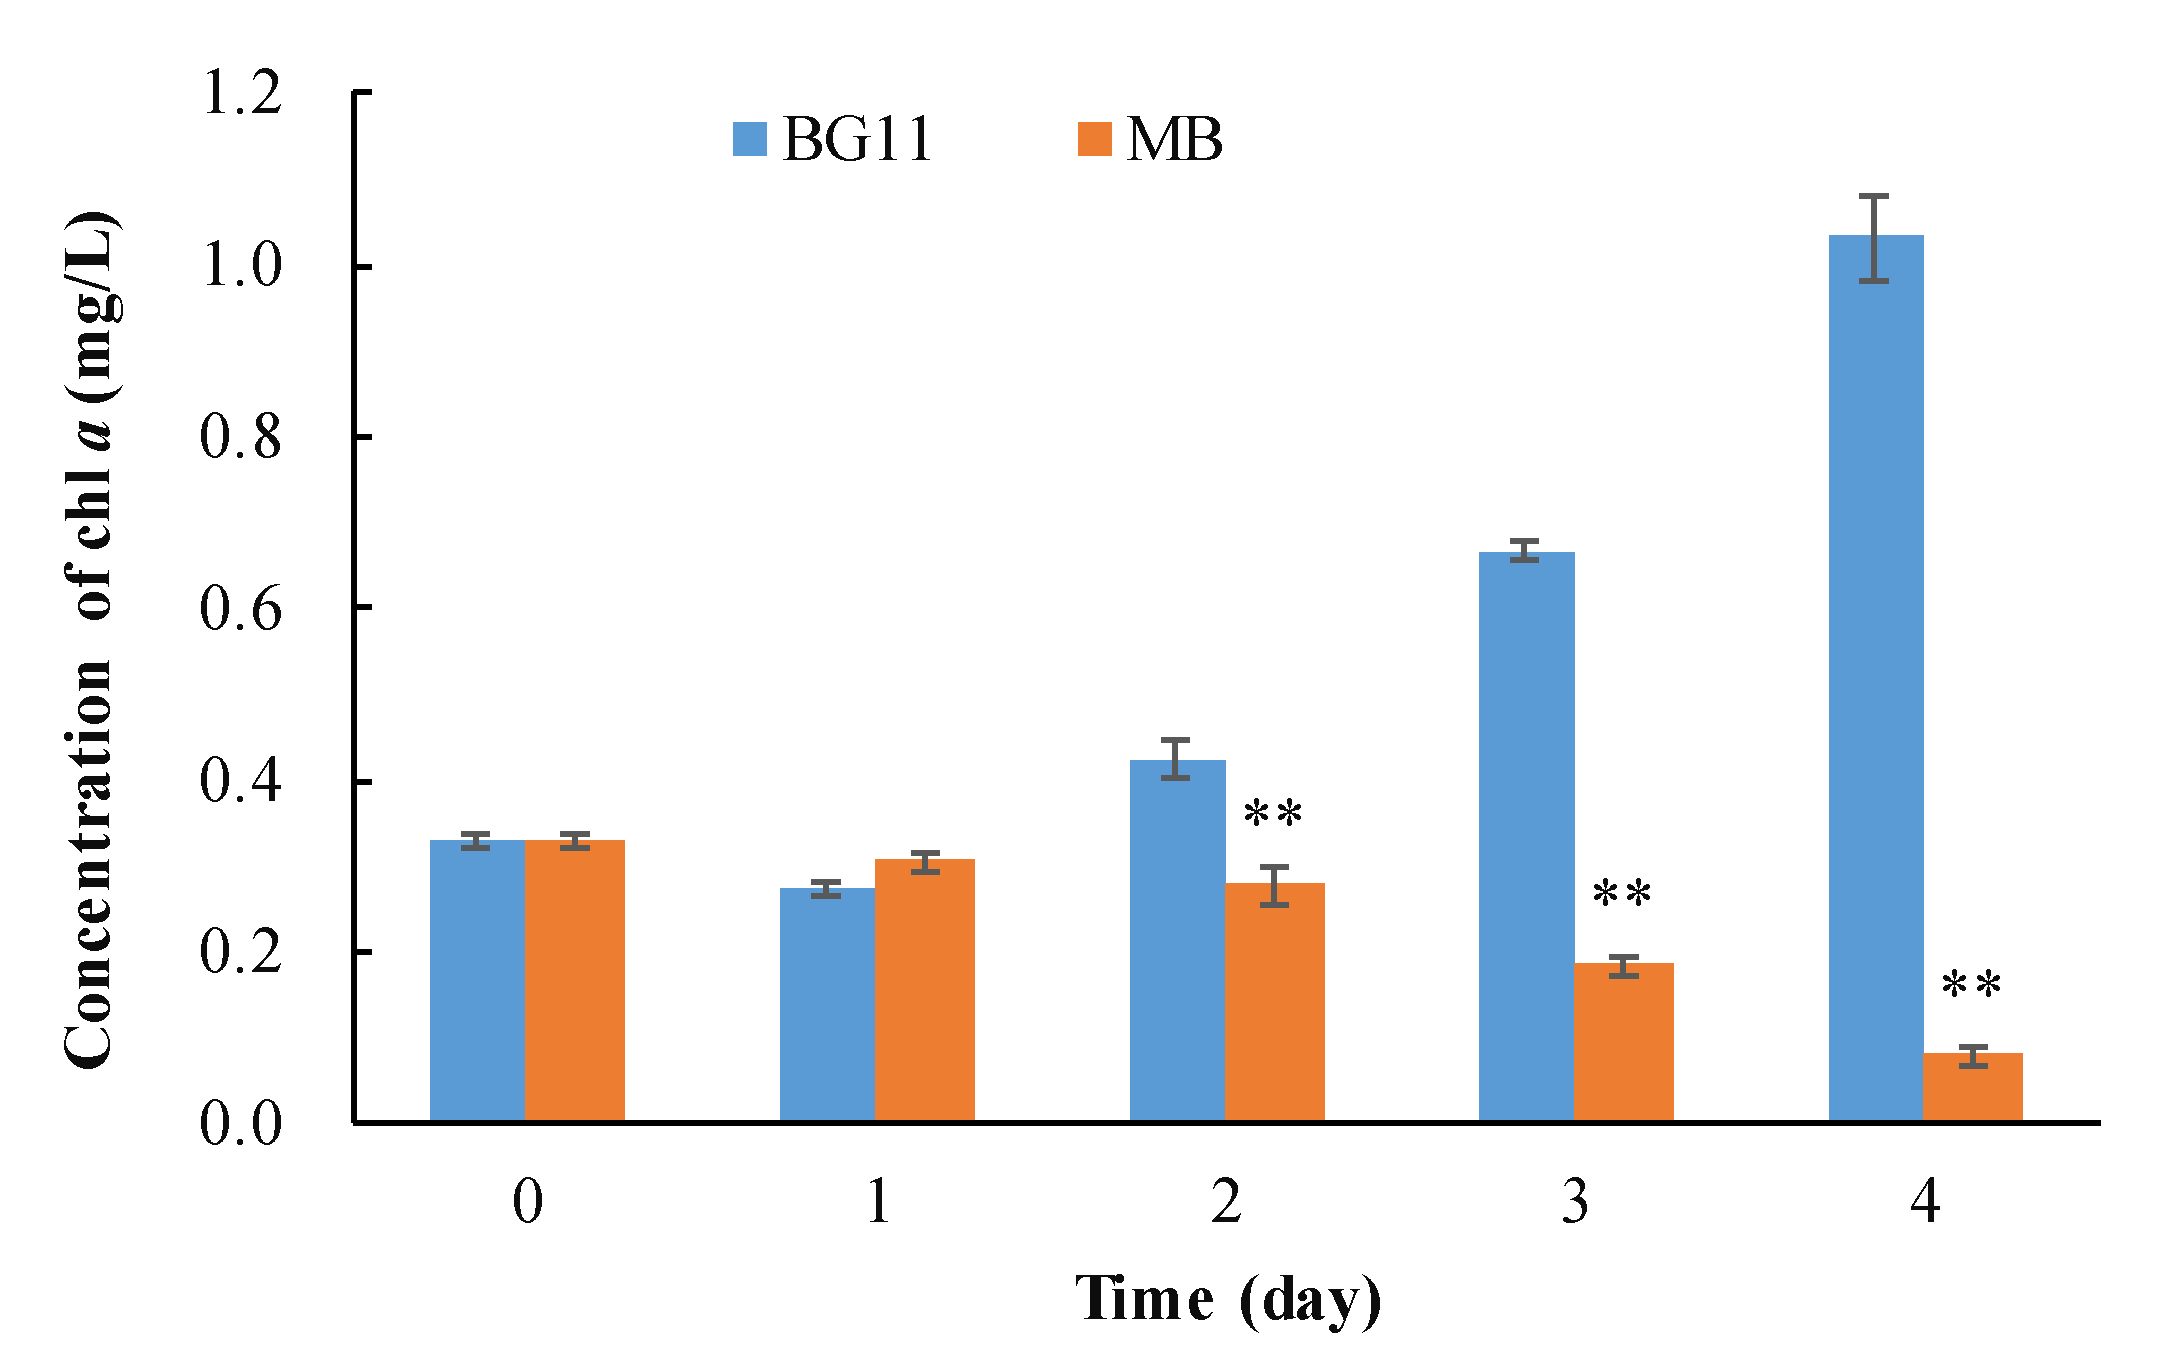
3.1. The Algicidal Efficiency

Compared with the control group (BG11), the chlorophyll a concentration of M. aeruginosa significantly decreased with the addition of B. laterosporus from the second day (Figure 1). The removal rates of M. aeruginosa in the MB group were 34.39%, 72.36% and 92.30% on the second, third and fourth days, respectively, showing an increasing algicidal effect over time.

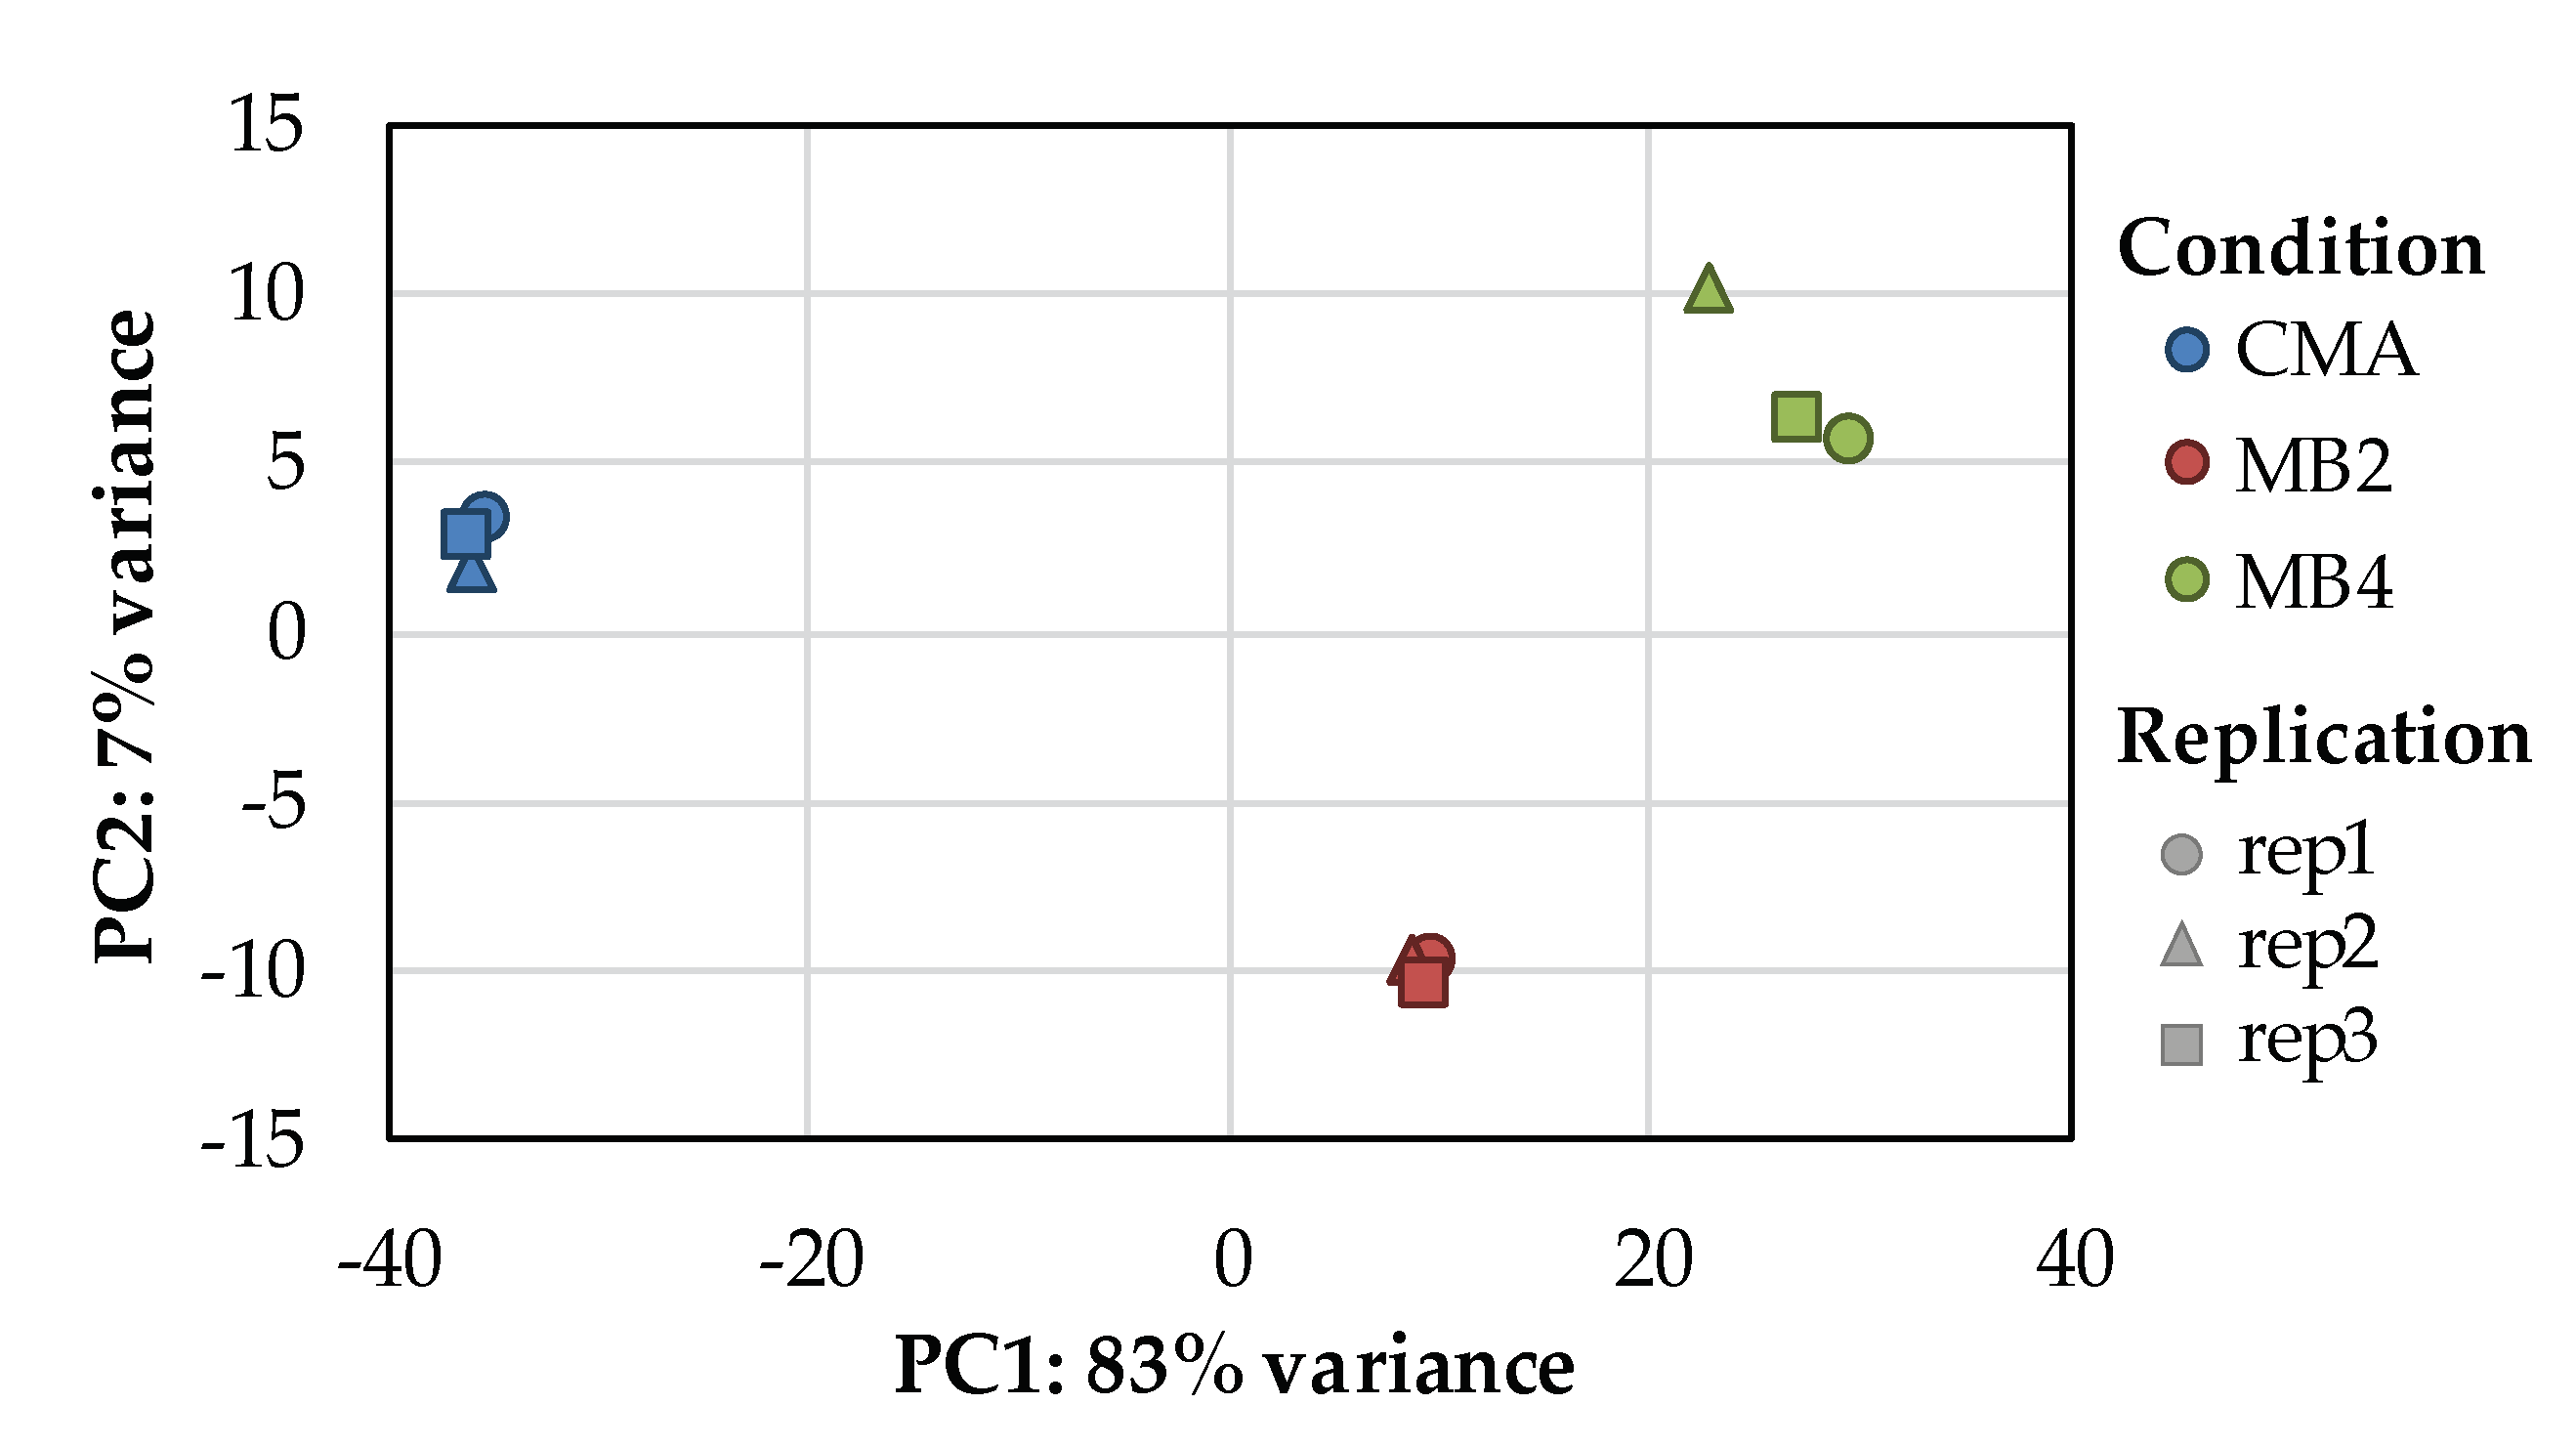
3.2. Illumina Sequencing Assembly Data Quality Analysis

Nine cDNA libraries from three groups were sequenced to study the transcriptomes of M. aeruginosa under the effect of B. laterosporus (Table 1). An average of 9,728,733,733 bp raw data and 64,858,225 raw reads were obtained from each sample. After filtering the adaptors and low-quality sequences from raw data, an average of 7,800,583,533 bp clean data and 52,003,890 clean reads were screened. After mapping to the reference genome, an average of 37,785,780 mapped reads were obtained. All Q20 and Q30 values of the read sequences in the samples exceeded 96.94% and 92.9%, respectively.
Principal component analysis (PCA) was performed for each sample according to the expression to observe similarities between sample groups (Figure 2). The three replicates of each group (CMA, MB2 and MB4) were gathered with close distance, but different treatment groups separated from others at a long distance, indicating good repeatability data.

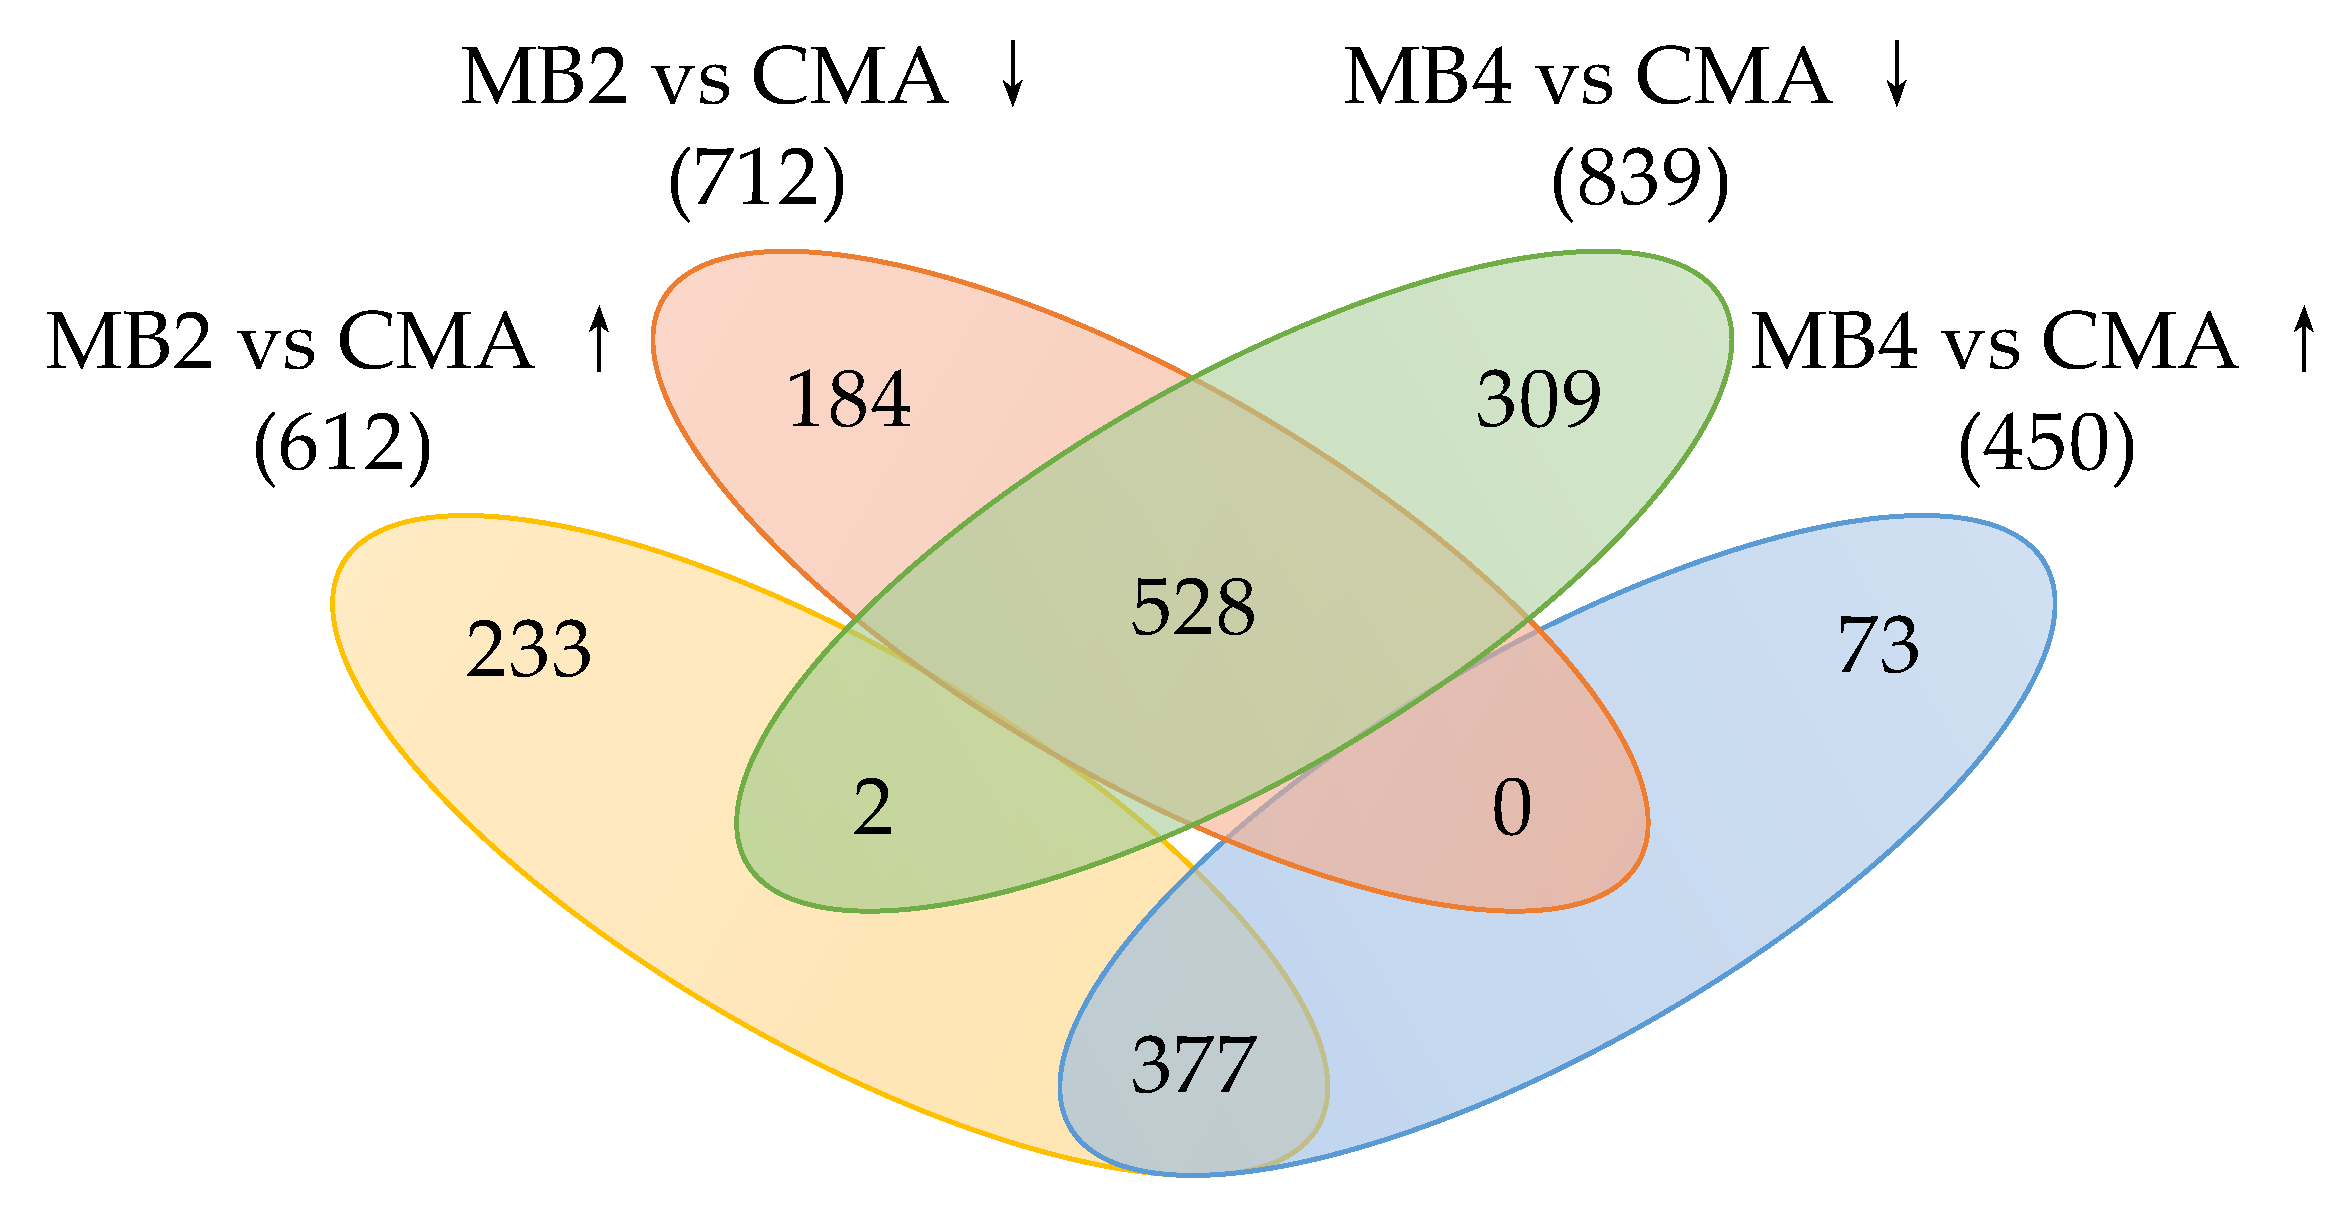
3.3. Identification of DEGs

In this study, transcriptomic analysis was used to investigate the impact of algicidal bacteria B. laterosporus Bl-zj on M. aeruginosa metabolism at the molecular level. Results showed that a total of 1324 DEGs were found in the MB2 group compared to CMA, of which 612 were up-regulated and 712 were down-regulated (Figure 3). There were 1289 DEGs in the MB4 group compared to CMA, of which 450 were up-regulated and 839 were down-regulated. A total of 1706 DEGs were identified; among them, there were 377 up-regulated and 528 down-regulated DEGs both in MB2 vs. CMA comparison and MB4 vs. CMA comparison.

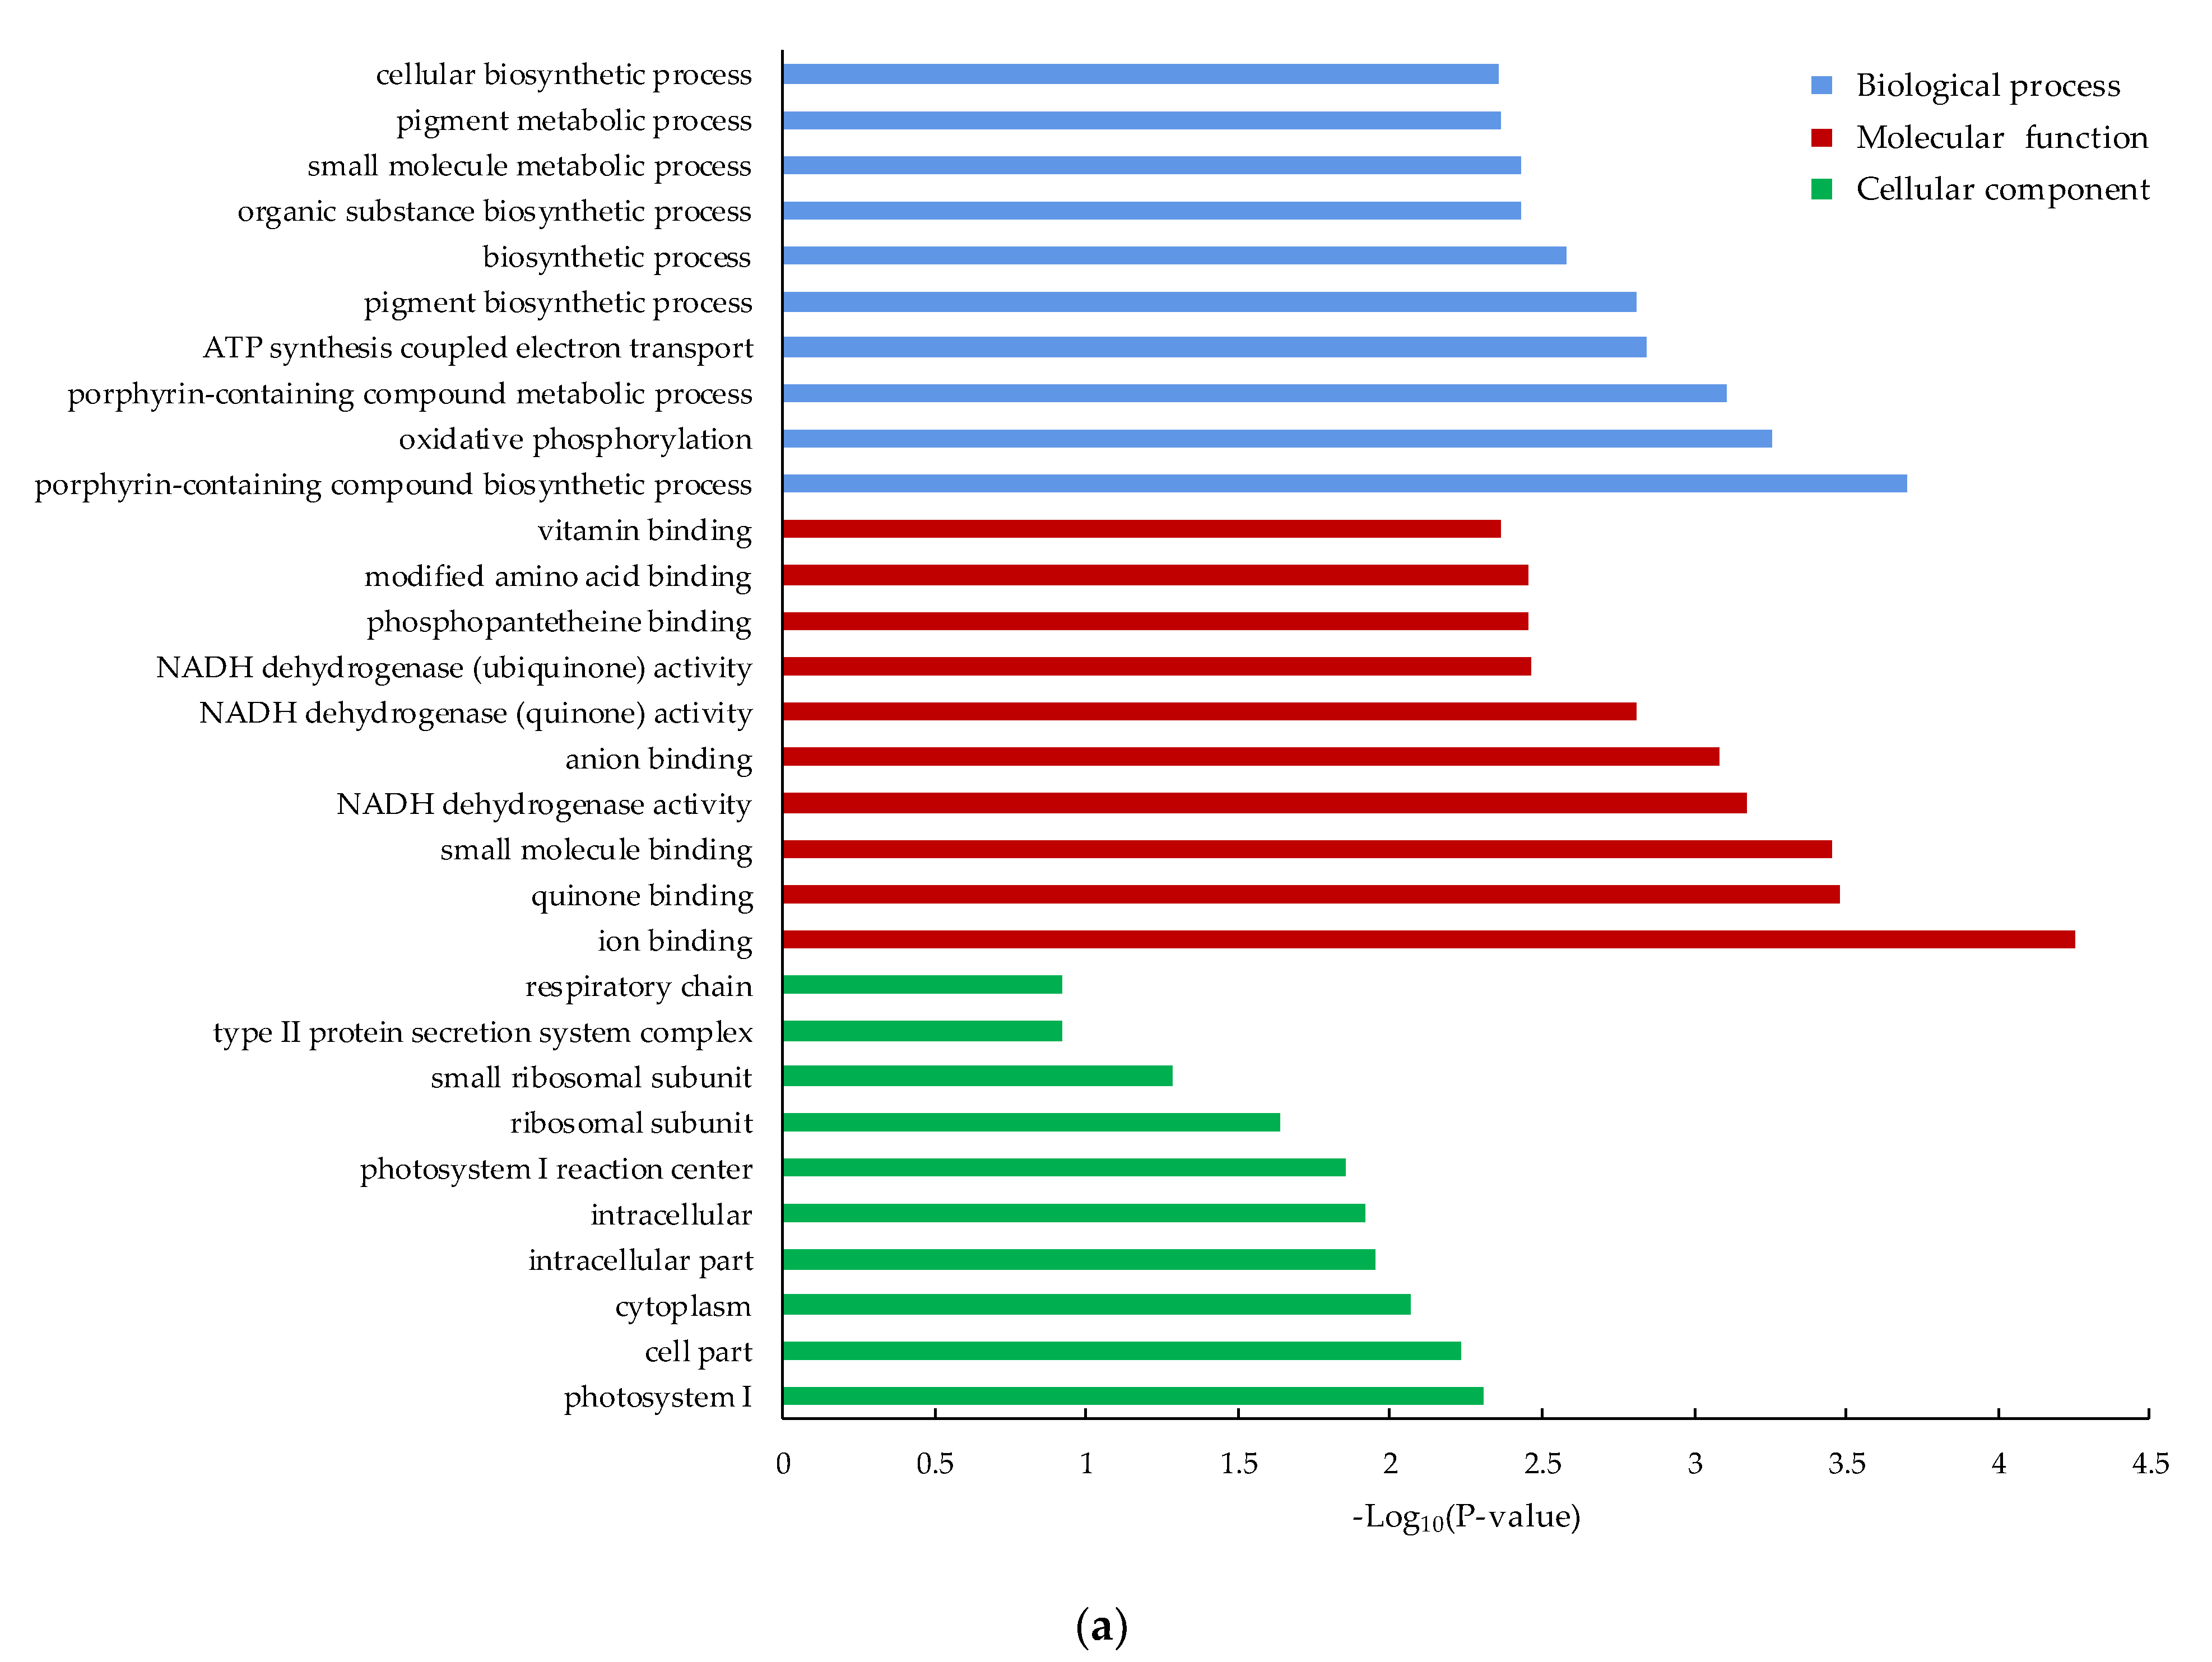
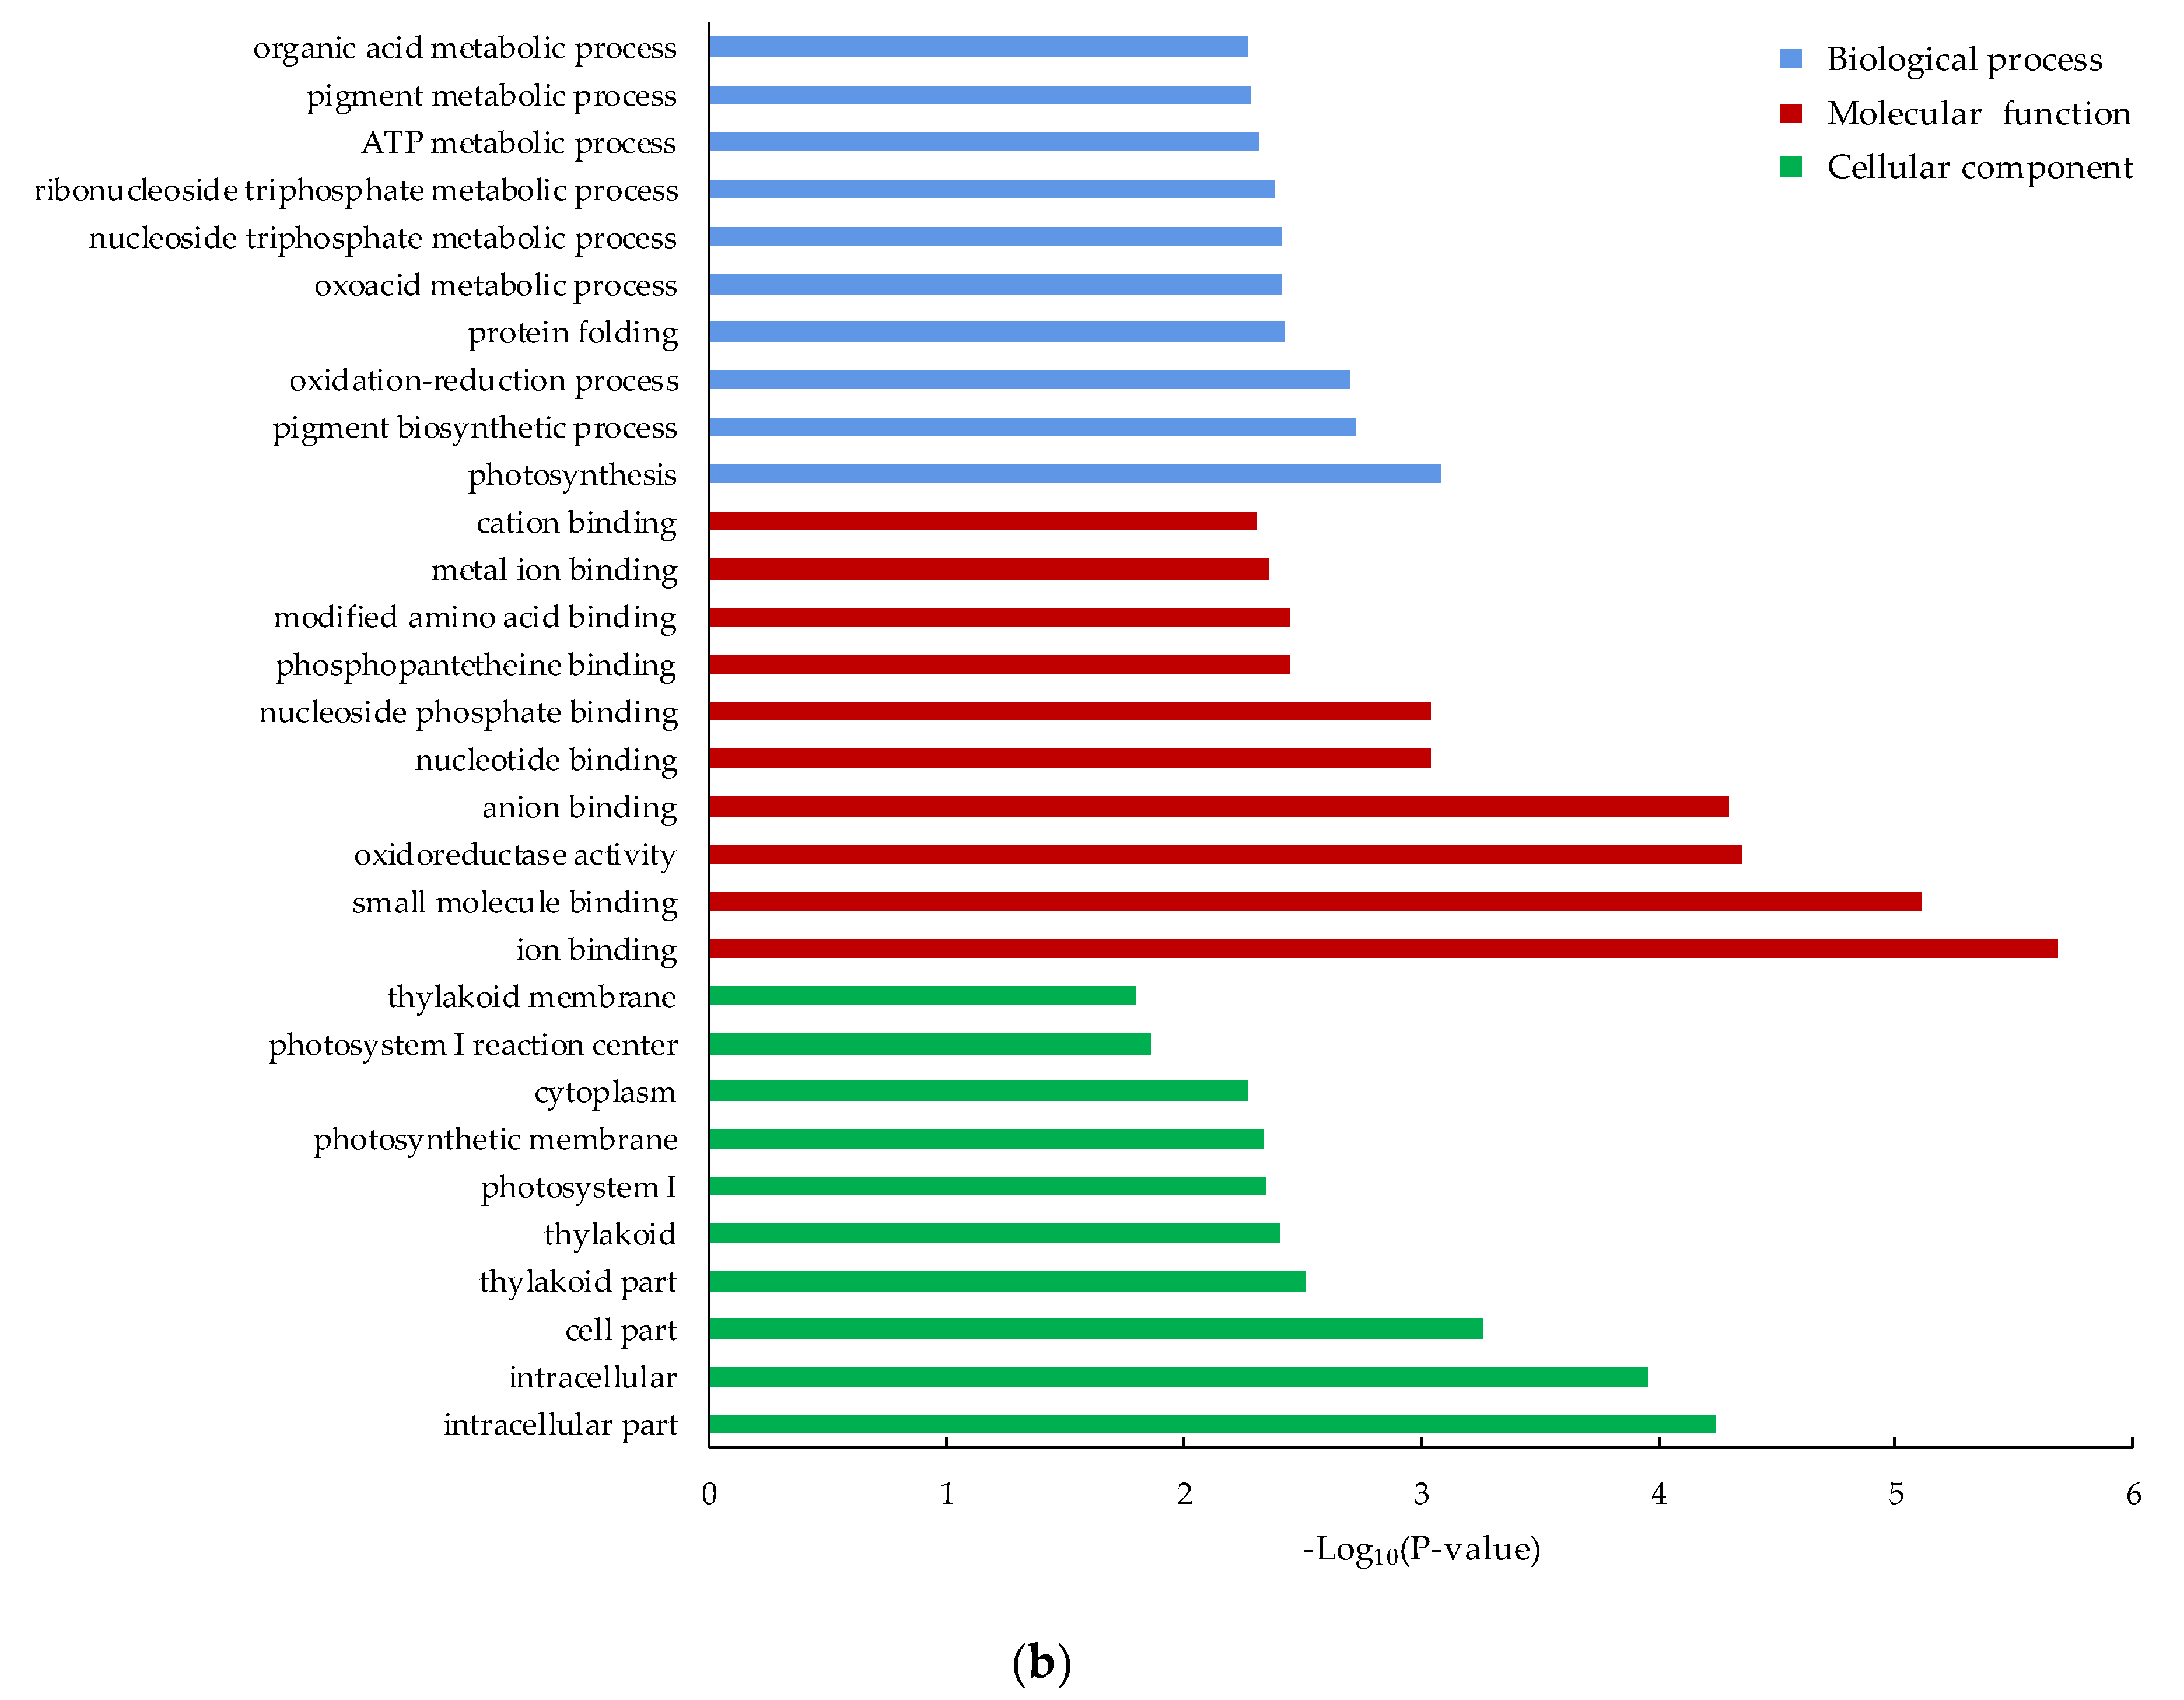
3.4. Functional Classification of the DEGs by GO and KEGG Pathway Analysis

The GO and KEGG pathways were used to analyze the DEGs and determine their main biological functions to explore the molecular changes in M. aeruginosa under the effect of B. laterosporus Bl-zj.
The top 10 most significant enriched genes in three GO categories were summarized (Figure 4). In the cellular component category, the GO terms mainly enriched in the MB2 vs. CMA comparison included “photosystem I”, “cell part” and “cytoplasm”. The “intracellular part”, “intracellular” and “cell part” were mainly enriched in the MB4 vs. CMA comparison. Similarly, in the molecular function category, “ion binding”, “quinone binding” and “small molecule binding” were significantly enriched in the MB2 vs. CMA comparison. The “ion binding”, “small molecule binding” and “oxidoreductase activity” were significantly enriched in the MB4 vs. CMA comparison. Further, in the biological process, “prophyrin-containing compound biosynthetic process”, “oxidative phosphorylation” and “prophyrin-containing compound metabolic process” were significantly enriched in the MB2 vs. CMA comparison. The “photosynthesis”, “pigment biosynthetic process” and “oxidation-reduction process” were significantly enriched in the MB4 vs. CMA comparison.
The biological functions associated with DEGs were further analyzed using the KEGG database. The up-regulated and down-regulated genes were involved in carbohydrate metabolism, amino acid metabolism, metabolism of cofactors and vitamins and energy metabolism in MB2 vs. CMA comparison and MB4 vs. CMA comparison (Table 2). In addition, the genes of lipid metabolism and translation were mainly up-regulated and the genes of energy metabolism, replication and repair and membrane transport were mainly down-regulated.

3.5. Algicidal-Related Gene and Pathway Analysis

The expression of genes related to photosynthesis, oxidative phosphorylation and fatty acid synthesis in M. aeruginosa were significantly changed under the effect of B. laterosporus Bl-zj (Table 3). There were nine photosynthesis-related genes that were down-regulated on the second and fourth days, compared to the CMA group, among which seven genes were related to photosystem I (PSI). Nine genes related to oxidative phosphorylation were down-regulated both on the second and fourth days, compared to the control. The expression of ND5 and Ndufs8 were most significantly decreased with log2 (fold changes) of 3.38 and 3.43 on the fourth day compared to the control, respectively. In addition, the expression of two genes (FabF and FabG1) involved in fatty acid synthesis increased on the second day compared to the control, while YOXD was increased on the fourth day compared to the control. Similarly, three genes (FabH, FabG2 and FabZ) were up-regulated on the second and fourth days compared to the control.

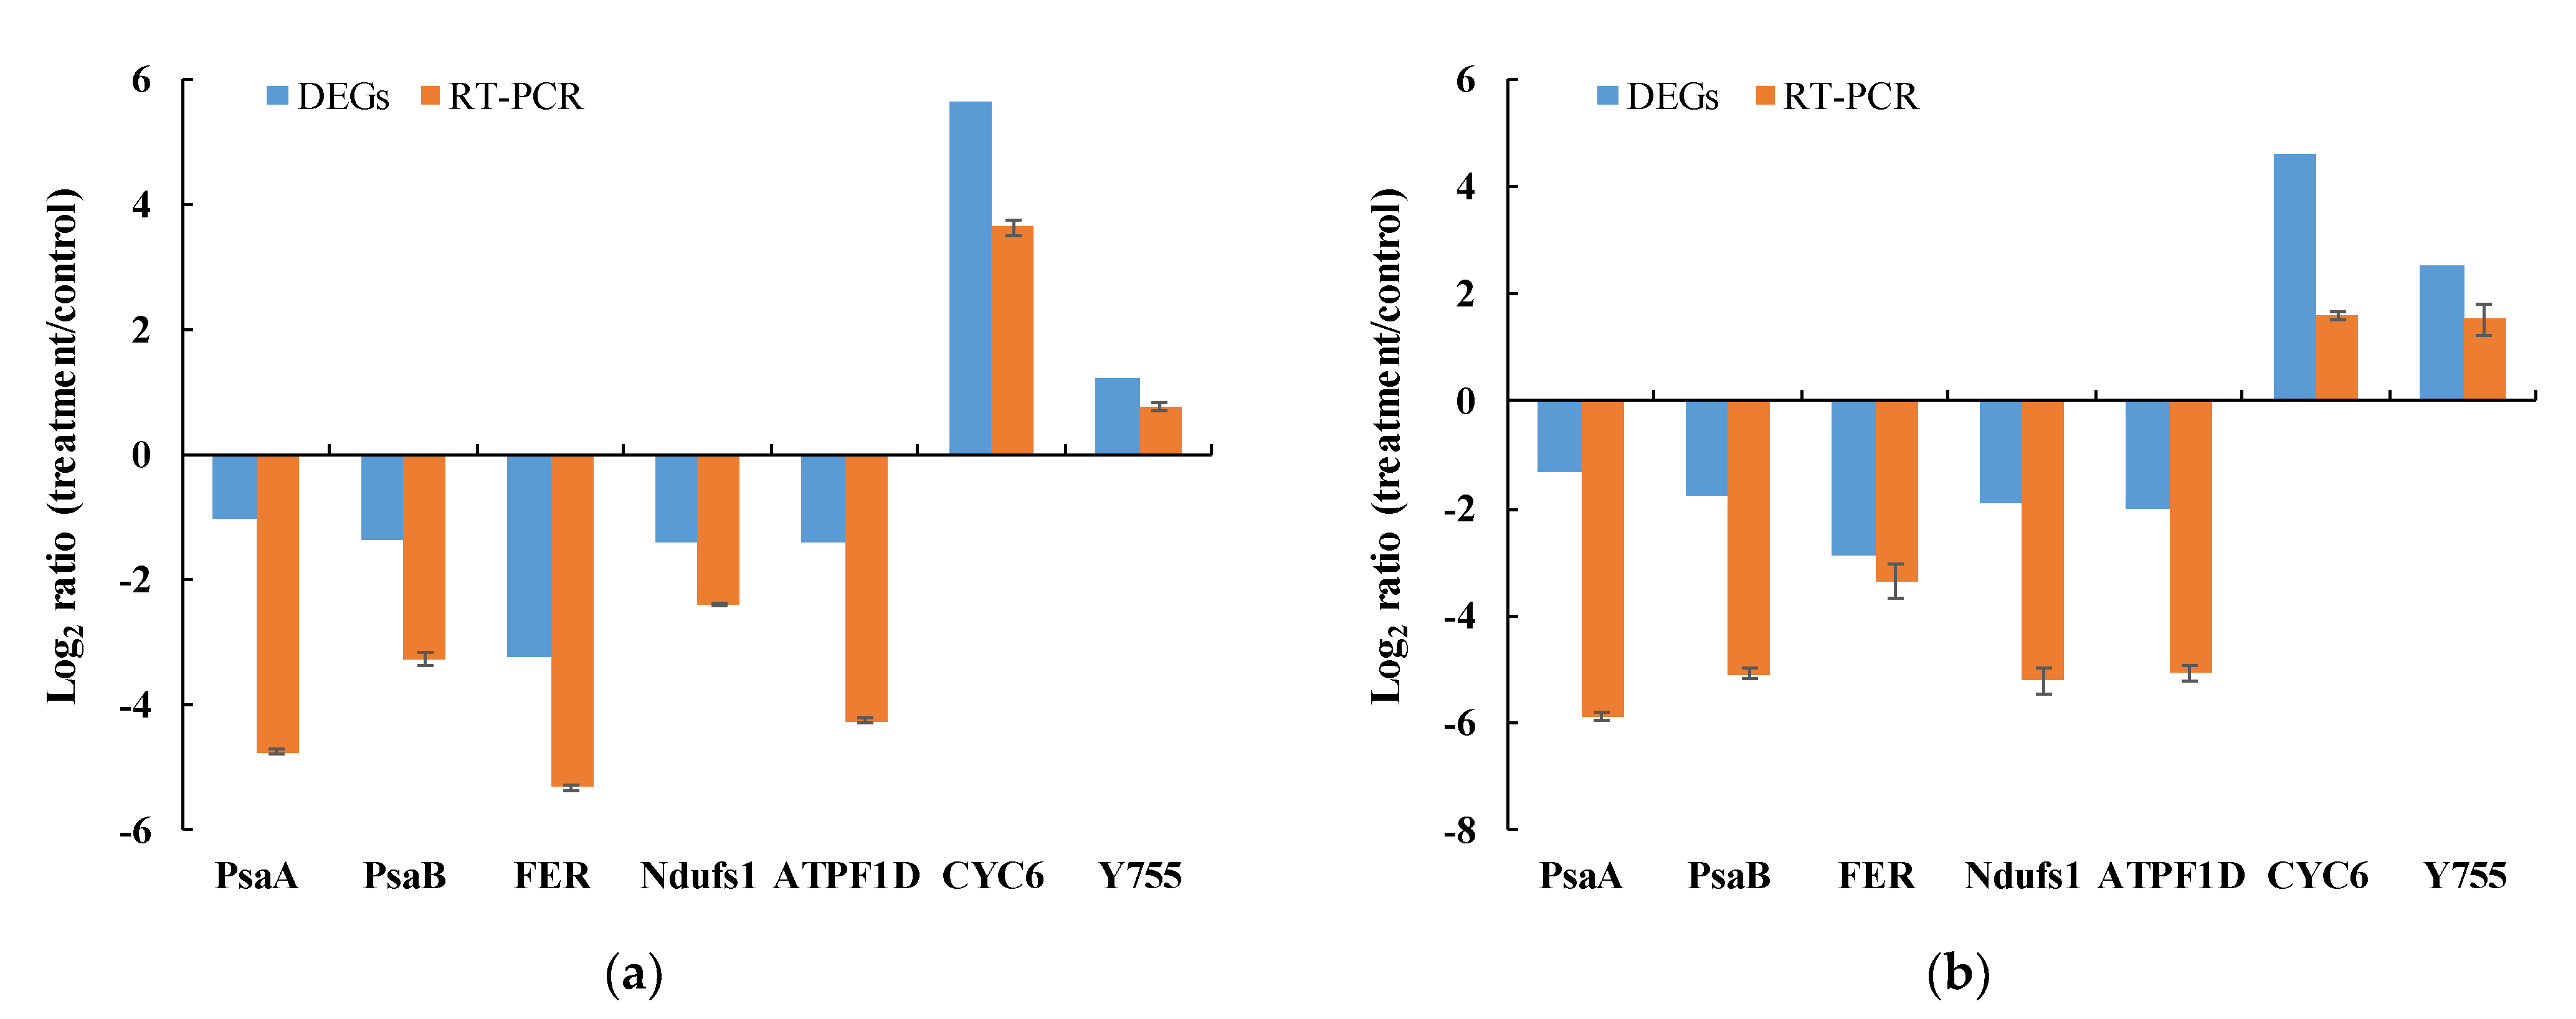
3.6. Quantitative Real-Time PCR Validation

To confirm the RNA-seq results, seven genes were selected for further qRT-PCR analysis. Figure 5a,b shows the expression levels of each gene on the second and fourth days, respectively. Although the fold changes were different, the expression trends of these seven genes were consistent in both RNA-seq and qRT-PCR results.

4. Discussion

In the present study, second- and fourth-day transcriptomes of M. aeruginosa in co-culture with B. laterosporus Bl-zj were obtained and compared using next-generation sequencing technology. We found that several pathways significantly changed, which were probably the critical factors as B. laterosporus attacked the cells of M. aeruginosa.
Photosynthesis is a critical cellular process that determines the growth of microalgae. In this process, light energy is captured and used to synthesize carbohydrates and produce oxygen while consuming carbon dioxide. Transcriptomic analysis showed that PSI was seriously affected by B. laterosporus Bl-zj. The principal subunits of the reaction center (PsaA and PsaB) and other subunits (PsaC, PsaE, PsaD, PsaF and PsaL) were significantly down-regulated on the second day and continuously inhibited on the fourth day (Table 3). PSI is a supercomplex of a reaction center and light-harvesting complexes [27]. PsaA and PsaB are the central core proteins that bonded all cofactors of the electron transport chain except the cluster of ferredoxins and harbor the electron transport chain [28]. PsaC can bind to the terminal electron acceptor and participate in the transfer of electrons to ferredoxin [29]. PsaE was responsible for the dissociation of ferredoxin from the PSI complex and involved in the cyclic electron flow that occurred around the PSI complex [30]. PsaD has been regarded as a key subunit in the assembly, stability and functionality of PSI [31]. PsaF has been found to be related to efficient electron transfer from both plastocyanin and cytochrome c6 to PSI [32]. It has been reported that PsaL was critical for energy transfer from phosphorylated LHCII to the PSI reaction center [33]. In this study, it was observed that Psb28 significantly declined after 2 days compared to the control. Psb28 was the photosystem II reaction center protein, which plays an important role in PSII repair [34]. In addition, plastocyanin and ferredoxin significantly decreased after the second and fourth days compared to the control. Plastocyanin and ferredoxin are small soluble copper protein and iron–sulfur protein, respectively, which are important PSI turnover products induced by light energy involved in electron transfer from plastocyanin to ferredoxin [28,35]. These results showed that under the action of B. laterosporus Bl-zj photosynthesis, especially the PSI of M. aeruginosa, is significantly inhibited. The reduction of photosynthesis-related gene transcripts impeded electron transport, resulting in the loss of equivalent products necessary for the process of carbon assimilation.
Oxidative phosphorylation is the main energy source of aerobic cells and the main pathway of ATP production [36]. It is an enzymatic process in which ATP is formed when electrons are transferred from substrate to oxygen and ADP is phosphorylated. Transcriptomic analysis showed that the genes related to oxidative phosphorylation significantly decreased after the second and fourth days, relative to the control (Table 3). NADH: ubiquinone oxidoreductase (Complex I) is the first and most complex enzyme required in this process. It connected NADH and ubiquinone electron transfer to proton transmembrane transport, which helped to generate proton power, which was necessary for ATP synthesis. Further, ND1, ND2, ND4, ND5, Ndufs1, Ndufs8 were the core subunits of Complex I [37]. In Chlamydomonas, the loss of ND1 or ND5 subunit prevented the assembly of whole mitochondrial Complex I, whereas the loss of ND4 led to the formation of a subcomplex of 650 kDa present in a reduced amount [38,39]. In addition, COX10 related to cytochrome c oxidase (Complex IV) and ATPF0B, ATPF1D related ATP synthase significantly decreased after the second and fourth days compared to the control group. Complex IV catalyzes the last step of the mitochondrial electron transfer chain and is considered one of the main regulatory sites of oxidative phosphorylation [40]. COX10 participates in the biosynthesis of heme a, a key cofactor of cytochrome c oxidase [41]. ATP synthase can synthesize cellular ATP from ADP and inorganic phosphate. It is comprised of two parts, an ATP-driven motor F1 and a proton-driven F0 motor [42].
The down-regulation of oxidative phosphorylation expression led to a reduction in the transmembrane gradient and ATP synthesis, suggesting that B. laterosporus Bl-zj decreased the amount of cellular ATP in M. aeruginosa cells. Moreover, the absolute value of log2 (fold changes) of MB4 vs. CMA comparison were almost larger than that of MB2 vs. CMA comparison. This indicated that oxidative phosphorylation of M. aeruginosa was continuously inhibited. Further, the ATP synthesis decreased, and the cyanobacteria cells could not obtain enough energy to survive. In addition, the electron transport chain and oxidative phosphorylation are critical cellular processes that sustain life, and the absence of either can affect cellular respiration and even lead to cell death [43]. The decrease of electron transport chain and oxidative phosphorylation genes expression could inhibit the algal growth and even cause death.
The response and adaptability of microalgae to environmental changes were closely related to numerous changes in the composition of lipids in cells and the ability to synthesize a series of special lipids [44]. Under stress, some algal cells cannot reproduce but accumulate lipids instead [45,46]. Many deep-sea bacteria adapted to the deep-sea environment by synthesizing more unsaturated lipids [47]. In this study, the expression of fatty acid biosynthesis-related genes FabH and FabZ were up-regulated in both MB2 and MB4 groups compared to control, while FabF was up-regulated only in MB2 vs. CMA comparison (Table 3). FabF catalyzed the elongation of fatty acyl chains and NADPH-specific reduction of long-chain β-ketoacyl derivatives [48]. FabH was considered to catalyze the first elongation reaction (Claisen condensation) of type II fatty acid synthesis, resulting in the production of short-chain fatty acid primers [49]. FabZ showed ubiquitous distribution in type II fatty acid synthase, and the dehydratase efficiently catalyzed the dehydration of short and long-chain saturated and unsaturated beta-hydroxyacyl-ACPs [50]. The up-regulated expression of fatty acid synthesis genes revealed that M. aeruginosa was under stress. When M. aeruginosa was under the stress of pyrogallol, a compound with strong inhibition on M. aeruginosa, the expression of FabZ was also increased [51]. Moreover, the expression of gene Y755 was up-regulated. 2-Cys peroxiredoxin was a subclass of peroxiredoxin proteins (Prx-s), and Prx-s were a ubiquitous family of antioxidant enzymes and important components of the cellular antioxidant defense system as well as redox homeostasis [52]. These suggested that membranes may undergo oxidative damage. In order to maintain the normal function of membranes, more unsaturated fatty acids need to be integrated into membranes.

5. Conclusions

In the present study, we provide the molecular responses of M. aeruginosa to B. laterosporus treatment. The B. laterosporus treatment led to a suppression of photosynthesis and oxidative phosphorylation of M. aeruginosa. We also found that the expression of the genes related to fatty acid synthesis increased. In addition, the expression of the antioxidant enzymes, such as 2-Cys peroxiredoxin, was increased. The inhibition of photosynthesis and oxidative phosphorylation of M. aeruginosa could block electron transport and affect energy acquisition. The increase in fatty acid synthesis-related genes and 2-Cys peroxiredoxin indicated that cyanobacteria exhibited oxidative damage, causing algal cell membrane lipid peroxidation. These changes inhibited cyanobacteria growth, leading to algae death.

Supplementary Materials

The following are available online at https://0-www-mdpi-com.brum.beds.ac.uk/article/10.3390/ijerph18168615/s1, Table S1: PCR primer pairs used in this study.

Author Contributions

Conceptualization, Y.Z. and D.C.; Formal analysis, Y.Z., D.C., N.Z., F.L. and Q.L.; Funding acquisition, Y.Z., X.L., C.L. and X.H.; Writing—original draft, D.C.; Writing—review and editing, Y.Z., C.L. and X.H. All authors have read and agreed to the published version of the manuscript.

Funding

This research was funded by the National Key R & D Plan “Blue Granary Science and Technology Innovation” (SQ2020YFD090053-05); the Guangdong Provincial Key Area Research and Development Plan Projects (2020B0202010009); the Guangdong South China Sea Key Laboratory of Aquaculture for Aquatic Economic Animals, Guangdong Ocean University (KFKT2019YB09); and the Natural Science Foundation of Guangdong Province (2018A030313212).

Institutional Review Board Statement

Not applicable.

Informed Consent Statement

Not applicable.

Conflicts of Interest

The authors declare no conflict of interest.

References

  1. Watanabe, M.F.; Oishi, S.; Watanabe, Y.; Watanabe, M. Strong Probability Of Lethal Toxicity In The Blue-Green Alga Microcystis Viridis Lemmermann1. J. Phycol. 1986, 22, 552–556. [Google Scholar] [CrossRef]
  2. Sivonen, K.; Carmichael, W.W.; Namikoshi, M.; Rinehart, K.L.; Dahlem, A.M.; Niemelä, S.I. Isolation and characterization of hepatotoxic microcystin homologs from the filamentous freshwater cyanobacterium Nostoc sp. strain 152. Appl. Environ. Microbiol. 1990, 56, 2650–2657. [Google Scholar] [CrossRef] [PubMed] [Green Version]
  3. Laub, J.; Henriksen, P.; Brittain, S.M.; Wang, J.; Carmichael, W.W.; Rinehart, K.L. [ADMAdda5]-microcystins inPlanktothrix agardhii strain PH-123 (cyanobacteria)? Importance for monitoring of microcystins in the environment. Environ. Toxicol. 2002, 17, 351–357. [Google Scholar] [CrossRef]
  4. Qin, B.; Zhu, G.; Gao, G.; Zhang, Y.; Li, W.; Paerl, H.W.; Carmichael, W.W. A Drinking Water Crisis in Lake Taihu, China: Linkage to Climatic Variability and Lake Management. Environ. Manag. 2010, 45, 105–112. [Google Scholar] [CrossRef] [PubMed]
  5. Paerl, H.W.; Otten, T.G. Blooms Bite the Hand That Feeds Them. Science 2013, 342, 433–434. [Google Scholar] [CrossRef] [PubMed]
  6. Harke, M.J.; Steffen, M.M.; Gobler, C.J.; Otten, T.G.; Wilhelm, S.; Wood, S.A.; Paerl, H.W. A review of the global ecology, genomics, and biogeography of the toxic cyanobacterium, Microcystis spp. Harmful Algae 2016, 54, 4–20. [Google Scholar] [CrossRef] [Green Version]
  7. Tang, X.; Wu, M.; Yang, W.; Yin, W.; Jin, F.; Ye, M.; Currie, N.; Scholz, M. Ecological Strategy for Eutrophication Control. Water. Air Soil Pollut. 2011, 223, 723–737. [Google Scholar] [CrossRef]
  8. Sun, P.; Esquivel-Elizondo, S.; Zhao, Y.; Wu, Y. Glucose triggers the cytotoxicity of Citrobacter sp. R1 against Microcystis aeruginosa. Sci. Total. Environ. 2017, 603–604, 18–25. [Google Scholar] [CrossRef]
  9. Liu, J.; Yang, C.; Chi, Y.; Wu, D.; Dai, X.; Zhang, X.; Igarashi, Y.; Luo, F. Algicidal characterization and mechanism of Bacillus licheniformis Sp34 against Microcystis aeruginosa in Dianchi Lake. J. Basic Microbiol. 2019, 59, 1112–1124. [Google Scholar] [CrossRef] [PubMed]
  10. Zhang, C.; Massey, I.Y.; Liu, Y.; Huang, F.; Gao, R.; Ding, M.; Xiang, L.; He, C.; Wei, J.; Li, Y.; et al. Identification and characterization of a novel indigenous algicidal bacterium Chryseobacterium species against Microcystis aeruginosa. J. Toxicol. Environ. Health Part A 2019, 82, 845–853. [Google Scholar] [CrossRef]
  11. Zhang, F.; Fan, Y.; Zhang, D.; Chen, S.; Bai, X.; Ma, X.; Xie, Z.; Xu, H. Effect and mechanism of the algicidal bacterium Sulfitobacter porphyrae ZFX1 on the mitigation of harmful algal blooms caused by Prorocentrum donghaiense. Environ. Pollut. 2020, 263, 114475. [Google Scholar] [CrossRef] [PubMed]
  12. Danyang, Z.; Chen, Q.; Zhang, D.; Zhang, H.; Lei, X.; Chen, Z.; Qiuliang, C.; Hong, Y.; Ma, X.; Zheng, W.; et al. The algicidal mechanism of prodigiosin from Hahella sp. KA22 against Microcystis aeruginosa. Sci. Rep. 2017, 7, 1–15. [Google Scholar] [CrossRef] [Green Version]
  13. Yang, F.; Zhou, Y.; Yin, L.; Zhu, G.; Liang, G.; Pu, Y. Microcystin-Degrading Activity of an Indigenous Bacterial Strain Stenotrophomonas acidaminiphila MC-LTH2 Isolated from Lake Taihu. PLoS ONE 2014, 9, e86216. [Google Scholar] [CrossRef] [Green Version]
  14. Shilo, M. Lysis of Blue-Green Algae by Myxobacter. J. Bacteriol. 1970, 104, 453–461. [Google Scholar] [CrossRef] [PubMed] [Green Version]
  15. Furusawa, G.; Yoshikawa, T.; Yasuda, A.; Sakata, T. Algicidal activity and gliding motility of Saprospira sp. SS98-5. Can. J. Microbiol. 2003, 49, 92–100. [Google Scholar] [CrossRef]
  16. Hou, S.; Shu, W.; Tan, S.; Zhao, L.; Yin, P. Exploration of the antioxidant system and photosynthetic system of a marine algicidal Bacillus and its effect on four harmful algal bloom species. Can. J. Microbiol. 2016, 62, 49–59. [Google Scholar] [CrossRef]
  17. Zhang, X.; Song, T.; Ma, H.; Li, L. Correction: Physiological response of Microcystis aeruginosa to the extracellular substances from an Aeromonas sp. RSC Adv. 2017, 7, 51373. [Google Scholar] [CrossRef] [Green Version]
  18. Shi, S.; Tang, D.; Liu, Y. Effects of an Algicidal Bacterium Pseudomonas mendocina on the Growth and Antioxidant System of Aphanizomenon flos-aquae. Curr. Microbiol. 2009, 59, 107–112. [Google Scholar] [CrossRef]
  19. Wang, H.; Tomasch, J.; Jarek, M.; Wagner-Döbler, I. A dual-species co-cultivation system to study the interactions between Roseobacters and dinoflagellates. Front. Microbiol. 2014, 5, 311. [Google Scholar] [CrossRef]
  20. Gao, X.; Wang, C.; Dai, W.; Ren, S.; Tao, F.; He, X.; Han, G.; Wang, W. Proteomic analysis reveals large amounts of decomposition enzymes and major metabolic pathways involved in algicidal process of Trametes versicolor F21a. Sci. Rep. 2017, 7, 1–10. [Google Scholar] [CrossRef] [PubMed]
  21. de Oliveira, E.J.; Rabinovitch, L.; Monnerat, R.G.; Passos, L.K.J.; Zahner, V. Molecular Characterization of Brevibacillus laterosporus and Its Potential Use in Biological Control. Appl. Environ. Microbiol. 2004, 70, 6657–6664. [Google Scholar] [CrossRef] [Green Version]
  22. Chen, D.; Huang, X.; Li, C.; Zhang, N.; Wei, H.; Zhang, Y. Effects of Brevibacillus laterosporus on microbial community of Microcystis aeruginosa. J. Guangdong Ocean Univ. 2021, 41, 1–9. [Google Scholar]
  23. Zhang, Y.; Chen, D.; Cai, J.; Zhang, N.; Li, F.; Li, C.; Huang, X. Complete Genome Sequence Analysis of Brevibacillus laterosporus Bl-zj Reflects its Potential Algicidal Response. Curr. Microbiol. 2021, 78, 1409–1417. [Google Scholar] [CrossRef] [PubMed]
  24. Rippka, R.; Stanier, R.Y.; Deruelles, J.; Herdman, M.; Waterbury, J.B. Generic Assignments, Strain Histories and Properties of Pure Cultures of Cyanobacteria. Microbiology 1979, 111, 1–61. [Google Scholar] [CrossRef] [Green Version]
  25. Jeffrey, S.; Humphrey, G. New spectrophotometric equations for determining chlorophylls a, b, c1 and c2 in higher plants, algae and natural phytoplankton. Biochem. Physiol. Pflanz. 1975, 167, 191–194. [Google Scholar] [CrossRef]
  26. Wang, T.; Hu, Y.; Zhu, M.; Yin, S. Integrated transcriptome and physiology analysis of Microcystis aeruginosa after exposure to copper sulfate. J. Oceanol. Limnol. 2019, 38, 102–113. [Google Scholar] [CrossRef]
  27. Croce, R.; Amerongen, H.V. Light-harvesting in photosystem I. Photosynth. Res. 2013, 116, 153–166. [Google Scholar] [CrossRef] [Green Version]
  28. Amunts, A.; Drory, O.; Nelson, N. The structure of a plant photosystem I supercomplex at 3.4 Å resolution. Nat. Cell Biol. 2007, 447, 58–63. [Google Scholar] [CrossRef]
  29. Germano, M.; Yakushevska, A.E.; Keegstra, W.; Van Gorkom, H.J.; Dekker, J.P.; Boekema, E.J. Supramolecular organization of photosystem I and light-harvesting complex I in Chlamydomonas reinhardtii. FEBS Lett. 2002, 525, 121–125. [Google Scholar] [CrossRef] [Green Version]
  30. Lushy, A.; Verchovsky, L.; Nechushtai, R. The Stable Assembly of Newly Synthesized PsaE into the Photosystem I Complex Occurring via the Exchange Mechanism Is Facilitated by Electrostatic Interactions. Biochemistry 2002, 41, 11192–11199. [Google Scholar] [CrossRef] [PubMed]
  31. Minai, L.; Fish, A.; Darash-Yahana, M.; Verchovsky, L.; Nechushtai, R. The Assembly of the PsaD Subunit into the Membranal Photosystem I Complex Occurs via an Exchange Mechanism. Biochemistry 2001, 40, 12754–12760. [Google Scholar] [CrossRef]
  32. Hippler, M.; Drepper, F.; Farah, J.; Rochaix, J.-D. Fast electron transfer from cytochrome c6 and plastocyanin to photosystem I of Chlamydomonas reinhardtii requires PsaF. Biochemistry 1997, 36, 6343–6349. [Google Scholar] [CrossRef]
  33. Lunde, C.; Jensen, P.E.; Haldrup, A.; Knoetzel, J.; Scheller, H. The PSI-H subunit of photosystem I is essential for state transitions in plant photosynthesis. Nat. Cell Biol. 2000, 408, 613–615. [Google Scholar] [CrossRef]
  34. Sakata, S.; Mizusawa, N.; Kubota-Kawai, H.; Sakurai, I.; Wada, H. Psb28 is involved in recovery of photosystem II at high temperature in Synechocystis sp. PCC 6803. Biochim. Biophys. Acta (BBA) Bioenerg. 2013, 1827, 50–59. [Google Scholar] [CrossRef] [Green Version]
  35. Cramer, W.A.; Soriano, G.M.; Ponomarev, M.; Huang, D.; Zhang, H.; Martinez, S.E.; Smith, J.L. Some new structural aspects and old controversies concerning the cytochrome b6f complex of oxygenic photosynthesis. Annu. Rev. Plant Physiol. Plant Mol. Biol. 1996, 47, 477–508. [Google Scholar] [CrossRef] [PubMed]
  36. Boekema, E.J.; Braun, H.-P. Supramolecular Structure of the Mitochondrial Oxidative Phosphorylation System. J. Biol. Chem. 2007, 282, 1–4. [Google Scholar] [CrossRef] [PubMed] [Green Version]
  37. Friedrich, T. Complex I: A chimaera of a redox and conformation-driven proton pump? J. Bioenerg. Biomembr. 2001, 33, 169–177. [Google Scholar] [CrossRef]
  38. Cardol, P.; Matagne, R.F.; Remacle, C. Impact of Mutations Affecting ND Mitochondria-encoded Subunits on the Activity and Assembly of Complex I in Chlamydomonas. Implication for the Structural Organization of the Enzyme. J. Mol. Biol. 2002, 319, 1211–1221. [Google Scholar] [CrossRef]
  39. Cardol, P.; Boutaffala, L.; Memmi, S.; Devreese, B.; Matagne, R.F.; Remacle, C. In Chlamydomonas, the loss of ND5 subunit prevents the assembly of whole mitochondrial complex I and leads to the formation of a low abundant 700 kDa subcomplex. Biochim. Biophys. Acta (BBA) Bioenerg. 2008, 1777, 388–396. [Google Scholar] [CrossRef] [Green Version]
  40. Li, Y.; Park, J.-S.; Deng, J.-H.; Bai, Y. Cytochrome c oxidase subunit IV is essential for assembly and respiratory function of the enzyme complex. J. Bioenerg. Biomembr. 2006, 38, 283–291. [Google Scholar] [CrossRef] [Green Version]
  41. Pierrel, F.; Bestwick, M.L.; Cobine, P.; Khalimonchuk, O.; Cricco, J.; Winge, D.R. Coa1 links the Mss51 post-translational function to Cox1 cofactor insertion in cytochrome c oxidase assembly. EMBO J. 2007, 26, 4335–4346. [Google Scholar] [CrossRef]
  42. Yoshida, M.; Muneyuki, E.; Hisabori, T. ATP synthase—A marvellous rotary engine of the cell. Nat. Rev. Mol. Cell Biol. 2001, 2, 669–677. [Google Scholar] [CrossRef] [PubMed]
  43. Duan, S.; Chen, Q. Transcriptional Analysis of Chlorella Pyrenoidosa Exposed to Bisphenol A. Int. J. Environ. Res. Public Health 2019, 16, 1374. [Google Scholar] [CrossRef] [Green Version]
  44. Guschina, I.A.; Harwood, J.L. Lipids and lipid metabolism in eukaryotic algae. Prog. Lipid Res. 2006, 45, 160–186. [Google Scholar] [CrossRef] [PubMed]
  45. Ruangsomboon, S.; Ganmanee, M.; Choochote, S. Effects of different nitrogen, phosphorus, and iron concentrations and salinity on lipid production in newly isolated strain of the tropical green microalga, Scenedesmus dimorphus KMITL. Environ. Boil. Fishes 2012, 25, 867–874. [Google Scholar] [CrossRef]
  46. Pandit, P.R.; Fulekar, M.H.; Karuna, M.S.L. Effect of salinity stress on growth, lipid productivity, fatty acid composition, and biodiesel properties in Acutodesmus obliquus and Chlorella vulgaris. Environ. Sci. Pollut. Res. 2017, 24, 13437–13451. [Google Scholar] [CrossRef]
  47. Allen, E.E.; Bartlett, D.H. FabF Is Required for Piezoregulation of cis -Vaccenic Acid Levels and Piezophilic Growth of the Deep-Sea Bacterium Photobacterium profundum Strain SS9. J. Bacteriol. 2000, 182, 1264–1271. [Google Scholar] [CrossRef] [PubMed] [Green Version]
  48. Cohen-Gonsaud, M.; Ducasse, S.; Hoh, F.; Zerbib, D.; Labesse, G.; Quemard, A. Crystal Structure of MabA from Mycobacterium tuberculosis, a Reductase involved in Long-chain Fatty Acid Biosynthesis. J. Mol. Biol. 2002, 320, 249–261. [Google Scholar] [CrossRef]
  49. Lai, C.-Y.; Cronan, J.E. β-Ketoacyl-Acyl Carrier Protein Synthase III (FabH) Is Essential for Bacterial Fatty Acid Synthesis. J. Biol. Chem. 2003, 278, 51494–51503. [Google Scholar] [CrossRef] [PubMed] [Green Version]
  50. Heath, R.J.; Rock, C.O. Roles of the FabA and FabZ β-Hydroxyacyl-Acyl Carrier Protein Dehydratases in Escherichia coli Fatty Acid Biosynthesis. J. Biol. Chem. 1996, 271, 27795–27801. [Google Scholar] [CrossRef] [Green Version]
  51. Wang, J.; Liu, Q.; Feng, J.; Lv, J.-P.; Xie, S.-L. Effect of high-doses pyrogallol on oxidative damage, transcriptional responses and microcystins synthesis in Microcystis aeruginosa TY001 (Cyanobacteria). Ecotoxicol. Environ. Saf. 2016, 134, 273–279. [Google Scholar] [CrossRef] [PubMed]
  52. Stork, T.; Michel, K.-P.; Pistorius, E.K.; Dietz, K.-J. Bioinformatic analysis of the genomes of the cyanobacteria Synechocystis sp. PCC 6803 and Synechococcus elongatus PCC 7942 for the presence of peroxiredoxins and their transcript regulation under stress. J. Exp. Bot. 2005, 56, 3193–3206. [Google Scholar] [CrossRef] [PubMed]
Figure 1. Algicidal effect of B. laterosporus on M. aeruginosa. (** Represents significant differences to control group at the 0.01 probability level.)
Ijerph 18 08615 g001
Figure 2. The principal component analysis (PCA) was performed for each sample. (The blue, red and green labels represent the treatment group of CMA, MB2 and MB4, respectively. The circle, triangle and square labels represent replication 1, replication 2 and replication 3 samples in each group, respectively.)
Ijerph 18 08615 g002
Figure 3. The number of differentially expressed genes (DEGs) at CM2 and CM4 groups compared with CMA group. (“↑” and “↓” represent up-regulated and down-regulated genes, respectively.)
Ijerph 18 08615 g003
Figure 4. Gene ontology (GO) enrichment analysis of the differently expressed genes at two groups compared with CMA group. (a) MB2 vs. CMA comparison; (b) MB4 vs. CMA comparison.
Ijerph 18 08615 g004aIjerph 18 08615 g004b
Figure 5. Comparison of the expressions of 7 differently expressed genes determined by Illumina HiSeq 2500 sequencing and qRT-PCR. (a) MB2 vs. CMA comparison (b) MB4 vs. CMA comparison.
Ijerph 18 08615 g005
Table 1. Summary of transcriptome sequencing data of M. aeruginosa under B. laterosporus.
SampleRaw Data (bp)Raw Reads No.Clean Data (bp)Clean Reads No.Mapped Reads No.Q20 (%)Q30 (%)
CMA19,468,720,00063,124,8008,089,035,90053,926,90652,199,27297.8694.09
CMA29,206,526,30061,376,8427,486,911,90049,912,74648,062,59197.9394.40
CMA38,543,553,90056,957,0267,371,049,20049,140,32847,594,70798.0594.50
MB2_111,260,710,90075,071,4069,110,216,70060,734,77843,388,41597.7394.22
MB2_29,961,599,30066,410,6627,954,650,90053,031,00639,017,49797.6293.88
MB2_39,498,113,10063,320,7547,660,962,00051,073,08036,364,63797.6593.90
MB4_110,501,108,50070,007,3908,108,475,90054,056,50637,308,38797.7294.15
MB4_29,475,501,50063,170,0107,402,896,60049,352,6444,777,91997.2993.41
MB4_39,642,770,10064,285,1347,021,052,70046,807,01831,358,59896.9492.90
Average9,728,733,73364,858,2257,800,583,53352,003,89037,785,78097.6493.94
Table 2. Distribution of up- and down-regulated genes in KEGG pathways.
KEGG Pathways (Level 2)MB2 vs. CMAMB4 vs. CMA
UpDownUpDown
Amino acid metabolism42253938
Carbohydrate metabolism59405260
Energy metabolism31442752
Metabolism of cofactors and vitamins33152823
Lipid metabolism1561611
Translation163142
Metabolism of other amino acids9494
Biosynthesis of other secondary metabolites7495
Nucleotide metabolism1211715
Metabolism of terpenoids and polyketides8774
Replication and repair610514
Membrane transport4829
Xenobiotics biodegradation and metabolism5233
Transcription2121
Signal transduction1413
Immune system0202
Glycan biosynthesis and metabolism2214
Folding, sorting and degradation8358
Cell growth and death1111
Cellular community—prokaryotes1718
Environmental adaptation--01
Table 3. Potential candidate genes related to the response to B. laterosporus Bl-zj treatment (FC = fold change).
Gene IDSymbolMB2 vs. CMAMB4 vs. CMAAnnotation
log2FCp-Valuelog2FCp-Value
Photosynthesis
RS02885PsaA−1.021.66 × 10−3−1.291.35 × 10−3photosystem I core protein psaA
RS02890PsaB−1.342.02 × 10−5−1.738.05 × 10−6photosystem I core protein psaB
RS22460PsaC−2.51.13 × 10−15−3.973.25 × 10−19photosystem I subunit VII
RS24715PsaD−2.932.42 × 10−23−4.046.13 × 10−23photosystem I reaction center subunit II
RS04855PsaE−1.666.27 × 10−13−1.976.76 × 10−7photosystem I reaction center subunit IV
RS02775PsaF−1.613.01 × 10−13−1.968.76 × 10−8photosystem I subunit III
RS25020PsaL−3.611.36 × 10−53−3.713.78 × 10−19photosystem I reaction center subunit XI
RS13445PC−4.008.78 × 10−65−3.403.01 × 10−22plastocyanin
RS12310FER−3.244.87 × 10−29−2.888.76 × 10−13ferredoxin
RS15355Psb28−1.122.85 × 10−2--photosystem II reaction center protein Psb28
RS02780PsaJ−1.614.15 × 10−6--photosystem I reaction center subunit IX
RS15435UCRI--−1.69.44 × 10−5cytochrome b6-f complex iron-sulfur subunit 1
RS16845ISIA3.941.97 × 10−613.366.36 × 10−21iron stress-induced chlorophyll-binding protein
RS13450CYC65.632.69 × 10−174.632.31 × 10−4cytochrome c6
RS12320PsbU--1.172.53 × 10−3photosystem II 12 kDa extrinsic protein
RS16660PsbJ1.081.00 × 10−4--photosystem II reaction center protein J
Oxidative phosphorylation
RS07425ND1−1.387.03 × 10−9−1.772.21 × 10−4NAD(P)H-quinone oxidoreductase subunit 1
RS05160ND2−1.093.98 × 10−7−1.725.03 × 10−6NAD(P)H-quinone oxidoreductase subunit 2
RS13045ND4−2.573.58 × 10−10−2.611.02 × 10−5proton-translocating NADH-quinone oxidoreductase, chain M family protein
RS13470ND5−2.381.77 × 10−16−3.381.70 × 10−7NAD(P)H dehydrogenase, subunit NdhF3 family protein
RS08000Ndufs1−1.394.18 × 10−6−1.892.86 × 10−62Fe-2S iron-sulfur cluster binding domain protein
RS07420Ndufs8−2.643.79 × 10−14−3.436.95 × 10−15NADH-plastoquinone oxidoreductase, I subunit
RS23775COX10−1.356.50 × 10−9−2.272.37 × 10−11protoheme IX farnesyltransferase
RS09740ATPF1D−1.391.65 × 10−4−2.011.96 × 10−3ATP synthase F1, delta subunit
RS09735ATPF0B−1.571.47 × 10−6−2.331.05 × 10−7ATP synthase F0, B subunit
RS24375ND3−2.331.35 × 10−3--NADH dehydrogenase subunit A
RS05535Ndufv2−1.121.16 × 10−6--respiratory-chain NADH dehydrogenase 24 kDa subunit
RS23755COX3--−1.649.83 × 10−4cytochrome c oxidase subunit III
RS09750ATPG--−1.51.37 × 10−3ATP synthase gamma chain
RS12325NADB1.53.14 × 10−7--L-aspartate oxidase
RS23760COX11.377.16 × 10−9--cytochrome c oxidase, subunit I
RS23765COX21.12.64 × 10−7--cytochrome c oxidase, subunit II
RS24380Ndufs7--1.459.08 × 10−5NAD(P)H-quinone oxidoreductase subunit K 1
RS13440DHSA--1.539.29 × 10−5succinate dehydrogenase/fumarate reductase, flavoprotein subunit
Fatty acid biosynthesis
RS04585FabH1.883.38 × 10−111.971.56 × 10−23-oxoacyl-[acyl-carrier-protein] synthase III
RS18070FabG21.312.24 × 10−91.331.12 × 10−2PHA-specific acetoacetyl-CoA reductase
RS08035FabZ2.424.01 × 10−132.516.76 × 10−5beta-hydroxyacyl-(acyl-carrier-protein) dehydratase
RS22350FabF1.326.66 × 10−4--beta-ketoacyl synthase, C-terminal domain protein
RS12750FabG11.169.88 × 10−5--3-oxoacyl-[acyl-carrier-protein] reductase
RS05845YOXD--2.263.16 × 10−9short chain dehydrogenase family protein
RS23000RS09855AAE16−2.738.26 × 10−10−4.543.16 × 10−11AMP-binding enzyme family protein
FabI--−1.794.63 × 10−3enoyl-[acyl-carrier-protein] reductase [NADH]
Antioxidase
RS02415Y7551.212.98 × 10−82.524.86 × 10−122-Cys peroxiredoxin BAS1
Publisher’s Note: MDPI stays neutral with regard to jurisdictional claims in published maps and institutional affiliations.

