
Understanding Worker Well-Being Relative to High-Workload and Recovery Activities across a Whole Day: Pilot Testing an Ecological Momentary Assessment Technique

 , , ,
, , , 
Abstract
:1. Introduction
2. Materials and Methods
2.1. Study Overview
2.2. Measures
2.2.1. Activity Exposure
2.2.2. Perceived Workload
2.2.3. Well-Being Experiences
2.2.4. Scoring of Measures
2.3. Statistical Analyses
3. Results
4. Discussion
4.1. Principal Findings
4.2. Implications for EMA in Worker Health Research
4.3. Limitations and Future Directions
5. Conclusions
Author Contributions
Funding
Institutional Review Board Statement
Informed Consent Statement
Data Availability Statement
Acknowledgments
Conflicts of Interest
Appendix A

| High Workload Freq. | Recovery Freq. | Un-Classified Freq. | Stress | Fatigue | Pain | Positive Affect | Negative Affect | Task Load | Work Hours | |
|---|---|---|---|---|---|---|---|---|---|---|
| High Workload | 1, p < 0.001 | |||||||||
| Recovery Freq. | −0.36, p = 0.016 | 1, p < 0.001 | ||||||||
| Un-classified | −0.39, p = 0.008 | −0.72, p < 0.001 | 1, p < 0.001 | |||||||
| Stress | 0.44, p = 0.003 | −0.19, p = 0.206 | −0.13, p = 0.377 | 1, p < 0.001 | ||||||
| Fatigue | 0.33, p = 0.028 | −0.08, p = 0.621 | −0.17, p = 0.271 | 0.57, p < 0.001 | 1, p < 0.001 | |||||
| Pain | 0.22, p = 0.142 | −0.31, p = 0.038 | 0.14, p = 0.355 | 0.44, p = 0.003 | 0.50, p < 0.001 | 1, p < 0.001 | ||||
| Positive Affect | 0.22, p = 0.140 | 0.01, p = 0.930 | −0.18, p = 0.240 | −0.10, p = 0.503 | −0.05, p = 0.743 | −0.09, p = 0.560 | 1, p < 0.001 | |||
| Negative Affect | 0.32, p = 0.031 | −0.18, p = 0.227 | −0.06, p = 0.711 | 0.73, p < 0.001 | 0.40, p = 0.006 | 0.45, p = 0.002 | −0.11, p = 0.459 | 1, p < 0.001 | ||
| Task Load | 0.51, p < 0.001 | −0.30, p = 0.043 | −0.08, p = 0.610 | 0.73, p < 0.001 | 0.34, p = 0.022 | 0.38, p = 0.010 | 0.10, p = 0.499 | 0.49, p = 0.001 | 1, p < 0.001 | |
| Work Hours | 0.21, p = 0.172 | 0.02, p = 0.874 | −0.17, p = 0.260 | 0.10, p = 0.532 | 0, p = 0.988 | −0.11, p = 0.495 | 0.04, p = 0.793 | −0.05, p = 0.734 | 0.09, p = 0.576 | 1, p < 0.001 |
Appendix B
| High Workload Freq. | Recovery Freq. | Un-Classified Freq. | Stress | Fatigue | Pain | Positive Affect | Negative Affect | Task Load | Work Hours | |
|---|---|---|---|---|---|---|---|---|---|---|
| High Workload | 1, p < 0.001 | |||||||||
| Recovery Freq. | −0.67, p < 0.001 | 1, p < 0.001 | ||||||||
| Un-classified | −0.46, p < 0.001 | −0.36, p < 0.001 | 1, p < 0.001 | |||||||
| Stress | 0.34, p < 0.001 | −0.34, p < 0.001 | −0.02, p = 0.621 | 1, p < 0.001 | ||||||
| Fatigue | 0.11, p = 0.007 | −0.10, p = 0.017 | −0.02, p = 0.606 | 0.31, p < 0.001 | 1, p < 0.001 | |||||
| Pain | 0.02, p = 0.620 | −0.06, p = 0.180 | 0.04, p = 0.327 | 0.22, p < 0.001 | 0.37, p < 0.001 | 1, p < 0.001 | ||||
| Positive Affect | −0.15, p < 0.001 | 0.14, p = 0.001 | 0.02, p = 0.683 | −0.42, p < 0.001 | −0.28, p < 0.001 | −0.15, p < 0.001 | 1, p < 0.001 | |||
| Negative Affect | 0.21, p < 0.001 | −0.22, p < 0.001 | −0.01, p = 0.829 | 0.72, p < 0.001 | 0.29, p < 0.001 | 0.23, p < 0.001 | −0.54, p < 0.001 | 1, p < 0.001 | ||
| Task Load | 0.41, p < 0.001 | −0.36, p < 0.001 | −0.08, p = 0.069 | 0.43, p < 0.001 | 0.23, p < 0.001 | 0.11, p = 0.007 | −0.13, p = 0.002 | 0.33, p < 0.001 | 1, p < 0.001 | |
| Work Hours | 0.28, p < 0.001 | −0.14, p = 0.007 | −0.17, p = 0.001 | 0.22, p < 0.001 | 0.16, p = 0.001 | 0.08, p = 0.109 | −0.12, p = 0.015 | 0.12, p = 0.014 | 0.31, p < 0.001 | 1, p < 0.001 |
References
- Tamers, S.L.; Streit, J.; Pana-Cryan, R.; Ray, T.; Syron, L.; Flynn, M.A.; Castillo, D.; Roth, G.; Geraci, C.; Guerin, R.; et al. Envisioning the future of work to safeguard the safety, health, and well-being of the workforce: A perspective from the CDC’s National Institute for Occupational Safety and Health. Am. J. Ind. Med. 2020, 63, 1065–1084. [Google Scholar] [CrossRef]
- Eurofound; International Labour Office. Working Anytime, Anywhere: The Effects on the World of Work; Publications Office of the European Union: Luxembourg; International Labour Office: Geneva, Switzerland, 2017. [Google Scholar]
- Gabriel, M.; Pessl, E. Industry 4.0 and sustainability impacts: Critical discussion of sustainability aspects with a special focus on future of work and ecological consequences. Ann. Fac. Eng. Hunedoara 2016, 14, 131. [Google Scholar]
- Brynjolfsson, E.; Horton, J.; Ozimek, A.; Rock, D.; Sharma, G.; TuYe, H.-Y. COVID-19 and Remote Work: An Early Look at US Data; Report No.: w27344; National Bureau of Economic Research: Cambridge, MA, USA, 2020; p. w27344. Available online: http://www.nber.org/papers/w27344.pdf (accessed on 17 August 2021).
- Fukumura, Y.E.; Schott, J.M.; Lucas, G.M.; Becerik-Gerber, B.; Roll, S.C. Negotiating Time and Space When Working from Home: Experiences During COVID-19. OTJR Occup. Particip. Health 2021, 41, 223–231. [Google Scholar] [CrossRef]
- Tamers, S.; Chosewood, L.; Childress, A.; Hudson, H.; Nigam, J.; Chang, C.-C. Total Worker Health® 2014–2018: The Novel Approach to Worker Safety, Health, and Well-Being Evolves. Int. J. Environ. Res. Public Health 2019, 16, 321. [Google Scholar] [CrossRef] [Green Version]
- Chari, R.; Chang, C.-C.; Sauter, S.L.; Sayers, E.L.P.; Cerully, J.L.; Schulte, P.; Schill, A.L.; Uscher-Pines, L. Expanding the Paradigm of Occupational Safety and Health a New Framework for Worker Well-Being. J. Occup. Environ. Med. 2018, 60, 589–593. [Google Scholar] [CrossRef] [PubMed]
- Sauter, S.L. Integrative Approaches to Safeguarding the Health and Safety of Workers. Ind. Health 2013, 51, 559–561. [Google Scholar] [CrossRef] [Green Version]
- Meijman, T.F.; Mulder, G. Psychological aspects of workload. In Handbook of Work and Organizational: Work Psychology, 2nd ed.; Psychology Press: Hove, UK, 1998; Volume 2, pp. 5–33. [Google Scholar]
- Sonnentag, S.; Fritz, C. The Recovery Experience Questionnaire: Development and validation of a measure for assessing recuperation and unwinding from work. J. Occup. Health Psychol. 2007, 12, 204–221. [Google Scholar] [CrossRef] [PubMed] [Green Version]
- Pettican, A.; Prior, S. ‘It’s a New Way of Life’: An Exploration of the Occupational Transition of Retirement. Br. J. Occup. Ther. 2011, 74, 12–19. [Google Scholar] [CrossRef]
- Hart, S.G. NASA-task load index (NASA-TLX) 20 years later. In In Proceedings of the Human Factors and Ergonomics Society Annual Meeting; Sage publications: Los Angeles, CA, USA, 2006; pp. 904–908. [Google Scholar]
- Dich, N.; Lange, T.; Head, J.; Rod, N.H. Work Stress, Caregiving and Allostatic Load: Prospective results from Whitehall II cohort study. Psychosom. Med. 2015, 77, 539–547. [Google Scholar] [CrossRef] [PubMed] [Green Version]
- Demerouti, E.; Bakker, A.B.; Geurts, S.A.E.; Taris, T.W. Daily Recovery from Work-Related Effort During Non-Work Time. Res. Occup. Stress Well Being 2009, 7, 85–123. [Google Scholar]
- Bowling, N.A.; Alarcon, G.M.; Bragg, C.B.; Hartman, M.J. A meta-analytic examination of the potential correlates and consequences of workload. Work Stress 2015, 29, 95–113. [Google Scholar] [CrossRef]
- Radic, A.; Arjona-Fuentes, J.M.; Ariza-Montes, A.; Han, H.; Law, R. Job demands—Job resources (JD-R) model, work engagement, and well-being of cruise ship employees. Int. J. Hosp. Manag. 2020, 88, 102518. [Google Scholar] [CrossRef]
- Ariza-Montes, A.; Hernández-Perlines, F.; Han, H.; Law, R. Human dimension of the hospitality industry: Working conditions and psychological well-being among European servers. J. Hosp. Tour. Manag. 2019, 41, 138–147. [Google Scholar] [CrossRef]
- Bennett, A.A.; Bakker, A.B.; Field, J.G. Recovery from work-related effort: A meta-analysis. J. Organ. Behav. 2018, 39, 262–275. [Google Scholar] [CrossRef]
- Sonnentag, S. Work, recovery activities, and individual well-being: A diary study. J. Occup. Health Psychol. 2001, 6, 196. [Google Scholar] [CrossRef] [PubMed]
- Bakker, A.B.; Demerouti, E. The Job Demands-Resources model: State of the art. J. Manag. Psychol. 2007, 22, 309–328. [Google Scholar] [CrossRef] [Green Version]
- Shiffman, S.; Stone, A.A.; Hufford, M.R. Ecological momentary assessment. Annu. Rev. Clin. Psychol. 2008, 4, 1–32. [Google Scholar] [CrossRef] [PubMed]
- Pressman, S.D.; Matthews, K.A.; Cohen, S.; Martire, L.M.; Scheier, M.; Baum, A.; Schulz, R. Association of Enjoyable Leisure Activities with Psychological and Physical Well-Being. Psychosom. Med. 2009, 71, 725–732. [Google Scholar] [CrossRef] [Green Version]
- Dababneh, A.J.; Swanson, N.; Shell, R.L. Impact of added rest breaks on the productivity and well being of workers. Ergonomics 2001, 44, 164–174. [Google Scholar] [CrossRef]
- Pyatak, E.A.; Hernandez, R.; Pham, L.; Mehdiyeva, K.; Schneider, S.; Peters, A.; Ruelas, V.; Crandall, J.; Lee, P.-J.; Jin, H.; et al. Function and Emotion in Everyday Life with Type 1 Diabetes (FEEL-T1D): A fully remote intensive longitudinal study of blood glucose, function, and emotional well-being in adults with type 1 diabetes (Preprint). JMIR Res. Protoc. 2021. Available online: http://preprints.jmir.org/preprint/30901 (accessed on 10 September 2021).
- Harris, P.A.; Taylor, R.; Thielke, R.; Payne, J.; Gonzalez, N.; Conde, J.G. Research electronic data capture (REDCap)—A metadata-driven methodology and workflow process for providing translational research informatics support. J. Biomed. Inform. 2009, 42, 377–381. [Google Scholar] [CrossRef] [Green Version]
- Laurenceau, J.-P. Using Mobile Devices to Study Daily Diabetes Management in Marital; Context NIDDK/NIH (R21DK098679); University of Delaware: Newark, DE, USA, 2013. [Google Scholar]
- American Occupational Therapy Association. Occupational Therapy Practice Framework: Domain and Process—Fourth Edition. Am. J. Occup Ther. 2020, 74, 7412410010. [Google Scholar]
- Tudor-Locke, C.; Washington, T.L.; Ainsworth, B.E.; Troiano, R.P. Linking the American Time Use Survey (ATUS) and the compendium of physical activities: Methods and rationale. J. Phys. Act. Health 2009, 6, 347–353. [Google Scholar] [CrossRef] [Green Version]
- Legg, L.; Weir, C.J.; Langhorne, P.; Smith, L.N.; Stott, D.J. Is informal caregiving independently associated with poor health? A population-based study. J. Epidemiol. Community Health 2013, 67, 95–97. [Google Scholar] [CrossRef]
- Murphy, N.A.; Christian, B.; Caplin, D.A.; Young, P.C. The health of caregivers for children with disabilities: Caregiver perspectives. Child Care Health Dev. 2007, 33, 180–187. [Google Scholar] [CrossRef]
- Cohen, C.A.; Colantonio, A.; Vernich, L. Positive aspects of caregiving: Rounding out the caregiver experience. Int. J. Geriatr. Psychiatry 2002, 17, 184–188. [Google Scholar] [CrossRef]
- Brown, S.L.; Smith, D.M.; Schulz, R.; Kabeto, M.U.; Ubel, P.A.; Poulin, M.; Yi, J.; Kim, C.; Langa, K.M. Caregiving Behavior Is Associated with Decreased Mortality Risk. Psychol. Sci. 2009, 20, 488–494. [Google Scholar] [CrossRef] [PubMed] [Green Version]
- Buyck, J.-F.; Bonnaud, S.; Boumendil, A.; Andrieu, S.; Bonenfant, S.; Goldberg, M.; Zins, M.; Ankri, J. Informal Caregiving and Self-Reported Mental and Physical Health: Results from the Gazel Cohort Study. Am. J. Public Health 2011, 101, 1971–1979. [Google Scholar] [CrossRef] [PubMed]
- Rose, M.S.; Noelker, L.S.; Kagan, J. Improving Policies for Caregiver Respite Services. Gerontologist 2015, 55, 302–308. [Google Scholar] [CrossRef] [PubMed]
- Tindle, J.; Tadi, P. Neuroanatomy, Parasympathetic Nervous System; StatPearls Publishing: Treasure Island, FL, USA, 2021. Available online: http://0-www-ncbi-nlm-nih-gov.brum.beds.ac.uk/books/NBK553141/ (accessed on 24 June 2021).
- Stebbins, R.A. Casual leisure: A conceptual statement. Leis. Stud. 1997, 16, 17–25. [Google Scholar] [CrossRef]
- Zimmerman, M.E. Task Load. In Encyclopedia of Clinical Neuropsychology; Kreutzer, J.S., DeLuca, J., Caplan, B., Eds.; Springer: New York, NY, USA, 2011; pp. 2469–2470. [Google Scholar] [CrossRef]
- Hart, S.G.; Staveland, L.E. Development of NASA-TLX (Task Load Index): Results of Empirical and Theoretical Research. In Advances in Psychology; Elsevier: Amsterdam, The Netherlands, 1988; pp. 139–183. Available online: https://0-linkinghub-elsevier-com.brum.beds.ac.uk/retrieve/pii/S0166411508623869 (accessed on 24 March 2019).
- Hoonakker, P.; Carayon, P.; Gurses, A.; Brown, R.; McGuire, K.; Khunlertkit, A.; Walker, J.M. Measuring Workload of ICU Nurses with a Questionnaire Survey: The NASA Task Load Index (TLX). IIE Trans. Healthc. Syst. Eng. 2011, 1, 131–143. [Google Scholar] [CrossRef]
- Chari, R.; Chang, C.-C.; Sauter, S.L.; Sayers, E.L.P.; Huang, W.; Fisher, G.G. NIOSH Worker Well-Being Questionnaire (WellBQ); CDC: Atlanta, GA, USA, 2021. [Google Scholar]
- Scott, S.B.; Sliwinski, M.J.; Zawadzki, M.; Stawski, R.S.; Kim, J.; Marcusson-Clavertz, D.; Lanza, S.T.; Conroy, D.E.; Buxton, O.; Almeida, D.M.; et al. A Coordinated Analysis of Variance in Affect in Daily Life. Assessment 2020, 27, 1683–1698. [Google Scholar] [CrossRef]
- Crawford, J.R.; Henry, J.D. The Positive and Negative Affect Schedule (PANAS): Construct validity, measurement properties and normative data in a large non-clinical sample. Br. J. Clin. Psychol. 2004, 43, 245–265. [Google Scholar] [CrossRef]
- Broderick, J.E.; Schwartz, J.E.; Schneider, S.; Stone, A.A. Can end-of-day reports replace momentary assessment of pain and fatigue? J. Pain 2009, 10, 274–281. [Google Scholar] [CrossRef] [Green Version]
- Mendoza, T.R.; Wang, X.S.; Cleeland, C.S.; Morrissey, M.; Johnson, B.A.; Wendt, J.K.; Huber, S.L. The rapid assessment of fatigue severity in cancer patients: Use of the Brief Fatigue Inventory. Cancer 1999, 85, 1186–1196. [Google Scholar] [CrossRef]
- Daut, R.L.; Cleeland, C.S. The prevalence and severity of pain in cancer. Cancer 1982, 50, 1913–1918. [Google Scholar] [CrossRef]
- Dunton, G.F.; Ke, W.; Dzubur, E.; O’Connor, S.G.; Lopez, N.V.; Margolin, G. Within-Subject Effects of Stress on Weight-Related Parenting Practices in Mothers: An Ecological Momentary Assessment Study. Ann. Behav. Med. 2018, 53, 415–425. [Google Scholar] [CrossRef] [PubMed]
- Sonnenberg, B.; Riediger, M.; Wrzus, C.; Wagner, G.G. Measuring Time Use in Surveys—How Valid are Time Use Questions in Surveys? Concordance of Survey and Experience Sampling Measures. SSRN J. 2012, 41, 1037–1052. Available online: http://www.ssrn.com/abstract=1895307 (accessed on 19 December 2020). [CrossRef] [Green Version]
- Bates, D.; Mächler, M.; Bolker, B.; Walker, S. Fitting Linear Mixed-Effects Models Using lme4. J. Stat. Softw. 2015, 67, 1–48. [Google Scholar] [CrossRef]
- Bell, B. 433-2013: A Multilevel Model Primer Using SAS® PROC MIXED; SAS Institute: Cary, NC, USA, 2013; p. 19. [Google Scholar]
- Luke, S.G. Evaluating significance in linear mixed-effects models in R. Behav. Res. 2017, 49, 1494–1502. [Google Scholar] [CrossRef] [PubMed]
- Appiah, A.K. Bootstrap Linear Mixed-Effects Models Using SAS® Procedures; SAS Institute: Cary, NC, USA, 2018; p. 17. [Google Scholar]
- Bakdash, J.Z.; Marusich, L.R. Repeated Measures Correlation. Front. Psychol. 2017, 8, 456. [Google Scholar] [CrossRef] [Green Version]
- Merz, E.L.; Roesch, S.C. Modeling trait and state variation using multilevel factor analysis with PANAS daily diary data. J. Res. Pers. 2011, 45, 2–9. [Google Scholar] [CrossRef] [Green Version]
- Roesch, S.C.; Aldridge, A.A.; Stocking, S.N.; Villodas, F.; Leung, Q.; Bartley, C.E.; Black, L.J. Multilevel Factor Analysis and Structural Equation Modeling of Daily Diary Coping Data: Modeling Trait and State Variation. Multivar. Behav. Res. 2010, 45, 767–789. [Google Scholar] [CrossRef]
- Cohen, J. Statistical Power Analysis for the Behavioral Sciences; Academic Press: Cambridge, MA, USA, 2013. [Google Scholar]
- Rook, J.W.; Zijlstra, F.R.H. The contribution of various types of activities to recovery. Eur. J. Work Organ. Psychol. 2006, 15, 218–240. [Google Scholar] [CrossRef]
- Abma, I.L.; Rovers, M.; van der Wees, P.J. Appraising convergent validity of patient-reported outcome measures in systematic reviews: Constructing hypotheses and interpreting outcomes. BMC Res Notes 2016, 9, 226. Available online: https://0-www-ncbi-nlm-nih-gov.brum.beds.ac.uk/pmc/articles/PMC4837507/ (accessed on 22 March 2021). [CrossRef] [Green Version]
- Terwee, C.B.; Bot, S.D.M.; de Boer, M.R.; van der Windt, D.A.W.M.; Knol, D.L.; Dekker, J.; Bouter, L.M.; de Vet, H.C.W. Quality criteria were proposed for measurement properties of health status questionnaires. J. Clin. Epidemiol. 2007, 60, 34–42. [Google Scholar] [CrossRef] [PubMed] [Green Version]
- Engelen, L.; Chau, J.Y.; Burks-Young, S.; Bauman, A. Application of ecological momentary assessment in workplace health evaluation. Health Promot. J. Aust. 2016, 27, 259–263. [Google Scholar] [CrossRef] [PubMed]
- Lorig, K.R.; Sobel, D.S.; Stewart, A.L.; Brown, B.W.; Bandura, A.; Ritter, P.; Gonzalez, V.M.; Laurent, D.D.; Holman, H.R. Evidence Suggesting That a Chronic Disease Self-Management Program Can Improve Health Status While Reducing Hospitalization: A Randomized Trial. Med. Care 1999, 37, 5–14. [Google Scholar] [CrossRef]
- Dixon, A.; Hibbard, J.; Tusler, M. How do People with Different Levels of Activation Self-Manage their Chronic Conditions? Patient Patient-Cent. Outcome Res. 2009, 2, 257–268. [Google Scholar] [CrossRef] [PubMed]
- Devins, G.M. Using the Illness Intrusiveness Ratings Scale to understand health-related quality of life in chronic disease. J. Psychosom. Res. 2010, 68, 591–602. [Google Scholar] [CrossRef]
- Keles, H.; Ekici, A.; Ekici, M.; Bulcun, E.; Altinkaya, V. Effect of chronic diseases and associated psychological distress on health-related quality of life. Intern. Med. J. 2007, 37, 6–11. [Google Scholar] [CrossRef]
- Schokker, M.C.; Links, T.P.; Luttik, M.L.; Hagedoorn, M. The association between regulatory focus and distress in patients with a chronic disease: The moderating role of partner support. Br. J. Health Psychol. 2010, 15, 63–78. [Google Scholar] [CrossRef]
- Raghupathi, W.; Raghupathi, V. An Empirical Study of Chronic Diseases in the United States: A Visual Analytics Approach to Public Health. Int. J. Environ. Res. Public Health 2018, 15, 431. Available online: https://0-www-ncbi-nlm-nih-gov.brum.beds.ac.uk/pmc/articles/PMC5876976/ (accessed on 23 March 2021).
- Xu, G.; Liu, B.; Sun, Y.; Du, Y.; Snetselaar, L.G.; Hu, F.B.; Bao, W. Prevalence of diagnosed type 1 and type 2 diabetes among US adults in 2016 and 2017: Population-based study. BMJ 2018, 362, k1497. [Google Scholar] [CrossRef] [Green Version]
- Davies, M.J.; Gagliardino, J.J.; Gray, L.J.; Khunti, K.; Mohan, V.; Hughes, R. Real-world factors affecting adherence to insulin therapy in patients with Type 1 or Type 2 diabetes mellitus: A systematic review. Diabet. Med. 2013, 30, 512–524. [Google Scholar] [CrossRef] [PubMed]
- Coccaro, E.F.; Lazarus, S.; Joseph, J.; Wyne, K.; Drossos, T.; Phillipson, L.; de Groot, M. Emotional Regulation and Diabetes Distress in Adults with Type 1 and Type 2 Diabetes. Diabetes Care 2021, 44, 20–25. [Google Scholar] [CrossRef] [PubMed]
- Trull, T.J.; Ebner-Priemer, U.W. Ambulatory Assessment in Psychopathology Research: A Review of Recommended Reporting Guidelines and Current Practices. J. Abnorm. Psychol. 2020, 129, 56–63. [Google Scholar] [CrossRef] [PubMed] [Green Version]
- Cranford, J.A.; Shrout, P.E.; Iida, M.; Rafaeli, E.; Yip, T.; Bolger, N. A Procedure for Evaluating Sensitivity to Within-Person Change: Can Mood Measures in Diary Studies Detect Change Reliably? Pers. Soc. Psychol Bull. 2006, 32, 917–929. [Google Scholar] [CrossRef] [Green Version]
- Reichenberger, J.; Pannicke, B.; Arend, A.-K.; Petrowski, K.; Blechert, J. Does stress eat away at you or make you eat? EMA measures of stress predict day to day food craving and perceived food intake as a function of trait stress-eating. Psychol. Health 2021, 36, 129–147. [Google Scholar] [CrossRef]
- Fisher, G.G.; Matthews, R.A.; Gibbons, A.M. Developing and investigating the use of single-item measures in organizational research. J. Occup. Health Psychol. 2016, 21, 3–23. [Google Scholar] [CrossRef]
- Cursio, J.F.; Mermelstein, R.J.; Hedeker, D. Latent trait shared-parameter mixed models for missing ecological momentary assessment data. Stat. Med. 2019, 38, 660–673. [Google Scholar] [CrossRef]


| Workload | Well-Being | ||||||
|---|---|---|---|---|---|---|---|
| Overall Task Load | Work Hours | Stress | Fatigue | Pain | Positive Affect | Negative Affect | |
| High workload activity frequency | + | + | + | + | + | − | + |
| Recovery activity frequency | − | − | − | − | − | + | − |
| Construct | Item(s) | Response Option(s) 1 | Time |
|---|---|---|---|
| Activity | |||
| Activity type | What were you doing right before starting this survey? |
| All survey times |
| Well-Being | |||
| Stress | How stressed are you right now? | 0 (Not at all stressed) to 100 (Extremely stressed) | All survey times |
| Fatigue | At this moment, how tired do you feel? | 0 (Not at all) to 100 (Extremely) | All survey times |
| Pain | At this moment, how much bodily pain do you have? | 0 (None) to 100 (Extreme pain) | All survey times |
| Positive affect | 4 items: Average of mood ratings for “happy”, “content”, “enthusiastic”, “excited” | For each mood, 0 (not at all) to 100 (extremely) | All survey times |
| Negative affect | 4 items: Average of mood ratings for “tense”, “upset”, “sad”, “disappointed” | For each mood, 0 (not at all) to 100 (extremely) | All survey times |
| Workload | |||
| Task Load | Average of 6 NASA-TLX items asking about mental demand, physical demand, time pressure, effort, performance satisfaction, and frustration for activities over the whole day. | 0 to 100 sliding scale for each item, and the overall task load score | End of day |
| Work hours | (If worked) About how many hours did you work? | Hours, whole number, 0 to 24 | End of day |
| Characteristic | n | Mean (SD) or Percent (%) |
|---|---|---|
| Age (years) | 45 | 40.1(12.7) |
| Gender | ||
| Male | 21 | 47% |
| Female | 24 | 53% |
| Ethnicity | ||
| White | 20 | 44% |
| Latino/x | 10 | 22% |
| African American | 7 | 16% |
| Multi-ethnic | 4 | 9% |
| Other | 4 | 9% |
| Employment status | ||
| Full-time | 35 | 78% |
| Part-time | 10 | 22% |
| Education | ||
| High school grad or less | 5 | 11% |
| Some college, no degree | 6 | 13% |
| Associate’s degree | 1 | 2% |
| Bachelor’s degree | 18 | 40% |
| Graduate degree | 15 | 33% |
| Annual household income | ||
| <$50,000 | 9 | 20% |
| $50,000–$99,999 | 10 | 23% |
| ≥$100,000 | 15 | 34% |
| Do not wish to provide | 8 | 18% |
| Do not know | 3 | 7% |
| Activity Type | Frequency (%) |
|---|---|
| Work/school activities | 866 (25.8%) |
| Relaxing/chilling | 739 (22.0%) |
| Sleeping/napping | 437 (13.0%) |
| Doing housework/errands | 396 (11.8%) |
| Caring for myself | 374 (11.2%) |
| Fun/play/leisure activities | 191 (5.7%) |
| Traveling | 160 (4.8%) |
| Socializing | 85 (2.5%) |
| Caring for others | 54 (1.6%) |
| Other | 50 (1.5%) |
| Overall Task Load | Work Hours | Stress | Fatigue | Pain | Positive Affect | Negative Affect | |
|---|---|---|---|---|---|---|---|
| High workload activity frequency | 0.42, (0.34, 0.49) | 0.31, (0.21, 0.4) | 0.34, (0.26, 0.41) | 0.11, (0.03, 0.2) | 0.02, (−0.07, 0.11) | −0.15, (−0.23, −0.07) | 0.21, (0.13, 0.29) |
| Recovery activity frequency | −0.37, (−0.44, −0.29) | −0.14, (−0.25, −0.04) | −0.34, (−0.41, −0.26) | −0.10, (−0.19, −0.01) | −0.06, (−0.14, 0.03) | 0.14, (0.06, 0.23) | −0.22, (−0.3, −0.13) |
| Unclassified | −0.08, (−0.16, 0.01) | −0.17, (−0.27, −0.07) | −0.02, (−0.11, 0.07) | −0.02, (−0.11, 0.06) | 0.04, (−0.04, 0.13) | 0.02, (−0.07, 0.1) | −0.01, (−0.1, 0.08) |
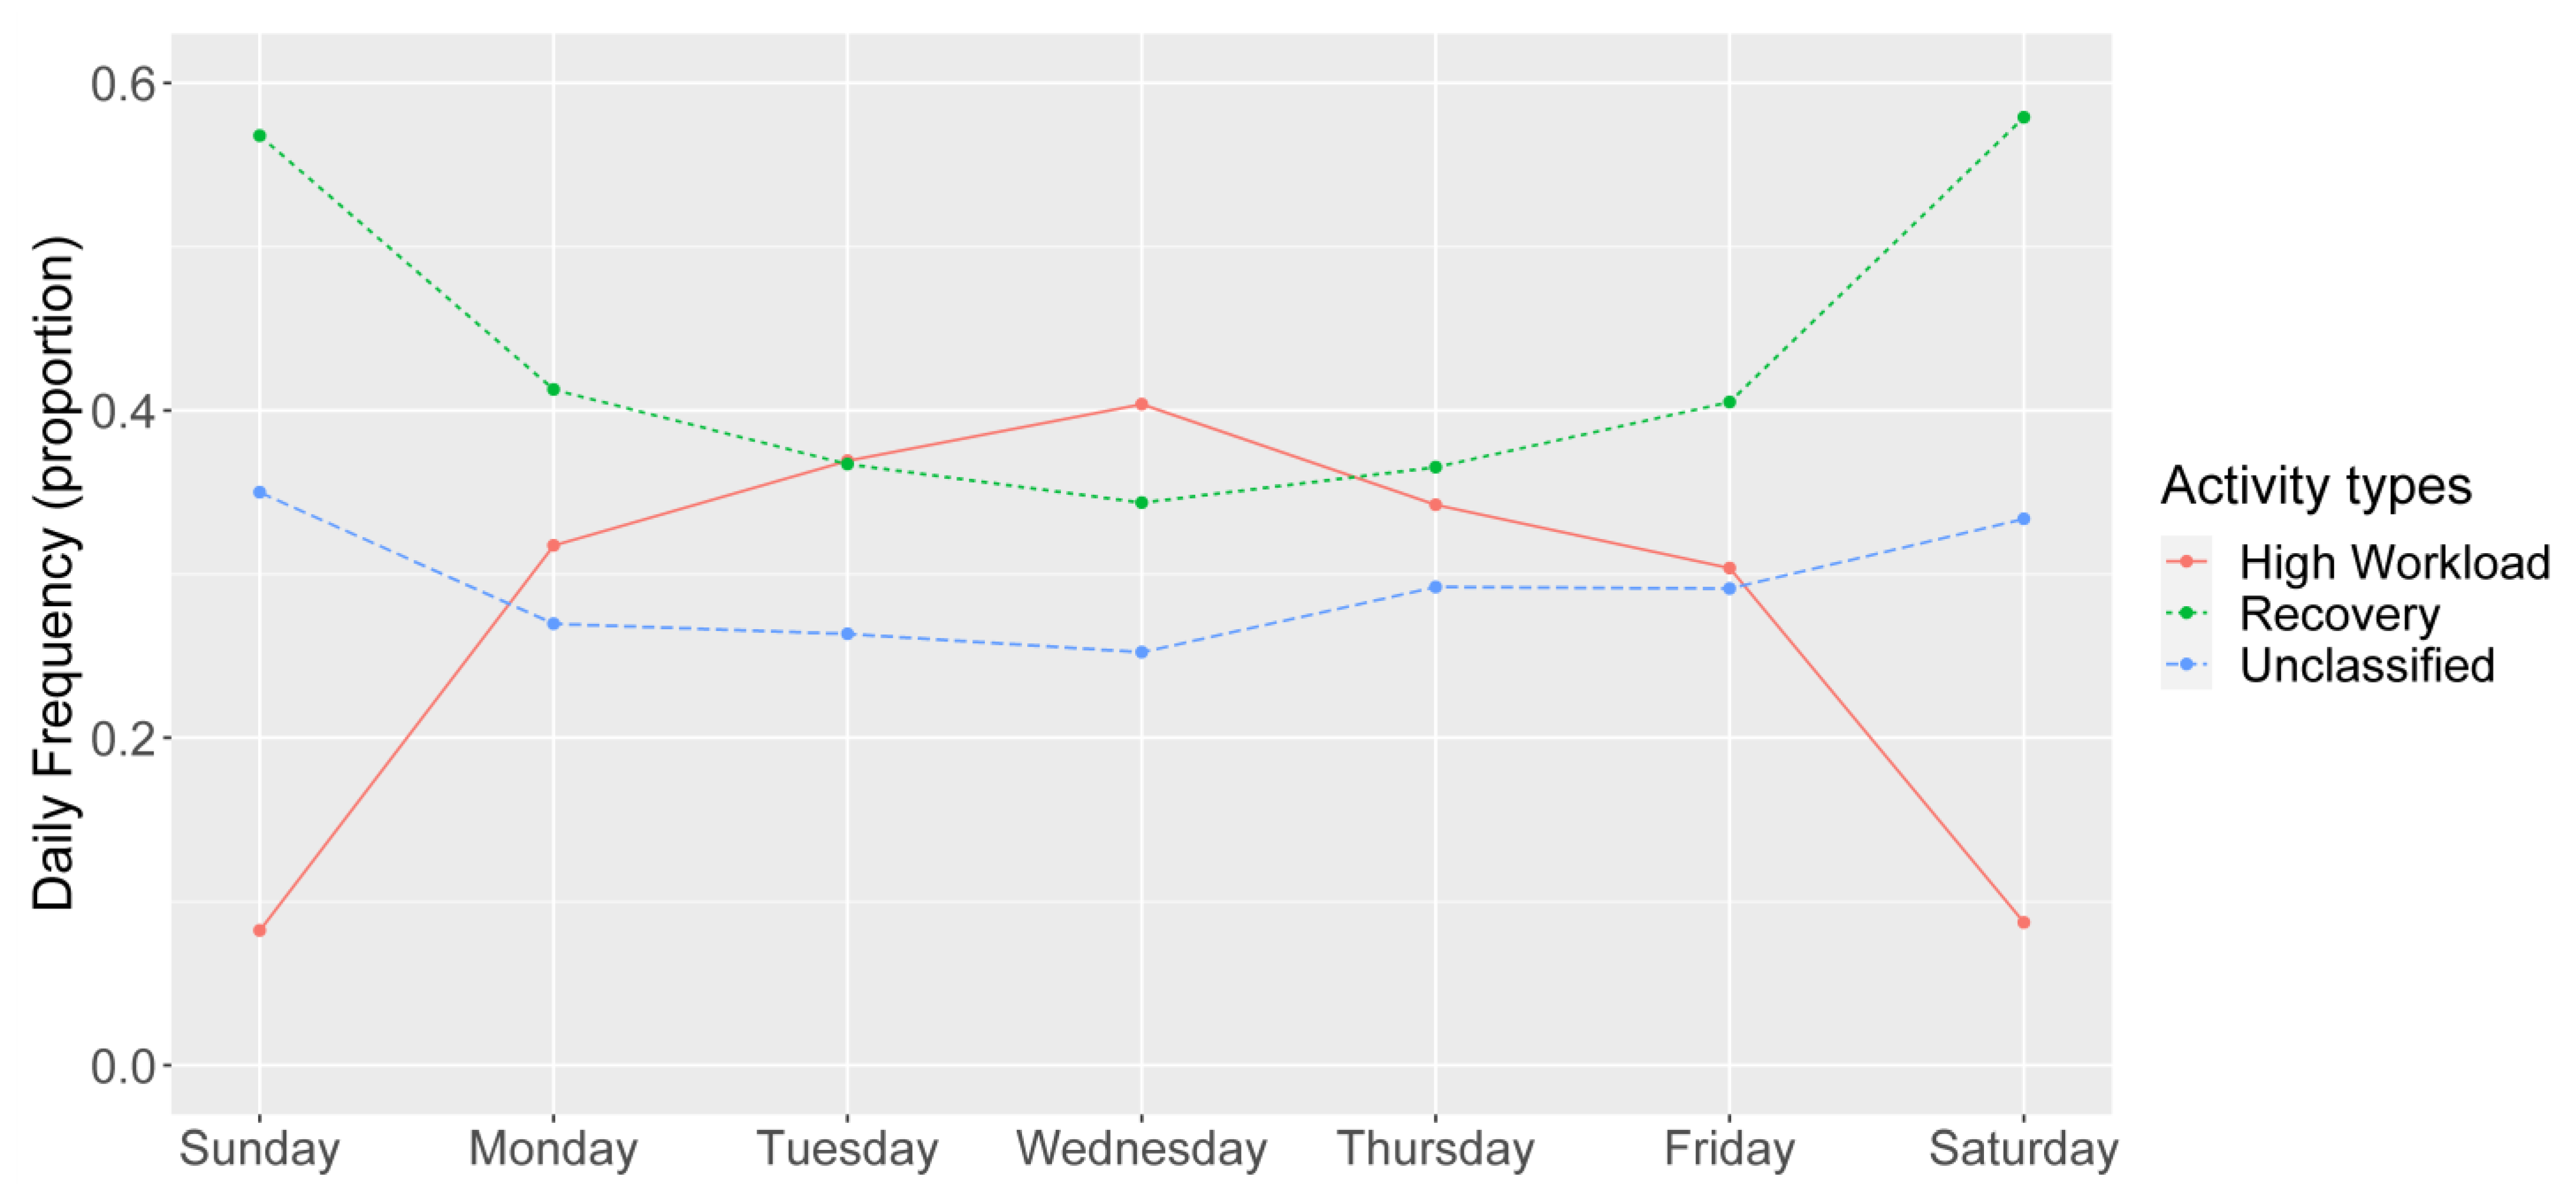
| Day | Number of Observations | High-Workload Frequency Beta, (95% CI) | Recovery Frequency Beta, (95% CI) | Unclassified Frequency Beta, (95% CI) |
|---|---|---|---|---|
| Sunday | 89 | Reference | Reference | Reference |
| Monday | 87 | 0.24, (0.18, 0.29) | −0.16, (−0.22, −0.1) | −0.08, (−0.14, −0.02) |
| Tuesday | 106 | 0.29, (0.23, 0.34) | −0.21, (−0.28, −0.15) | −0.07, (−0.13, −0.02) |
| Wednesday | 105 | 0.32, (0.26, 0.38) | −0.24, (−0.3, −0.18) | −0.09, (−0.14, −0.03) |
| Thursday | 107 | 0.26, (0.19, 0.31) | −0.2, (−0.26, −0.14) | −0.05, (−0.11, 0.01) |
| Friday | 104 | 0.22, (0.16, 0.28) | −0.17, (−0.22, −0.11) | −0.05, (−0.11, 0.00) |
| Saturday | 78 | 0.00 (−0.06, 0.06) | 0.01, (−0.05, 0.08) | −0.01, (−0.07, 0.05) |
Publisher’s Note: MDPI stays neutral with regard to jurisdictional claims in published maps and institutional affiliations. |
© 2021 by the authors. Licensee MDPI, Basel, Switzerland. This article is an open access article distributed under the terms and conditions of the Creative Commons Attribution (CC BY) license (https://creativecommons.org/licenses/by/4.0/).
Share and Cite
Hernandez, R.; Pyatak, E.A.; Vigen, C.L.P.; Jin, H.; Schneider, S.; Spruijt-Metz, D.; Roll, S.C. Understanding Worker Well-Being Relative to High-Workload and Recovery Activities across a Whole Day: Pilot Testing an Ecological Momentary Assessment Technique. Int. J. Environ. Res. Public Health 2021, 18, 10354. https://0-doi-org.brum.beds.ac.uk/10.3390/ijerph181910354
Hernandez R, Pyatak EA, Vigen CLP, Jin H, Schneider S, Spruijt-Metz D, Roll SC. Understanding Worker Well-Being Relative to High-Workload and Recovery Activities across a Whole Day: Pilot Testing an Ecological Momentary Assessment Technique. International Journal of Environmental Research and Public Health. 2021; 18(19):10354. https://0-doi-org.brum.beds.ac.uk/10.3390/ijerph181910354
Chicago/Turabian StyleHernandez, Raymond, Elizabeth A. Pyatak, Cheryl L. P. Vigen, Haomiao Jin, Stefan Schneider, Donna Spruijt-Metz, and Shawn C. Roll. 2021. "Understanding Worker Well-Being Relative to High-Workload and Recovery Activities across a Whole Day: Pilot Testing an Ecological Momentary Assessment Technique" International Journal of Environmental Research and Public Health 18, no. 19: 10354. https://0-doi-org.brum.beds.ac.uk/10.3390/ijerph181910354