
Effect of UVC and UVA Photocatalytic Processes on Tetracycline Removal Using CuS-Coated Magnetic Activated Carbon Nanocomposite: A Comparative Study


Abstract
:1. Introduction
2. Materials and Methods
2.1. Materials
2.2. The Procedure of MAC Production
Magnetization of the Precursor
2.3. Synthesis of Magnetic Activated Carbon (MAC)
2.4. Sedimentation of Copper Sulfide on MAC
2.5. Characteristics of Synthesized Nanocomposite
2.6. Experiments for Photocatalytic Removal of TC
2.7. Determination of Absorbent Surface (pHzpc)
2.8. Determination of Reaction Kinetics
2.9. Composite Recovery and Reuse Experiments
2.10. Conducting COD and TOC Experiments under Optimal Conditions
3. Results
3.1. Characteristics of Synthesized Nanocomposite
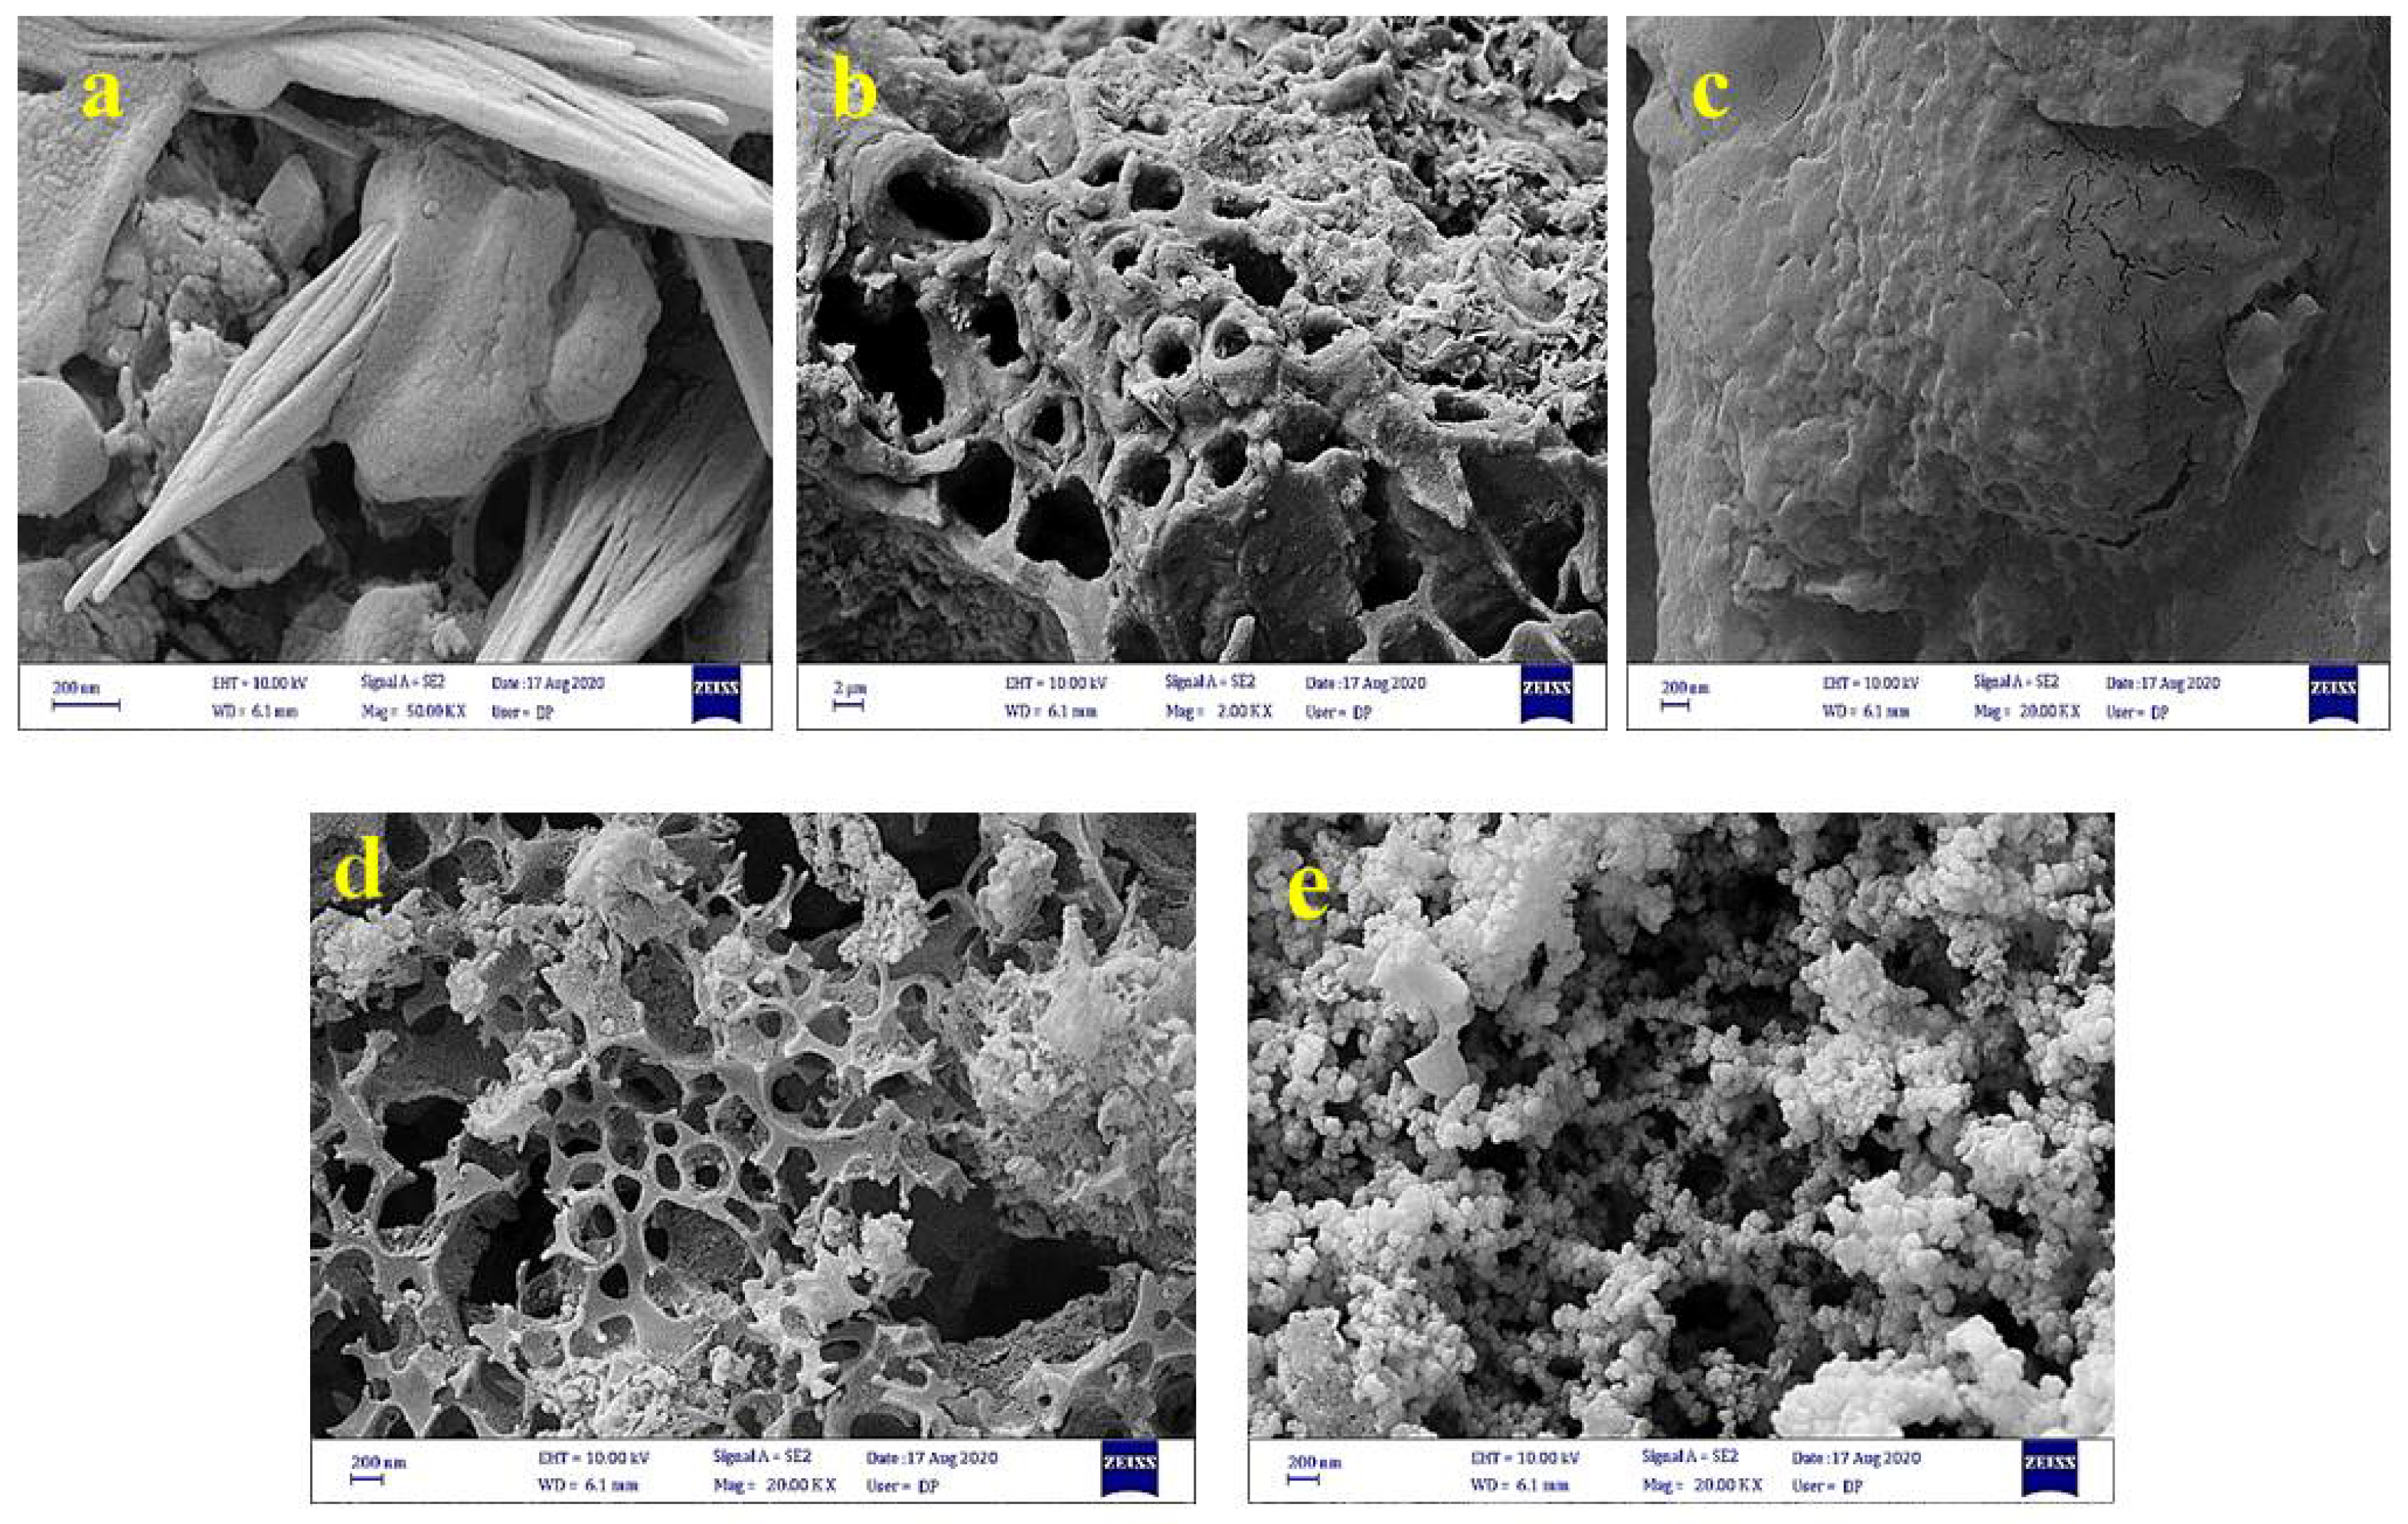
3.1.1. FESEM Analysis
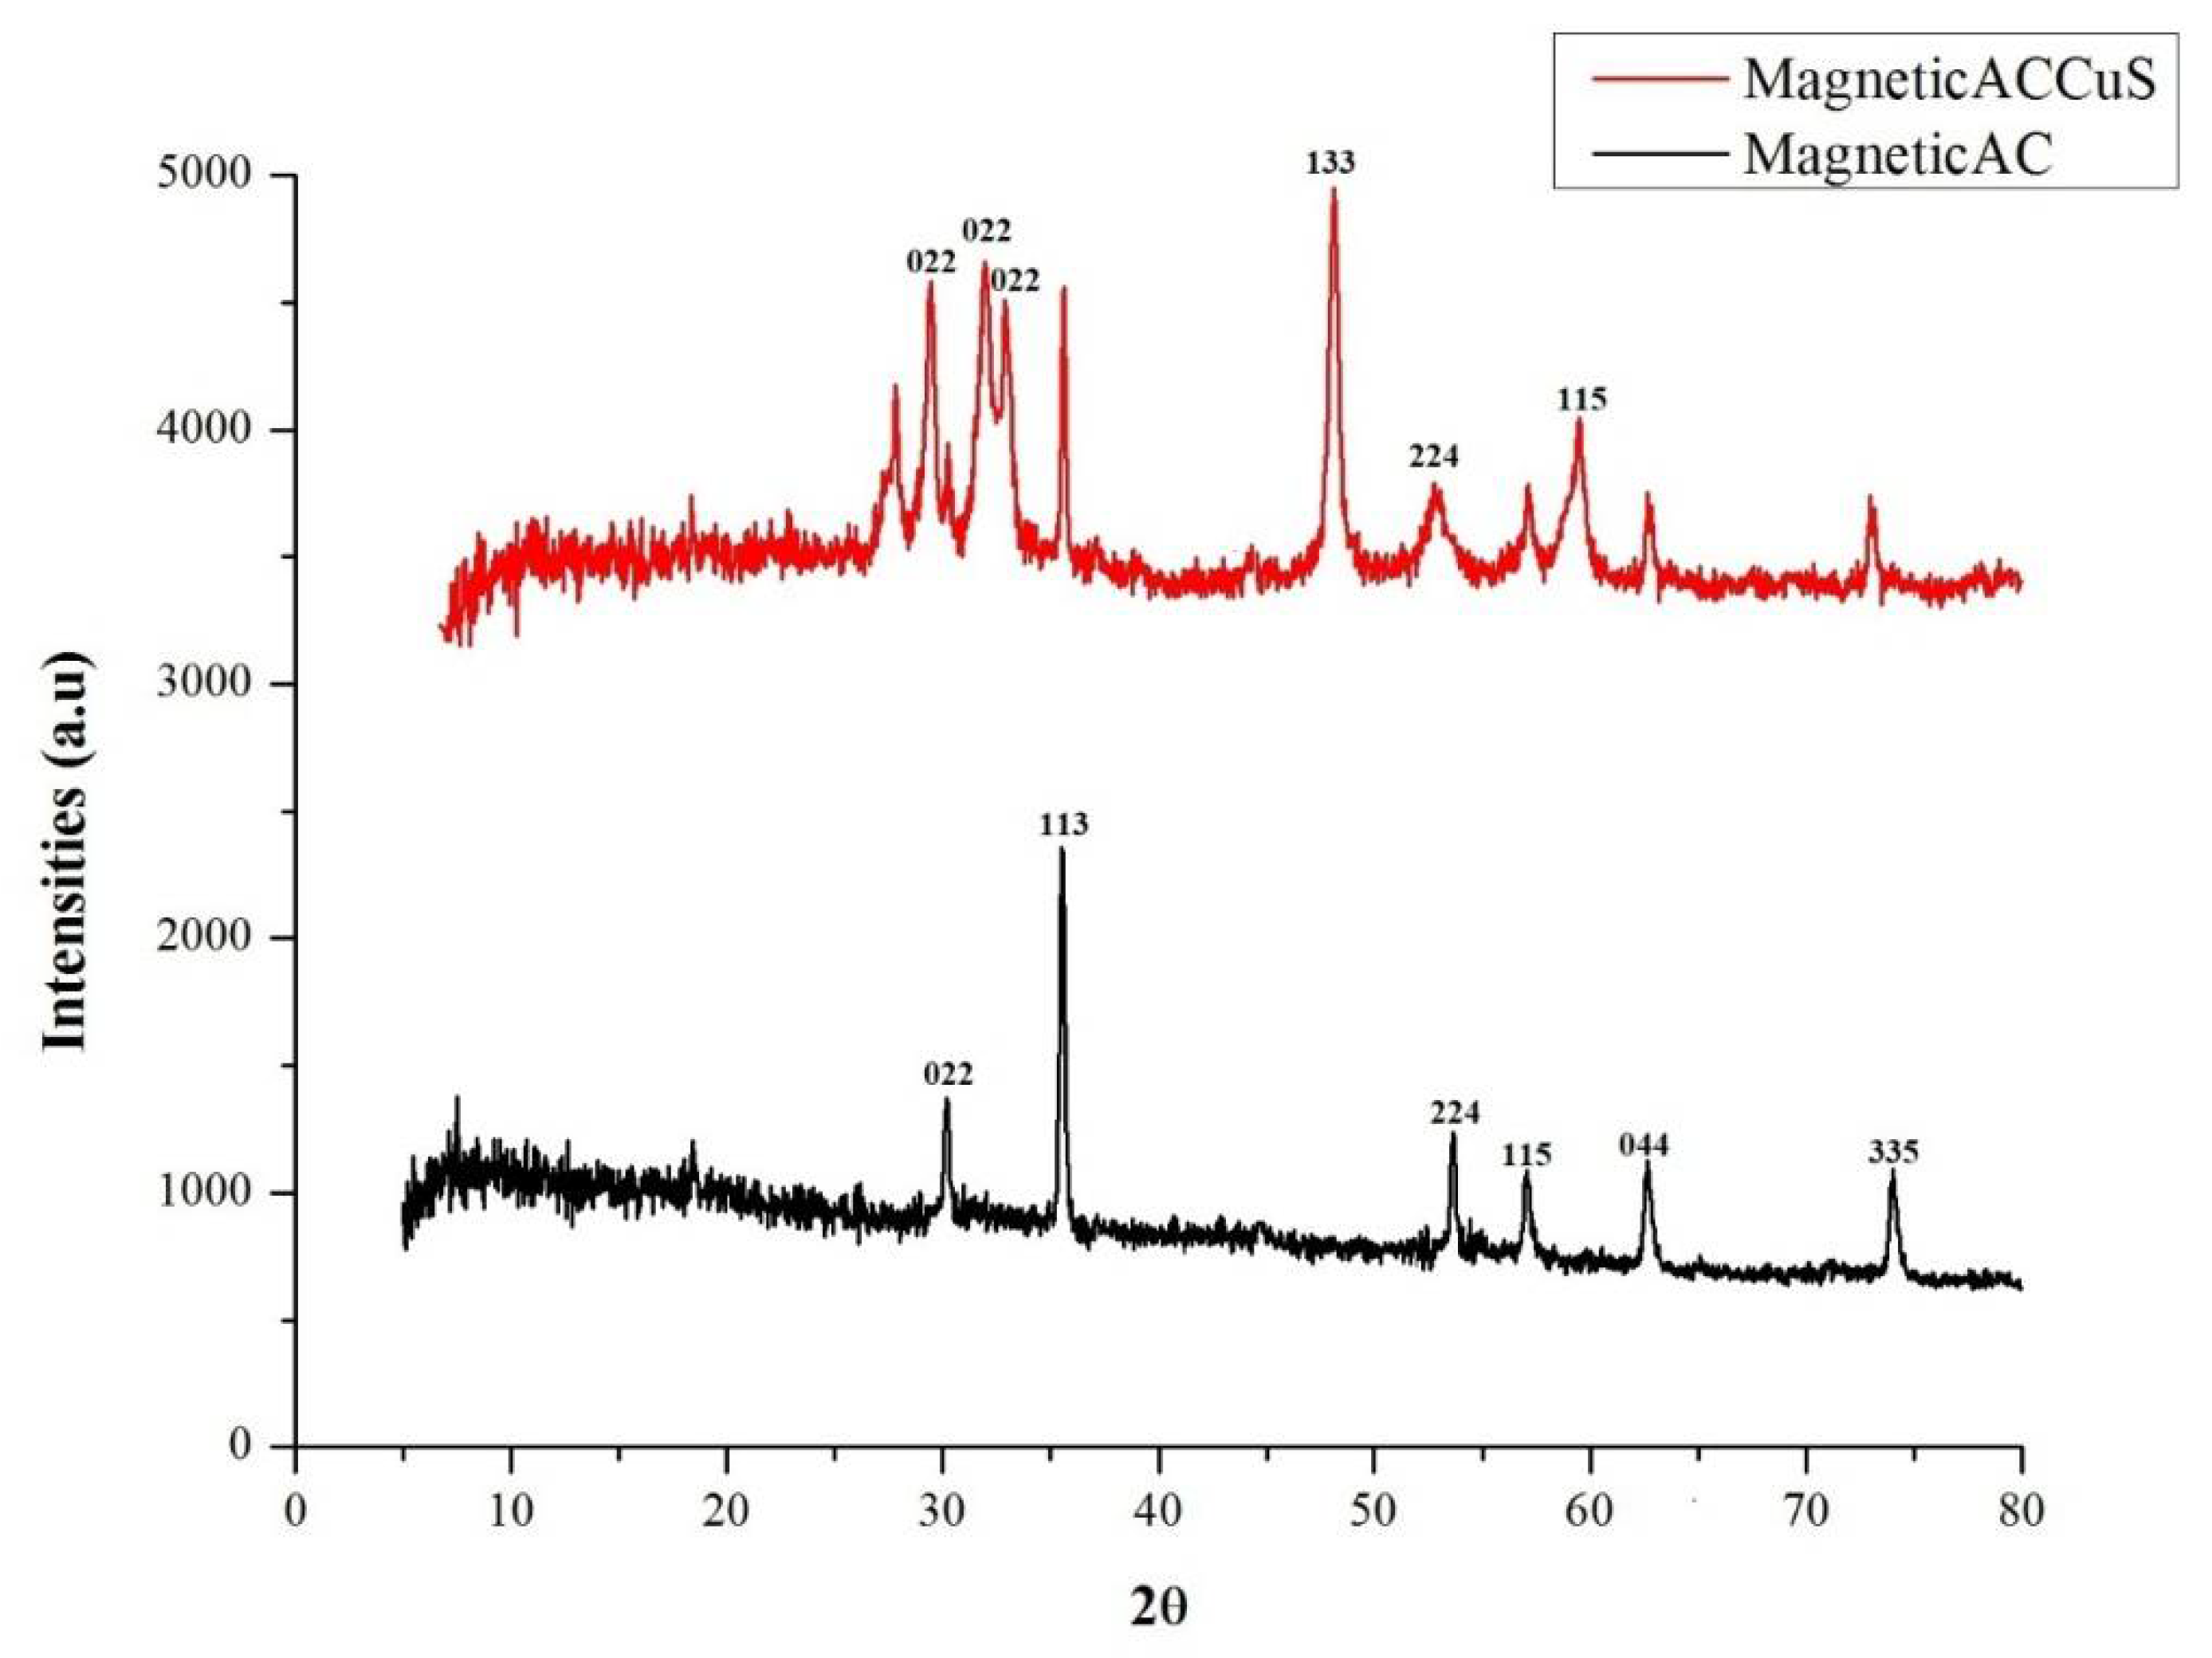
3.1.2. XRD Analysis
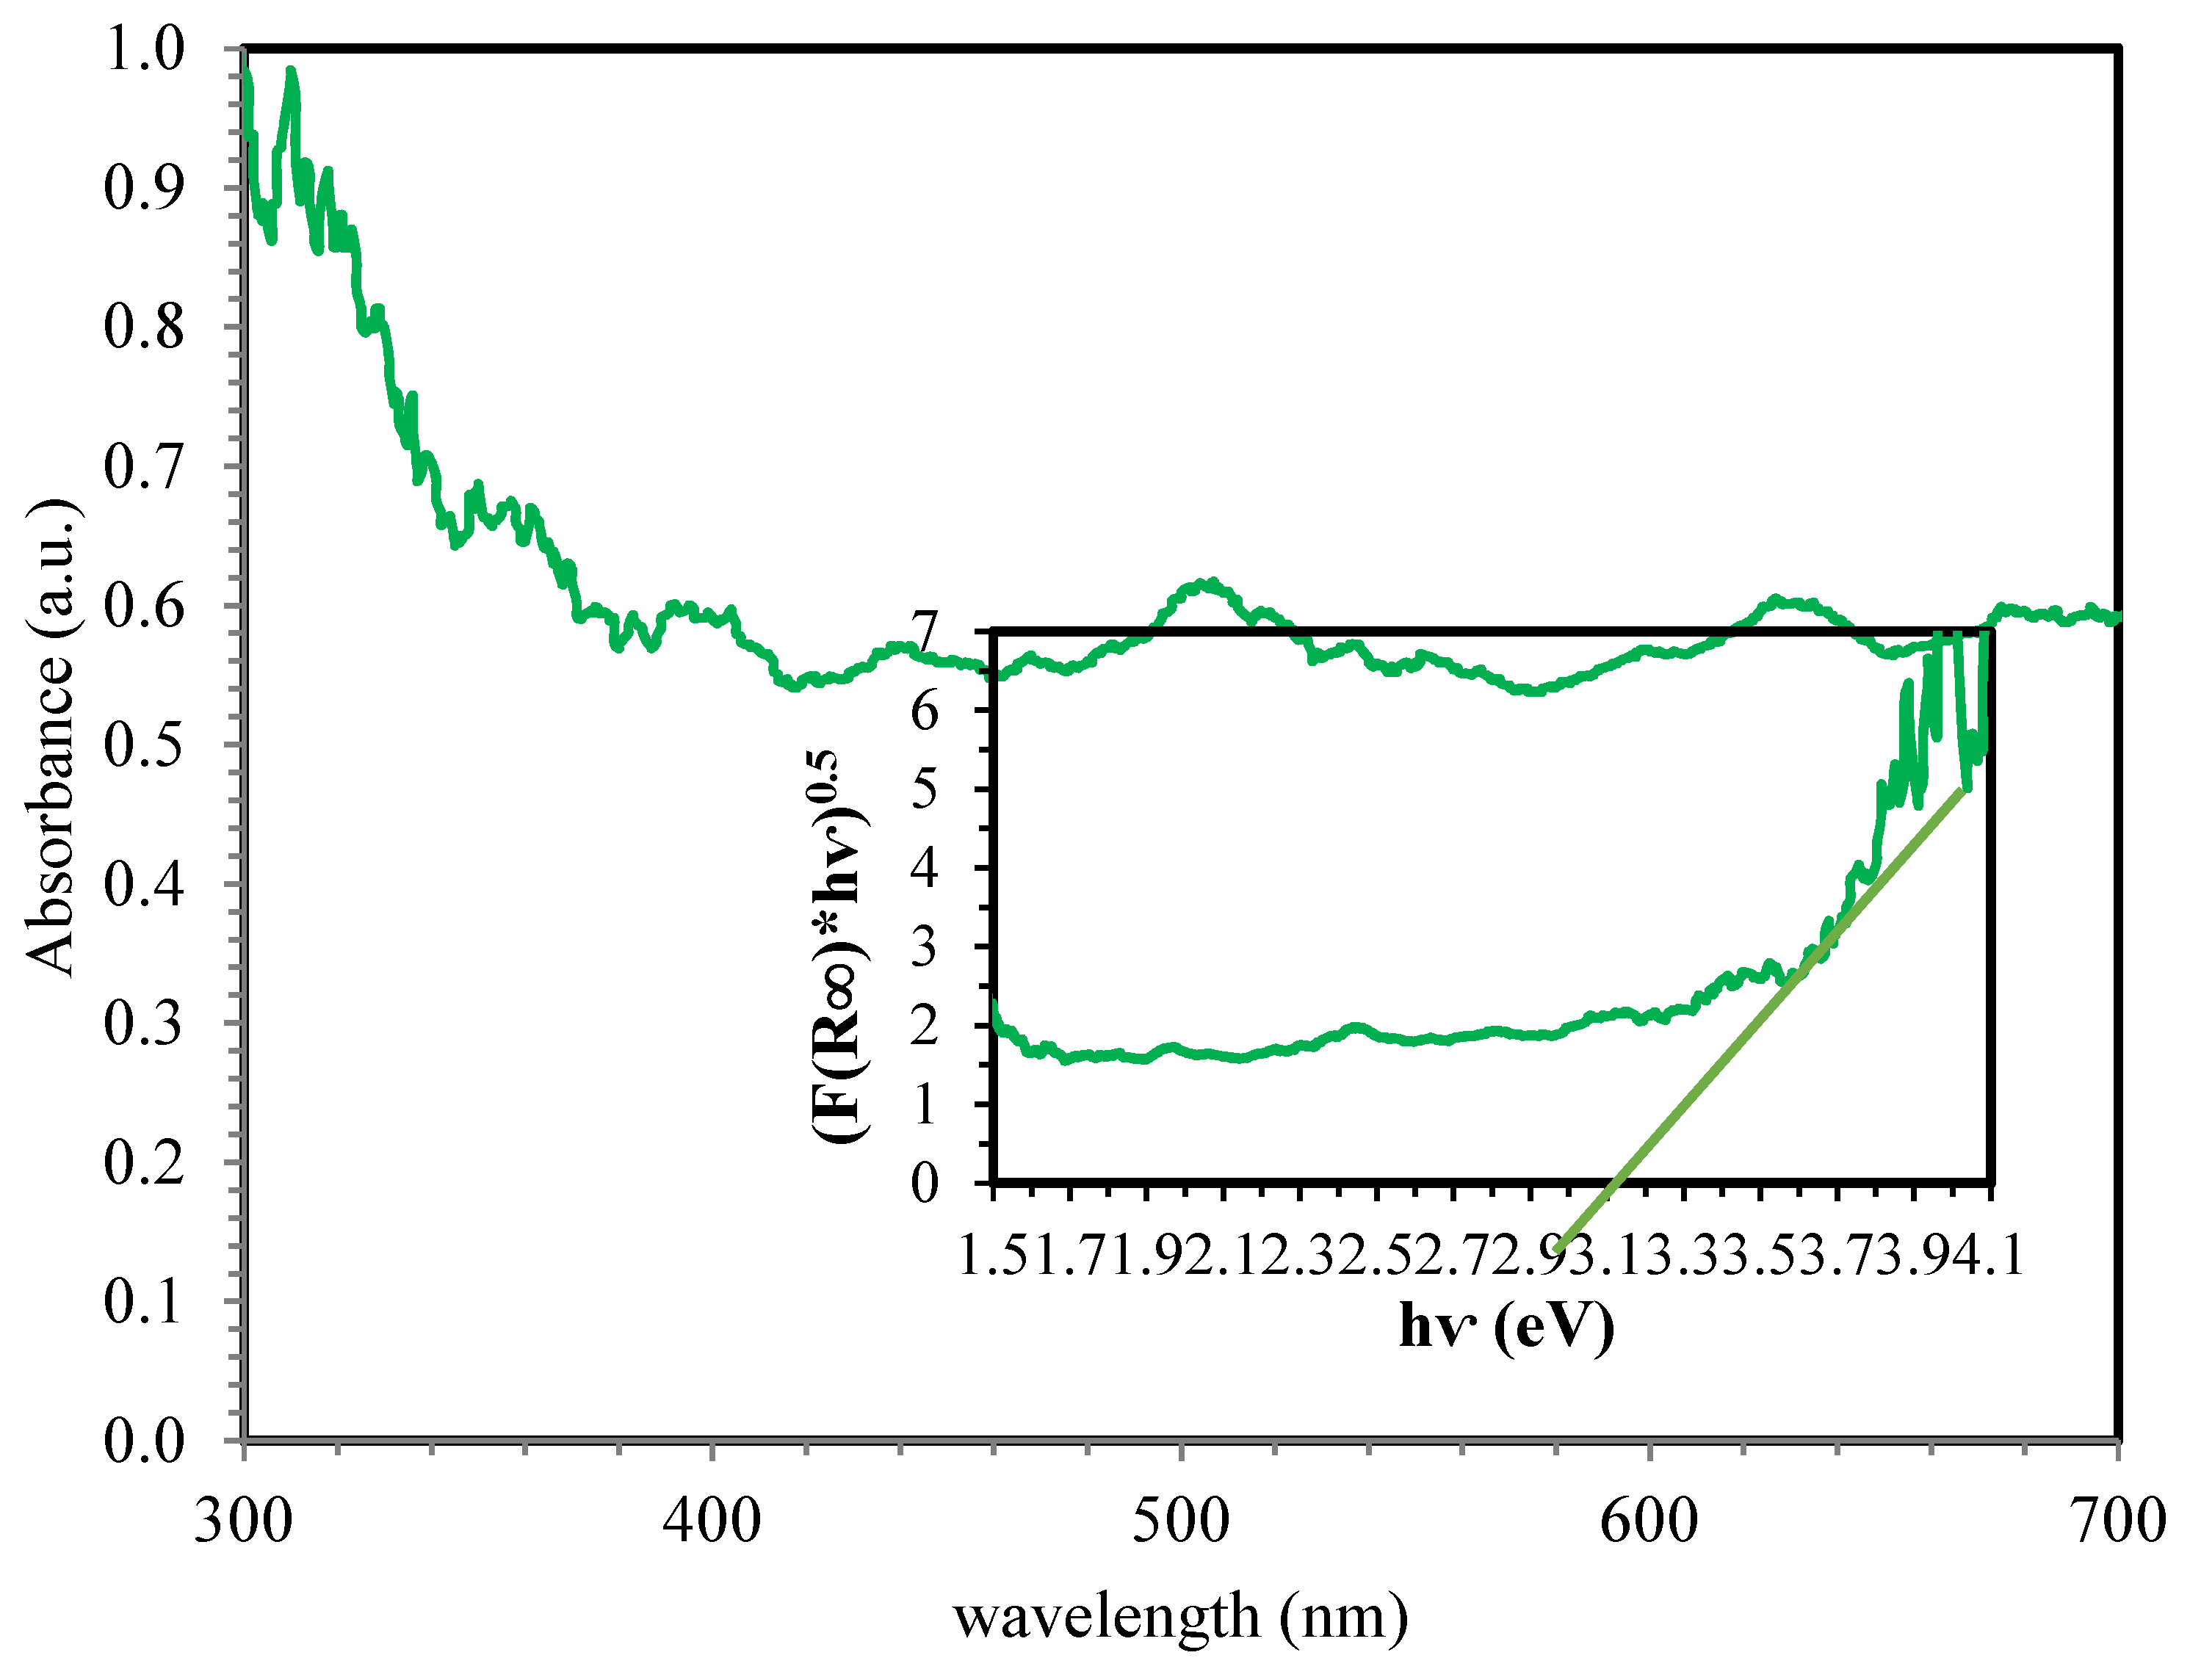
3.1.3. DRS Analysis
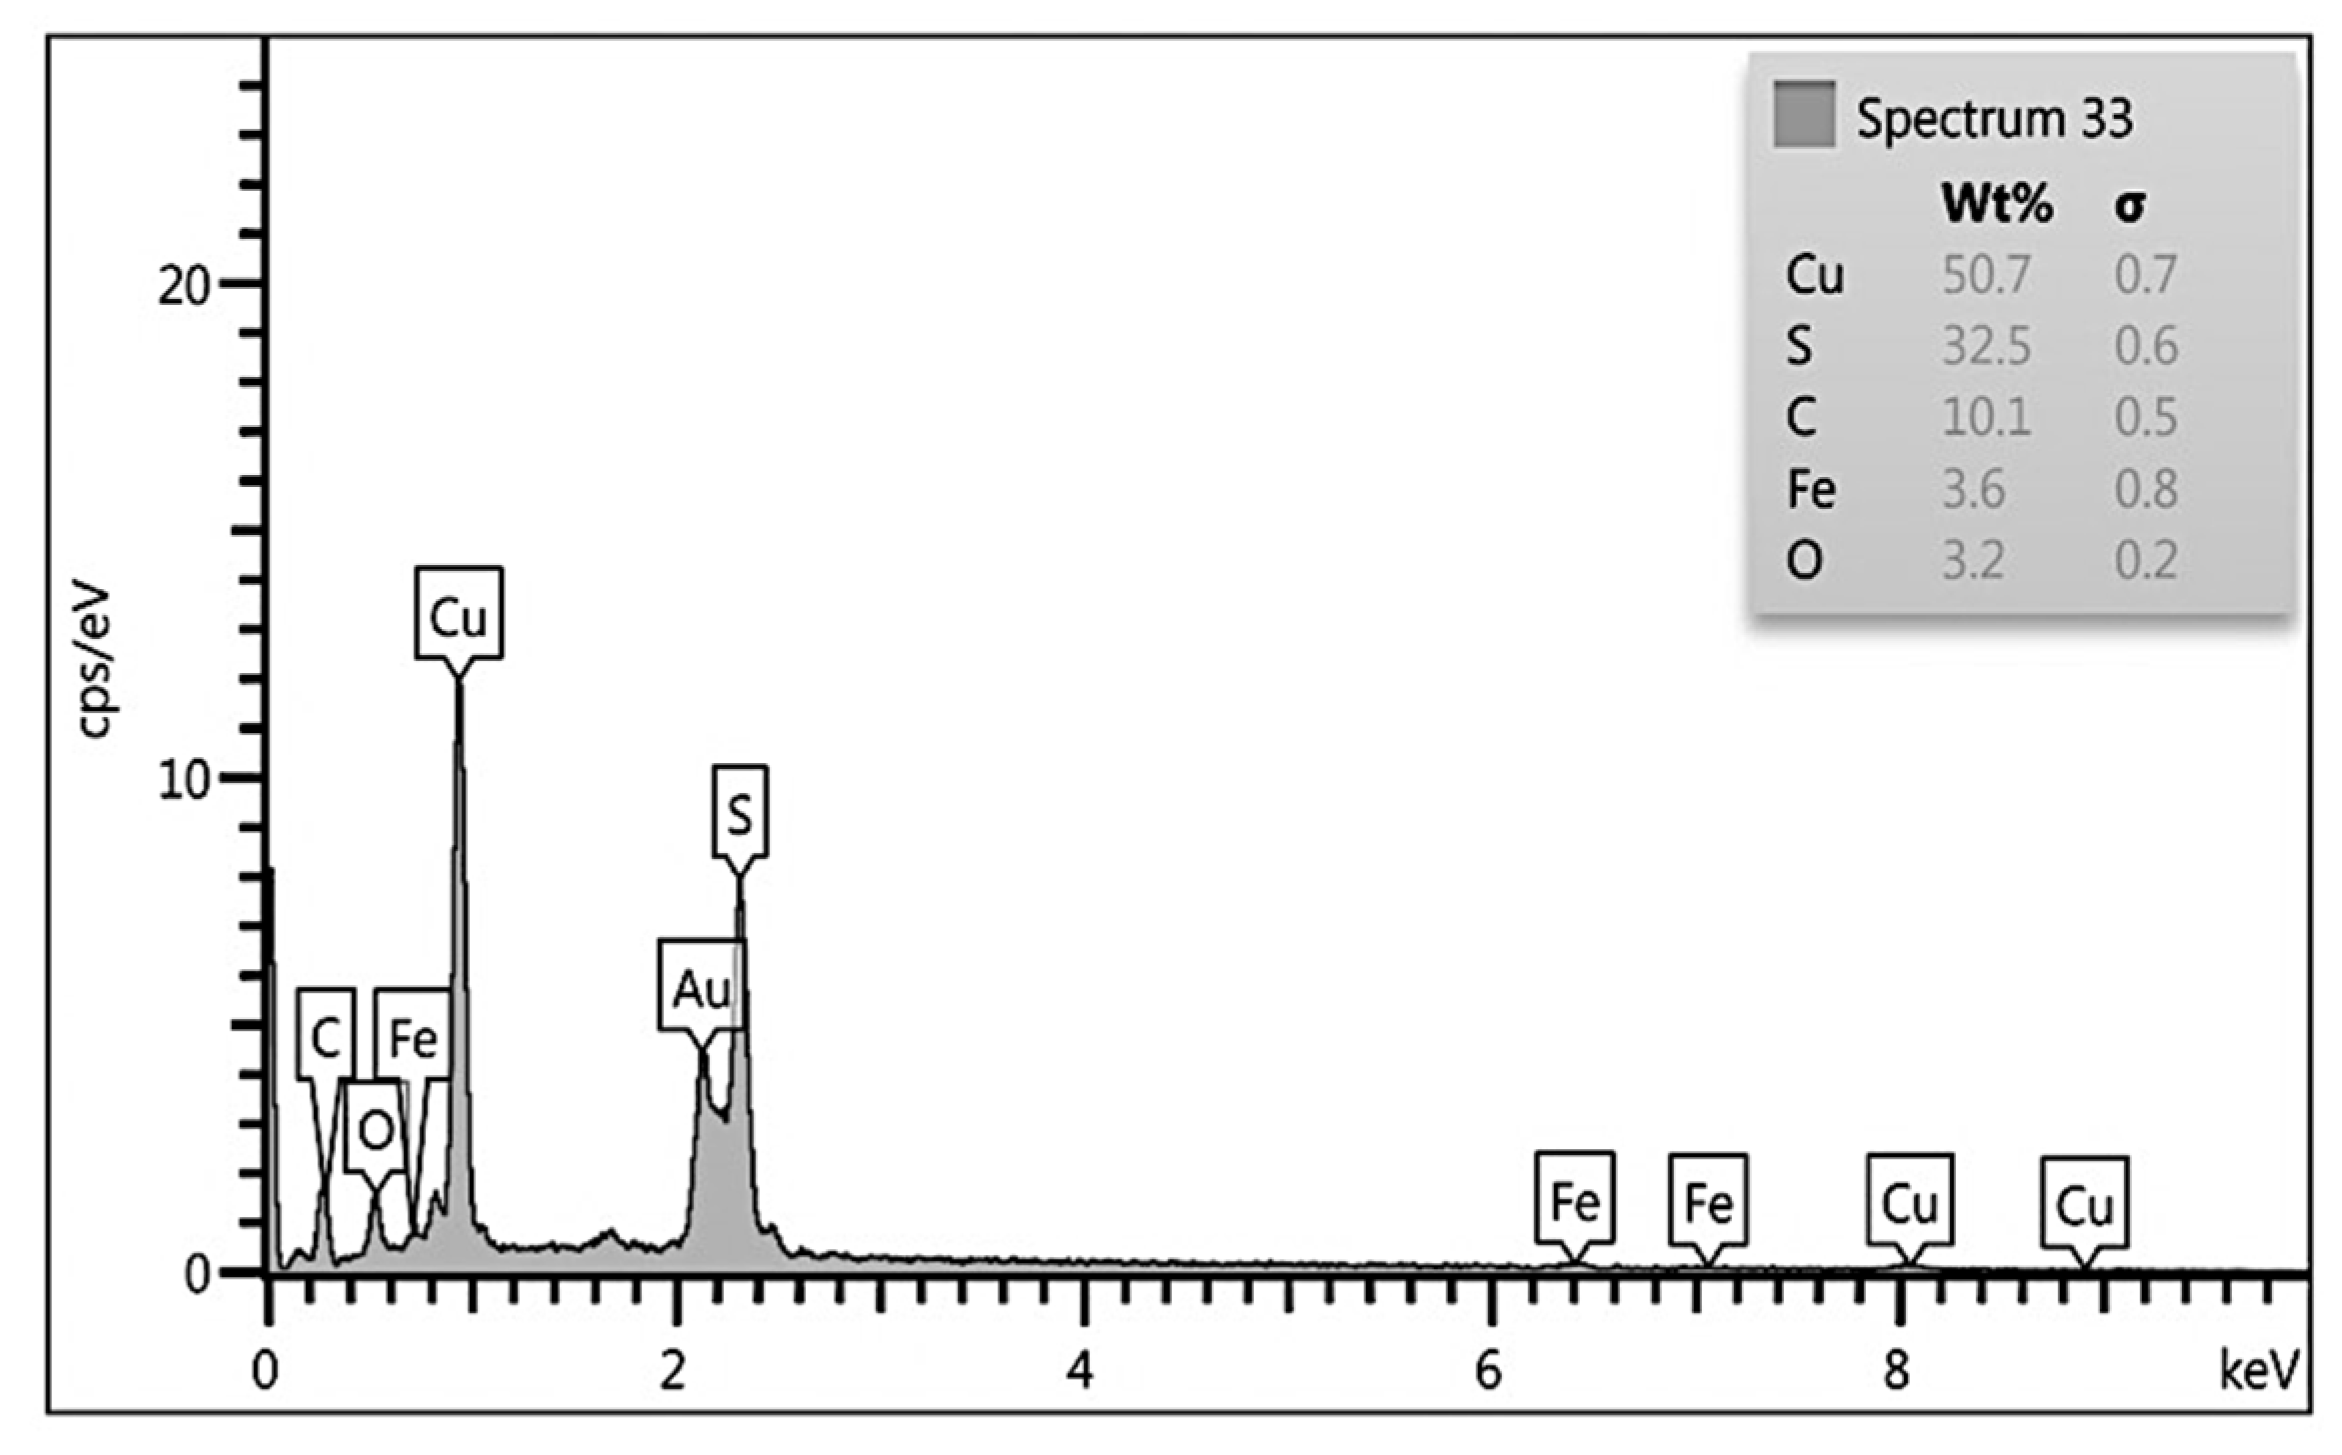
3.1.4. EDX Analysis
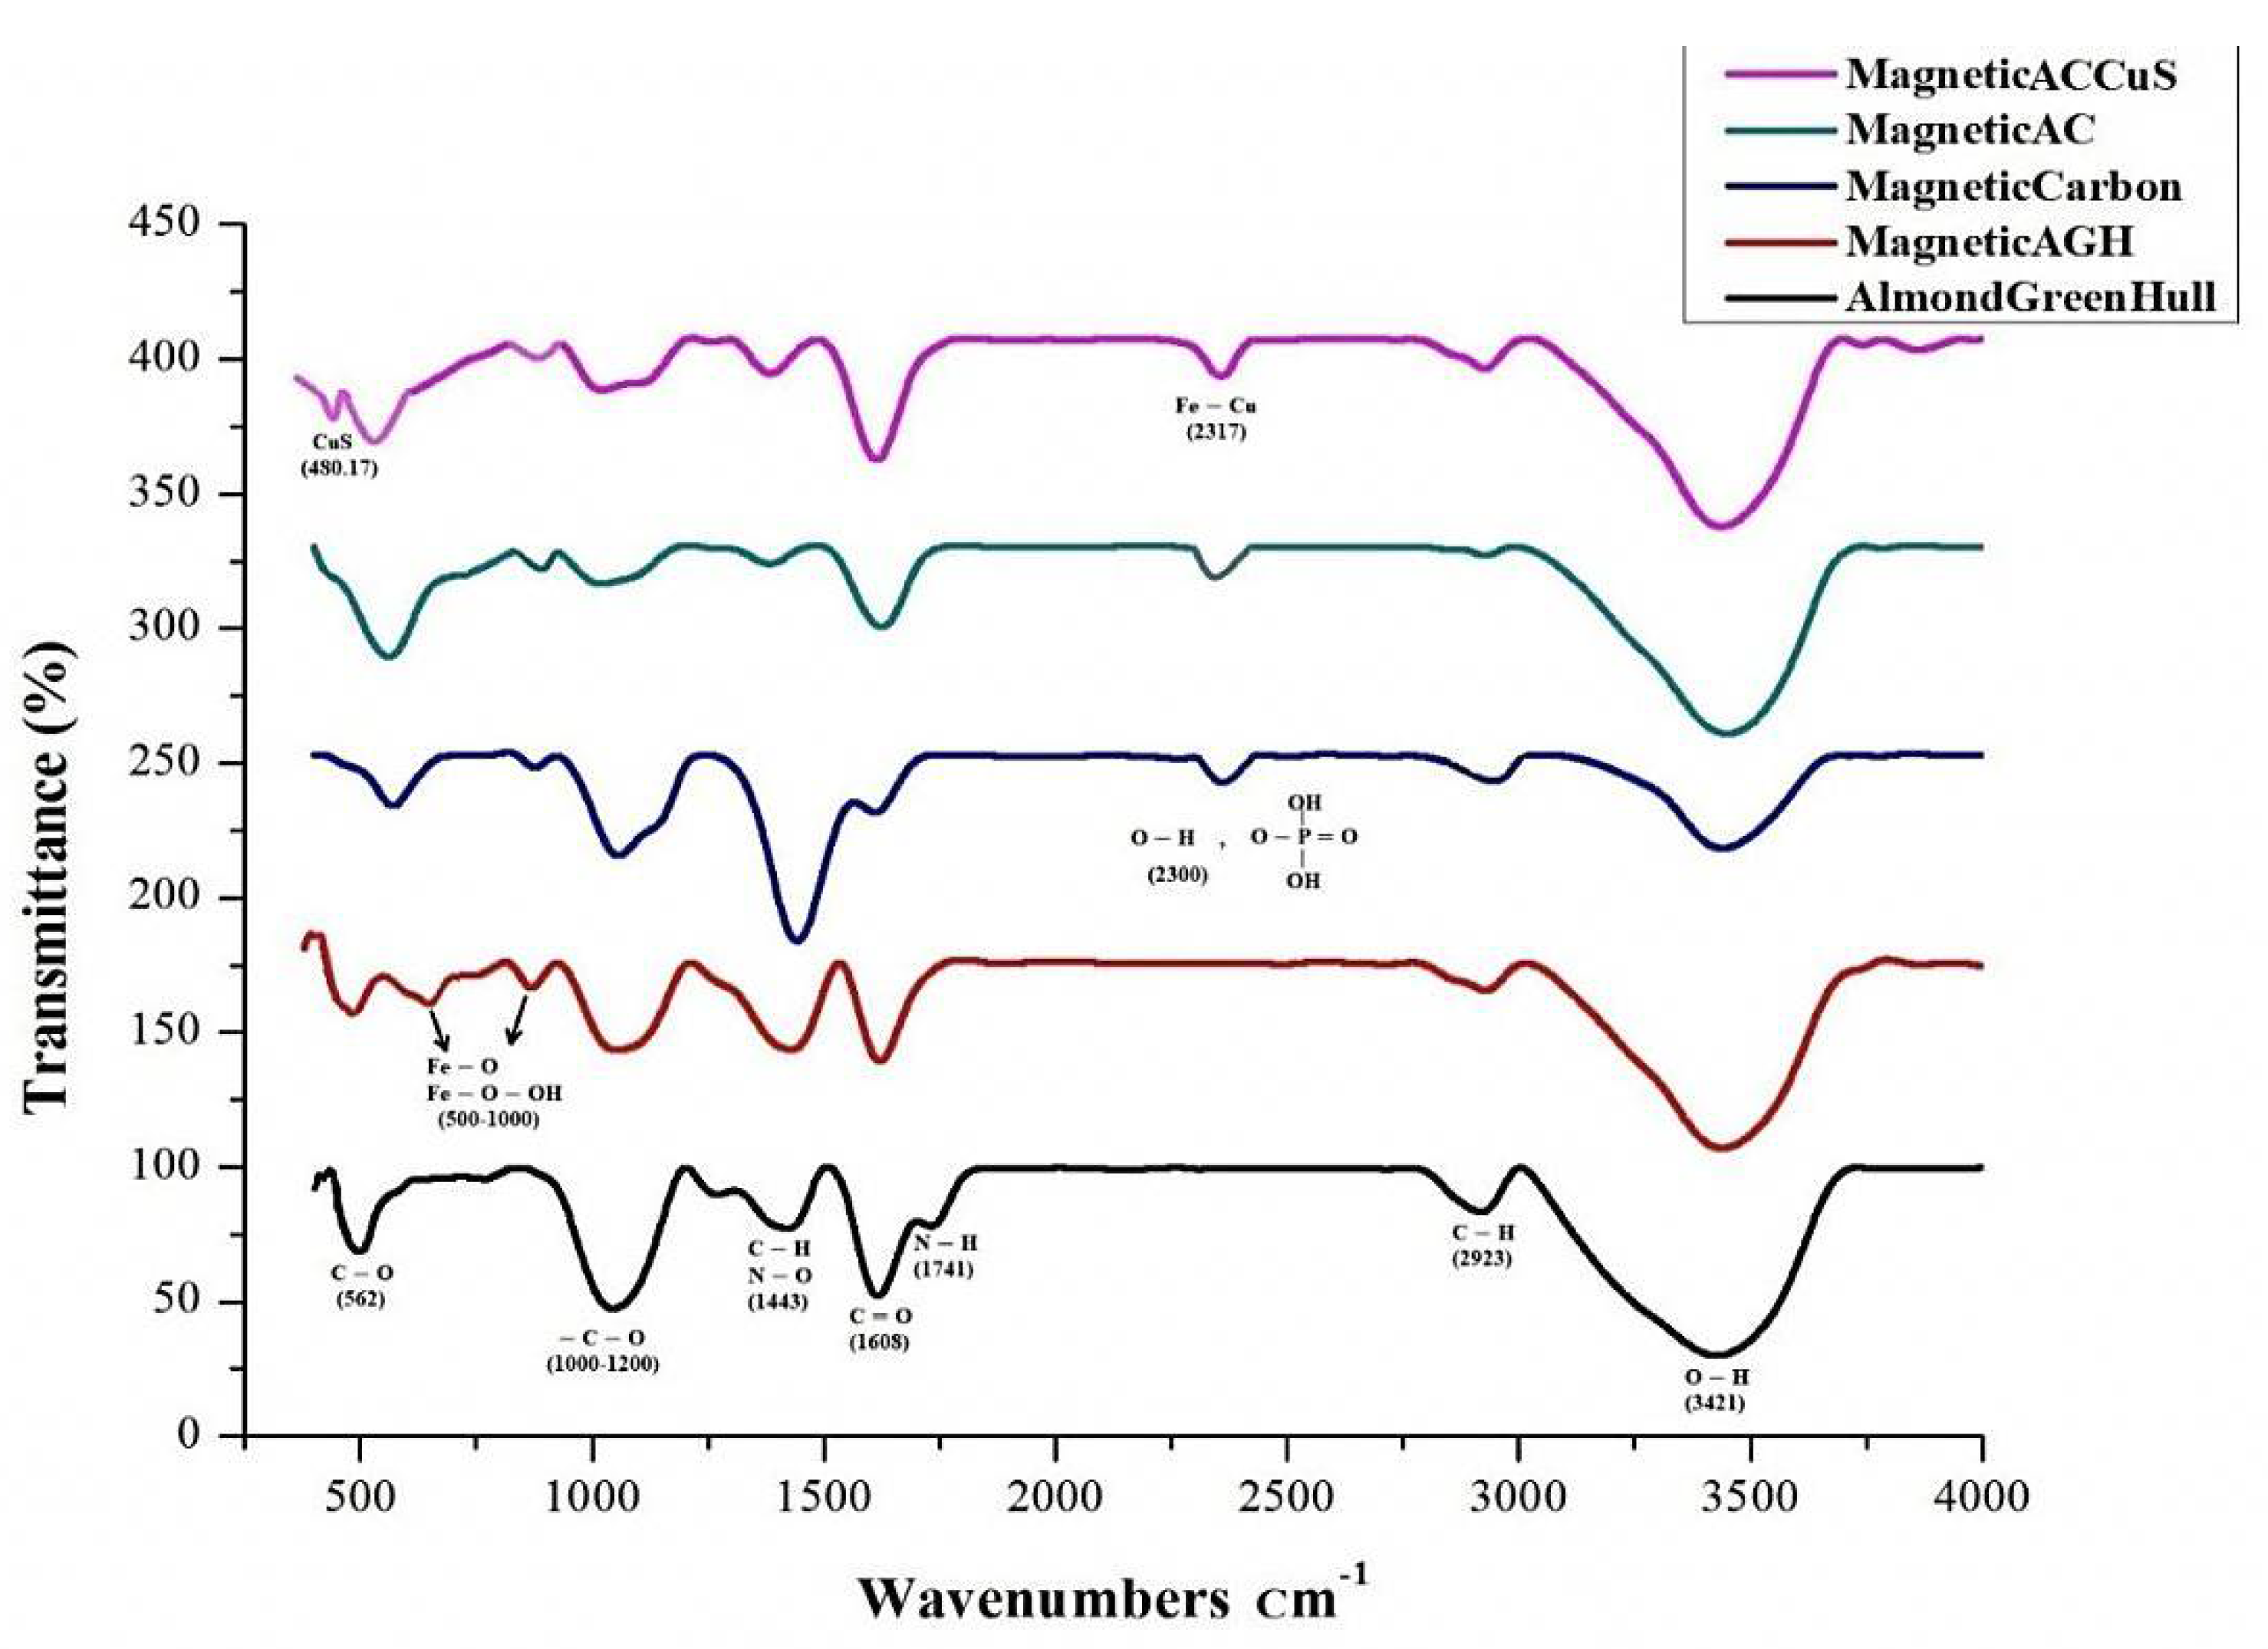
3.1.5. FTIR Analysis
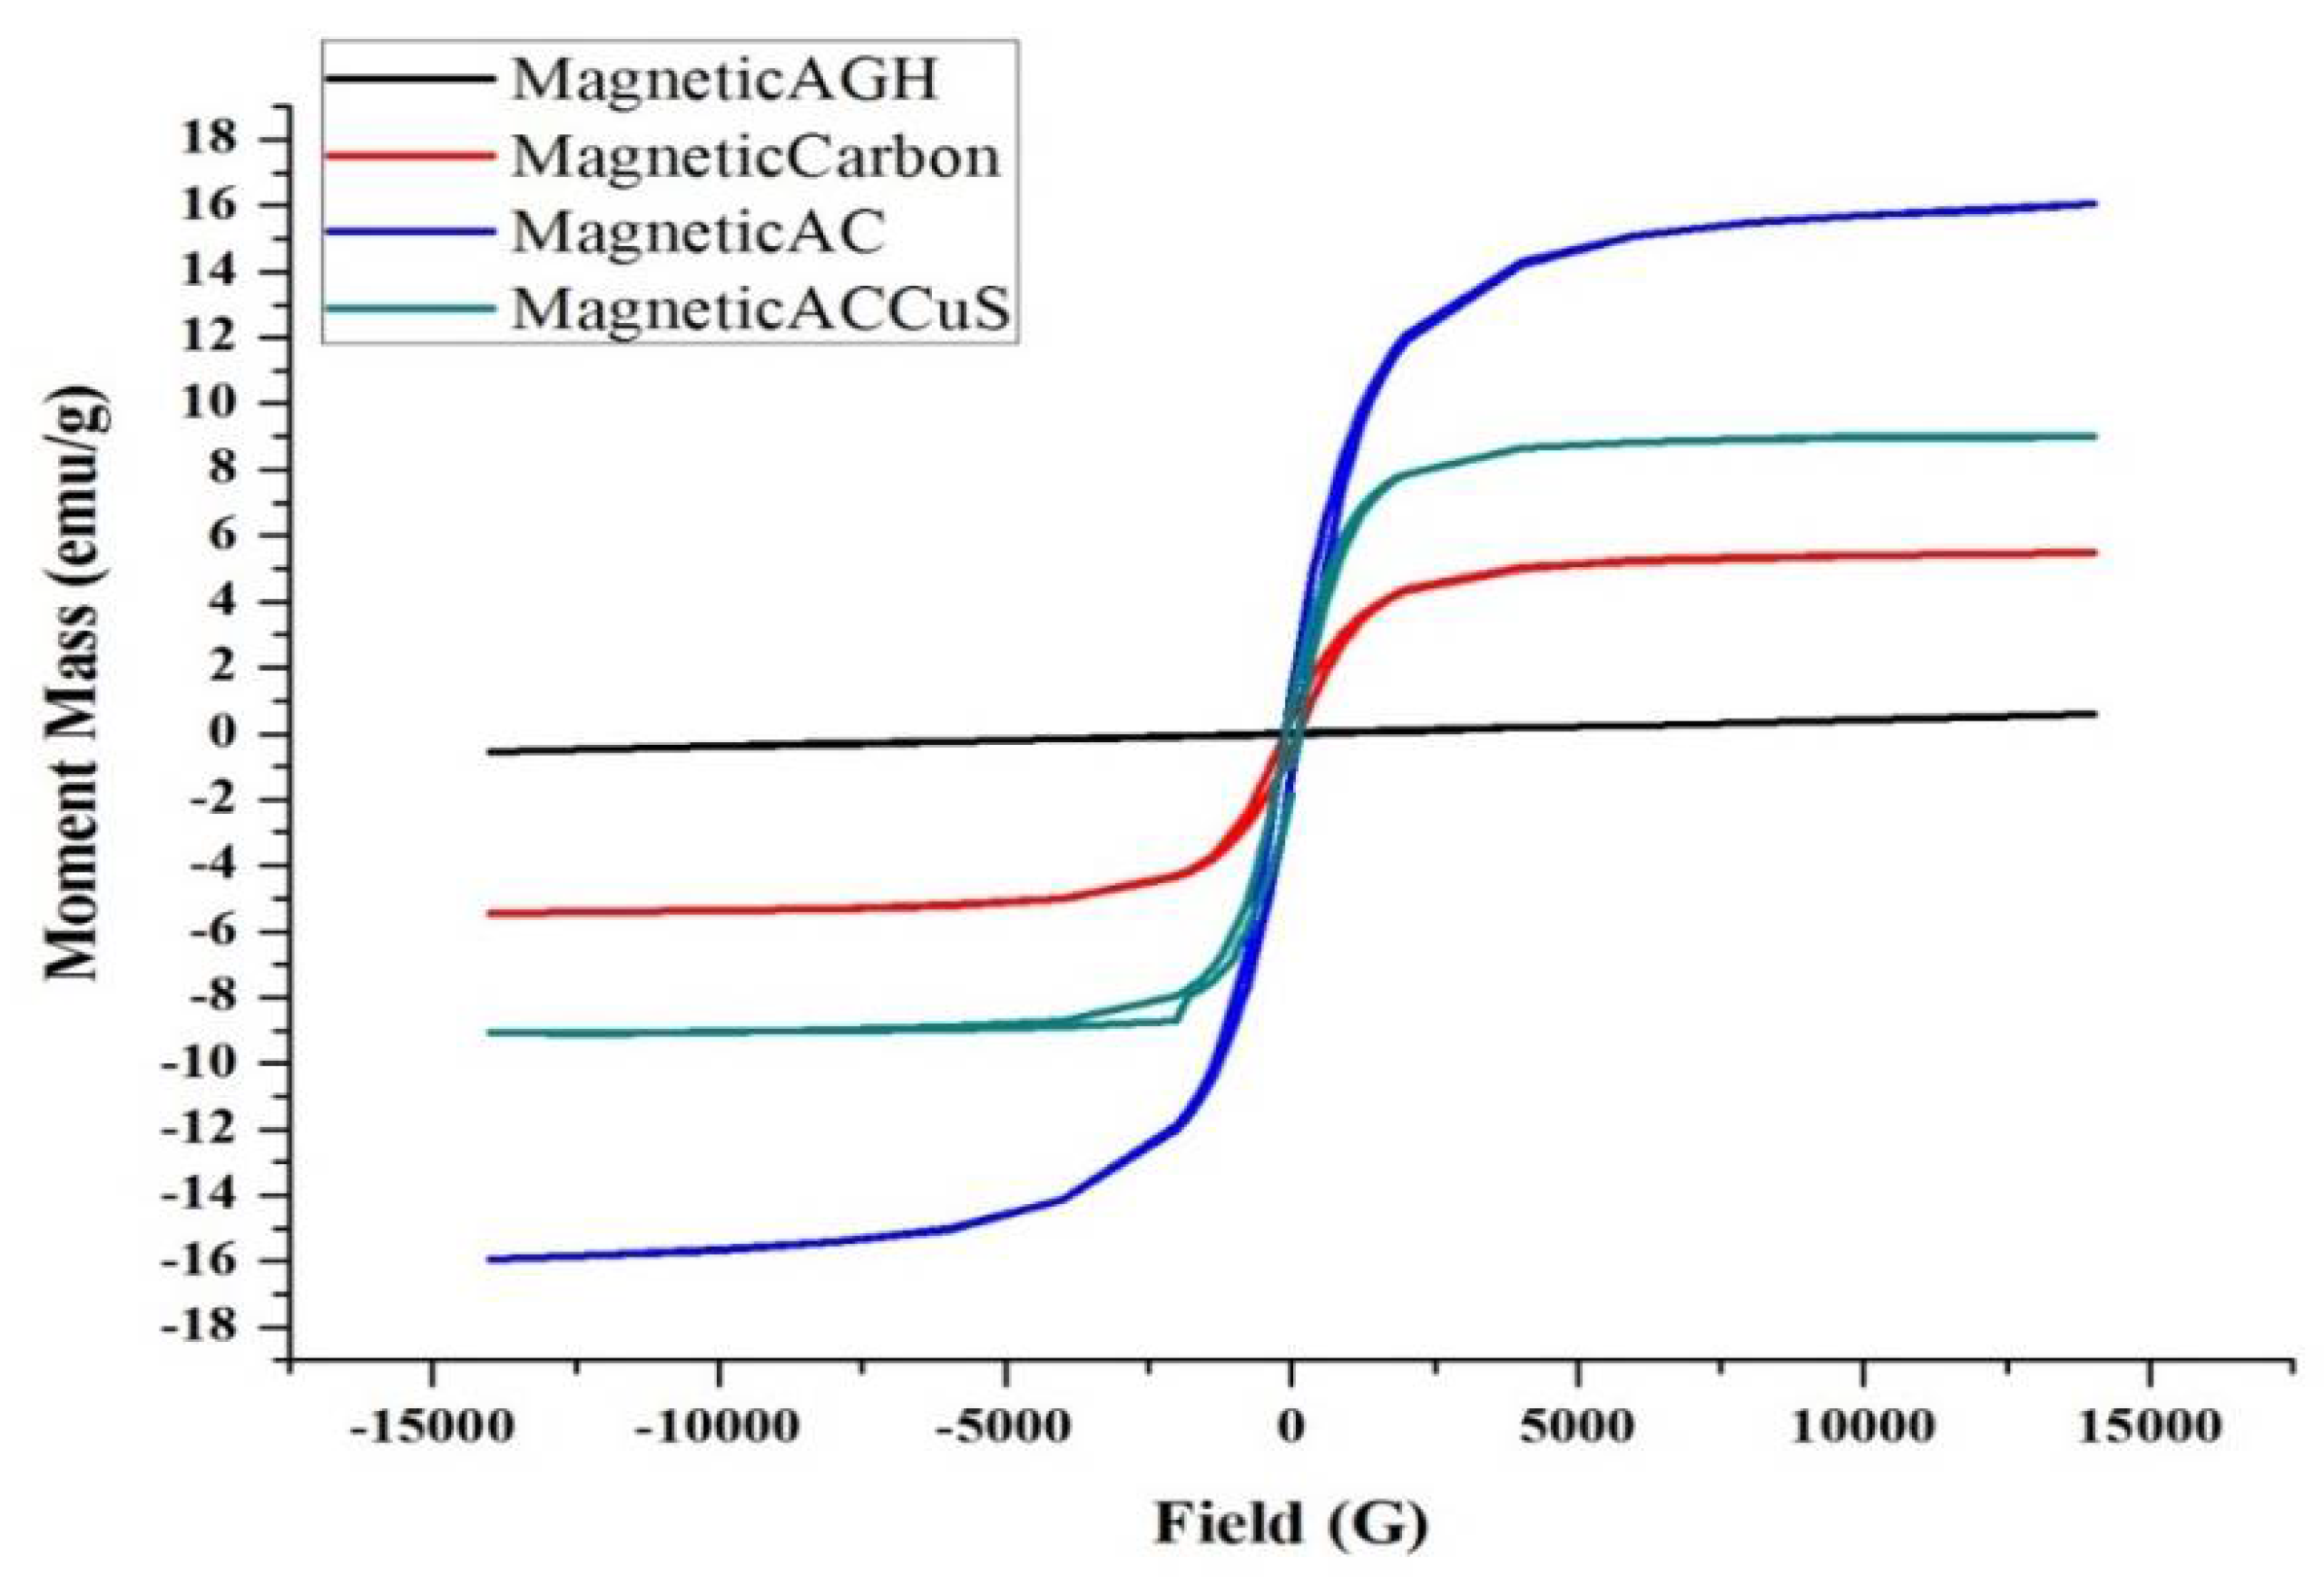
3.1.6. VSM Analysis
3.2. Effective Parameters on TC Antibiotic Photocatalytic Synthesis
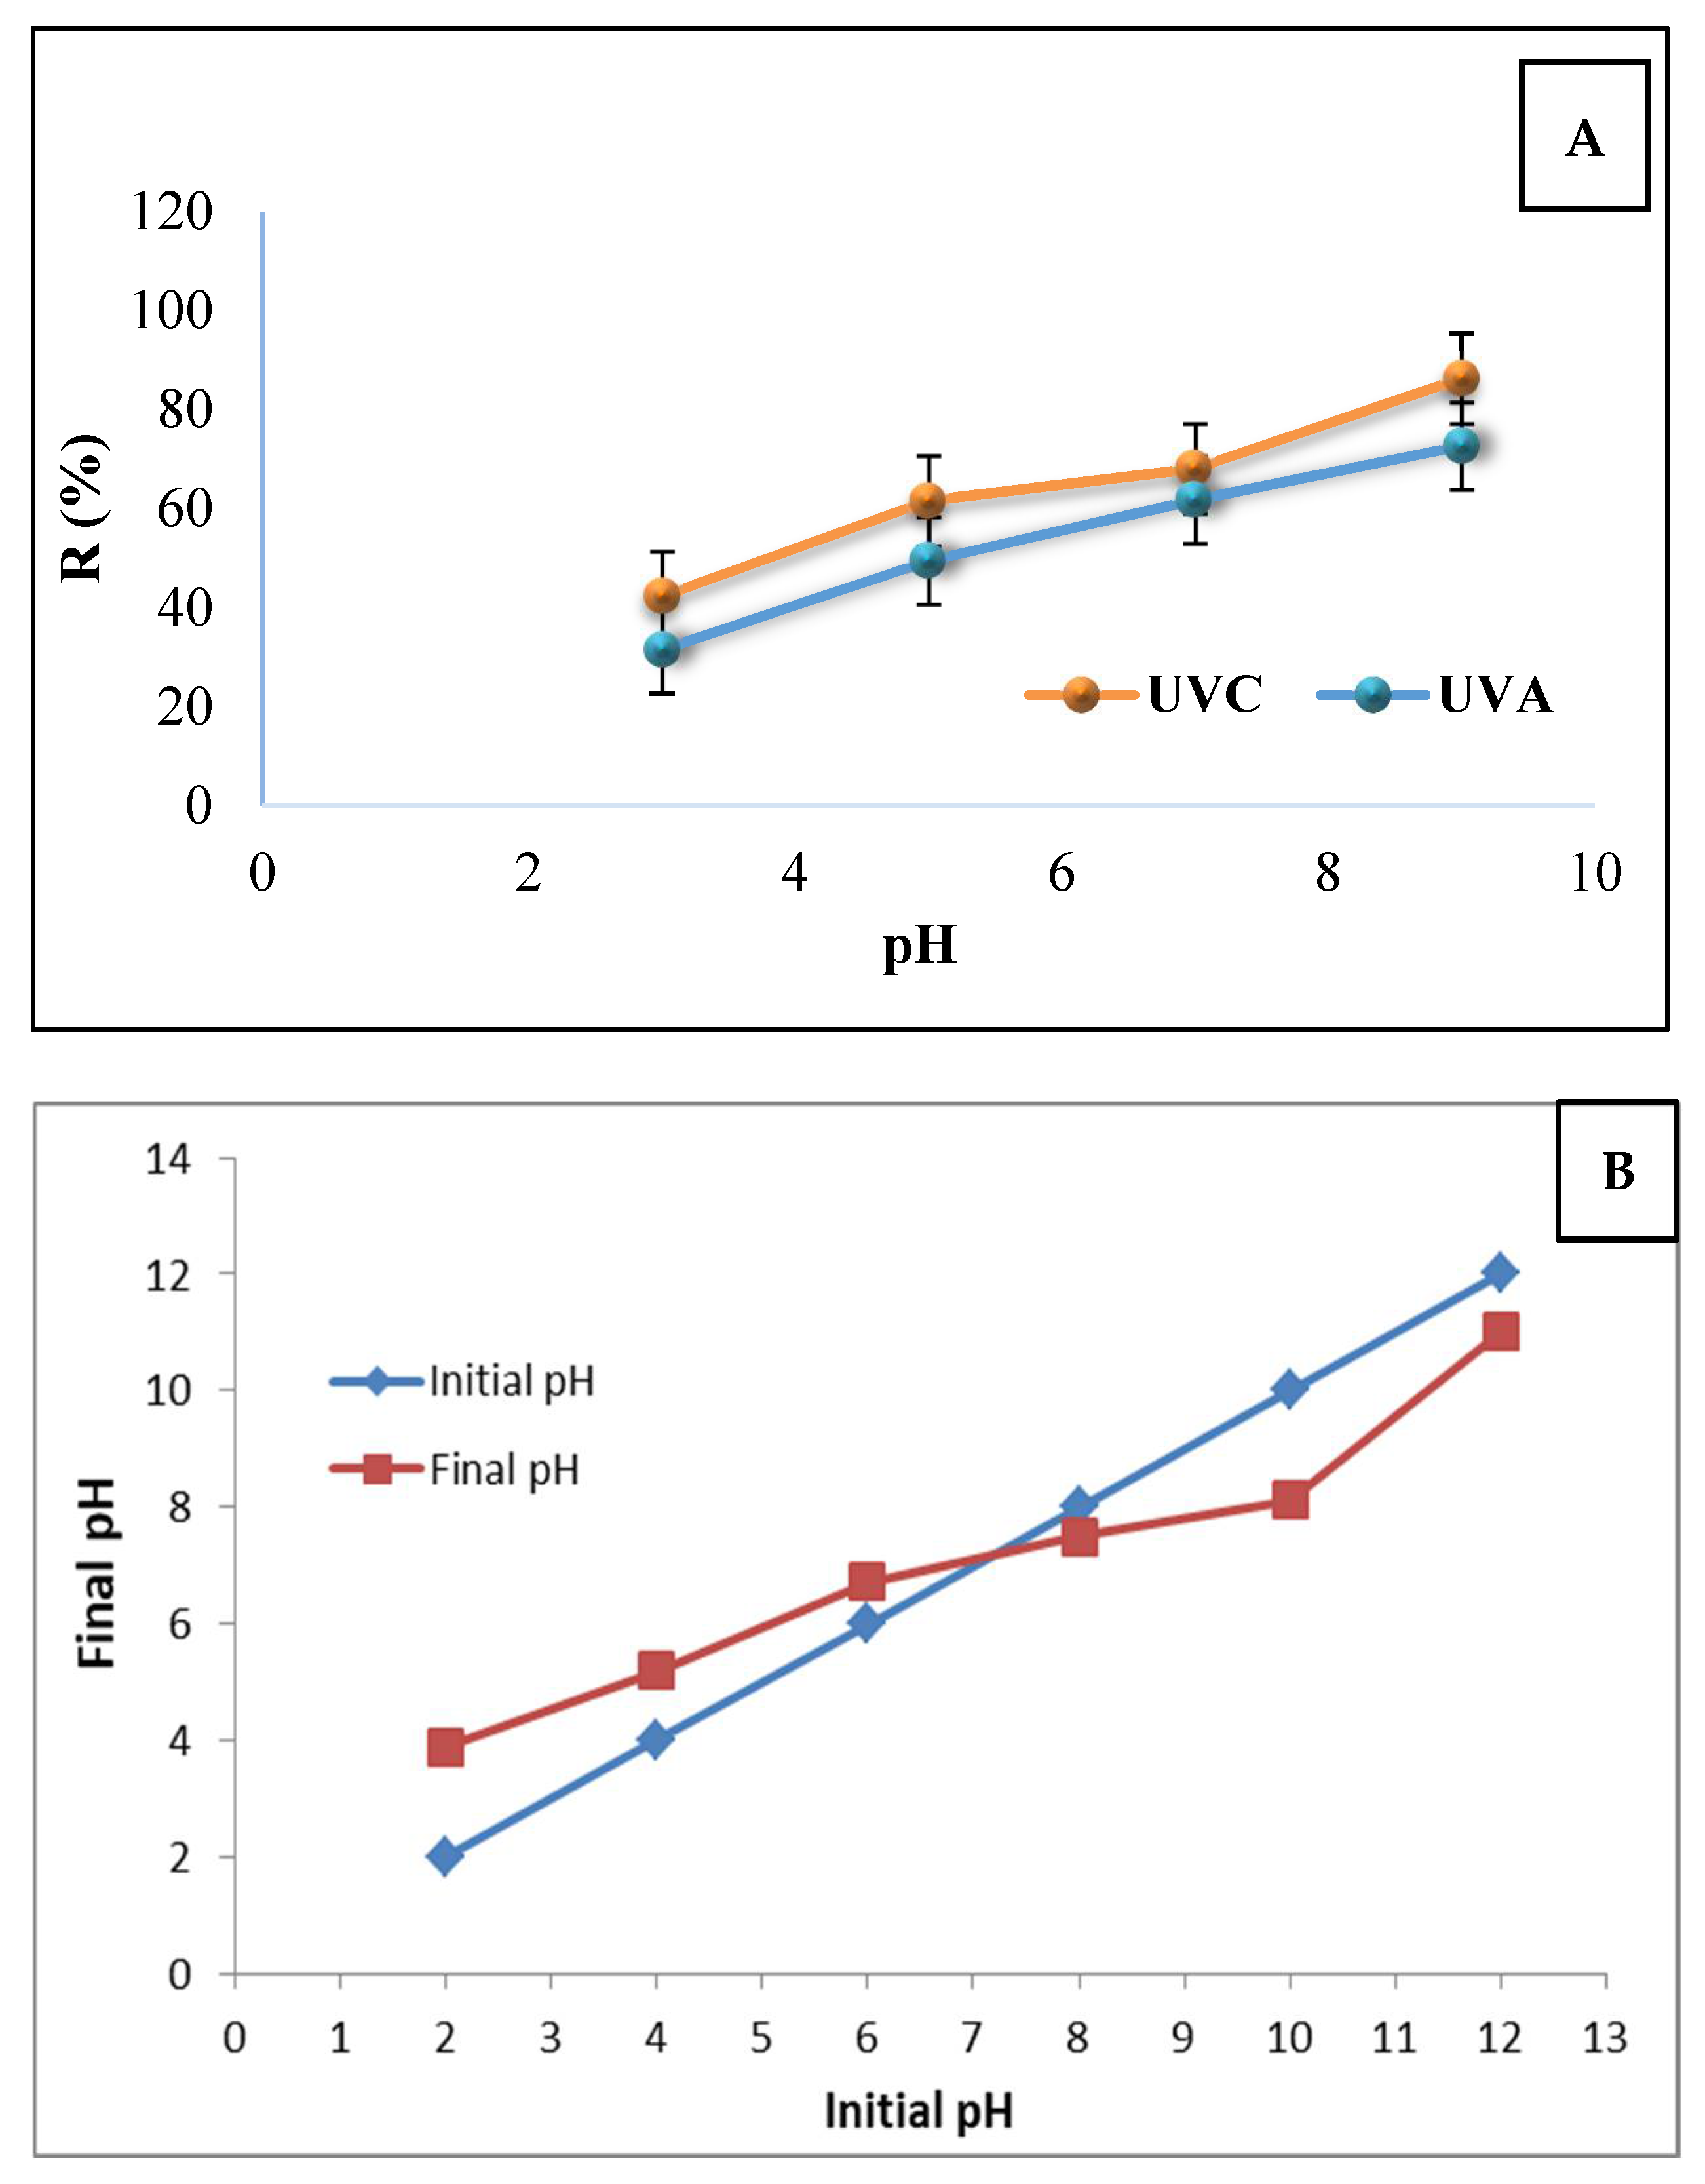
3.2.1. Effect of pH
3.2.2. Effect of Magnetic Nanocomposite Dosage
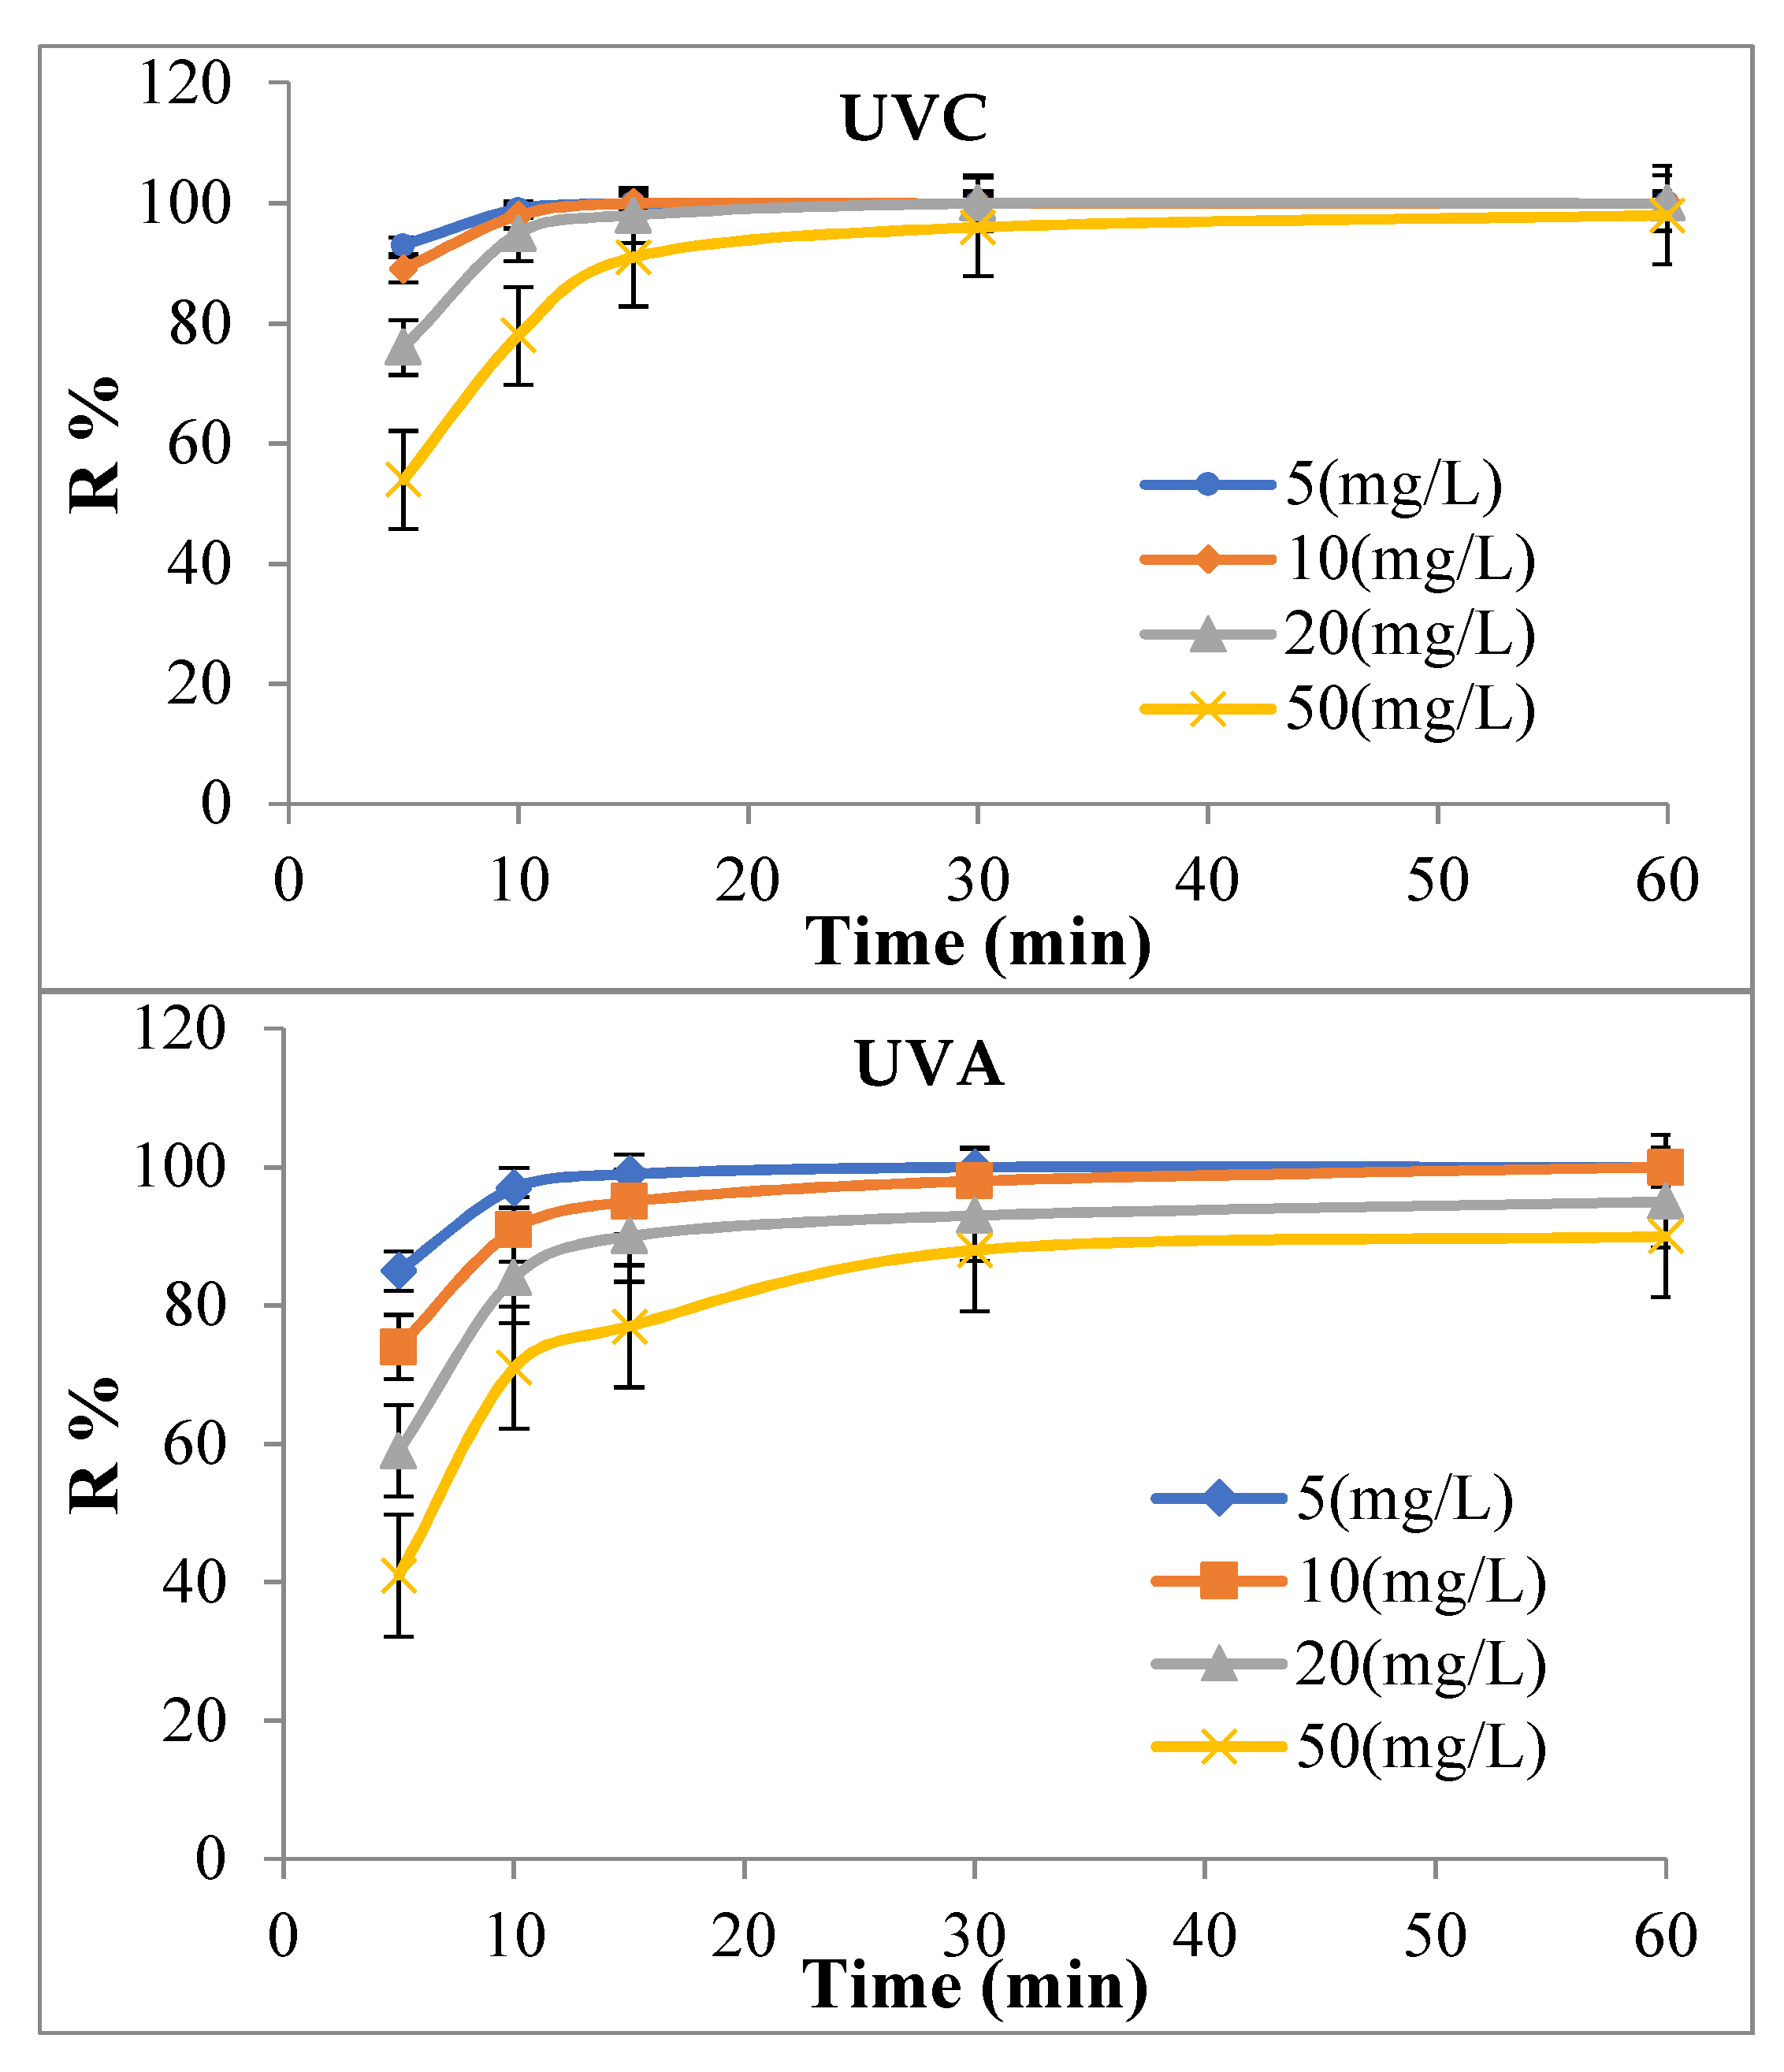
3.2.3. Effect of TC Concentration and Contact Time
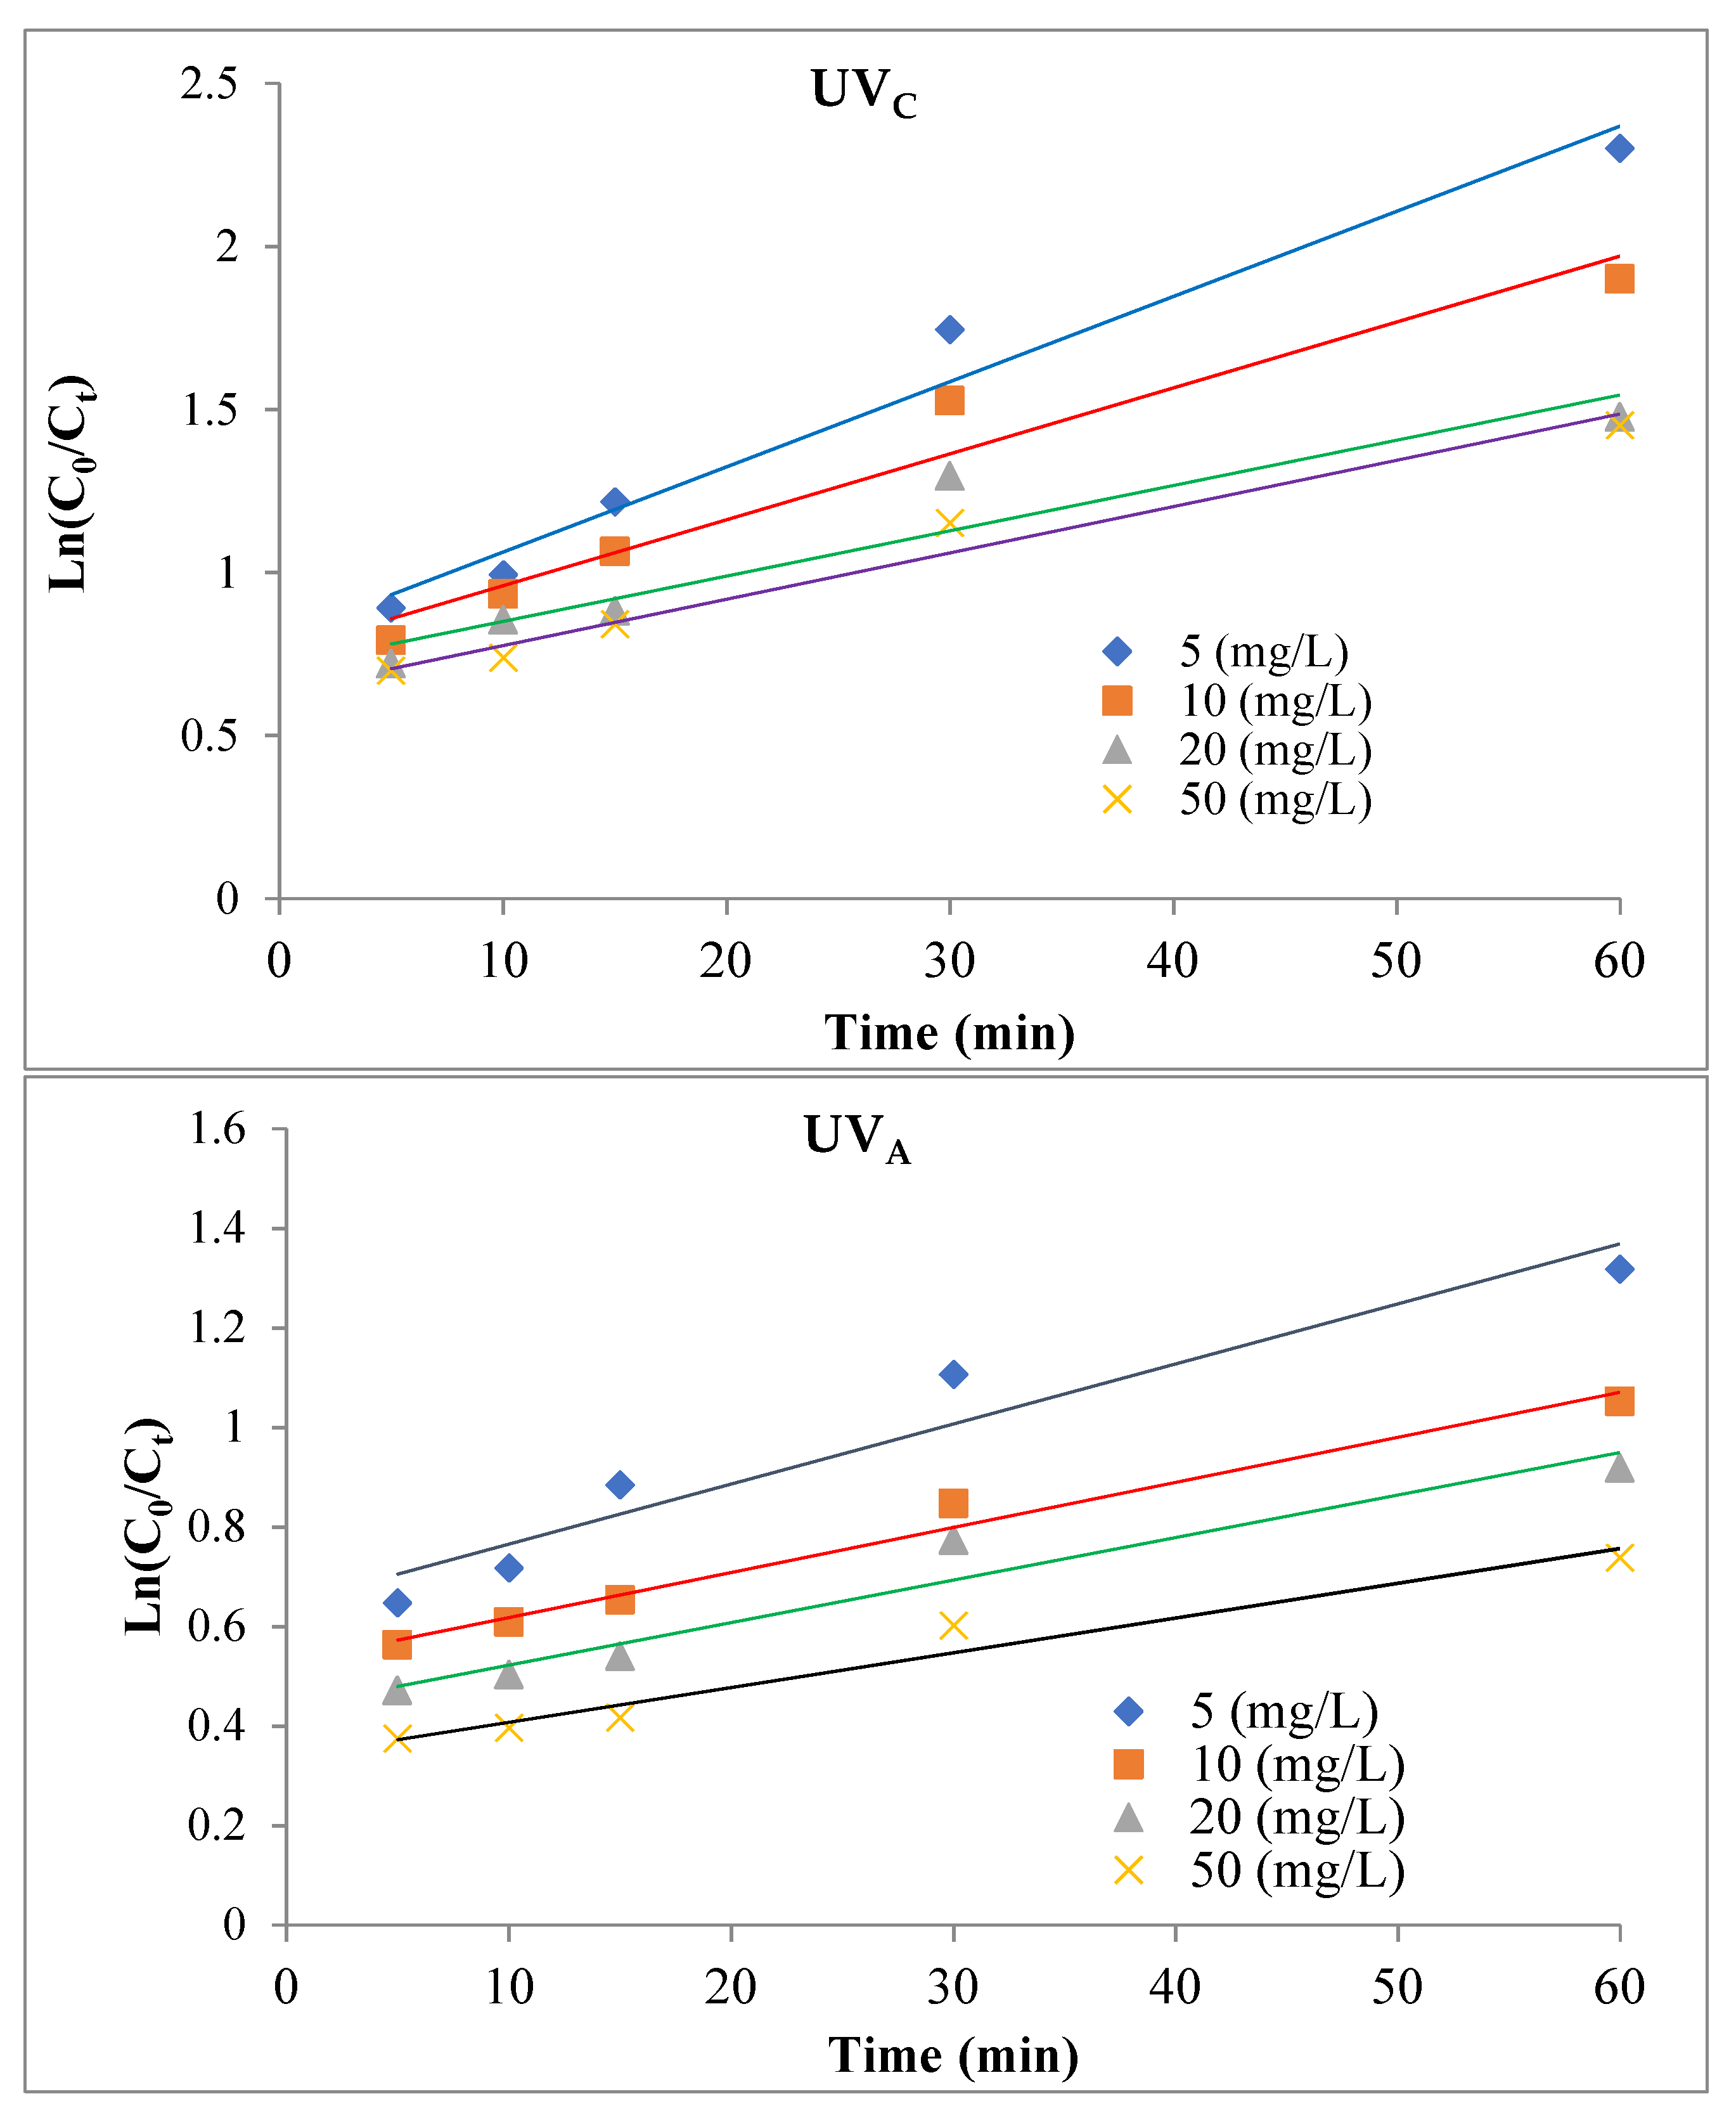
3.3. Kinetics of Photocatalytic Decomposition of TC Antibiotic
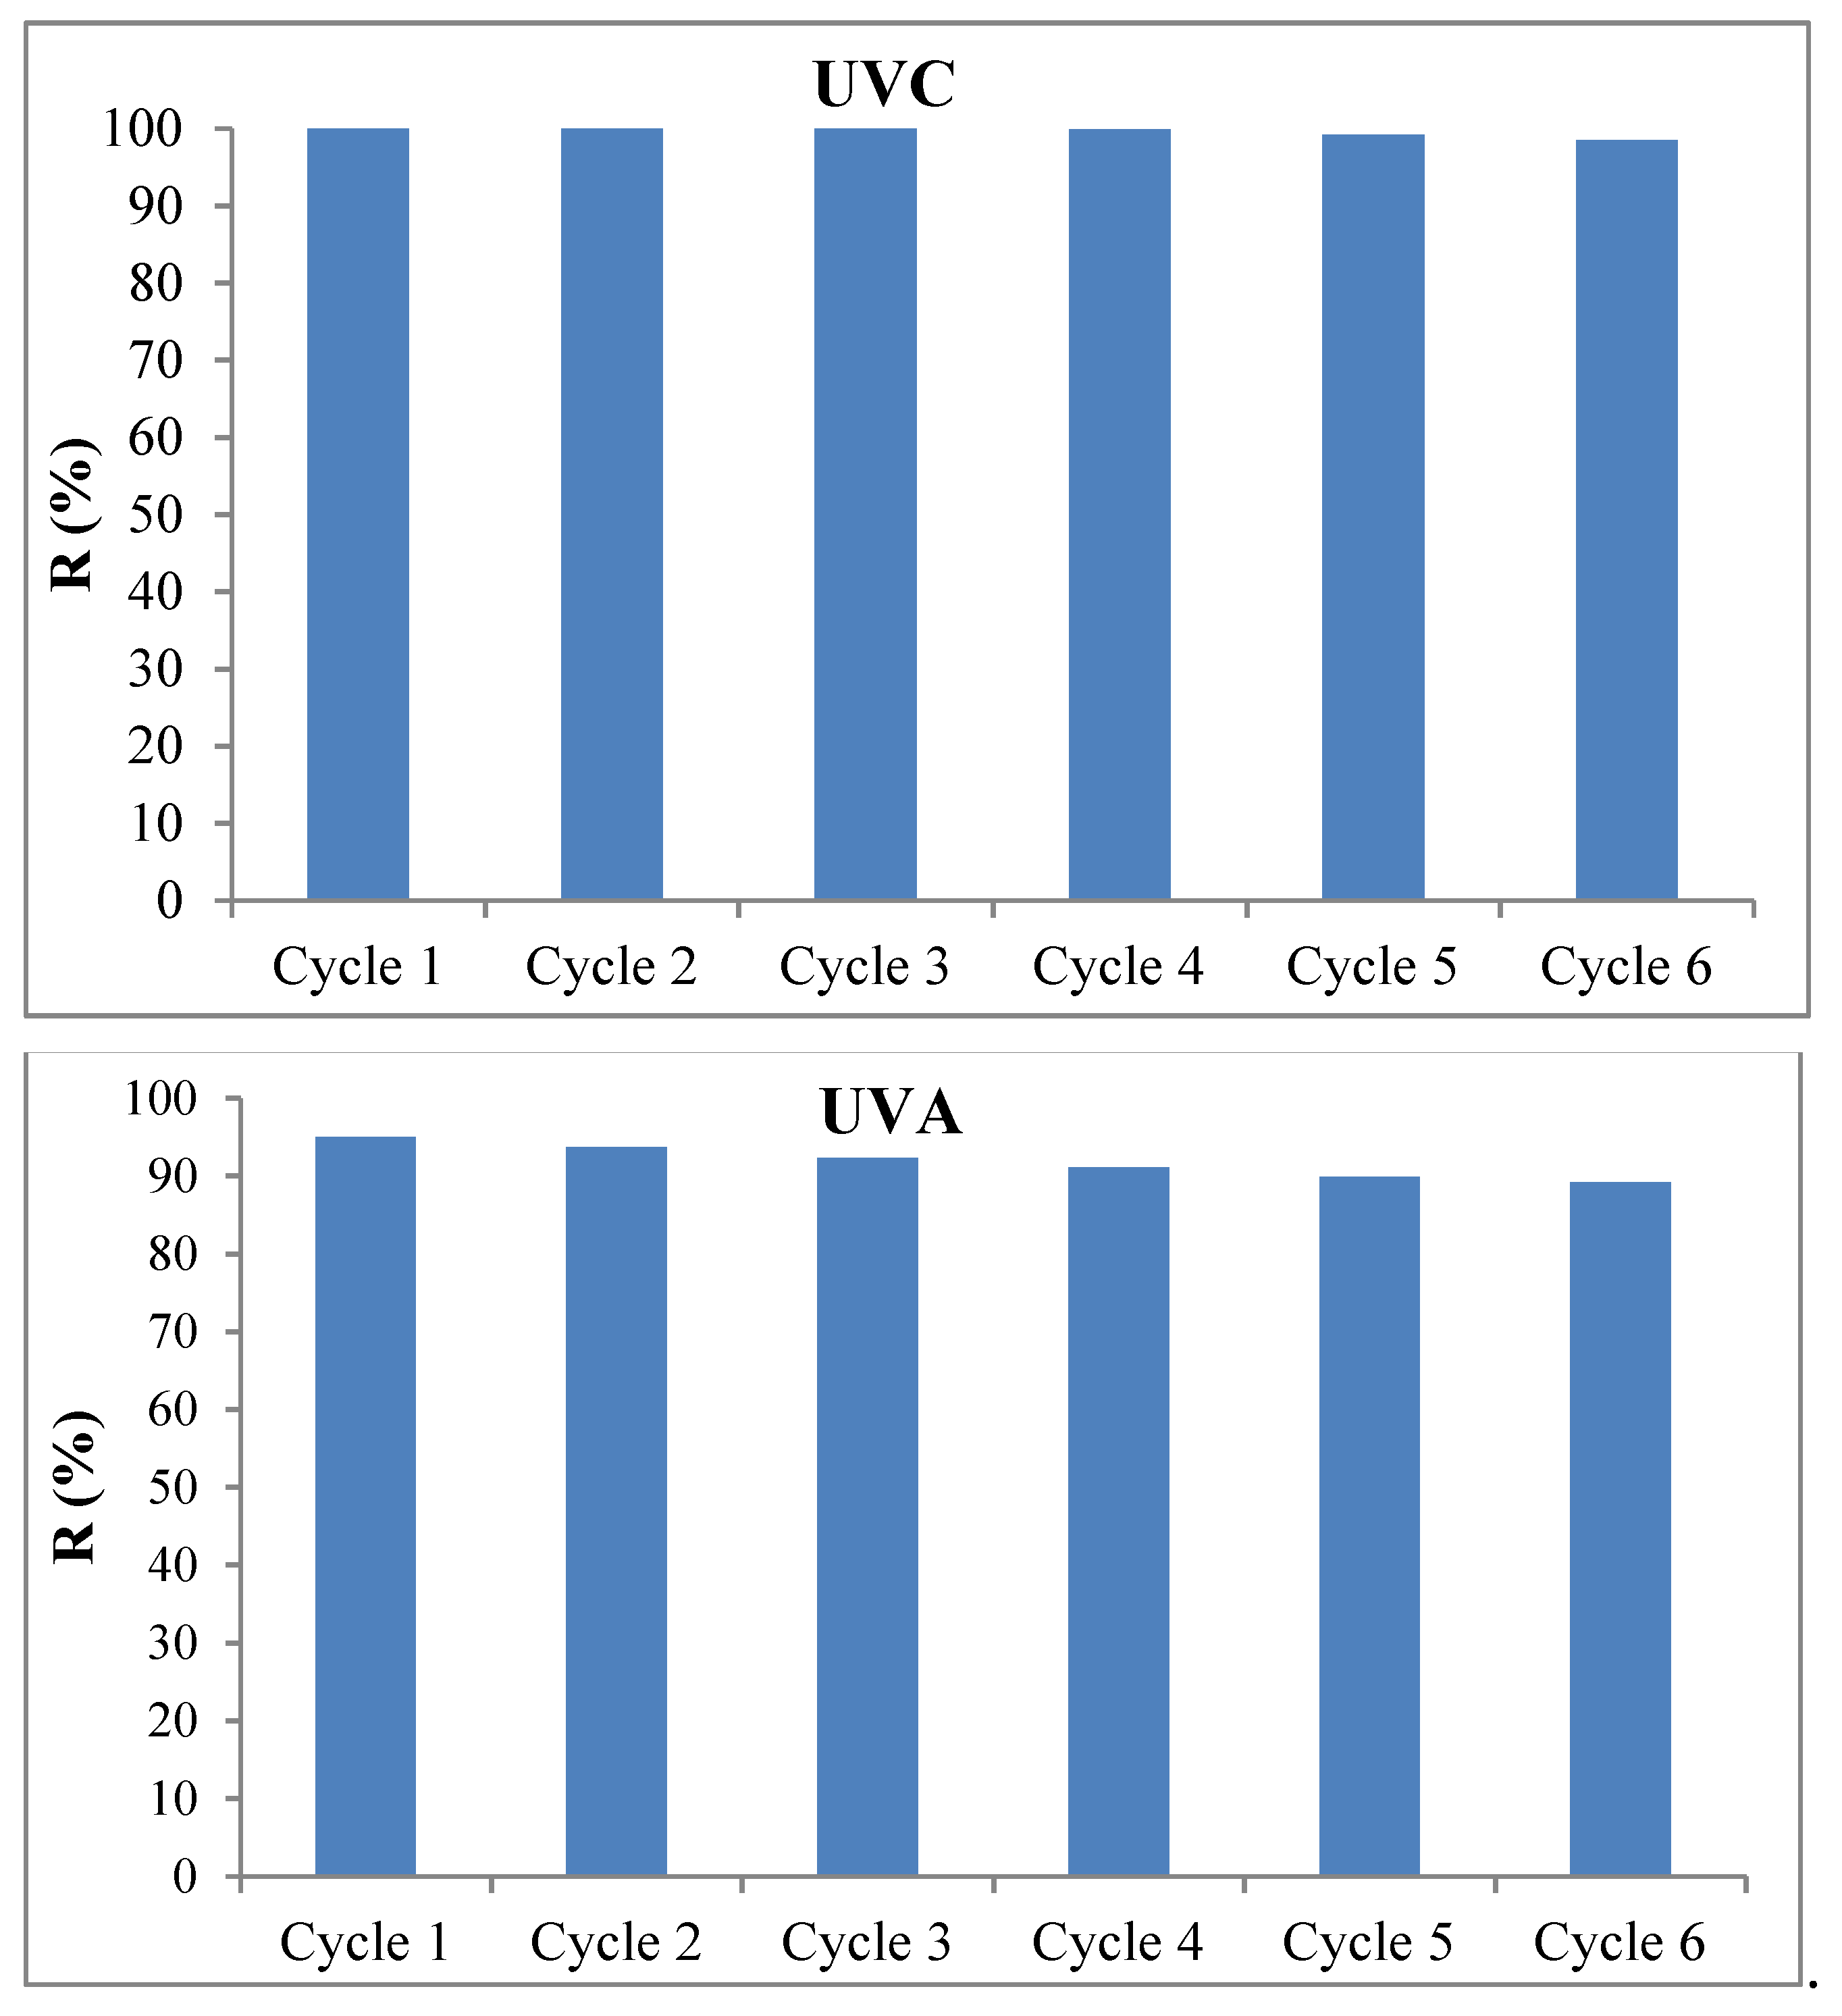
3.4. Stability and Reusability of Magnetic MAC/CuS Nanocomposite in TC’s Photocatalytic Degradation Process
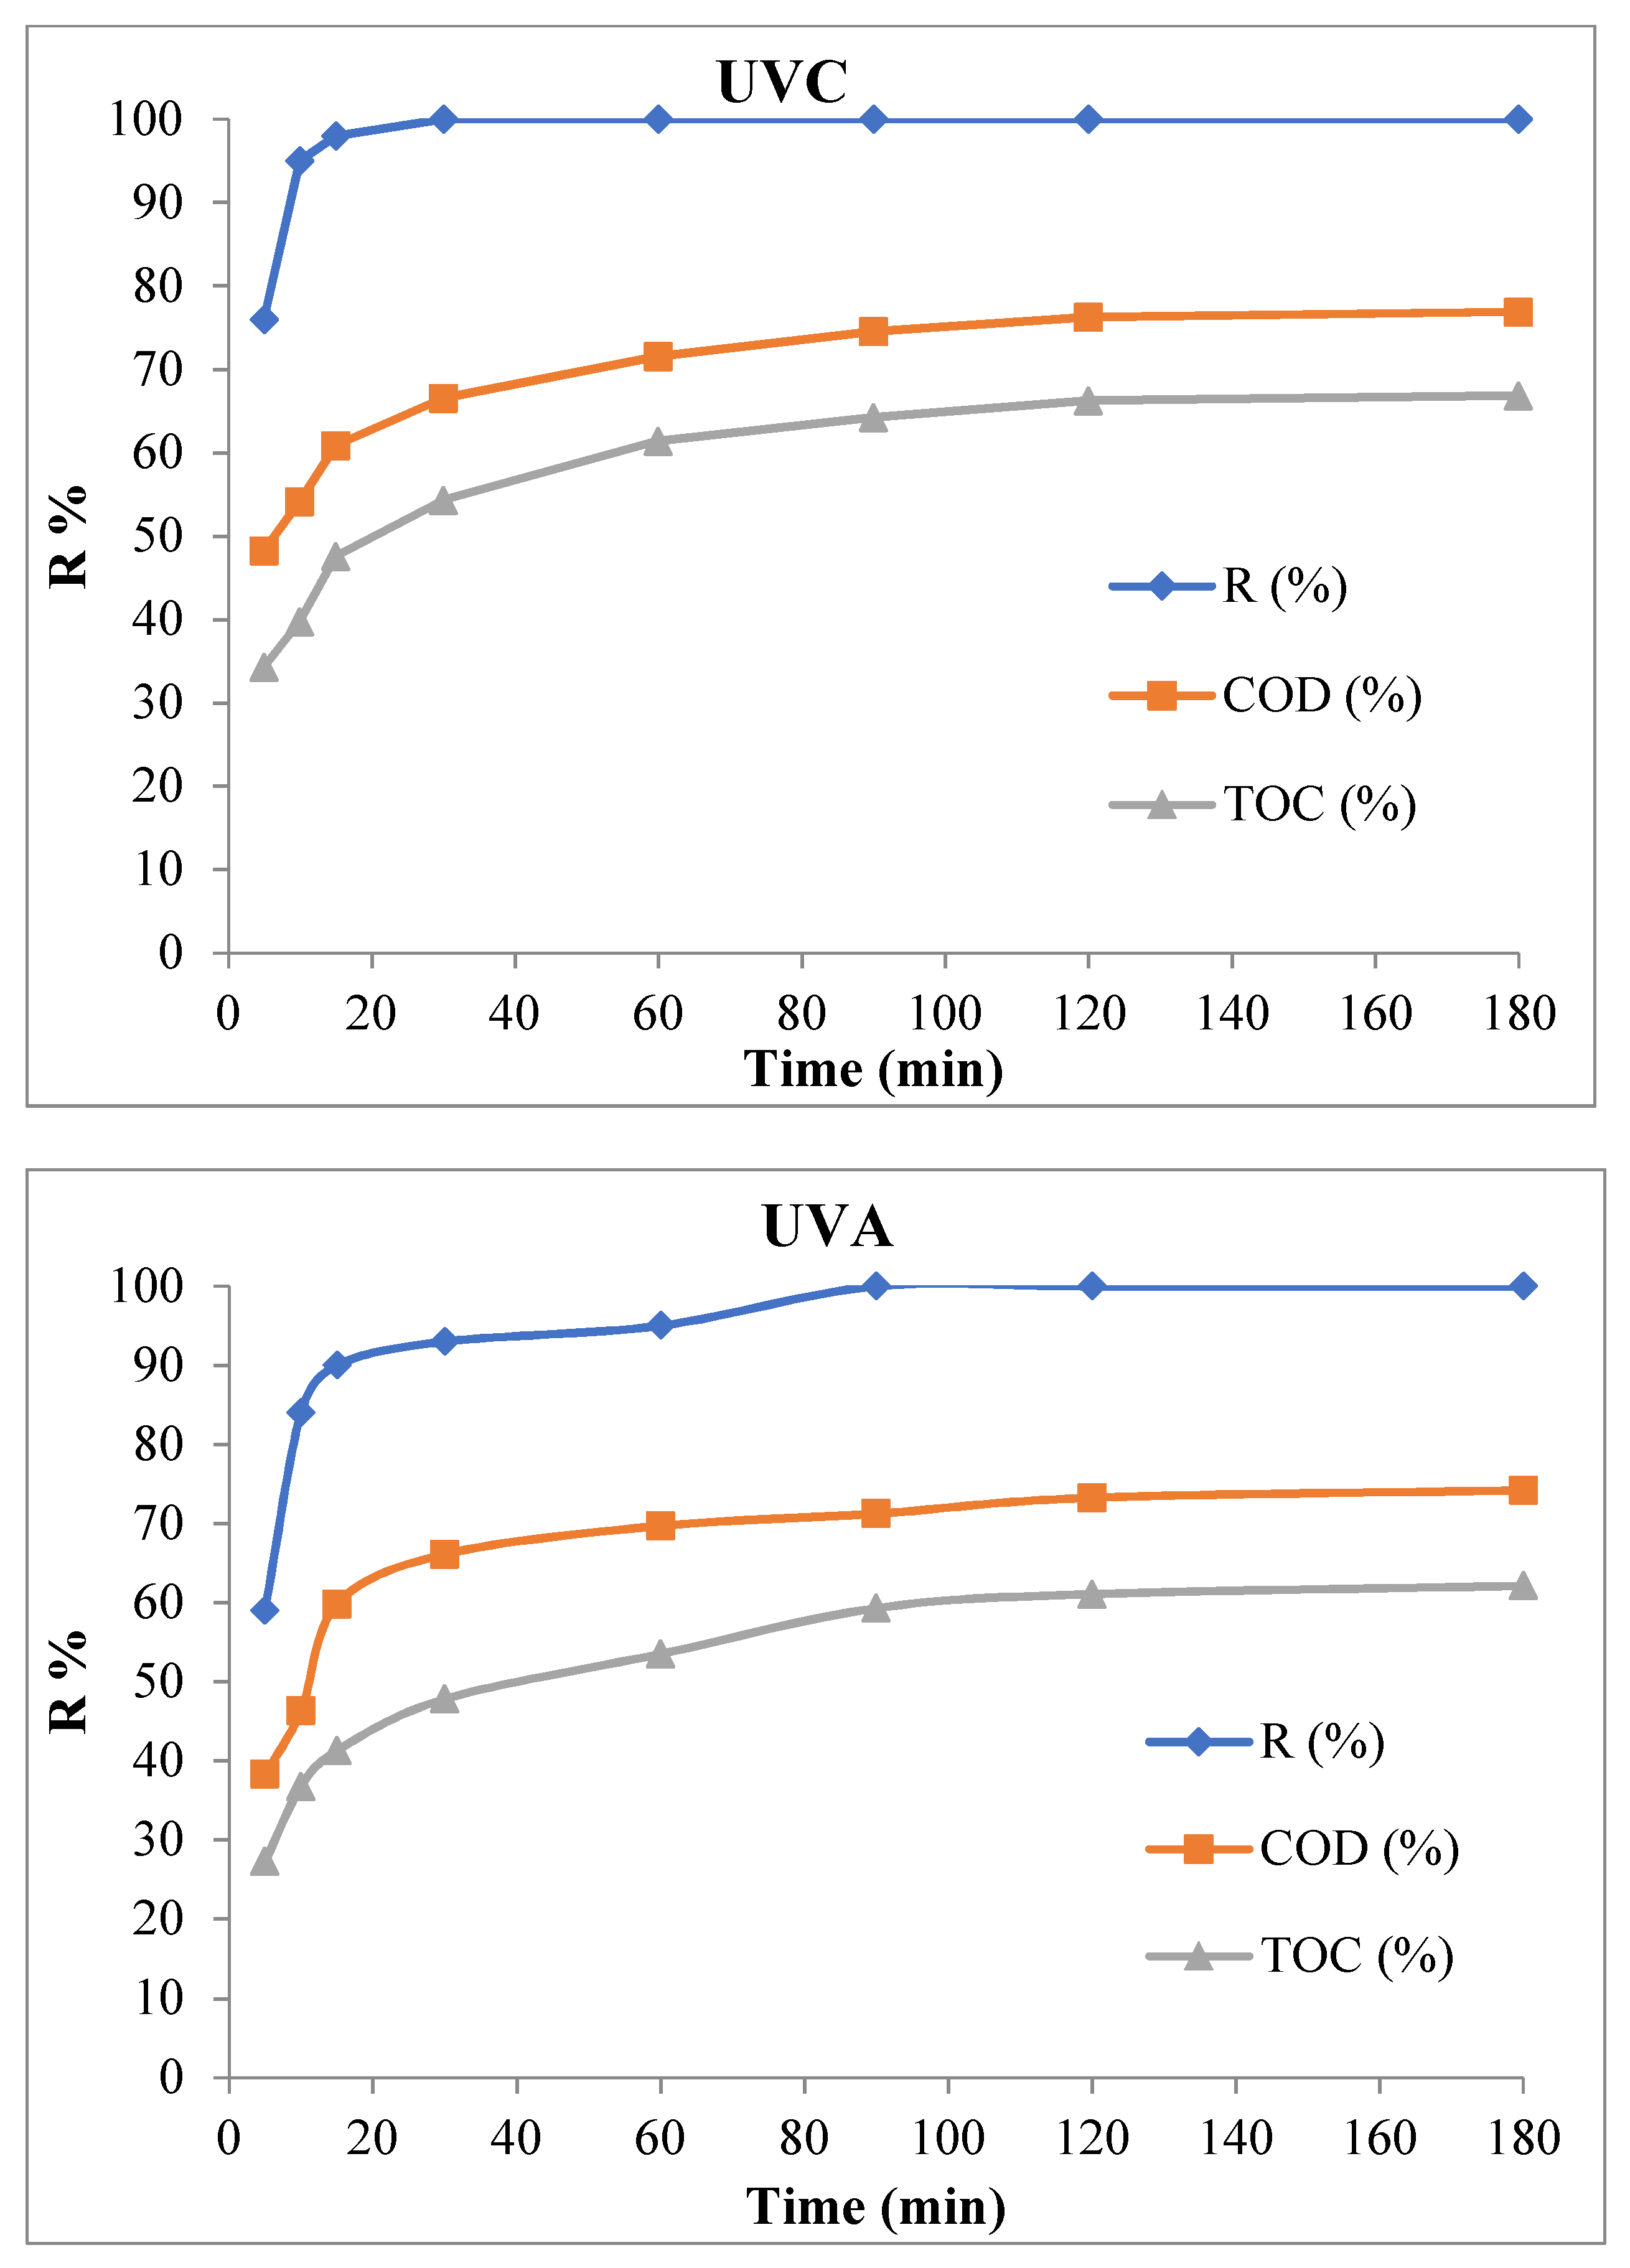
3.5. COD and TOC Removal Efficiency in the Optimal Conditions
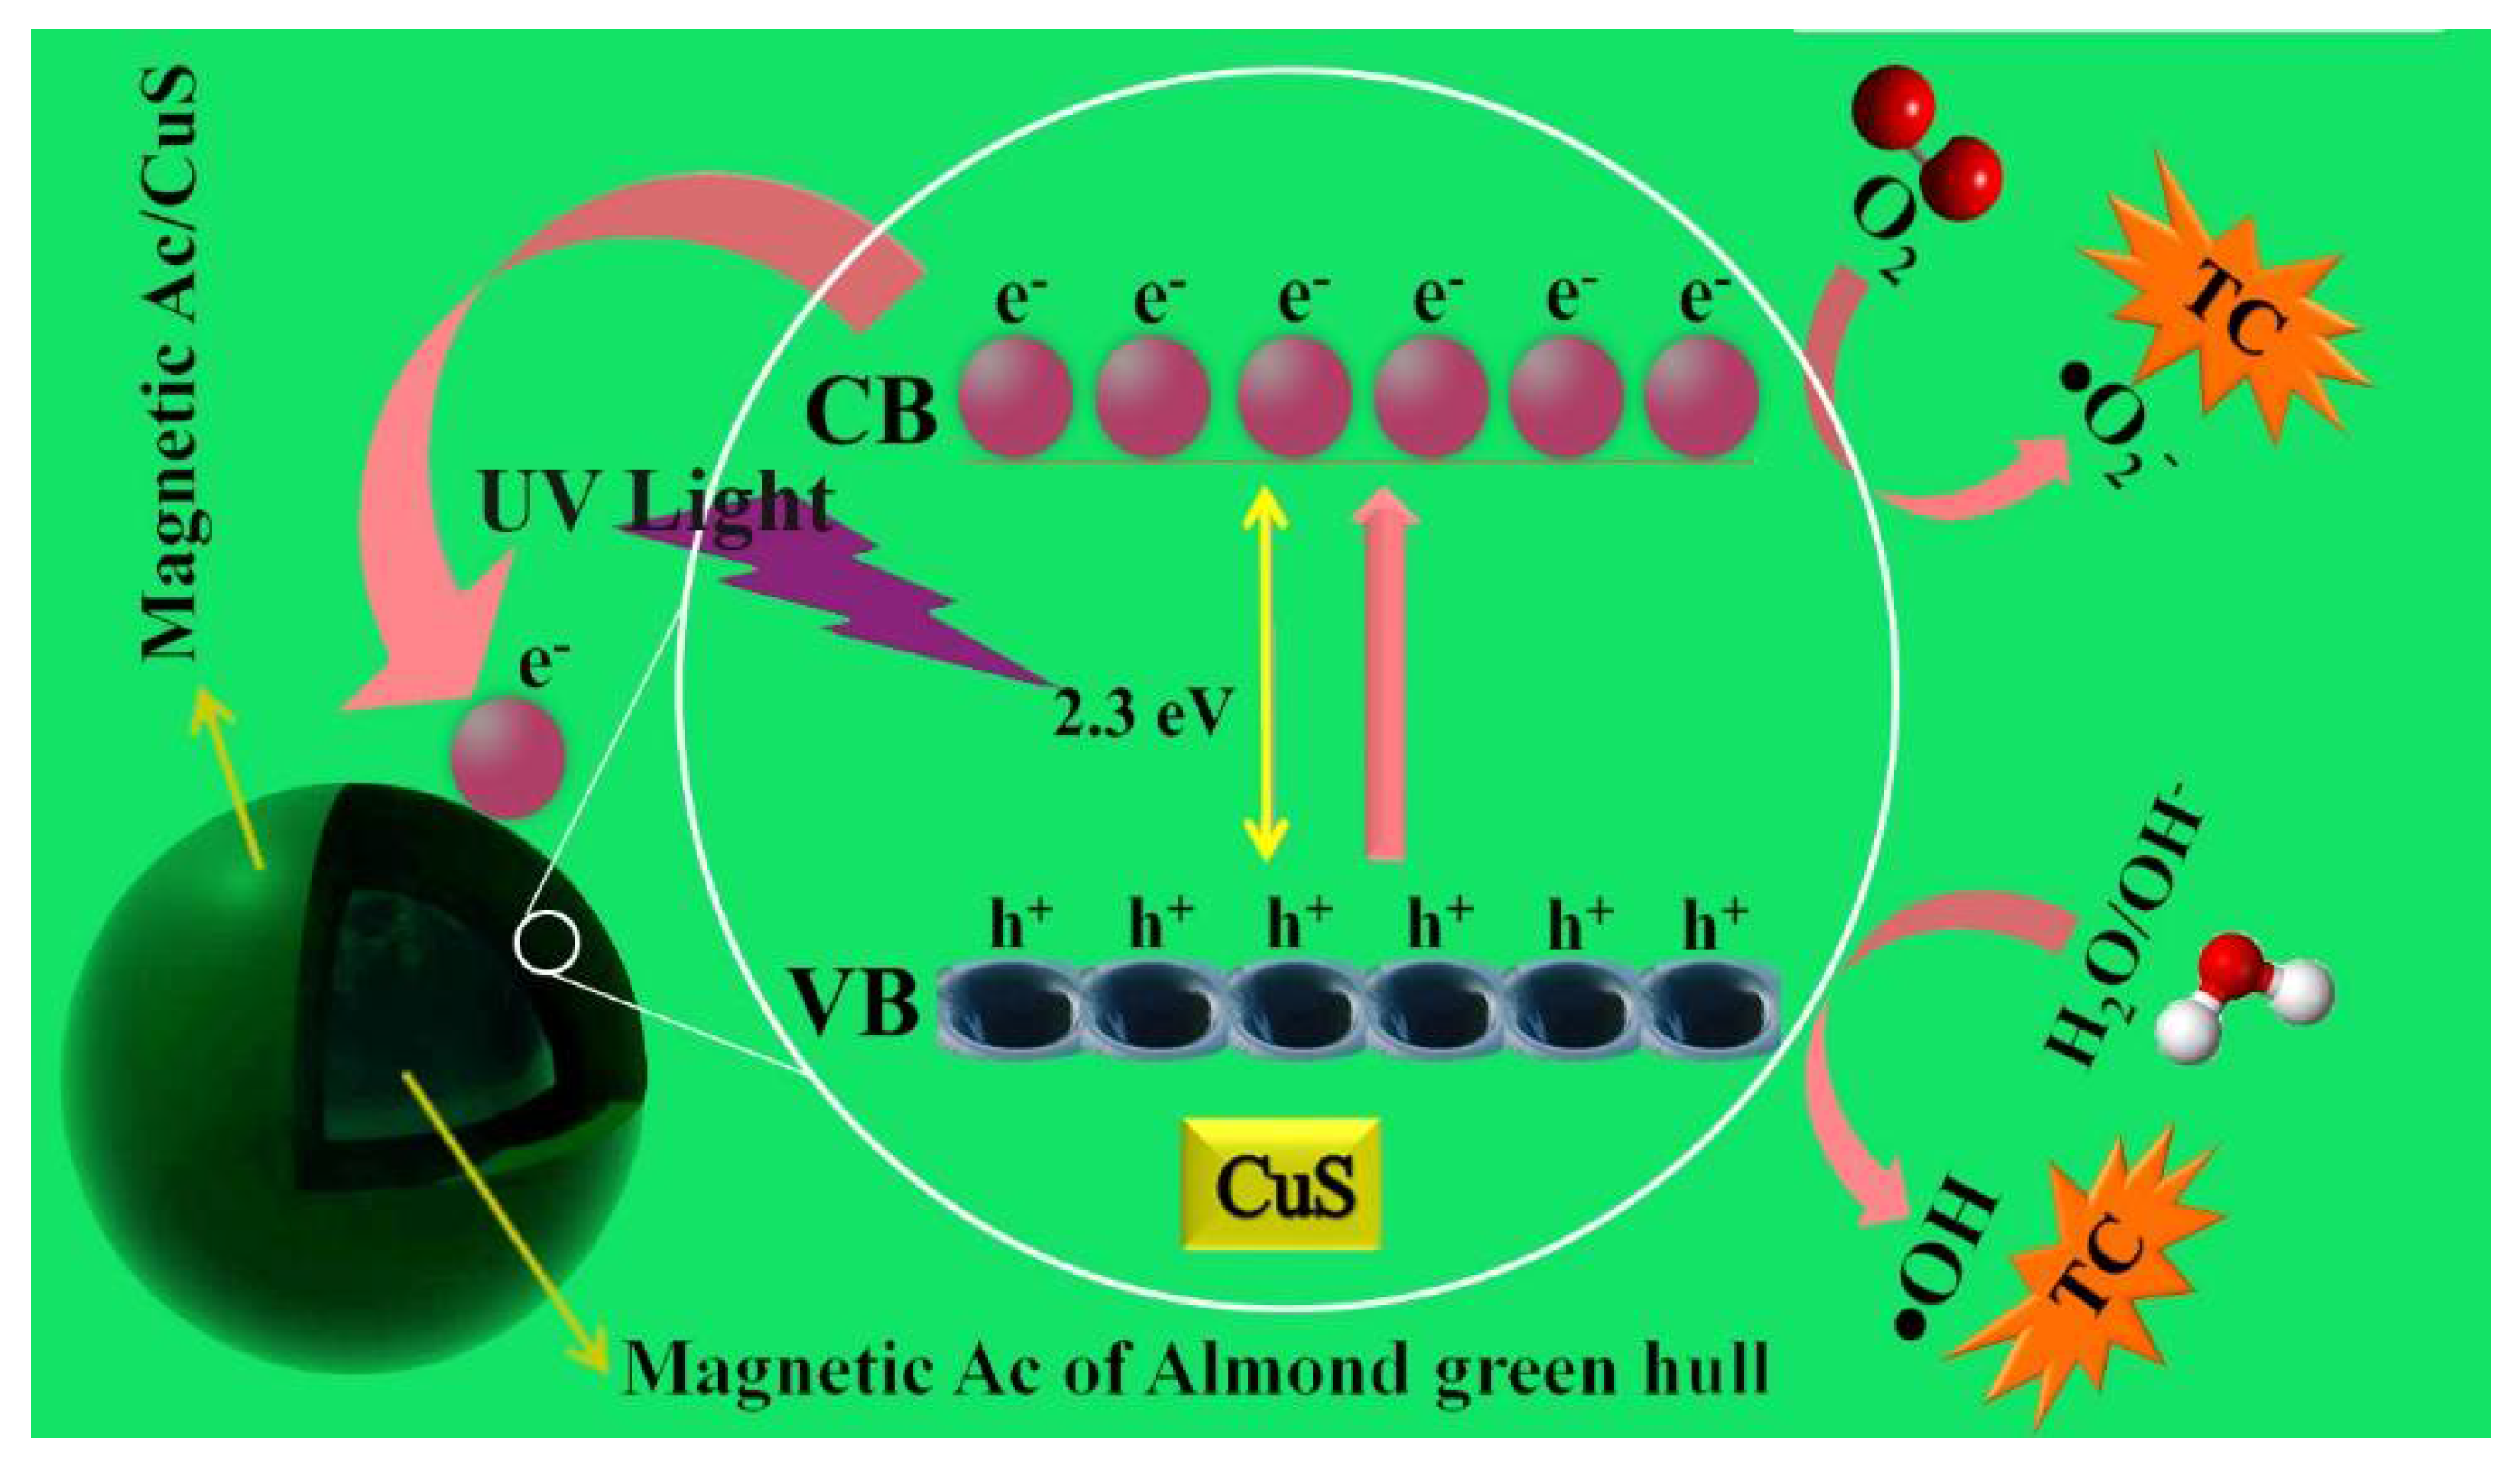
3.6. TC Removal Mechanism throughout the Studied Process
4. Discussion
4.1. Characteristics of Synthesized Nanocomposite
4.1.1. FESEM Analysis
4.1.2. XRD Analysis
4.1.3. DRS Analysis
4.1.4. EDX Analysis
4.1.5. FTIR Analysis
4.1.6. VSM Analysis
4.2. Effective Parameters on TC Antibiotic Photocatalytic Synthesis
4.2.1. Effect of pH
4.2.2. Effect of Magnetic Nanocomposite Dosage
4.2.3. Effect of TC Concentration
4.3. Kinetics of Photocatalytic Decomposition of TC Antibiotic
4.4. Stability and Reusability of Magnetic MAC/CuS Nanocomposite in TC’s Photocatalytic Degradation Process
4.5. COD and TOC Removal Efficiency in the Optimal Conditions
4.6. TC Removal Mechanism throughout the Studied Process
5. Conclusions
Author Contributions
Funding
Institutional Review Board Statement
Informed Consent Statement
Data Availability Statement
Acknowledgments
Conflicts of Interest
References
- Azizan, N.A.Z.; Yuzir, A.; Abdullah, N. Pharmaceutical compounds in anaerobic digestion: A review on the removals and effect to the process performance. J. Environ. Chem. Eng. 2021, 9, 105926. [Google Scholar] [CrossRef]
- Chen, G.; Yu, Y.; Liang, L.; Duan, X.; Li, R.; Lu, X.; Yan, B.; Li, N.; Wang, S. Remediation of antibiotic wastewater by coupled photocatalytic and persulfate oxidation system: A critical review. J. Hazard. Mater. 2021, 408, 124461. [Google Scholar] [CrossRef] [PubMed]
- Ezeuko, A.S.; Ojemaye, M.O.; Okoh, O.O.; Okoh, A.I. Technological advancement for eliminating antibiotic resistance genes from wastewater: A review of their mechanisms and progress. J. Environ. Chem. Eng. 2021, 9, 106183. [Google Scholar] [CrossRef]
- Kallawar, G.A.; Barai, D.P.; Bhanvase, B.A. Bismuth titanate based photocatalysts for degradation of persistent organic compounds in wastewater: A comprehensive review on synthesis methods, performance as photocatalyst and challenges. J. Clean. Prod. 2021, 318, 128563. [Google Scholar] [CrossRef]
- Lin, C.; Xie, X.; Li, C.; Yan, Q. Co0.5Zn0.5Fe2O4/Ag3PO4: A magnetic, highly efficient visible-light photocatalyst and the Z-scheme mechanism for removal of anionic dye and tetracycline hydrochloride. Mater. Sci. Semicond. Process. 2018, 82, 46–53. [Google Scholar] [CrossRef]
- Nasseh, N.; Panahi, A.H.; Esmati, M.; Daglioglu, N.; Asadi, A.; Rajati, H.; Khodadoost, F. Enhanced photocatalytic degradation of tetracycline from aqueous solution by a novel magnetically separable FeNi3/SiO2/ZnO nano-composite under simulated sunlight: Efficiency, stability, and kinetic studies. J. Mol. Liq. 2020, 301, 112434. [Google Scholar] [CrossRef]
- Khodadadi, M.; Ehrampoush, M.H.; Ghaneian, M.T.; Allahresani, A.; Mahvi, A.H. Synthesis and characterizations of FeNi3@ SiO2@ TiO2 nanocomposite and its application in photo-catalytic degradation of tetracycline in simulated wastewater. J. Mol. Liq. 2018, 255, 224–232. [Google Scholar] [CrossRef]
- Yang, Y.-Y.; Niu, C.G.; Wen, X.J.; Zhang, L.; Liang, C.; Guo, H.; Dan-Lin, G.; Hui-Yun, L.; Zeng, G.M. Fabrication of visible-light-driven silver iodide modified iodine-deficient bismuth oxyiodides Z-scheme heterojunctions with enhanced photocatalytic activity for Escherichia coli inactivation and tetracycline degradation. J. Colloid Interface Sci. 2019, 533, 636–648. [Google Scholar] [CrossRef]
- Chen, Y.; Wang, L.; Wang, W.; Cao, M. Enhanced photoelectrochemical properties of ZnO/ZnSe/CdSe/Cu2-xSe core–shell nanowire arrays fabricated by ion-replacement method. Appl. Catal. B Environ. 2017, 209, 110–117. [Google Scholar] [CrossRef]
- Reheman, A.; Kadeer, K.; Okitsu, K.; Halidan, M.; Tursun, Y.; Dilinuer, T.; Abulikemu, A. Facile photo-ultrasonic assisted reduction for preparation of rGO/Ag2CO3 nanocomposites with enhanced photocatalytic oxidation activity for tetracycline. Ultrason. Sonochemistry 2019, 51, 166–177. [Google Scholar] [CrossRef]
- Wang, Y.-C.; Liu, X.Y.; Wang, X.X.; Cao, M.S. Metal-Organic Frameworks Based Photocatalysts: Architecture Strategies for Efficient Solar Energy Conversion. Chem. Eng. J. 2021, 419, 129459. [Google Scholar] [CrossRef]
- Assadi, A.; Dehghani, M.H.; Rastkari, N.; Nasseri, S.; Mahvi, A.H. Photocatalytic reduction of hexavalent chromium in aqueous solutions with zinc oxide nanoparticles and hydrogen peroxide. Environ. Prot. Eng. 2012, 38, 5–16. [Google Scholar]
- Bai, X.; Wang, Y.J.; Li, Y.; Wang, X.J. Adsorption–photocatalytical remediation for series of tetracycline contaminants with BiOCl–CdS composite under simulated sunlight. J. Taiwan Inst. Chem. Eng. 2019, 104, 94–105. [Google Scholar] [CrossRef]
- Farhadian, N.; Akbarzadeh, R.; Pirsaheb, M.; Jen, T.C.; Fakhri, Y.; Asadi, A. Chitosan modified N, S-doped TiO2 and N, S-doped ZnO for visible light photocatalytic degradation of tetracycline. Int. J. Biol. Macromol. 2019, 132, 360–373. [Google Scholar] [CrossRef] [PubMed]
- Wu, Q.; Zhang, Z. The fabrication of magnetic recyclable nitrogen modified titanium dioxide/strontium ferrite/diatomite heterojunction nanocomposite for enhanced visible-light-driven photodegradation of tetracycline. Int. J. Hydrogen Energy 2019, 44, 8261–8272. [Google Scholar]
- Nasseh, N.; Taghavi, L.; Barikbin, B.; Nasseri, M.A. Synthesis and characterizations of a novel FeNi3/SiO2/CuS magnetic nanocomposite for photocatalytic degradation of tetracycline in simulated wastewater. J. Clean. Prod. 2018, 179, 42–54. [Google Scholar]
- Ayodhya, D.; Veerabhadram, G. Facile fabrication, characterization and efficient photocatalytic activity of surfactant free ZnS, CdS and CuS nanoparticles. J. Sci. Adv. Mater. Devices 2019, 4, 381–391. [Google Scholar] [CrossRef]
- Song, B.; Zhang, C.; Zeng, G.; Gong, J.; Chang, Y.; Jiang, Y. Antibacterial properties and mechanism of graphene oxide-silver nanocomposites as bactericidal agents for water disinfection. Arch. Biochem. Biophys. 2016, 604, 167–176. [Google Scholar] [CrossRef]
- Ai, L.; Jiang, J. Fast removal of organic dyes from aqueous solutions by AC/ferrospinel composite. Desalination 2010, 262, 134–140. [Google Scholar] [CrossRef]
- Mohan, D.; Sarswat, A.; Singh, V.K.; Alexandre-Franco, M.; Pittman, C.U., Jr. Development of magnetic activated carbon from almond shells for trinitrophenol removal from water. Chem. Eng. J. 2011, 172, 1111–1125. [Google Scholar] [CrossRef]
- Wang, X.S.; Zhou, Y.; Jiang, Y.; Sun, C. The removal of basic dyes from aqueous solutions using agricultural by-products. J. Hazard. Mater. 2008, 157, 374–385. [Google Scholar] [CrossRef] [PubMed]
- Nasseh, N.; Taghavi, L.; Barikbin, B.; Harifi-Mood, A.R. The removal of Cr (VI) from aqueous solution by almond green hull waste material: Kinetic and equilibrium studies. Water Reuse Desalination 2016, 7, 449–460. [Google Scholar] [CrossRef]
- Ozmen, M.; Can, K.; Arslan, G.; Tor, A.; Cengeloglu, Y.; Ersoz, M. Adsorption of Cu (II) from aqueous solution by using modified Fe3O4 magnetic nanoparticles. Desalination 2010, 254, 162–169. [Google Scholar] [CrossRef]
- Liu, Q.-S.; Zheng, T.; Wang, P.; Guo, L. Preparation and characterization of activated carbon from bamboo by microwave-induced phosphoric acid activation. Ind. Crops Prod. 2010, 31, 233–238. [Google Scholar] [CrossRef]
- Nasseh, N.; Khosravi, R.; Rumman, G.A.; Ghadirian, M.; Eslami, H.; Khoshnamvand, M.; Al-Musawi, T.; Khosravi, A. Adsorption of Cr (VI) ions onto powdered activated carbon synthesized from Peganum harmala seeds by ultrasonic waves activation. Environ. Technol. Innov. 2021, 21, 101277. [Google Scholar] [CrossRef]
- Suganya, S. Influence of ultrasonic waves on preparation of active carbon from coffee waste for the reclamation of effluents containing Cr (VI) ions. J. Ind. Eng. Chem. 2018, 60, 418–430. [Google Scholar]
- Shadravan, A.; Goh, P.S.; Ismail, A.F. Nanomaterials for Pressure Retarded Osmosis. In Advances in Water Desalination Technologies; 2021; pp. 583–618. Available online: https://www.worldscientific.com/doi/abs/10.1142/9789811226984_0016 (accessed on 4 September 2021).
- Liu, Q.; Zhong, L.B.; Zhao, Q.B.; Frear, C.; Zheng, Y.M. Synthesis of Fe3O4/polyacrylonitrile composite electrospun nanofiber mat for effective adsorption of tetracycline. ACS Appl. Mater. Interfaces 2015, 7, 14573–14583. [Google Scholar] [CrossRef] [PubMed]
- Wang, Y.; Zhang, H.; Chen, L. Ultrasound enhanced catalytic ozonation of tetracycline in a rectangular air-lift reactor. Catal. Today 2011, 175, 283–292. [Google Scholar] [CrossRef]
- Kakavandi, B.; Takdastan, A.; Jaafarzadeh, N.; Azizi, M.; Mirzaei, A.; Azari, A. Application of Fe3O4@ C catalyzing heterogeneous UV-Fenton system for tetracycline removal with a focus on optimization by a response surface method. J. Photochem. Photobiol. A Chem. 2016, 314, 178–188. [Google Scholar] [CrossRef]
- Federation, W.E.; APH Association. Standard Methods for the Examination of Water and Wastewater; American Public Health Association (APHA): Washington, DC, USA, 2005. [Google Scholar]
- Mirsoleimani-azizi, S.M.; Setoodeh, P.; Zeinali, S.; Rahimpour, M.R. Tetracycline antibiotic removal from aqueous solutions by MOF-5: Adsorption isotherm, kinetic and thermodynamic studies. J. Environ. Chem. Eng. 2018, 6, 6118–6130. [Google Scholar] [CrossRef]
- Chelli, V.R.; Golder, A.K. Ag-doping on ZnO support mediated by bio-analytes rich in ascorbic acid for photocatalytic degradation of dipyrone drug. Chemosphere 2018, 208, 149–158. [Google Scholar] [CrossRef]
- Gómez-Pacheco, C.; Sánchez-Polo, M.; Rivera-Utrilla, J.; López-Peñalver, J.J. Tetracycline degradation in aqueous phase by ultraviolet radiation. Chem. Eng. J. 2012, 187, 89–95. [Google Scholar] [CrossRef]
- Elmolla, E.S.; Chaudhuri, M. Photocatalytic degradation of amoxicillin, ampicillin and cloxacillin antibiotics in aqueous solution using UV/TiO2 and UV/H2O2/TiO2 photocatalysis. Desalination 2010, 252, 46–52. [Google Scholar] [CrossRef]
- Al-Jubouri, S.M.; Holmes, S.M. Immobilization of cobalt ions using hierarchically porous 4A zeolite-based carbon composites: Ion-exchange and solidification. J. Water Process. Eng. 2020, 33, 101059. [Google Scholar] [CrossRef]
- Chitra, P.; Muthusamy, A.; Jayaprakash, R.; Kumar, E.R. Effect of ultrasonication on particle size and magnetic properties of polyaniline NiCoFe2O4 nanocomposites. J. Magn. Magn. Mater. 2014, 366, 55–63. [Google Scholar] [CrossRef]
- Ahamad, T.; Naushad, M.; Al-Shahrani, T.; Al-Hokbany, N.; Alshehri, S.M. Preparation of chitosan based magnetic nanocomposite for tetracycline adsorption: Kinetic and thermodynamic studies. Int. J. Biol. Macromol. 2020, 147, 258–267. [Google Scholar] [CrossRef]
- Alqadami, A.A.; Naushad, M.; Abdalla, M.A.; Ahamad, T.; AlOthman, Z.A.; Alshehri, S.M.; Ghfar, A.A. Efficient removal of toxic metal ions from wastewater using a recyclable nanocomposite: A study of adsorption parameters and interaction mechanism. J. Clean. Prod. 2017, 156, 426–436. [Google Scholar] [CrossRef]
- Qiao, D.; Li, Z.; Duan, J.; He, X. Adsorption and photocatalytic degradation mechanism of magnetic graphene oxide/ZnO nanocomposites for tetracycline contaminants. Chem. Eng. J. 2020, 400, 125952. [Google Scholar] [CrossRef]
- Nasseh, N.; Barikbin, B.; Taghavi, L. Photocatalytic degradation of tetracycline hydrochloride by FeNi3/SiO2/CuS magnetic nanocomposite under simulated solar irradiation: Efficiency, stability, kinetic and pathway study. Environ. Technol. Innov. 2020, 20, 101035. [Google Scholar] [CrossRef]
- López-Peñalver, J.J.; Sánchez-Polo, M.; Gómez-Pacheco, C.V.; Rivera-Utrilla, J. Photodegradation of tetracyclines in aqueous solution by using UV and UV/H2O2 oxidation processes. J. Chem. Technol. Biotechnol. 2010, 85, 1325–1333. [Google Scholar] [CrossRef]
- Rasheed, H.U.; Lv, X.; Wei, W.; Sam, D.K.; Ullah, N.; Xie, J.; Zhu, W. Highly efficient photocatalytic degradation of the Tetracycline hydrochloride on the α-Fe2O3@ CN composite under the visible light. J. Environ. Chem. Eng. 2019, 7, 103322. [Google Scholar] [CrossRef]
- Tiwari, A.; Shukla, A.; Tiwari, D.; Lee, S.M. Au-nanoparticle/nanopillars TiO2 meso-porous thin films in the degradation of tetracycline using UV-A light. J. Ind. Eng. Chem. 2019, 69, 141–152. [Google Scholar] [CrossRef]
- Pablos, J.; Abrusci, C.; Marín, I.; López-Marín, J.; Catalina, F.; Espí, E.; Corrales, T. Photodegradation of polyethylenes: Comparative effect of Fe and Ca-stearates as pro-oxidant additives. Polym. Degrad. Stab. 2010, 95, 2057–2064. [Google Scholar] [CrossRef]
- Xue, Z.; Wang, T.; Chen, B.; Malkoske, T.; Yu, S.; Tang, Y. Degradation of tetracycline with BiFeO3 prepared by a simple hydrothermal method. Materials 2015, 8, 6360–6378. [Google Scholar] [CrossRef] [PubMed]
- Ma, Y.; Gao, N.; Li, C. Degradation and pathway of tetracycline hydrochloride in aqueous solution by potassium ferrate. Environ. Eng. Sci. 2012, 29, 357–362. [Google Scholar] [CrossRef]
- Safari, G.; Hoseini, M.; Seyedsalehi, M.; Kamani, H.; Jaafari, J.; Mahvi, A.H. Photocatalytic degradation of tetracycline using nanosized titanium dioxide in aqueous solution. Int. J. Environ. Sci. Technol. 2014, 12, 603–616. [Google Scholar] [CrossRef] [Green Version]
- Yang, L.; Liya, E.Y.; Ray, M.B. Degradation of paracetamol in aqueous solutions by TiO2 photocatalysis. Water Res. 2008, 42, 3480–3488. [Google Scholar] [CrossRef] [PubMed]
- Saitoh, T.; Shibata, K.; Fujimori, K.; Ohtani, Y. Rapid removal of tetracycline antibiotics from water by coagulation-flotation of sodium dodecyl sulfate and poly (allylamine hydrochloride) in the presence of Al (III) ions. Sep. Purif. Technol. 2017, 187, 76–83. [Google Scholar] [CrossRef]
- Rashid, J.; Barakat, M.A.; Ruzmanova, Y.; Chianese, A. Fe 3 O 4/SiO 2/TiO 2 nanoparticles for photocatalytic degradation of 2-chlorophenol in simulated wastewater. Environ. Sci. Pollut. Res. 2015, 22, 3149–3157. [Google Scholar] [CrossRef]
- Nosrati, R.; Olad, A.; Maramifar, R. Degradation of ampicillin antibiotic in aqueous solution by ZnO/polyaniline nanocomposite as photocatalyst under sunlight irradiation. Environ. Sci. Pollut. Res. 2012, 19, 2291–2299. [Google Scholar] [CrossRef] [PubMed]
- Zhang, M.; Song, W.; Chen, Q.; Miao, B.; He, W. One-pot synthesis of magnetic Ni@ Mg (OH) 2 core–shell nanocomposites as a recyclable removal agent for heavy metals. ACS Appl. Mater. Interfaces 2015, 7, 1533–1540. [Google Scholar] [CrossRef] [PubMed]
- Eslami, A.; Amini, M.M.; Yazdanbakhsh, A.R.; Mohseni-Bandpei, A.; Safari, A.A.; Asadi, A. N,S co-doped TiO2 nanoparticles and nanosheets in simulated solar light for photocatalytic degradation of non-steroidal anti-inflammatory drugs in water: A comparative study. Chem. Technol. Biotechnol. 2015, 91, 2693–2704. [Google Scholar] [CrossRef]
- Lam, L.S. Photocatalytic Degradation of Sunset Yellow Dye over Zinc Oxide Nanoparticles under Fluorescent Light Irradiation; UTAR: Perak, Malaysia, 2016. [Google Scholar]
- Lu, Z.; Zhao, X.; Zhu, Z.; Yan, Y.; Shi, W.; Dong, H.; Ma, Z.; Nailing, G.; Youshan, W.; Huang, H. Enhanced recyclability, stability, and selectivity of CdS/C@ Fe3O4 nanoreactors for orientation photodegradation of ciprofloxacin. Chem. A Eur. J. 2015, 21, 18528–18533. [Google Scholar] [CrossRef] [PubMed]


| UVC | |||
|---|---|---|---|
| Concentration (mg/L) | Equation | K0 (min−1) | R2 |
| 5 | Y = 0.025x + 1.084 | 25 × 10−3 | 0.9824 |
| 10 | Y = 0.0181x + 1.0046 | 18.1 × 10⁻³ | 0.9715 |
| 20 | Y = 0.0138x + 0.8292 | 13.8 × 10⁻³ | 0.9895 |
| 50 | Y = 0.0116x + 0.778 | 11.6 × 10⁻³ | 0.9631 |
| t1/2 = 0.693/K0 | |||
| UVA | |||
| Concentration (mg/L) | Equation | K0 (min−1) | R2 |
| 5 | Y = 0.0257x + 1.0758 | 25.7 × 10⁻³ | 0.9933 |
| 10 | Y = 0.0157x + 0.9309 | 15.7 × 10⁻³ | 0.9938 |
| 20 | Y = 0.0106x + 0.9305 | 10.6 × 10⁻³ | 0.9849 |
| 50 | Y = 0.0096x + 0.8483 | 9.6 × 10⁻³ | 0.9849 |
| t1/2 = 0.693/K0 | |||
Publisher’s Note: MDPI stays neutral with regard to jurisdictional claims in published maps and institutional affiliations. |
© 2021 by the authors. Licensee MDPI, Basel, Switzerland. This article is an open access article distributed under the terms and conditions of the Creative Commons Attribution (CC BY) license (https://creativecommons.org/licenses/by/4.0/).
Share and Cite
Nasseh, N.; Khosravi, R.; Mazari Moghaddam, N.s.; Rezania, S. Effect of UVC and UVA Photocatalytic Processes on Tetracycline Removal Using CuS-Coated Magnetic Activated Carbon Nanocomposite: A Comparative Study. Int. J. Environ. Res. Public Health 2021, 18, 11163. https://0-doi-org.brum.beds.ac.uk/10.3390/ijerph182111163
Nasseh N, Khosravi R, Mazari Moghaddam Ns, Rezania S. Effect of UVC and UVA Photocatalytic Processes on Tetracycline Removal Using CuS-Coated Magnetic Activated Carbon Nanocomposite: A Comparative Study. International Journal of Environmental Research and Public Health. 2021; 18(21):11163. https://0-doi-org.brum.beds.ac.uk/10.3390/ijerph182111163
Chicago/Turabian StyleNasseh, Negin, Rasoul Khosravi, Narjes sadat Mazari Moghaddam, and Shahabaldin Rezania. 2021. "Effect of UVC and UVA Photocatalytic Processes on Tetracycline Removal Using CuS-Coated Magnetic Activated Carbon Nanocomposite: A Comparative Study" International Journal of Environmental Research and Public Health 18, no. 21: 11163. https://0-doi-org.brum.beds.ac.uk/10.3390/ijerph182111163