
The Nutritional Condition of the Spanish Soldier: “Spain. Nutrition Survey of the Armed Forces, a Report by the Interdepartmental Committee on Nutrition for National Defence 1958”


Abstract
:1. Introduction
2. Materials and Methods
2.1. Origin, Objectives, and Methods of the Survey
2.2. Data and Methodology
3. Results
3.1. Analysis of the Surveyed Population Subsection
3.2. Clinical and Biochemical Examinations Results
3.3. Dietary Survey
4. Discussion
5. Conclusions
Author Contributions
Funding
Institutional Review Board Statement
Informed Consent Statement
Data Availability Statement
Acknowledgments
Conflicts of Interest
Appendix A

| Tabulated Diseases | Disease Diagnosed | |
|---|---|---|
| Group | Detailed Examination | Brief Examination |
| Enlarged glands | Thyroid | X |
| Parotid | ||
| Submaxilliary | ||
| Facial epidermis | Nasolabial Seborrhea | X |
| Other Seborrhea | ||
| Erythema | ||
| Pigmentation | ||
| Ocular | Thickened Conjunctivae | |
| Pinguecula | ||
| Bitot’s Spots | X | |
| Circumcorneal Injection | ||
| Conjunctival Injection | ||
| Blepharitis | ||
| Labial | Angular Lesions | X |
| Angular Scars | X | |
| Cheilosis | X | |
| Lingual | Filiform Atrophy | X |
| Fungiform Atrophy | ||
| Papillary Hypertrophy | ||
| Furrows | ||
| Fissures or Erosions | ||
| Serrations | ||
| Red, Tip or Margins | ||
| Magenta Tongue | X | |
| Geographic Tongue | ||
| Periodontal | Red or swollen | |
| Atrophy of Papillae | ||
| Recession | ||
| Bleeding or Scorbutic | X | |
| Dental | Caries | |
| Edentulous | ||
| Worn | ||
| Fluorosis | ||
| Malposition | ||
| Anywhere | X | |
| Follicular Keratosis | Arms | |
| Back | ||
| Thighs | ||
| Buttocks | ||
| Chest | ||
| Cutaneous | Perifolliculosis | |
| Xerosis | ||
| Acneform Eruption | ||
| Scrotal Dermatitis | X | |
| Hyperpigmentation | ||
| Incidence < 0.1% (Not considered) | Loss of Ankle Jerks | X |
| Loss of Vibratory Sense | ||
| Skinfold (*) | Arm | |
| Scapula | ||
| Infectious | Malaria | |
| Typhoid | ||
| Brucellosis | ||
| Location | Branch | Residence | Father’s Occupation | ||||||||||||
|---|---|---|---|---|---|---|---|---|---|---|---|---|---|---|---|
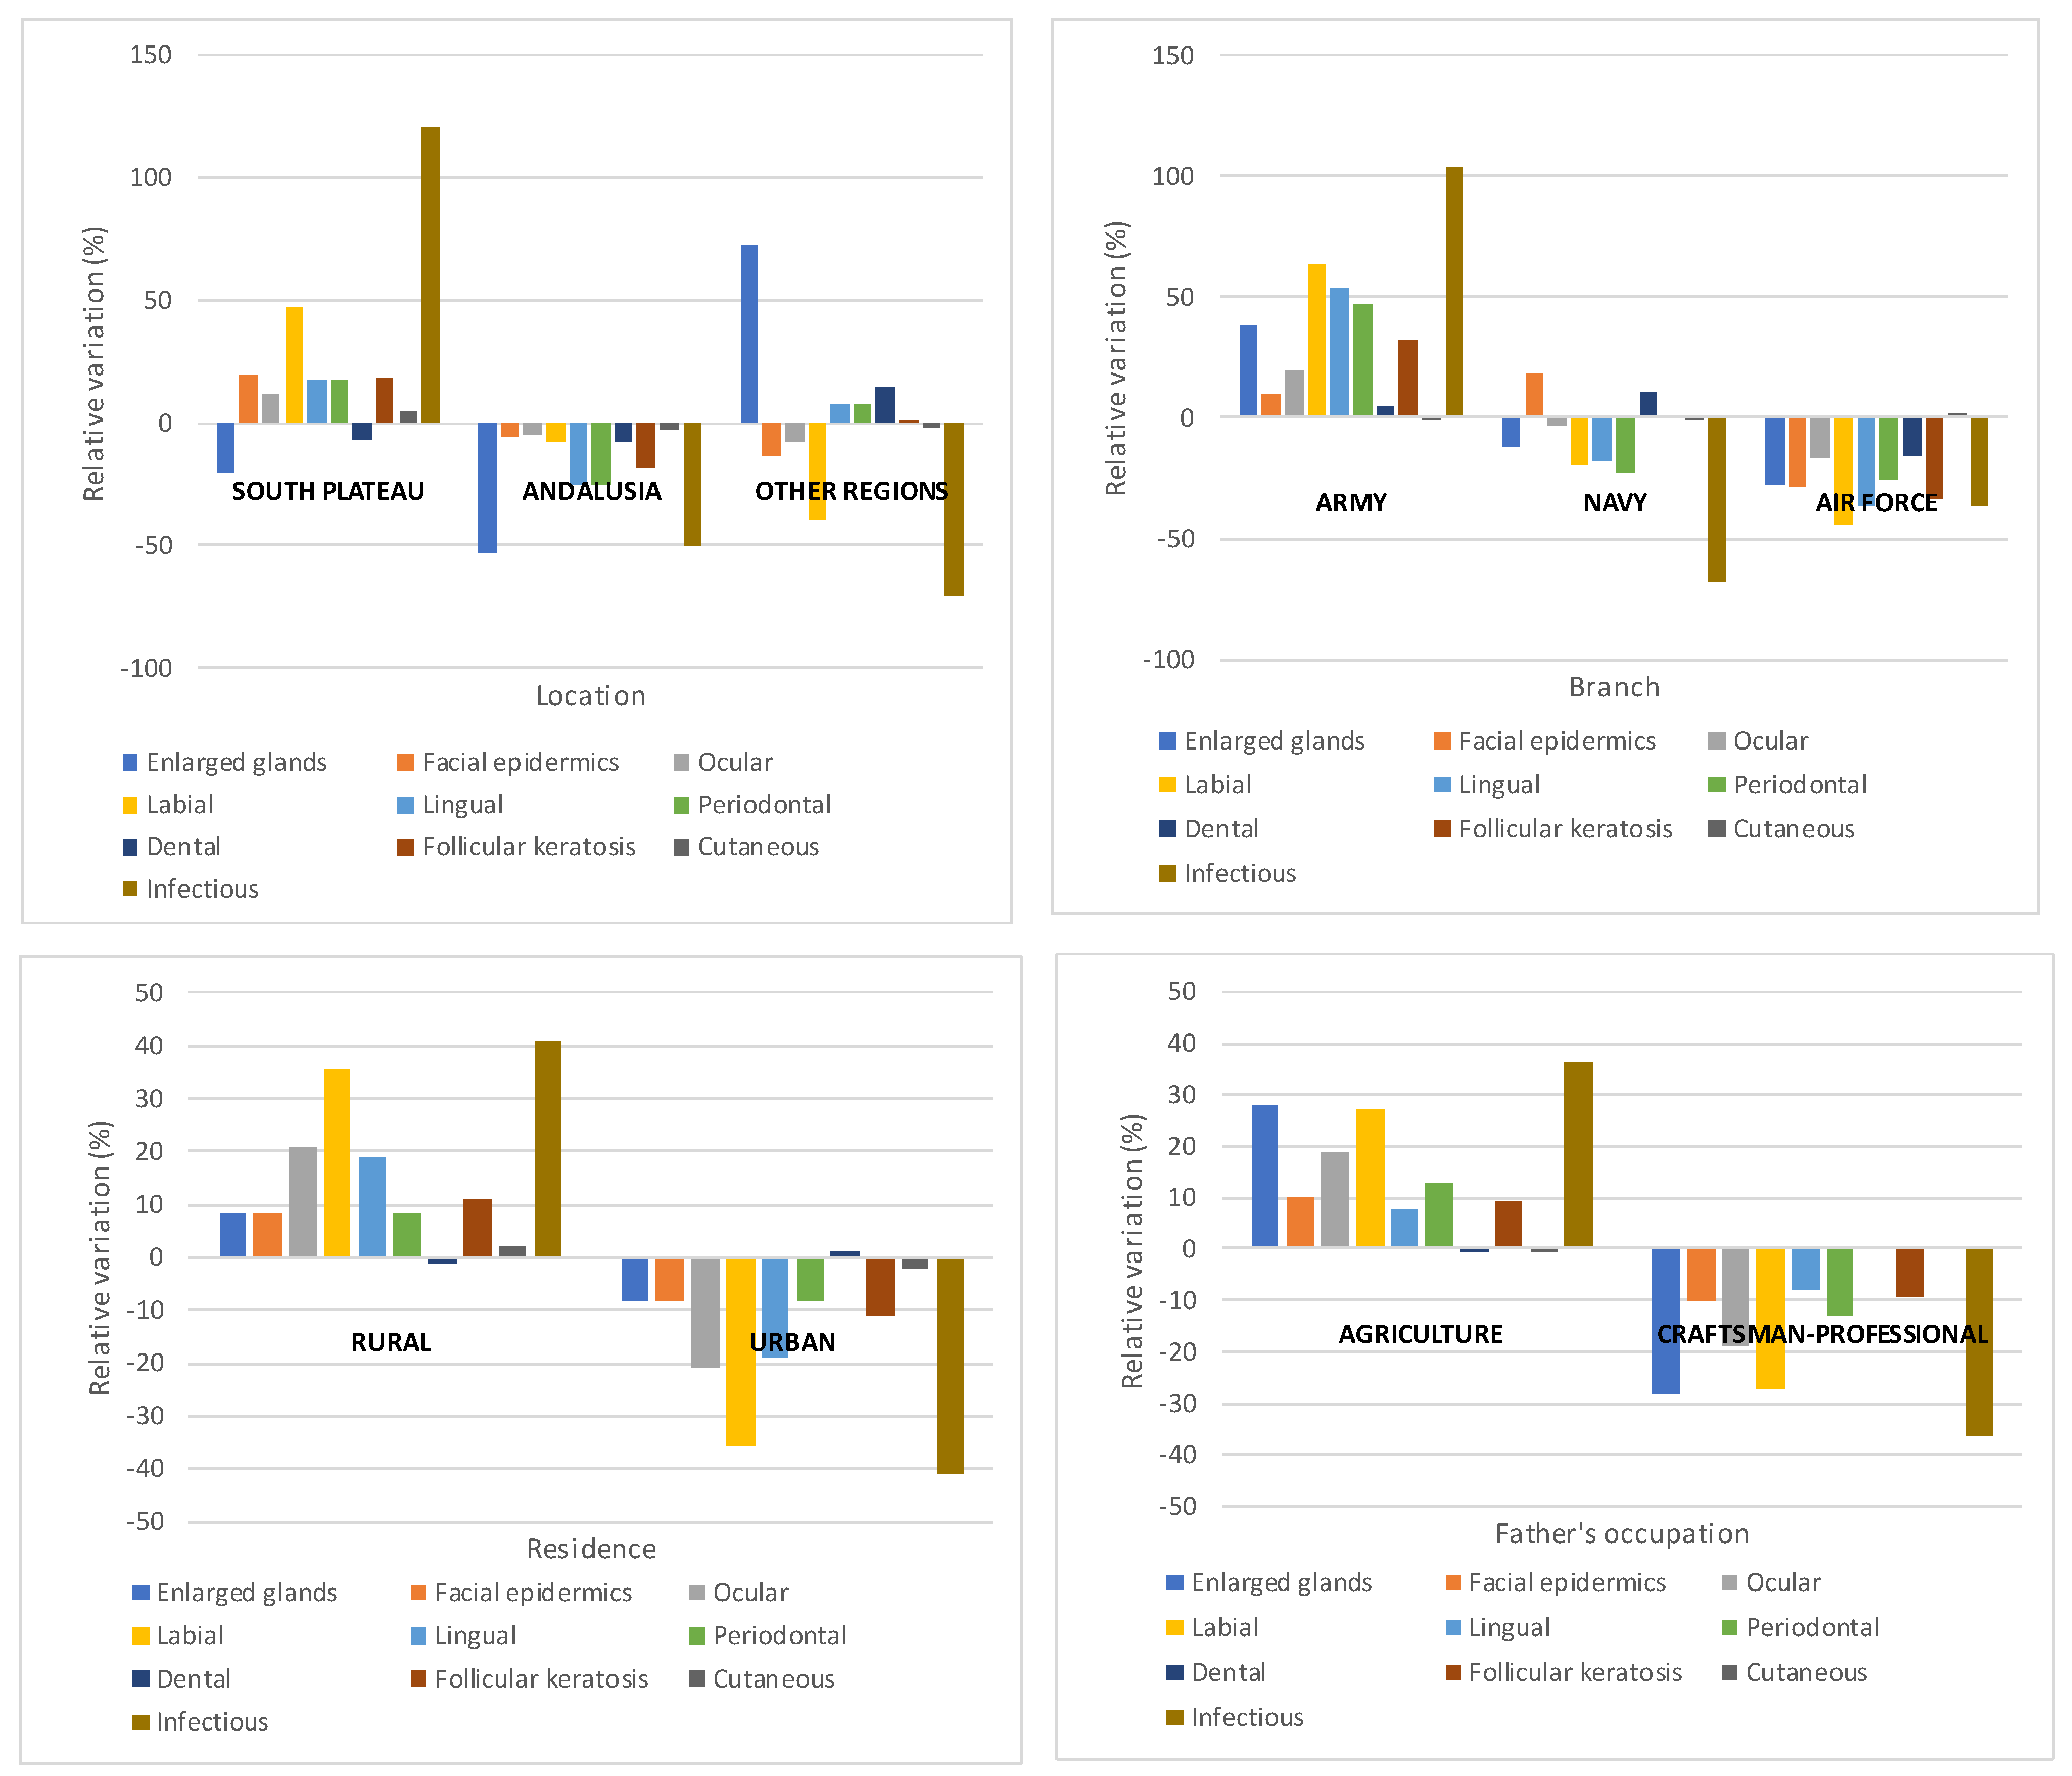
| Diseases | South Plateau | Andalusia | Other Regions | Average | Army | Navy | Air Force | Average | Rural | Urban | Average | Agriculture | Craftsman- Professional | Average | Total |
| Enlarged glands | 3.48 | 2.06 | 7.49 | 4.34 | 4.90 | 3.13 | 2.58 | 3.54 | 4.50 | 3.80 | 4.15 | 4.90 | 2.74 | 3.82 | 4.20 |
| Facial epidermis | 33.79 | 26.91 | 24.46 | 28.39 | 30.40 | 32.69 | 19.81 | 27.63 | 30.40 | 25.70 | 28.05 | 30.60 | 25.01 | 27.81 | 28.90 |
| Ocular | 65.42 | 56.10 | 54.41 | 58.64 | 64.36 | 52.49 | 45.08 | 53.98 | 66.60 | 43.70 | 55.15 | 70.11 | 47.89 | 59.00 | 59.30 |
| Labial | 45.43 | 28.62 | 18.63 | 30.89 | 39.88 | 19.47 | 13.61 | 24.32 | 38.90 | 18.50 | 28.70 | 41.10 | 23.67 | 32.38 | 32.40 |
| Lingual | 42.87 | 21.44 | 23.92 | 29.41 | 37.04 | 19.81 | 15.32 | 24.06 | 34.20 | 23.30 | 28.75 | 33.90 | 28.93 | 31.41 | 30.91 |
| Periodontal | 35.44 | 22.73 | 32.44 | 30.21 | 36.30 | 19.18 | 18.40 | 24.63 | 32.40 | 27.50 | 29.95 | 33.30 | 25.76 | 29.53 | 30.82 |
| Dental | 51.23 | 50.83 | 62.70 | 54.92 | 55.79 | 59.19 | 45.27 | 53.41 | 54.20 | 55.40 | 54.80 | 54.70 | 54.79 | 54.74 | 54.50 |
| Follicular keratosis | 73.86 | 50.81 | 62.50 | 62.39 | 72.13 | 55.05 | 36.40 | 54.53 | 67.90 | 54.50 | 61.20 | 68.90 | 57.42 | 63.16 | 63.59 |
| Cutaneous | 28.63 | 26.33 | 26.70 | 27.22 | 27.30 | 27.08 | 27.91 | 27.43 | 27.60 | 26.50 | 27.05 | 27.50 | 27.79 | 27.64 | 26.98 |
| Infectious | 17.30 | 3.89 | 2.31 | 7.83 | 11.63 | 1.87 | 3.62 | 5.71 | 10.80 | 4.50 | 7.65 | 11.50 | 5.35 | 8.43 | 8.90 |
| Branch | Region | Armed | Spanish | ||||||||
|---|---|---|---|---|---|---|---|---|---|---|---|
| Item | Modality | Army | Air Force | Navy | Variation Range | South | Andalusia | Other | Variation Range | Forces | Population |
| Max-Min (%) | Plateau | Regions | Max-Min (%) | Total | 1951–1954 | ||||||
| Calories | Estimated | 3449.8 | 3316.2 | 3159.3 | 9.2 | 3406.7 | 3321.6 | 3406.3 | 2.6 | 3330.0 | 2553.0 |
| Analysed | 3442.9 | 3223.8 | 3115.8 | 10.5 | 3222.4 | 3441.6 | 3349.9 | 6.8 | 3270.0 | ||
| Protein (gm) | Estimated | 108.0 | 102.7 | 114.4 | 11.4 | 105.2 | 112.7 | 104.7 | 7.7 | 106.0 | 68.0 |
| Analysed | 115.1 | 105.0 | 112.8 | 9.6 | 105.7 | 122.0 | 105.4 | 15.8 | 109.0 | ||
| Fat (gm) | Estimated | 83.5 | 97.4 | 89.4 | 16.6 | 87.4 | 83.2 | 97.5 | 17.2 | 87.0 | 80.0 |
| Analysed | 76.0 | 69.9 | 60.6 | 25.4 | 80.4 | 64.2 | 72.0 | 25.2 | 73.0 | ||
| Calcium (gm) | Estimated | 0.5 | 0.6 | 0.6 | 10.2 | 0.5 | 0.5 | 0.5 | 5.8 | 0.5 | 0.5 |
| Analysed | 1.1 | 1.1 | 1.0 | 7.0 | 1.1 | 1.1 | 0.9 | 25.4 | 1.0 | ||
| Iron (mg) | Estimated | 19.1 | 17.4 | 20.0 | 14.6 | 17.9 | 20.3 | 18.3 | 10.9 | 18.0 | 11.0 |
| Analysed | 77.4 | 61.0 | 70.3 | 26.9 | 70.4 | 77.2 | 69.8 | 10.7 | 72.0 | ||
| Total Vitamin A (I.U) | Estimated | 1293.9 | 2797.8 | 2213.0 | 116.2 | 1416.8 | 1976.2 | 1714.5 | 39.5 | 1690.0 | 2205.0 |
| Analysed | 1904.5 | 2901.2 | 3271.4 | 52.3 | 2227.1 | 2466.1 | 2291.1 | 10.7 | 2570.0 | ||
| Thiamine (mg) | Estimated | 1.7 | 1.4 | 1.4 | 17.9 | 1.6 | 1.6 | 1.5 | 5.5 | 1.5 | 1.2 |
| Analysed | 1.5 | 1.3 | 1.6 | 21.2 | 1.5 | 1.6 | 1.1 | 43.2 | 1.4 | ||
| Riboflavin (mg) | Estimated | 1.2 | 1.3 | 1.5 | 25.3 | 1.2 | 1.4 | 1.3 | 16.8 | 1.3 | 1.0 |
| Analysed | 1.0 | 1.1 | 1.1 | 9.6 | 1.0 | 1.1 | 1.2 | 23.7 | 1.1 | ||
| Niacin (mg) | Estimated | 16.2 | 15.7 | 14.3 | 13.7 | 15.1 | 15.6 | 18.0 | 19.2 | 15.7 | 12.0 |
| Analysed | 20.3 | 17.3 | 19.0 | 17.4 | 16.0 | 22.9 | 18.7 | 43.9 | 18.6 | ||
| Vitamin C (mg) | Estimated | 62.1 | 58.7 | 51.6 | 20.3 | 55.4 | 57.1 | 78.3 | 41.3 | 63.0 | 113.0 |
| Analysed | 67.9 | 75.2 | 73.1 | 10.6 | 52.8 | 81.9 | 82.1 | 55.1 | 70.0 |
References
- Nicolau, R. Población, salud y actividad. In Estadísticas Históricas de España Siglos XIX y XX; Carreras, A., Tafunell, X., Eds.; Fundación FBBVA: Bilbao, Spain, 2005; pp. 78–154. [Google Scholar]
- Castello Botia, I. Evolución de la mortalidad asociada a desnutrición en la España contemporánea: 1900–1974. Rev. Demografia. Hist. XXVIII II 2011, 28, 25–49. [Google Scholar]
- Sabaté, F. Las encuestas de alimentación y nutrición en España. Bibliografía 1939–1979. Rev. Esp. Salud Pública 1984, 58, 117–132. [Google Scholar]
- Varela, G.; Moreiras-Varela, O.; Vidal, C. Niveles de nutrición en las diferentes regiones y estratos sociales. In Contribución al estudio de la Alimentación Española; Instituto de Desarrollo Económico: Granada, Spain, 1968. [Google Scholar]
- Varela Mosquera, G.; Garcia Rodriguez, D.; Moreiras-Varela, O. La nutrición de los Españoles. Diagnóstico y Recomendaciones; Estudios del Instituto de Desarrollo Económico: Madrid, Spain, 1971; pp. 17–64. [Google Scholar]
- Tormo Santamaria, M.; Trescastro López, E.M.; Galiana Sanchez, M.E.; Pascual Artiaga, M.; Bernabeu-Mestre, J. Malnutrición y desigualdades en la España del desarrollismo: Las encuetas rurales de alimentación y nutrición. Nutr. Hosp. 2018, 35, 116–122. [Google Scholar] [CrossRef] [PubMed]
- Del Cura, M.I.; Huertas, R. Alimentación y enfermedad en tiempos de hambre. In España 1937–1947; CSIC: Madrid, Spain, 2007. [Google Scholar]
- Martínez Carrión, J.M. Biología, historia y medio ambiente, La estatura como espejo del nivel de vida de la población española. Ayer 2002, 46, 93–122. [Google Scholar]
- Fatjó Gómez, P.; Muñoz Pradas, F.; Nicolau Nos, R. Presentación del estudio médico y nutricional de las Fuerzas Armadas españolas realizado en 1958 por el International Commitee on Nutrition on National Defense de los Estados Unidos. Nutr. Hosp. 2018, 35, 91–98. [Google Scholar] [CrossRef]
- Carreras, A.; Tafunell, X. Historia Económica de la España Contemporánea (1789–2009); Editorial Crítica: Barcelona, Spain, 2010; pp. 303–331. [Google Scholar]
- Del Arco Blanco, M.A. Famine in Spain during Franco’s Dictatorship, 1939–1952. J. Contemp. Hist. 2021, 56, 3–27. [Google Scholar]
- Sandstead, H.H. Origins of the Interdepartmental Committee on Nutrition for National Defense, and a Brief Note Concerning Its Demise. J. Nutr. 2005, 135, 1257–1262. [Google Scholar] [CrossRef] [PubMed] [Green Version]
- Schaefer, A.E.; Berry, F.B. U.S. Interest in World Nutrition. Public Health Rep. 1960, 75, 679. [Google Scholar]
- Spain Nutrition Survey of the Armed Forces, a Report by the Interdepartmental Committee on Nutrition for National Defense; National Institute of Health: Bethesda, MD, USA, 1958.
- Trigueros Peñalver, F. Sobre la alimentación del soldado. Ejército. Rev. Ilus. De Las Armas Y Los Serv. 1959, 231, 16–21. [Google Scholar]
- Martínez de Marañón, I.H. Subsistencias y Alimentación de Aplicación Militar; Artes Gráficas C.I.M: Madrid, Spain, 1960. [Google Scholar]
- Alto Estado Mayor. Proceedings of the Fifth Armed Forces International Nutrition Conference, Madrid, Spain, 24–30 April 1962; Available online: https://books.google.co.jp/books?id=c5VMAQAAMAAJ&pg=PA11&lpg=PA11&dq=Fifth+Armed+Forces+International+Nutrition+Conference,+Madrid,+Spain&source=bl&ots=nZmd3ZTomM&sig=ACfU3U1nPP1H6uID5c3YvkZY5bN8Yf8QTw&hl=zh-CN&sa=X&ved=2ahUKEwiZ_O_0wr_0AhXPyYsBHbVPDmQQ6AF6BAgSEAM#v=onepage&q=Fifth%20Armed%20Forces%20International%20Nutrition%20Conference%2C%20Madrid%2C%20Spain&f=false (accessed on 1 October 2020).
- Ministerio del Ejército. Orden del 16 de Junio-Por la que se crea el Departamento de Nutrición de las Fuerzas Armadas. In Colección Legislativa del Ejército; Servicio de Publicaciones del Ministerio del Ejército-Diario Oficial: Madrid, Spain, 1966; pp. 92–93. [Google Scholar]
- Alto Estado Mayor. Manual de Alimentación de las Fuerzas Armadas; Imprenta del Servicio Geográfico del Ejército: Madrid, Spain, 1968. [Google Scholar]
- Alto Estado Mayor. Escalón del Servicio Estadístico Militar. Anu. Estad. Mil. 1965, 8, 101. [Google Scholar]
- Burt, J.E.; Barber, G.M.; Rigby, D. Elementary Statistics for Geographers, 3rd ed.; The Gilford Press: New York, NY, USA, 2003; pp. 315–316. [Google Scholar]
- Rodrigo Fernández, R. El Ejército de Tierra en la España de posguerra (1939–1947): Instrumento y Pilar en la Consolidación del Régimen Franquista. Ph.D. Thesis, Universidad Autónoma de Madrid, Madrid, Spain, 2017. [Google Scholar]
- Ley de 8 de agosto de 1940 por la que se modifica la Legislación vigente sobre Reclutamiento. Boletín Of. Del Estado. 1940, 235, 5810–5814.
- Reglamento Provisional para el Reclutamiento y Reemplazo del Ejército, aprobado por Decreto de 6 de Abril de 1943. Colecc. Legis. Del Ejército Apend. nº 2 1943, LXIX, 141–154.
- Reglamento Provisional para la aplicación de la Ley de Reclutamiento y Reemplazo de la Marinería de la Armada de 14 de Diciembre de 1933, aprobado por Decreto de 29 de Agosto de 1935. Colecc. Legis. Del Ejército Apend. nº 6 1935, LXI, 45–54.
- Decreto de 11 de enero de 1946 por el que se crean las Juntas de Clasificación y Revisión del Ejército del Aire. Minist. Del Aire Colecc. Legis. 1946, VI, 41–43.
- Gomez Redondo, R. La Mortalidad Infantil Española en el Siglo XX; CIS-Siglo XXI: Madrid, Spain, 1992. [Google Scholar]
- Martinelli Lasheras, P. Contribución al estudio de las desigualdades en la España de los ’60: Ingresos y alimentación. Scr. Nova. Rev. Electron. De Geogr. Y Cienc. Soc. 2010, XIII, 305. Available online: http://www.ub.edu/geocrit/sn/sn-305.htm (accessed on 14 May 2021).
- Escudero, A.; Simon, H. Diferencias provinciales de bienestar en la España del siglo XX. Rev. De Hist. Ind. 2012, 49, XXIX, 17–54. [Google Scholar]
- Hernandez Adell, I.; Muñoz Pradas, F.; Pujol Andreu, J. A new statistical methodology for evaluating the diffusion of milk in the Spanish Population: Consumer groups and milk consumption, 1865–1981. Investig. De Hist. Econ. /Econ. Hist. Res. 2019, 15, 23–37. [Google Scholar] [CrossRef] [Green Version]
- Quiroga Valle, G. Estatura, Diferencias Sociales y Regionales y Niveles de Vida en España (1893–1954). Available online: https://dialnet.unirioja.es/servlet/articulo?codigo=97797 (accessed on 14 May 2021).
- Latham, M. Nutrición Humana en el Mundo en Desarrollo; FAO: Roma, Italy, 2002; Available online: https://www.fao.org/3/w0073s/w0073s00.htm#Contents (accessed on 1 October 2020).
- Castillo Ortega, M.E. Bocio y Cretinismo en España: Aproximación Histórica. Ph.D. Thesis, Universidad Complutense, Madrid, Spain, 1992. [Google Scholar]
- Dobado Gonzalez, R. Geografía y desigualdad demográfica y económica de las provincias españolas (siglos XIX–XX). Investig. De Hist. Econ. 2006, 5, 133–170. [Google Scholar] [CrossRef]


| Item | Contents | Number Tables | Tables in Document |
|---|---|---|---|
| Population surveyed (Total sample) | Location, province of birth and other sociodemographic and anthropometric data | ||
| 4 | 4 to 7 | ||
| Brief examination | Percent incidence of clinical findings by location, service, father’s occupation, standard weight and examiner | ||
| 5 | 8 to 12 | ||
| Detailed examination | Percent incidence of clinical findings by location, service, father’s occupation, standard weight and examiner | 5 | 13 to 17 |
| Biochemical examination | Biochemical findings by location, service, father’s occupation, standard weight and other relations with particular diseases | ||
| 7 | 18 to 24 | ||
| Dietary survey | Location, nutrient composition and values some Spanish foods | ||
| 3 | 25 to 27 | ||
| Food waste and daily and seasonal nutrient intakes | 10 | 28 to 37 | |
| Comparison with other food intakes and other information about prices of food | 6 | 38 to 43 | |
| Soldiers | |||||||
|---|---|---|---|---|---|---|---|
| Subjects in Military Region | Born in the Province | Proportions Born | |||||
| Regions | Provinces | (n) | (%) | (n) | (%) | in One of the Three Provinces | in the Province Where They Served |
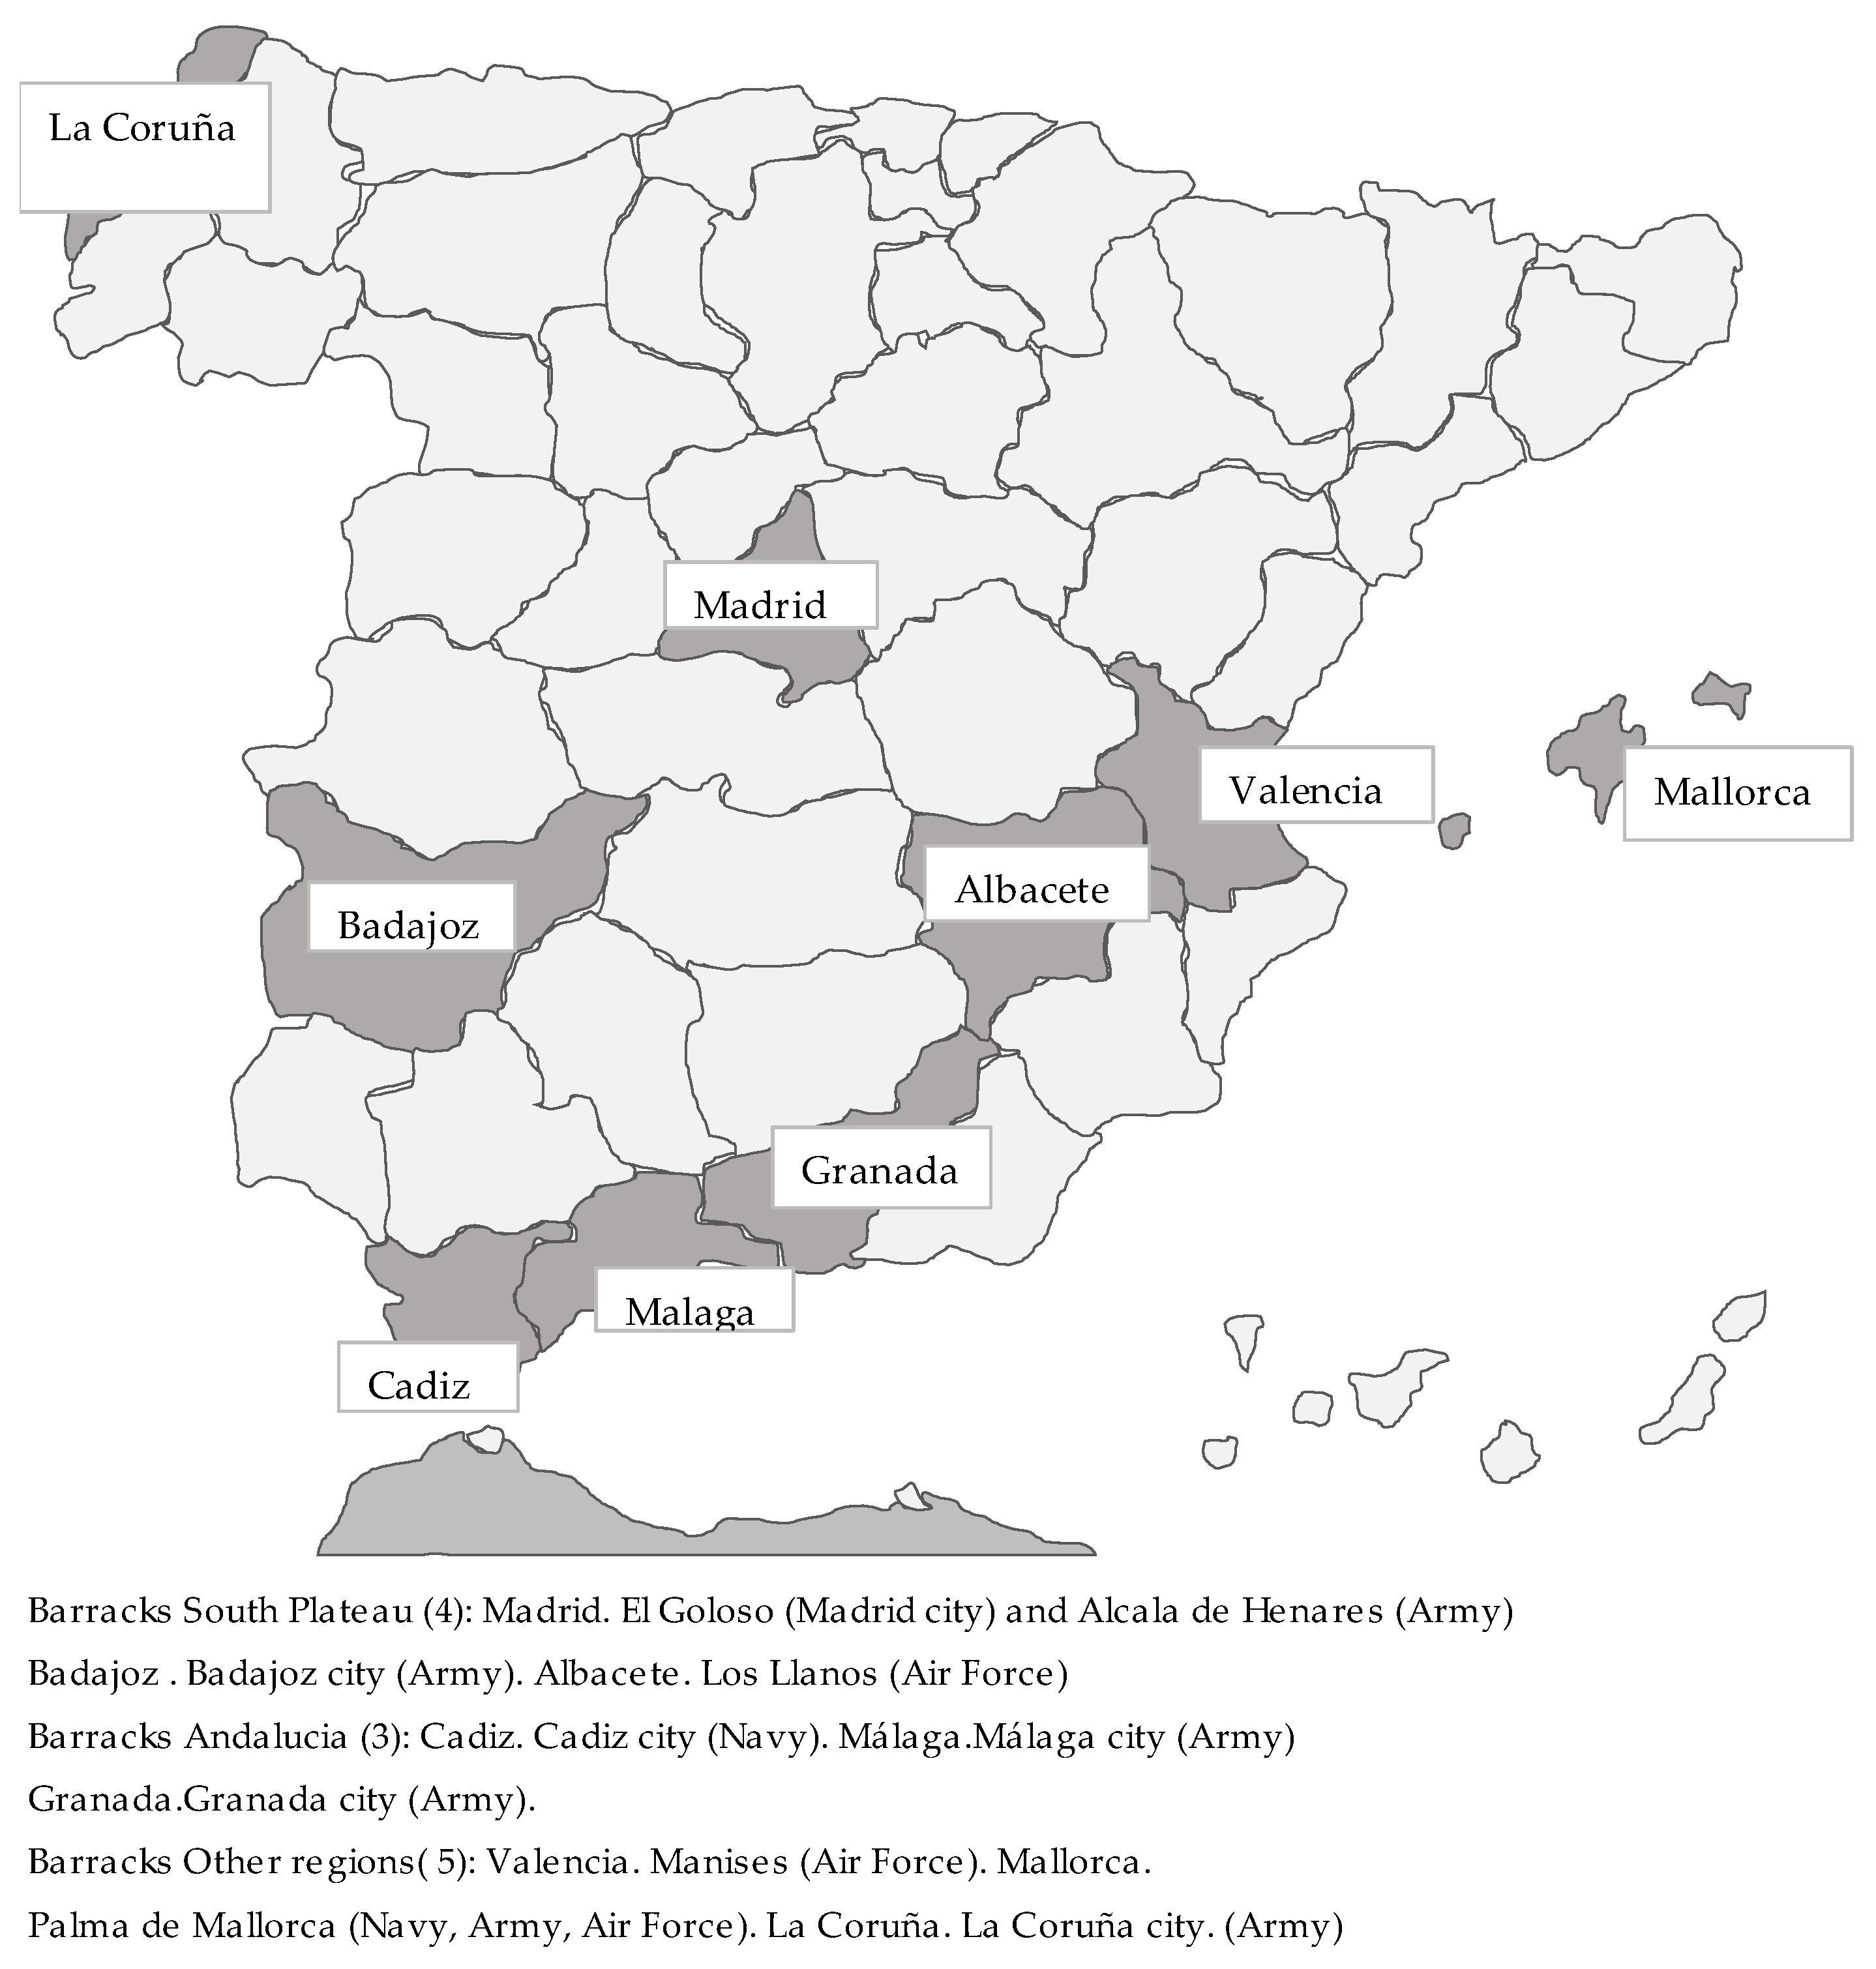
| South Plateau | Madrid, Badajoz, Albacete | 4340 | 40.5 | 2338 | 21.8 | 53.9 | 41.6 |
| Andalusia | Cadiz, Málaga, Granada | 3200 | 29.8 | 2095 | 19.5 | 65.5 | 38.8 |
| Other regions | La Coruña, Valencia and Mallorca | 3187 | 29.7 | 1722 | 16.1 | 54.0 | 43. |
| Other provinces | 4572 | 42.6 | |||||
| Total | 10,727 | 100 | 10,727 | 100.0 | 57.4 | 41.3 | |
| Military | Ranking | Survey | Ranking | Complement | Ranking | Pop(15–24a) |
|---|---|---|---|---|---|---|
| Regions | (%) | (%) | (%) | |||
| (1) | (2) | (3) | ||||
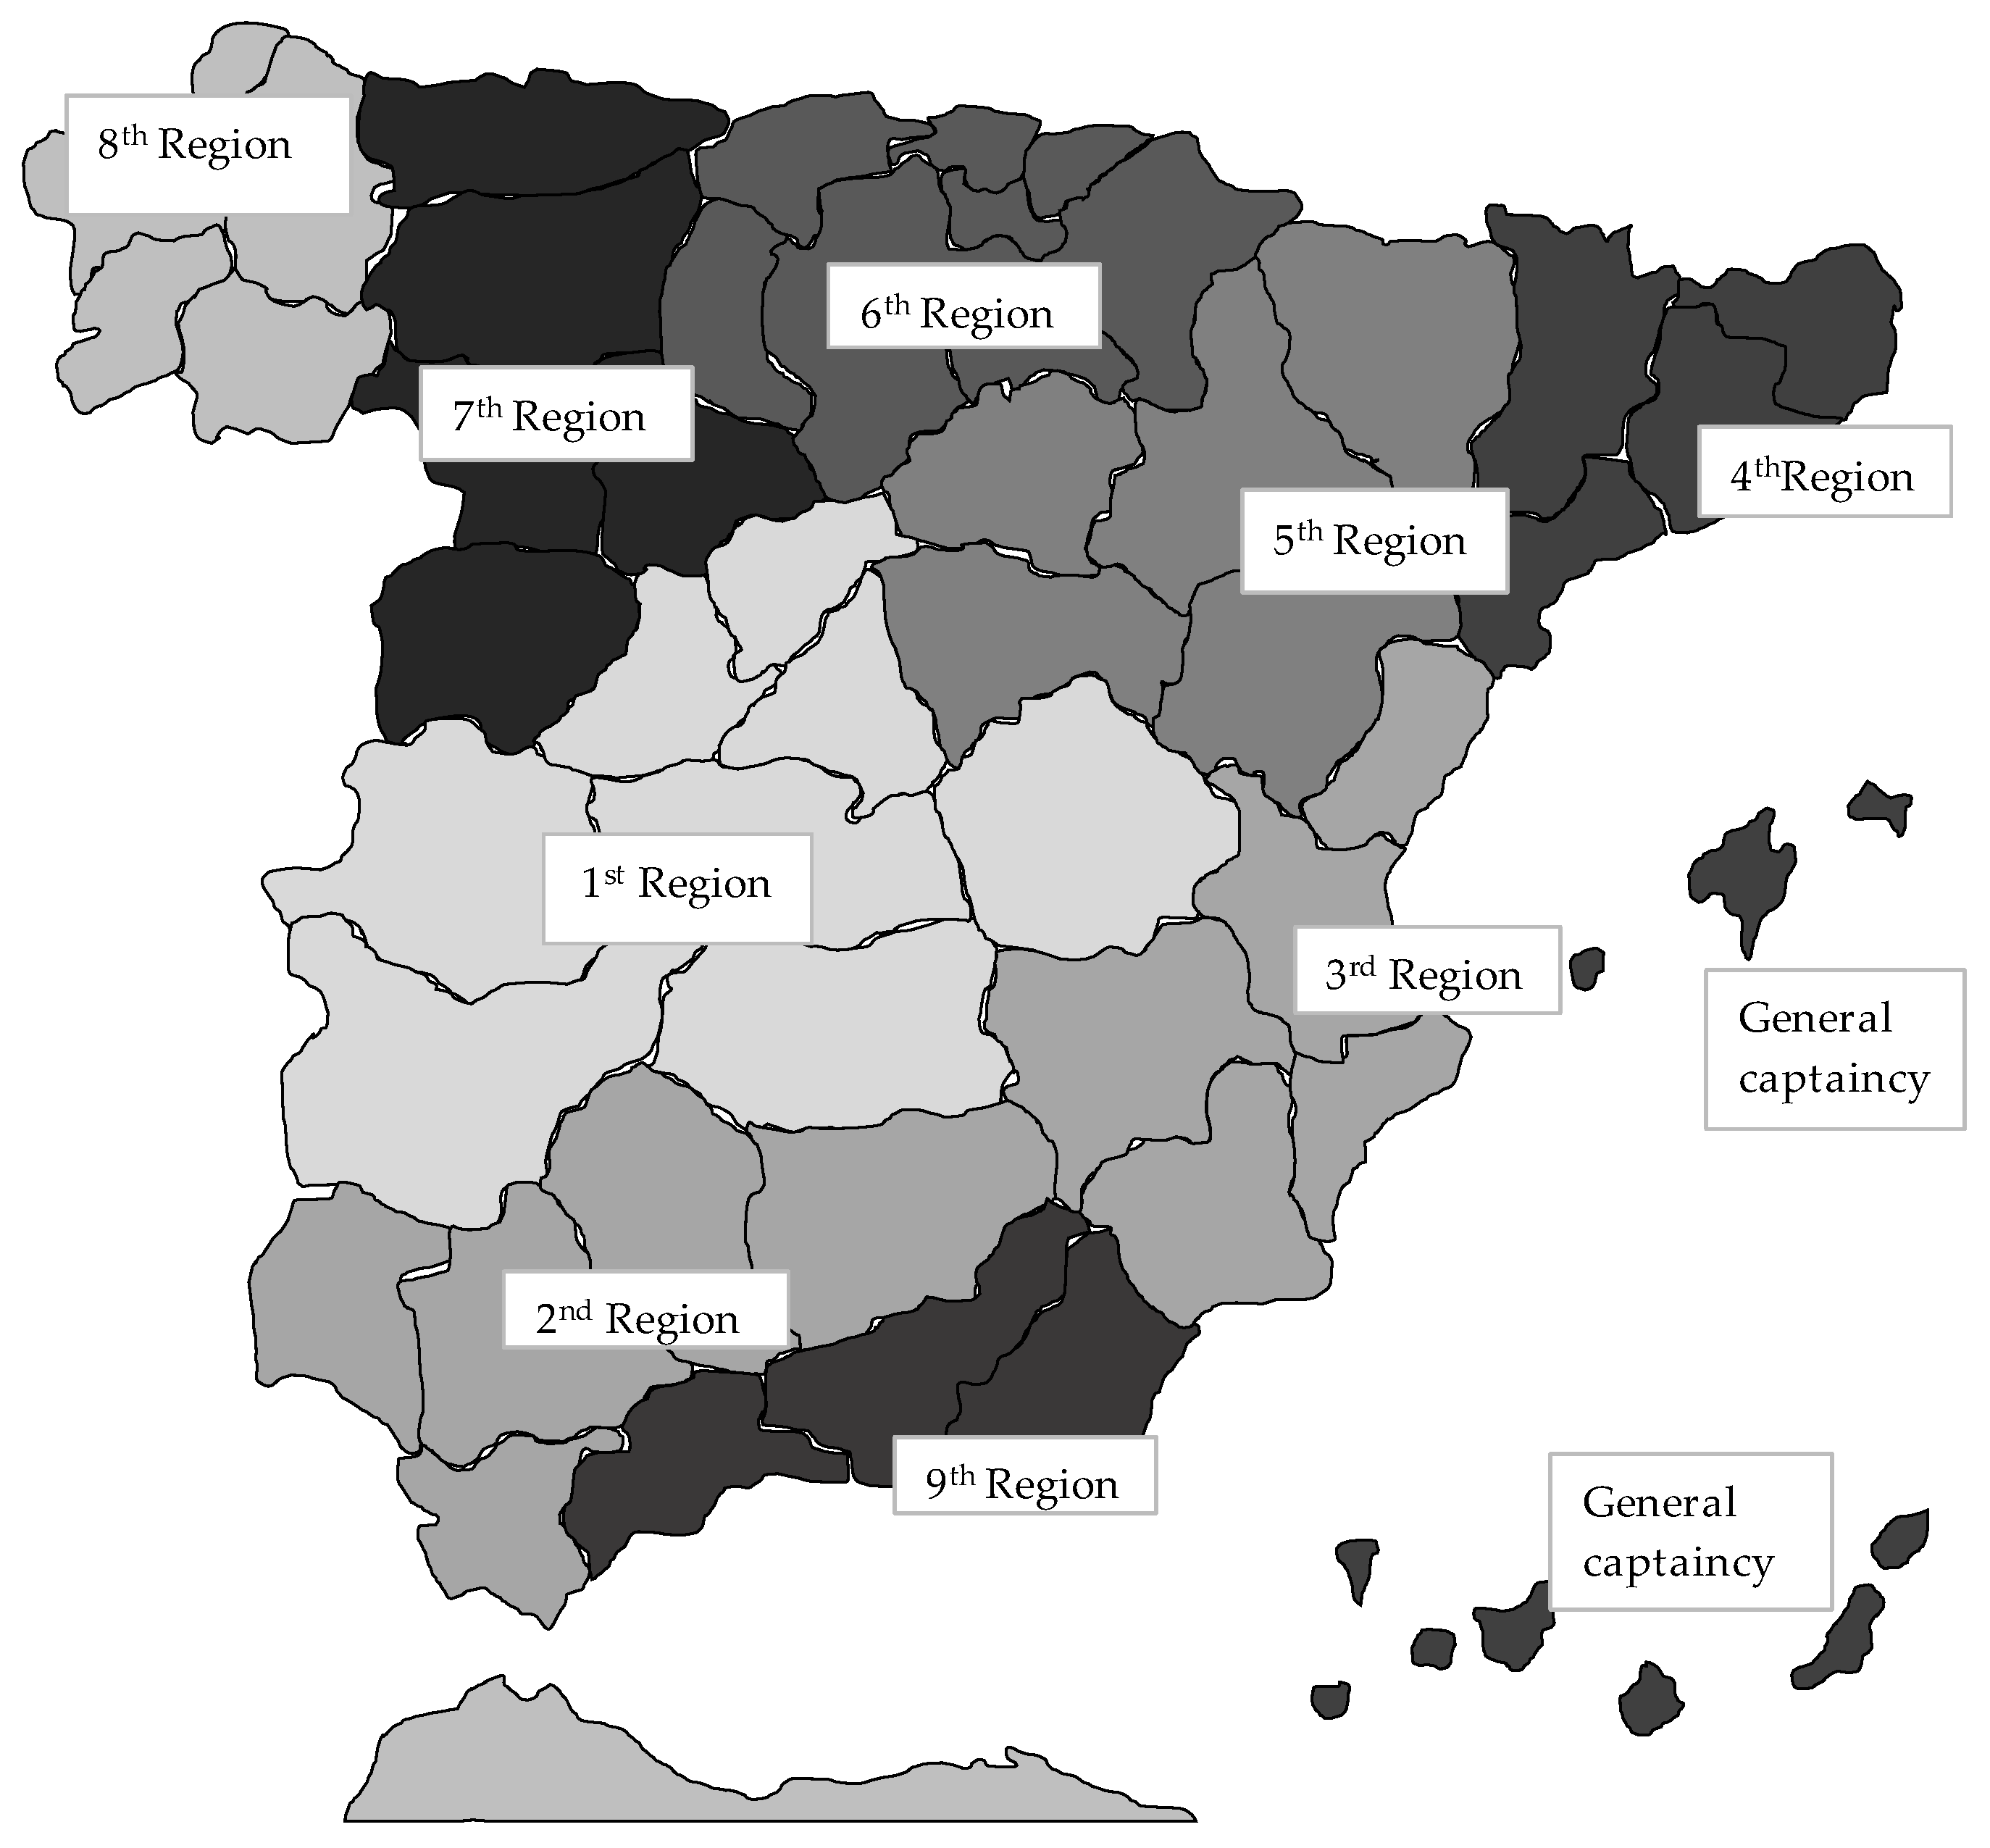
| Reg 1 | 1 | 34.5 | 1 | 18.0 | 1 | 19.1 |
| Reg 2 | 5 | 9.7 | 2 | 13.2 | 2 | 13.8 |
| Reg 3 | 4 | 7.0 | 3 | 11.4 | 3 | 11.9 |
| Reg 4 | 7 | 3.1 | 5 | 10.3 | 4 | 10-2 |
| Reg 5 | 10 | 0.9 | 9 | 6.6 | 9 | 5-5 |
| Reg 6 | 9 | 1.1 | 4 | 10.4 | 5 | 9.7 |
| Reg 7 | 8 | 3.1 | 6 | 9.6 | 7 | 8.9 |
| Reg 8 | 3 | 15.9 | 7 | 8.9 | 6 | 9.6 |
| Reg 9 | 2 | 23.2 | 8 | 7.2 | 8 | 6.9 |
| General captaincies | 6 | 1.5 | 10 | 4.5 | 10 | 4.5 |
| Total | 100 | 100 | 100 |
| Regions (1) | Army | Navy | Air Force | 3 Branches |
|---|---|---|---|---|
| South Plateau | 36.7 | 0.0 | 3.7 | |
| Andalusia | 16.8 | 13.1 | 0.0 | |
| Other regions | 14.9 | 3.7 | 11.1 | |
| Total | 68.4 | 16.8 | 14.8 | 100.0 |
| Distribution of 1967 draft | 84.2 | 8.8 | 7.0 | 100.0 |
| Characteristics | South Plateau | Andalusia | Other Regions | Army | Navy | Air Force | Total |
|---|---|---|---|---|---|---|---|
| N | 4340 | 3200 | 3187 | 7340 | 1800 | 1587 | 10,727 |
| Age | |||||||
| % of soldiers aged 21–22 | 85.9 | 69.7 | 63.2 | 81.5 | 59.0 | 58.8 | 74.3 |
| Estimated average age | 22.1 | 21.9 | 22.0 | 22.2 | 21.6 | 21.6 | 22.0 |
| Time in the services | |||||||
| % soldiers < 3 months | 71.5 | 55.0 | 0.2 | 58.9 | 30.3 | 0.2 | 45.4 |
| % soldiers > 24 months | 0.5 | 6.8 | 10.2 | 0.2 | 14.3 | 18.2 | 5.3 |
| Estimated average time in the service | 5.0 | 7.6 | 12.0 | 5.8 | 11.2 | 13.4 | 7.9 |
| Type of place of birth | |||||||
| % Soldiers with a rural background | 77.0 | 67.3 | 60.1 | 77.7 | 52.5 | 47.9 | 69.1 |
| Father’s occupation | |||||||
| Agriculture | 63.5 | 60.3 | 48.8 | 65.8 | 45.4 | 37.3 | 58.2 |
| Craftsman and professional | 24.0 | 24.6 | 31.5 | 22.2 | 34.7 | 36.4 | 26.4 |
| Others | 12.5 | 15.2 | 19.8 | 12.0 | 20.0 | 26.3 | 15.5 |
| Average height (in cm) | 164.4 | 163.9 | 165.2 | 164.2 | 164.4 | 166.4 | 164.6 |
| Standard deviation | 6.1 | 5.7 | 6.3 | 6.0 | 5.5 | 5.7 | |
| Average weight (in kg) | 60.6 | 60.6 | 63.8 | 61.2 | 60.9 | 63.4 | 61.5 |
| Standard deviation | 6.5 | 6.5 | 7.3 | 6.6 | 7.2 | 6.8 |
| Height | Weight | |||
|---|---|---|---|---|
| Regions and Branches | Value t | Level-p | Value t | Level-p |
| South plateau-Andalusia | 3.402 | 0.001 * | 0.03 | 0.978 |
| Andalusia-Other regions | 8.291 | 0.000 * | 18.98 | 0.000 * |
| South plateau-Other regions | 5.345 | 0.000 * | 20.23 | 0.000 * |
| Army-Air force | 14.14 | 0.000 * | 11.32 | 0.000 * |
| Air force-Navy | 10.42 | 0.000 * | 10.29 | 0.000 * |
| Army-Navy | 1.22 | 0.223 | 1.45 | 0.147 |
| General | Detailed | |
|---|---|---|
| Disease Group | (n) | (n) |
| Enlarged glands | 4.2 | |
| Facial and glandular | 14.4 | |
| Scurvy | 4.8 | |
| Muscular | 1.4 | |
| Facial epidermis | 28.9 | |
| Ocular | 59.3 | |
| Labial | 33.9 | 32.4 |
| Lingual | 5.5 | 30.9 |
| Periodontal | 30.8 | |
| Dental | 54.5 | |
| Follicular keratosis | 63.6 | |
| Cutaneous | 20.5 | 27.0 |
| Infectious | 8.9 |
| Association Test | Measurement | |||
|---|---|---|---|---|
| Variables | Diseases | Chi-Square | G-Square | Cramer’s V |
| Residence (Rur/Urb)-Disease | 71.01 *** | 73.97 *** | 0.099 | |
| Father’s occupation-Disease | 44.83 *** | 45.65 *** | 0.084 | |
| Branch- Disease | 134.24 *** | 139.73 *** | 0.096 | |
| Military region-Disease | 237.30 *** | 243.47 *** | 0.127 | |
| Disaggregation diseases Stat- G2 | ||||
| Variables | Diseases | Facial | Ocular | Labial |
| Epidermis | ||||
| Residence (Rur/Urb)-Disease | 0.00 | 5.62 * | 14.70 *** | |
| Father’s occupation-Disease | 1.73 | 1.39 | 4.01 * | |
| Branch- Disease | 2.53 | 3.54 | 33.16 | |
| Military region-Disease | 27.84 *** | 1.21 | 40.03 *** | |
| Disaggregation diseases Stat- G2 | ||||
| Variables | Diseases | Lingual | Periodontal | Dental |
| Residence (Rur/Urb)-Disease | 0.17 | 6.88 *** | 28.93 *** | |
| Father’s occupation-Disease | 5.01 * | 0.67 | 17.64 *** | |
| Branch- Disease | 10.70 ** | 5.00 * | 31.14 *** | |
| Military region-Disease | 16.87 *** | 13.68 *** | 49.69 *** | |
| Disaggregation diseases Stat- G2 | ||||
| Variables | Diseases | Follicular | Cutaneous | Infectious |
| keratosis | ||||
| Residence (Rur/Urb)-Disease | 0.70 | 5.59 * | 11.38 *** | |
| Father’s occupation-Disease | 0.92 | 6.04 * | 8.49 ** | |
| Branch- Disease | 2.71 | 23.07 *** | 28.12 *** | |
| Military region-Disease | 2.69 | 4.81 * | 86.71 *** | |
| Interval | +1/−1 Stan. Dev | Assessment ICNND Levels | |||||
|---|---|---|---|---|---|---|---|
| Item Analysis | Average | Standard dev. | Min. | Maximum | |||
| Low | Acceptable | High | |||||
| Plasma Protein | 8.1 | 0.45 | 7.61 | 8.51 | 6–6.4 | 6.5–7 | >7 |
| Gm/100 mL | |||||||
| Hemoglobin | 15.5 | 1 | 14.5 | 16.5 | 12–13.9 | 14–15 | >15 |
| Gm/100 mL | |||||||
| Haematocrit | 47.9 | 3 | 44.9 | 50.9 | 36–41 | 42–45 | >45 |
| Percentage | |||||||
| Vitamin A Serum | 37.7 | 1.9 | 35.8 | 39.6 | 10–19 | 20–50 | >50 |
| Mcg/100 mL | |||||||
| Carotene Serum | 79.7 | 26.5 | 53.2 | 106.2 | 20–39 | 40–100 | >100 |
| Mg/100 mL | |||||||
| Cholesterol Serum | 150 | 35 | 115 | 185 | 180–200 (*) | ||
| Mg/100 mL | |||||||
| Vitamin C Serum | 0.33 | 0.21 | 0.12 | 0.54 | 0.10–0.19 | 0.20–0.40 | >0.40 |
| Mg/100 mL | |||||||
| Riboflavin Blood | 17.3 | 4 | 13.3 | 21.3 | 10–14.9 | 15-19.9 | >20 (*) |
| Mcg/100 mL | |||||||
| Variation | |||||
|---|---|---|---|---|---|
| Item | Mode | Armed | Spanish Population | Armed Forces/ | |
| Forces | Spanish Population | ICNND Levels | |||
| Total | 1951–1954 | (Percentage) | Acceptable | ||
| Calories | Estimated | 3330 | 2553 | 30.4 | |
| Analysed | 3270 | ||||
| Protein (gm) | Estimated | 106 | 68 | 55.9 | 100–150 |
| Analysed | 109 | ||||
| Fat (gm) | Estimated | 87 | 80 | 8.8 | |
| Analysed | 73 | ||||
| Calcium (gm) | Estimated | 0.5 | 0.5 | 10.2 | 0.40–0.80 |
| Analysed | 1.0 | ||||
| Iron (mg) | Estimated | 18 | 11.0 | 63.6 | 9–12 |
| Analysed | 72 | ||||
| Total Vitamin A (I.U) | Estimated | 1690 | 2205 | −23.4 | 3500–5000 |
| Analysed | 2570 | ||||
| Thiamine (mg) | Estimated | 1.5 | 1.2 | 25.8 | 0.30–0.50 |
| Analysed | 1.4 | ||||
| Riboflavin (mg) | Estimated | 1.3 | 1.0 | 26.0 | 1.2–1.5 |
| Analysed | 1.1 | ||||
| Niacin (mg) | Estimated | 15.7 | 12 | 30.8 | 10–15 |
| Analysed | 18.6 | ||||
| Vitamin C (mg) | Estimated | 63 | 113 | −44.2 | 30–50 |
| Analysed | 70 |
| Micronutrients | Estimated: | Units | Amount | Assessment | Symptom-Disease | % Soldiers Affected |
|---|---|---|---|---|---|---|
| Vitamin A | Blood test | Mcg/100 mL | 37.7 | Acceptable | Follicular keratosis | 63.6 |
| Consumed diet | Intern. Unit | 1.690 | Deficient | |||
| Raw diet | Intern. Unit | 2.570 | ||||
| Carotene | Blood test | Mg/100 mL | 79.7 | Acceptable | Bitot’s spots | 0.7 |
| Vitamin C | Blood test | Mg/100 mL | 0.3 | Acceptable | Bleeding and swollen gums | 2.1 |
| Consumed diet | Mg | 63.0 | High | (Scurvy) | ||
| Raw diet | Mg | 70.0 | ||||
| Riboflavin | Blood test | Mcg/100 mL | 17.3 | Acceptable | Labial cheilosis | 10.5 |
| Scrotum Dermatitis | 0.3 | |||||
| Consumed diet | Mg | 1.3 | Low - Acceptable | Geographic tongue | 0.6 | |
| Raw diet | Mg | 1.1 | Nasolabial seborrhea | 25.5 | ||
| Thiamine | Urine test | Mcg/gm | 122.0 | Acceptable | Sensitive thighs | 0.3 |
| Niacin | Urine test | Mcg/gm | 3.5 | Acceptable | Atrophied tongue | 6.3 |
| Consumed diet | Mg | 15.7 | High | |||
| Raw diet | Mg | 18.6 | ||||
| Proteins | Blood test | Gm/100 mL | 8.1 | High | Thickness skin folds | 20.3 |
| Consumed diet | Gm | 106.0 | ||||
| Raw diet | Gm | 109.0 | ||||
| Fluorine | No data | Caries | 16.2 | |||
| Fluorosis | 20.7 | |||||
| Iodine | No data | Enlarged thyroid | 3.3 |
Publisher’s Note: MDPI stays neutral with regard to jurisdictional claims in published maps and institutional affiliations. |
© 2021 by the authors. Licensee MDPI, Basel, Switzerland. This article is an open access article distributed under the terms and conditions of the Creative Commons Attribution (CC BY) license (https://creativecommons.org/licenses/by/4.0/).
Share and Cite
Fatjó Gómez, P.; Pradas, F.M.; Nicolau Nos, R. The Nutritional Condition of the Spanish Soldier: “Spain. Nutrition Survey of the Armed Forces, a Report by the Interdepartmental Committee on Nutrition for National Defence 1958”. Int. J. Environ. Res. Public Health 2021, 18, 12623. https://0-doi-org.brum.beds.ac.uk/10.3390/ijerph182312623
Fatjó Gómez P, Pradas FM, Nicolau Nos R. The Nutritional Condition of the Spanish Soldier: “Spain. Nutrition Survey of the Armed Forces, a Report by the Interdepartmental Committee on Nutrition for National Defence 1958”. International Journal of Environmental Research and Public Health. 2021; 18(23):12623. https://0-doi-org.brum.beds.ac.uk/10.3390/ijerph182312623
Chicago/Turabian StyleFatjó Gómez, Pedro, Francisco Muñoz Pradas, and Roser Nicolau Nos. 2021. "The Nutritional Condition of the Spanish Soldier: “Spain. Nutrition Survey of the Armed Forces, a Report by the Interdepartmental Committee on Nutrition for National Defence 1958”" International Journal of Environmental Research and Public Health 18, no. 23: 12623. https://0-doi-org.brum.beds.ac.uk/10.3390/ijerph182312623