
Sustainable Land-Use Allocation Model at a Watershed Level under Uncertainty

 , , ,
, , ,
Abstract
:1. Introduction
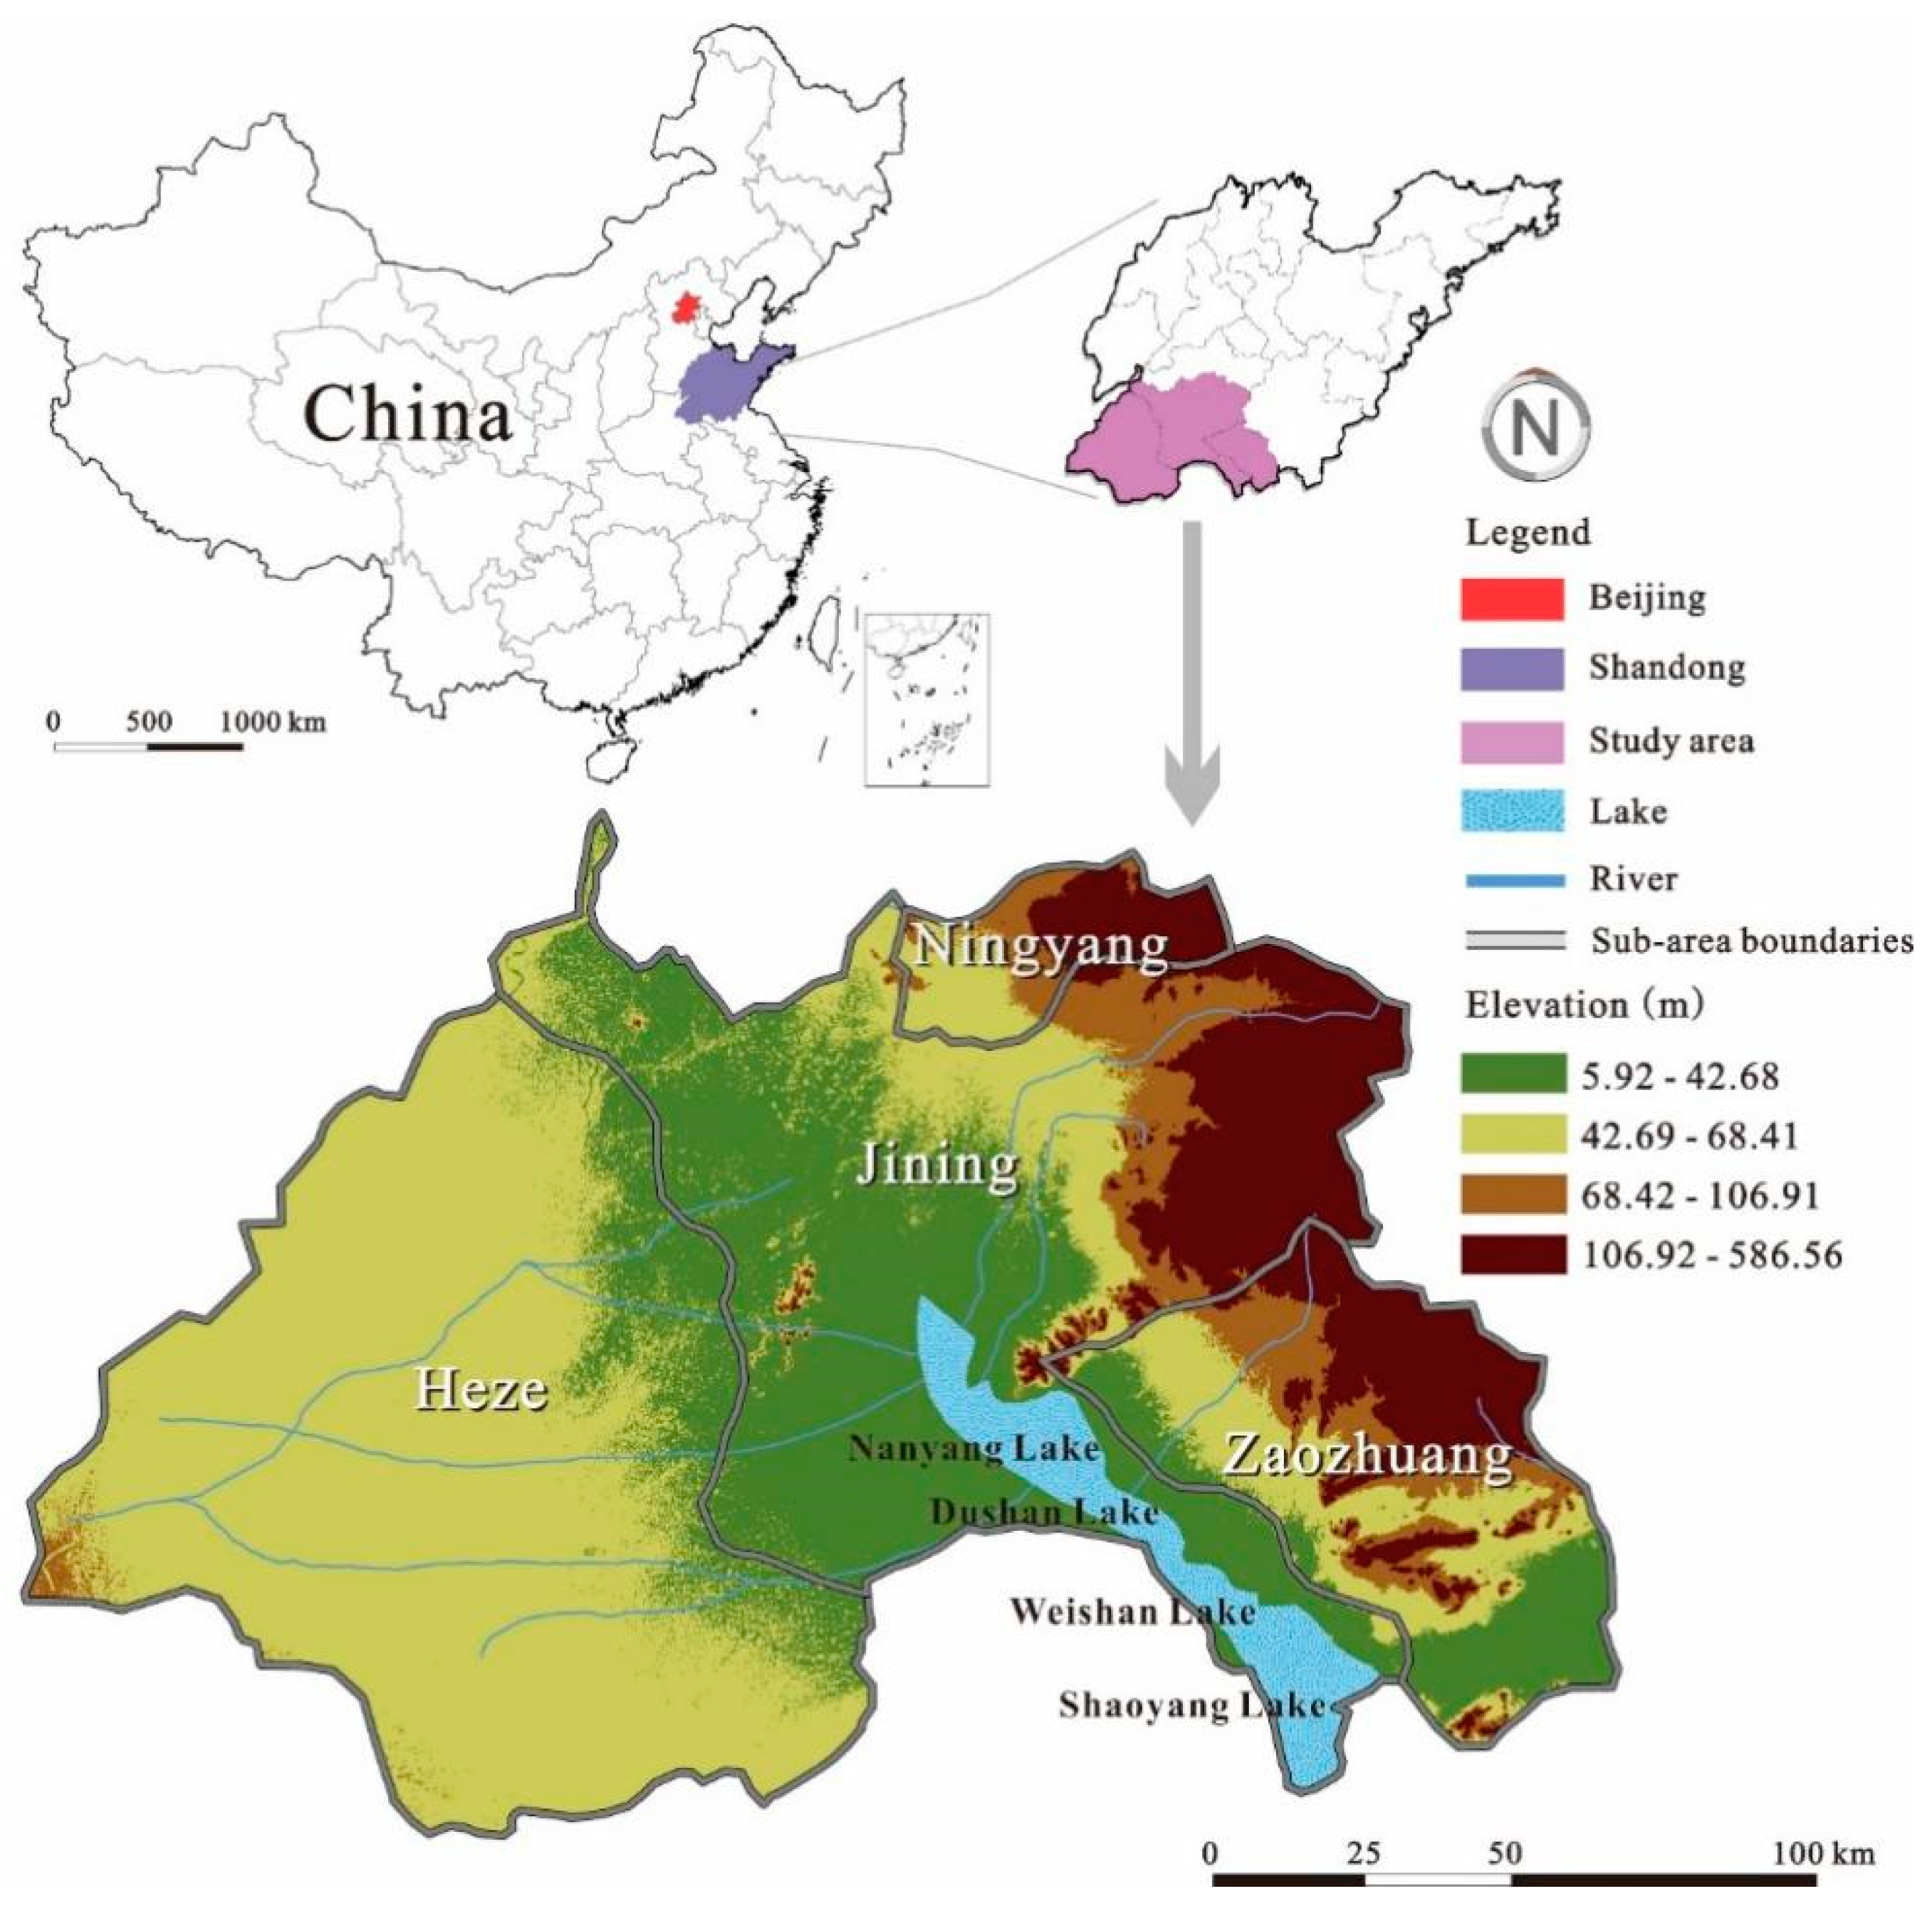
2. Study Area
2.1. General Situation
2.2. Socioeconomic Situation
2.3. Land-Use Status
2.4. Ecological Environmental Status
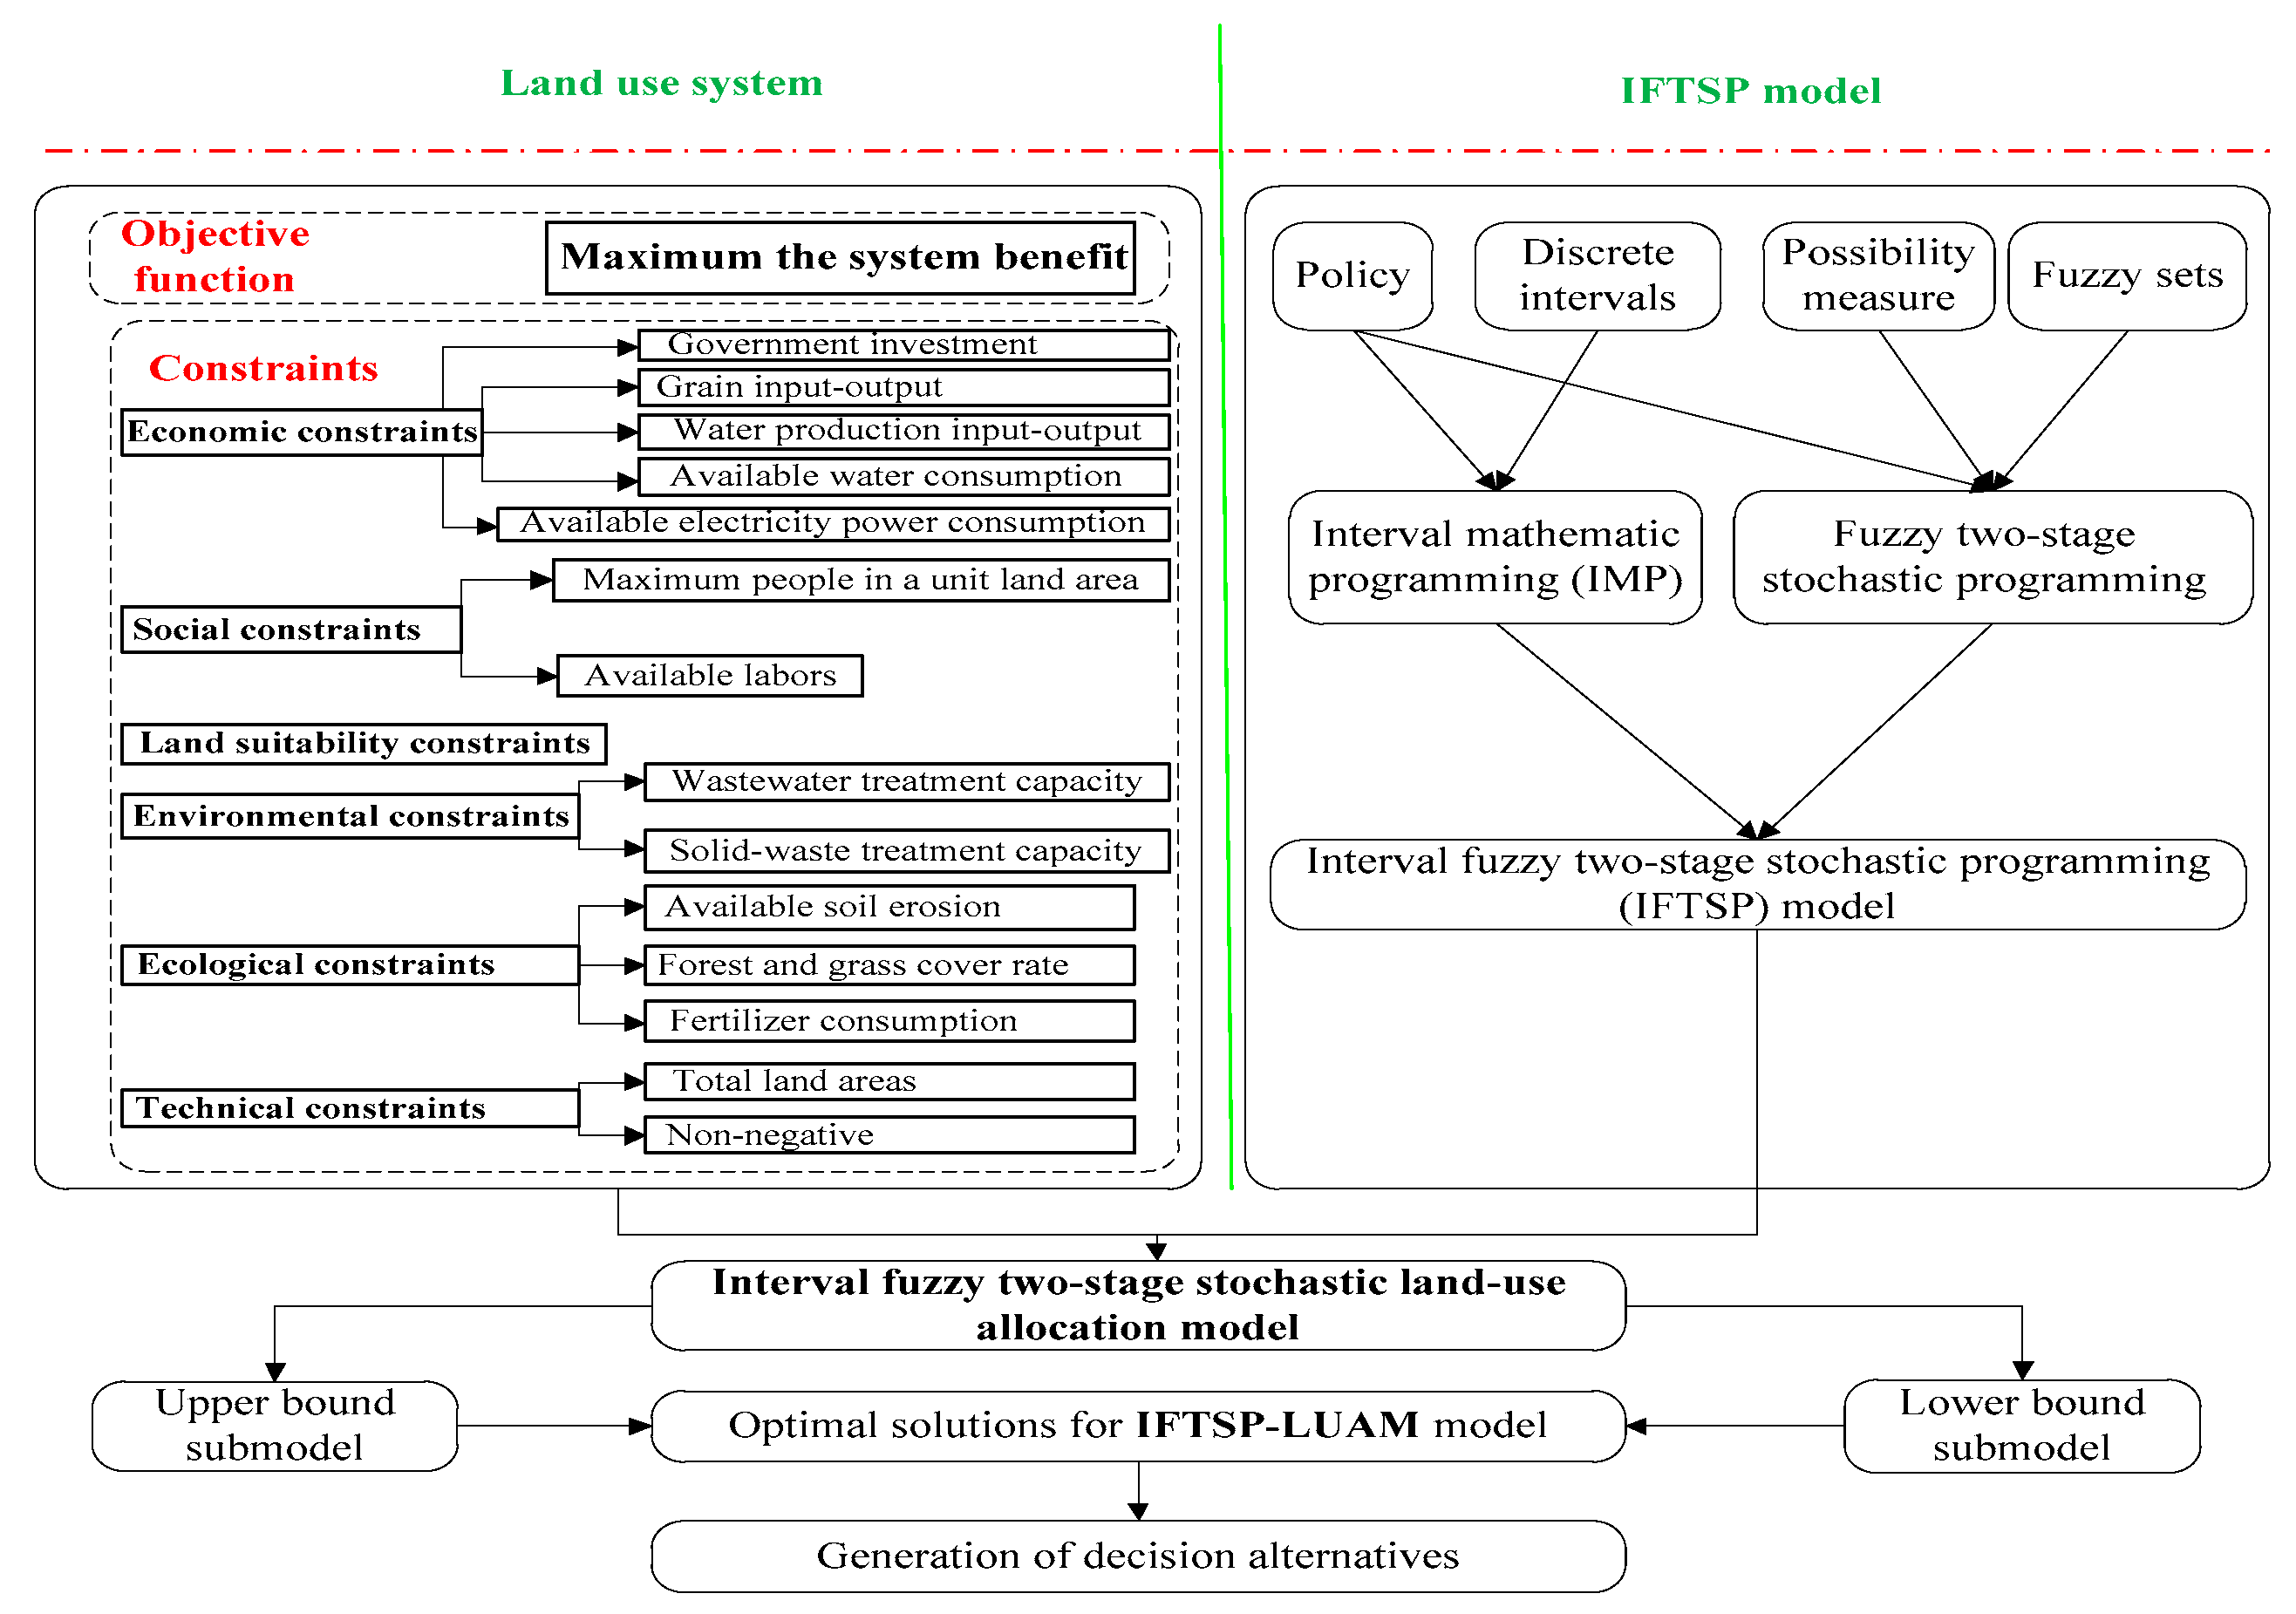
3. Interval Fuzzy Two-Stage Stochastic Land-Use Allocation Model for South Four Lake Watershed
3.1. Economic Objective
3.2. Economic Constraints
- (i)
- Government Investment Constraint
- (ii)
- Grain Input–Output Constraint
- (iii)
- Water Production Input–Output Constraint
- (iv)
- Available Water Consumption Constraint
- (v)
- Available Electricity Power Consumption Constraint
3.3. Social Constraints
- (i)
- Land Carrying Capacity Constraint
- (ii)
- Available Labor Constraint
3.4. Land Suitability Constraint
3.5. Environmental Constraints
- (i)
- Wastewater Treatment Capacity Constraint
- (ii)
- Solid Waste Treatment Capacity Constraint
- (iii)
- Air Pollutant Discharge Capacity Constraint
3.6. Ecological Constraints
- (i)
- Available Soil Erosion Constraint
- (ii)
- Fertilizer Consumption Constraints
3.7. Technical Constraints
- (i)
- Total Land Area Constraint
- (ii)
- Non-negative Constraint
3.8. Parameters of IFTSP-LUAM
3.9. Solving the Model
4. Results and Discussion
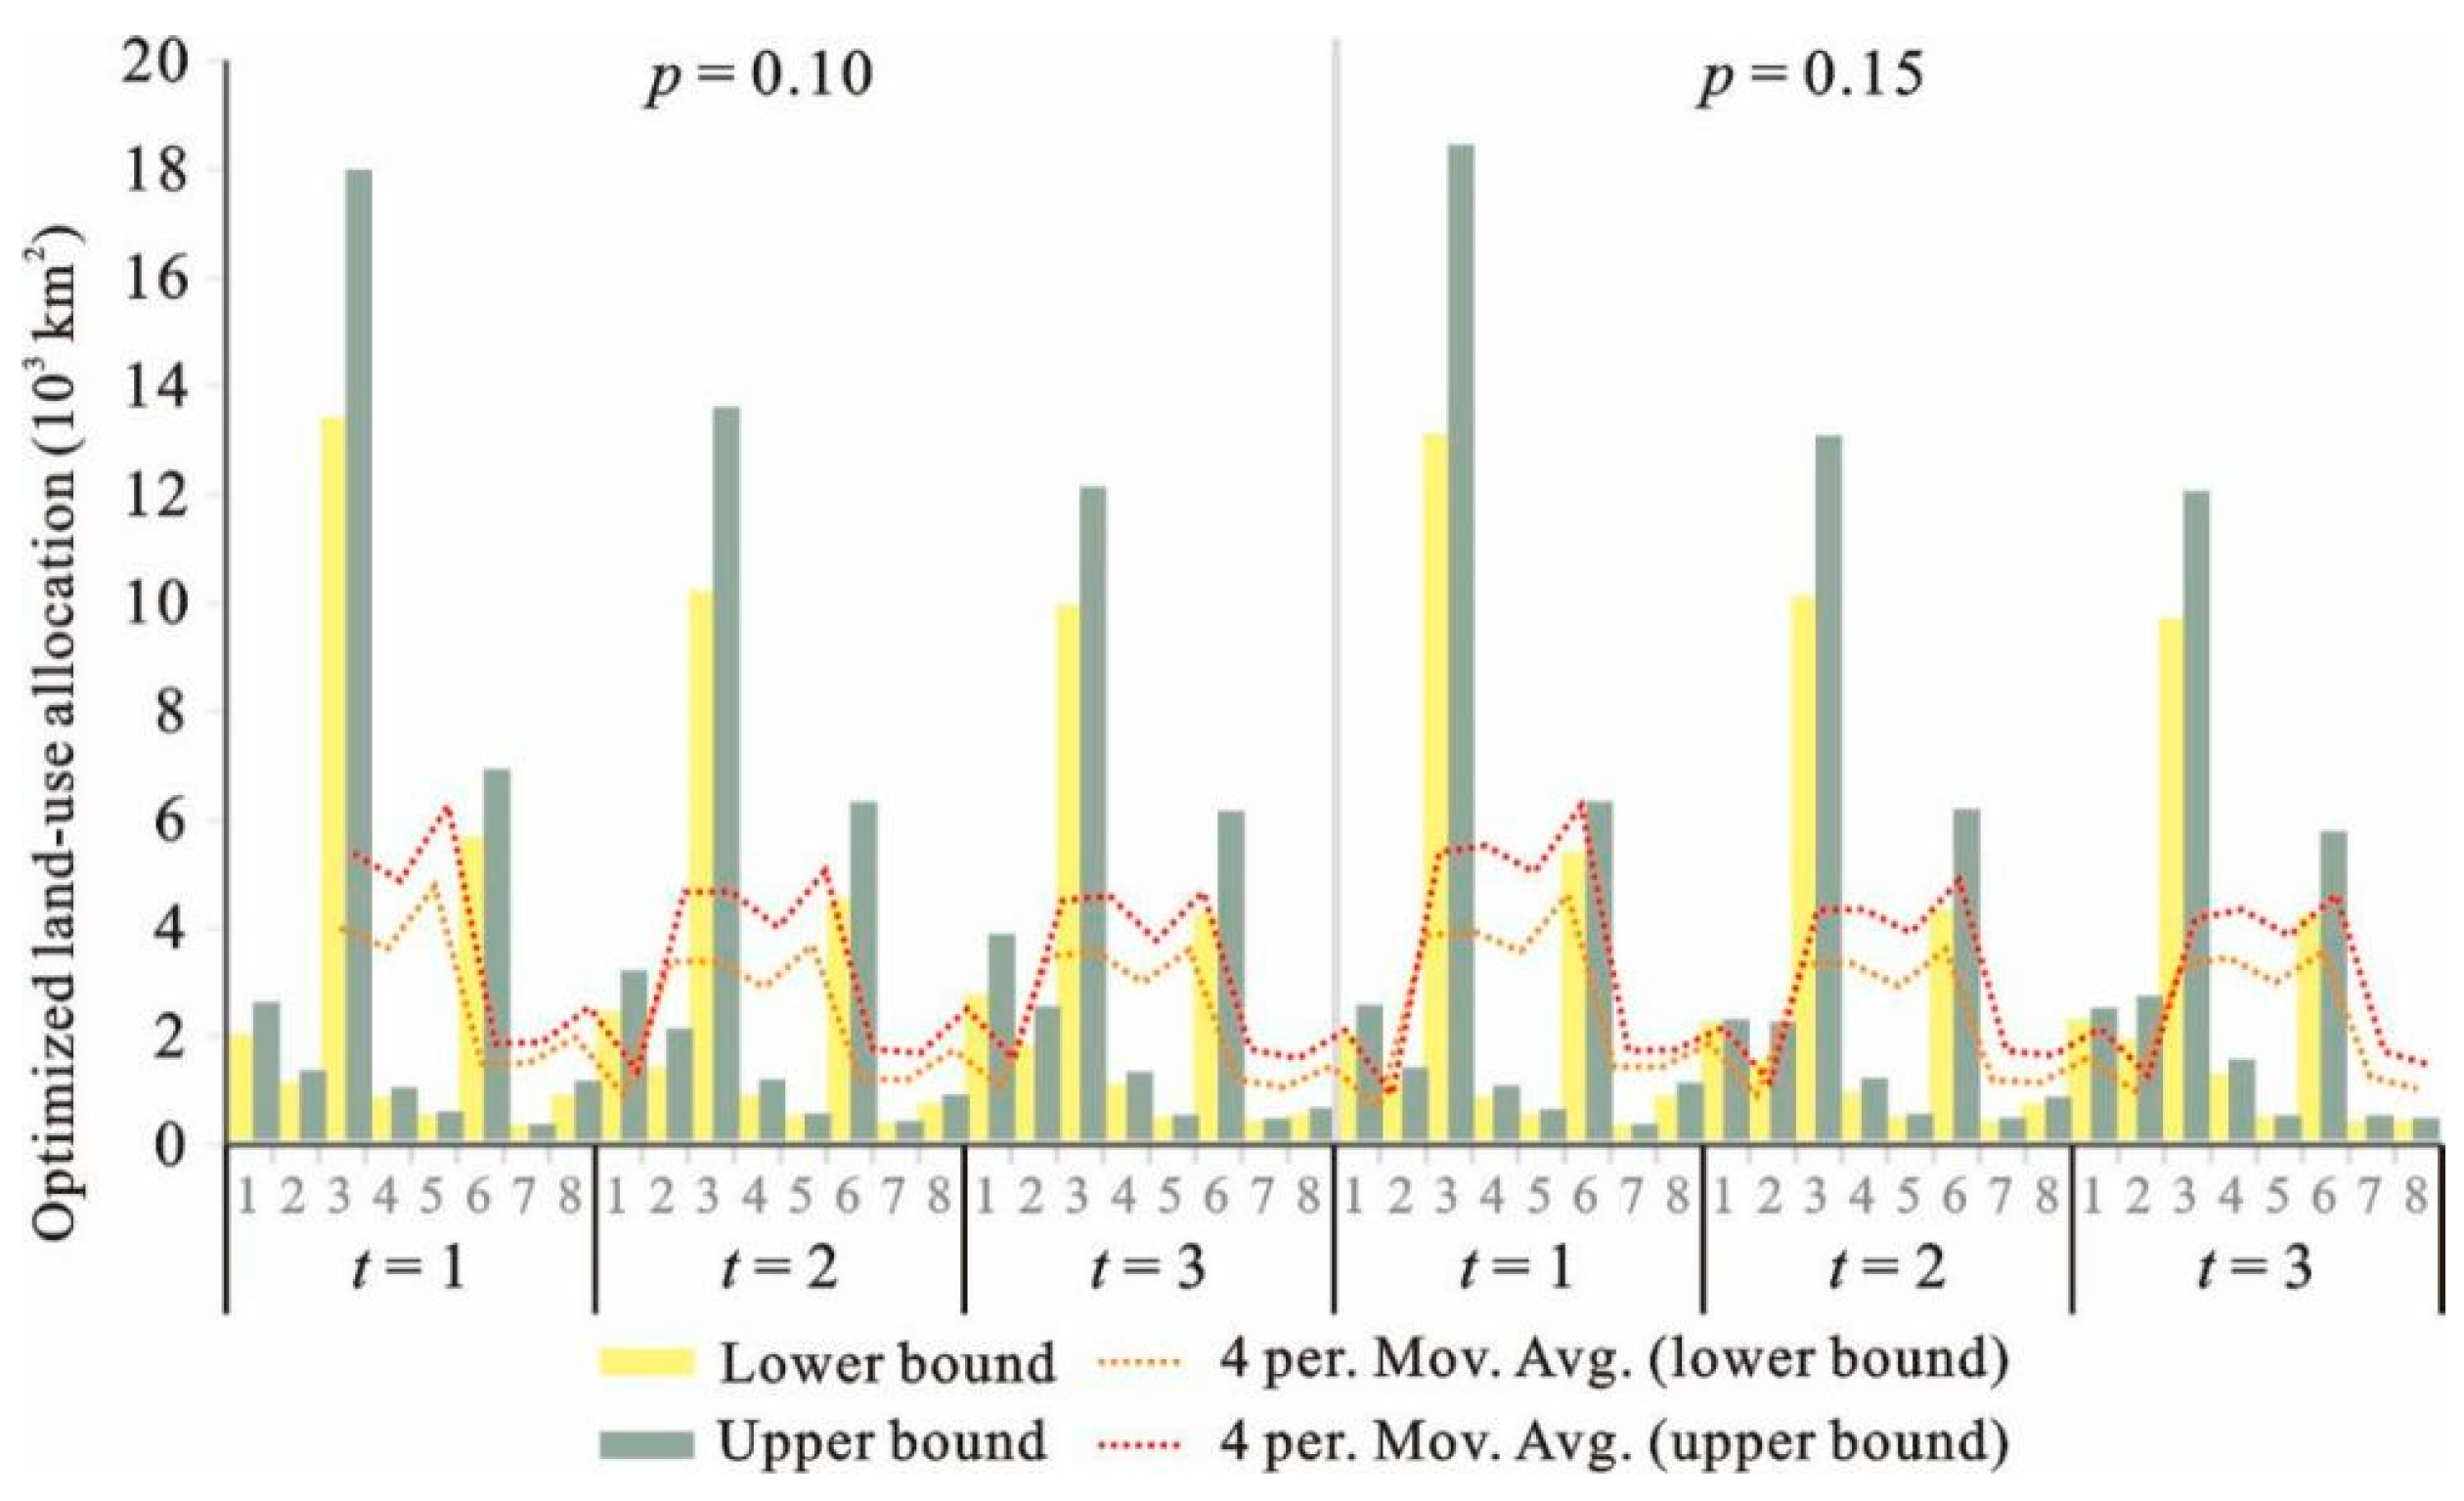
4.1. Optimized Land-Use Patterns
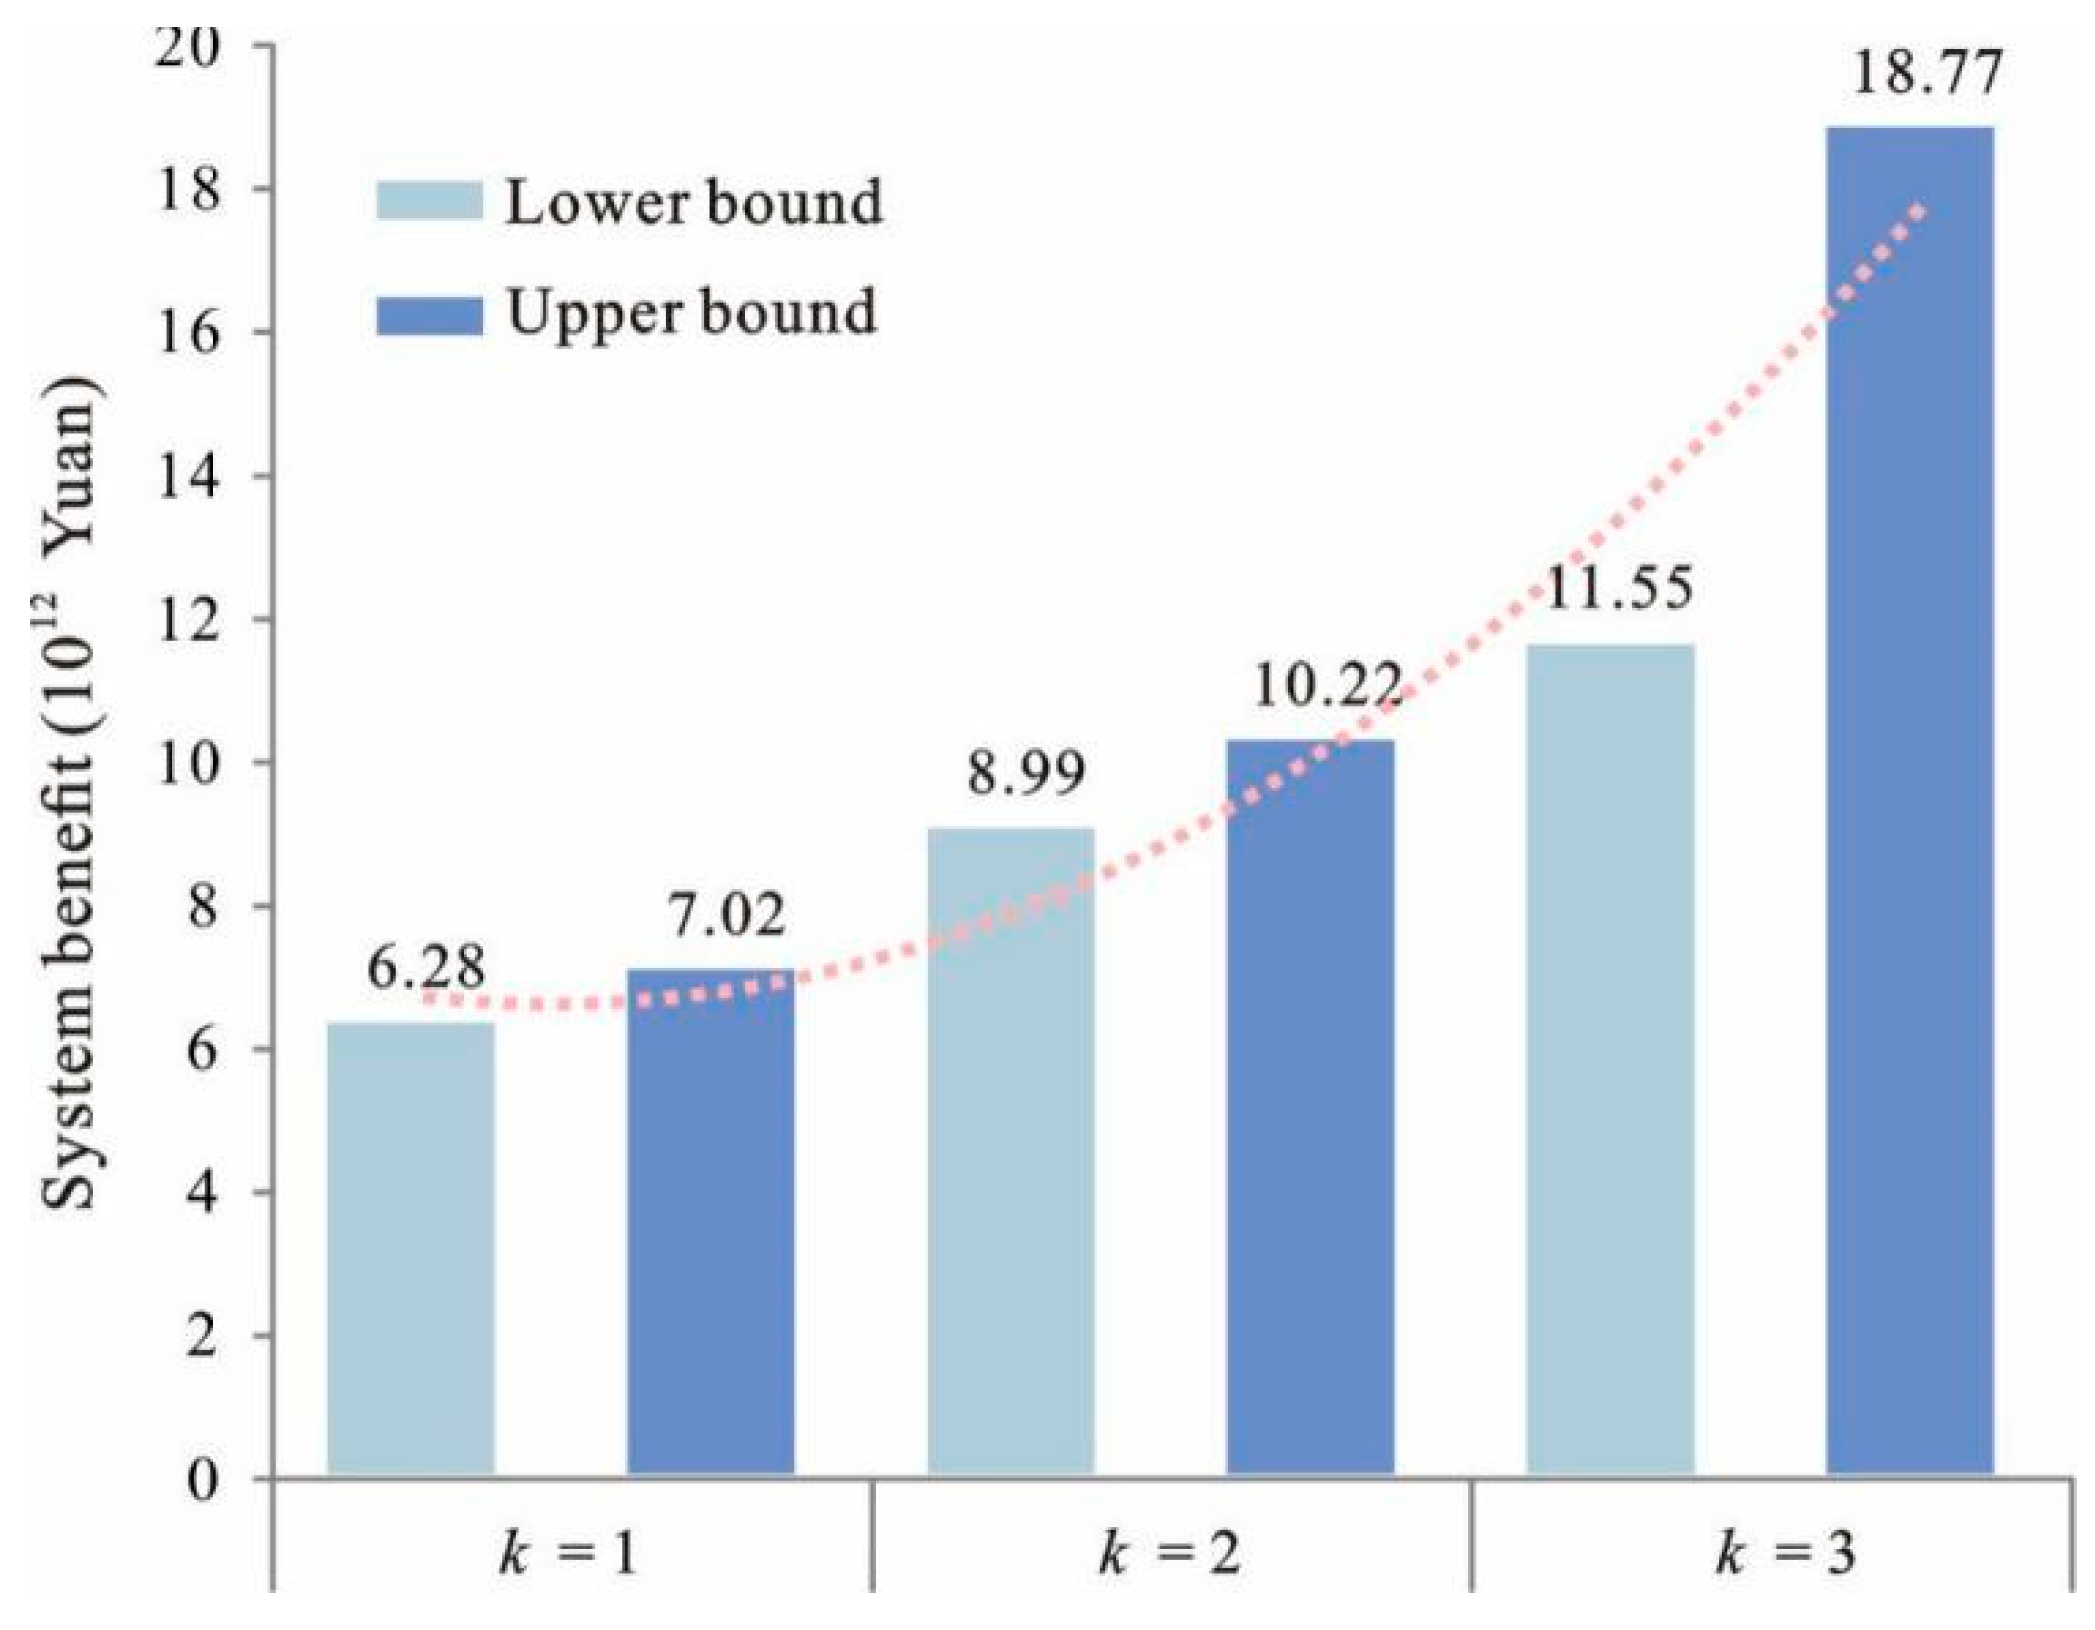
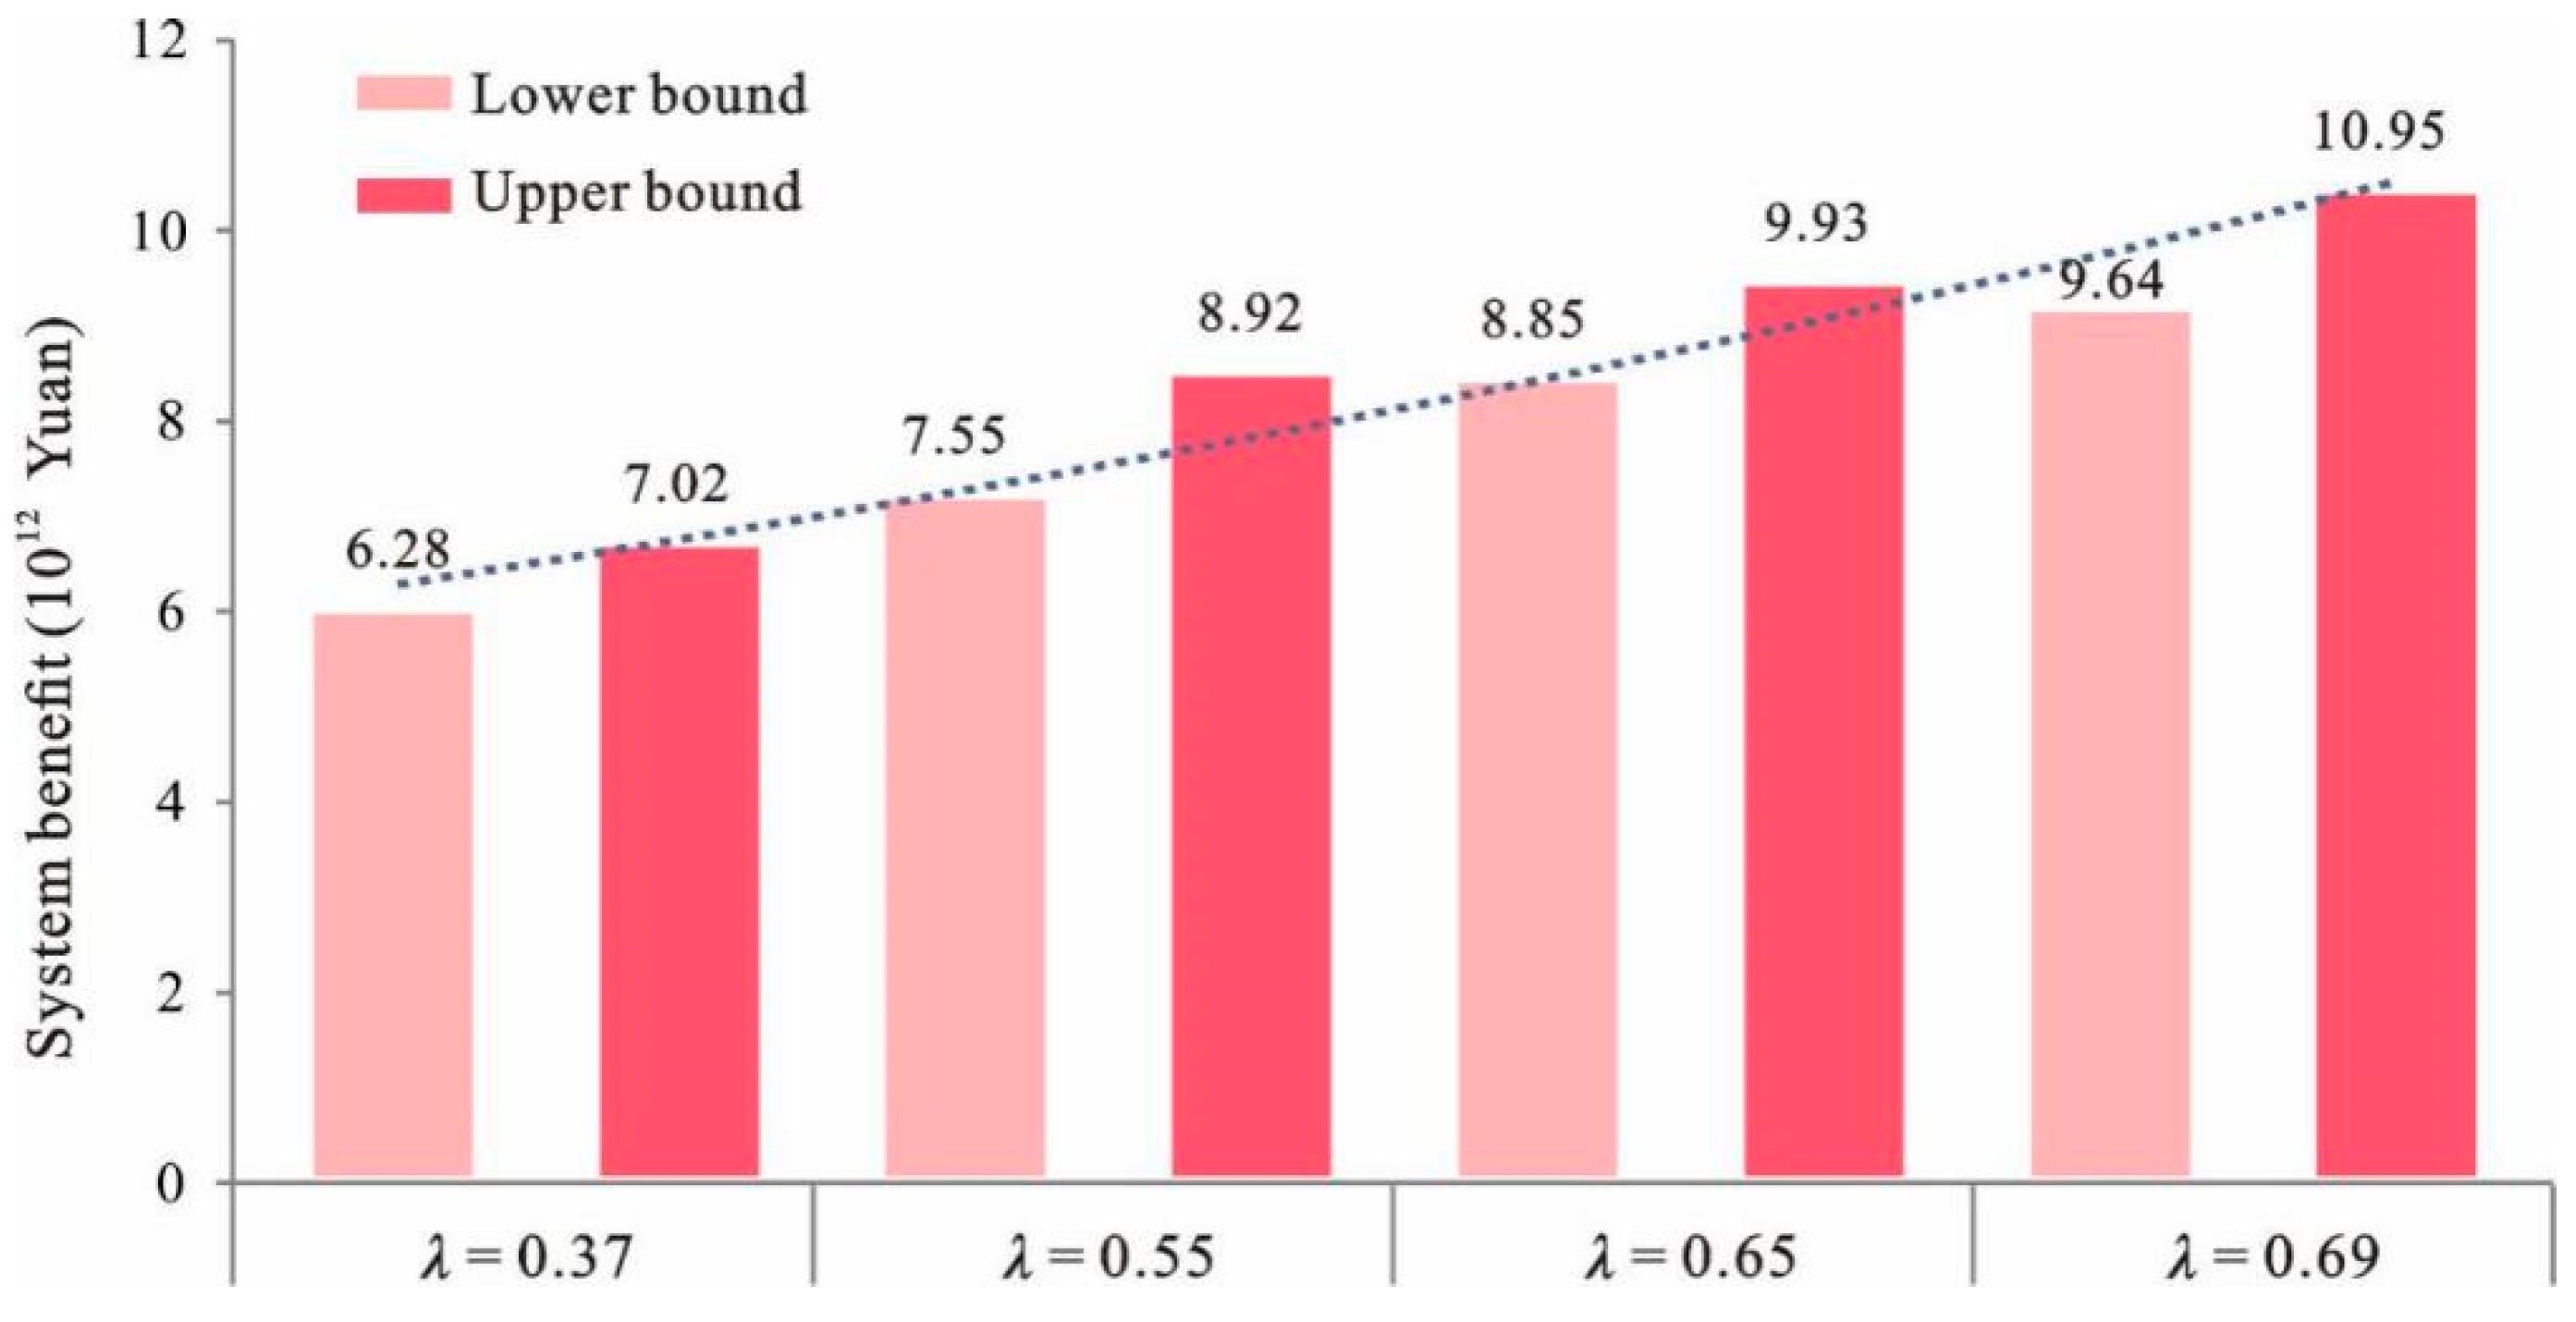
4.2. Relationship between the Land Suitability Level and the System Benefit
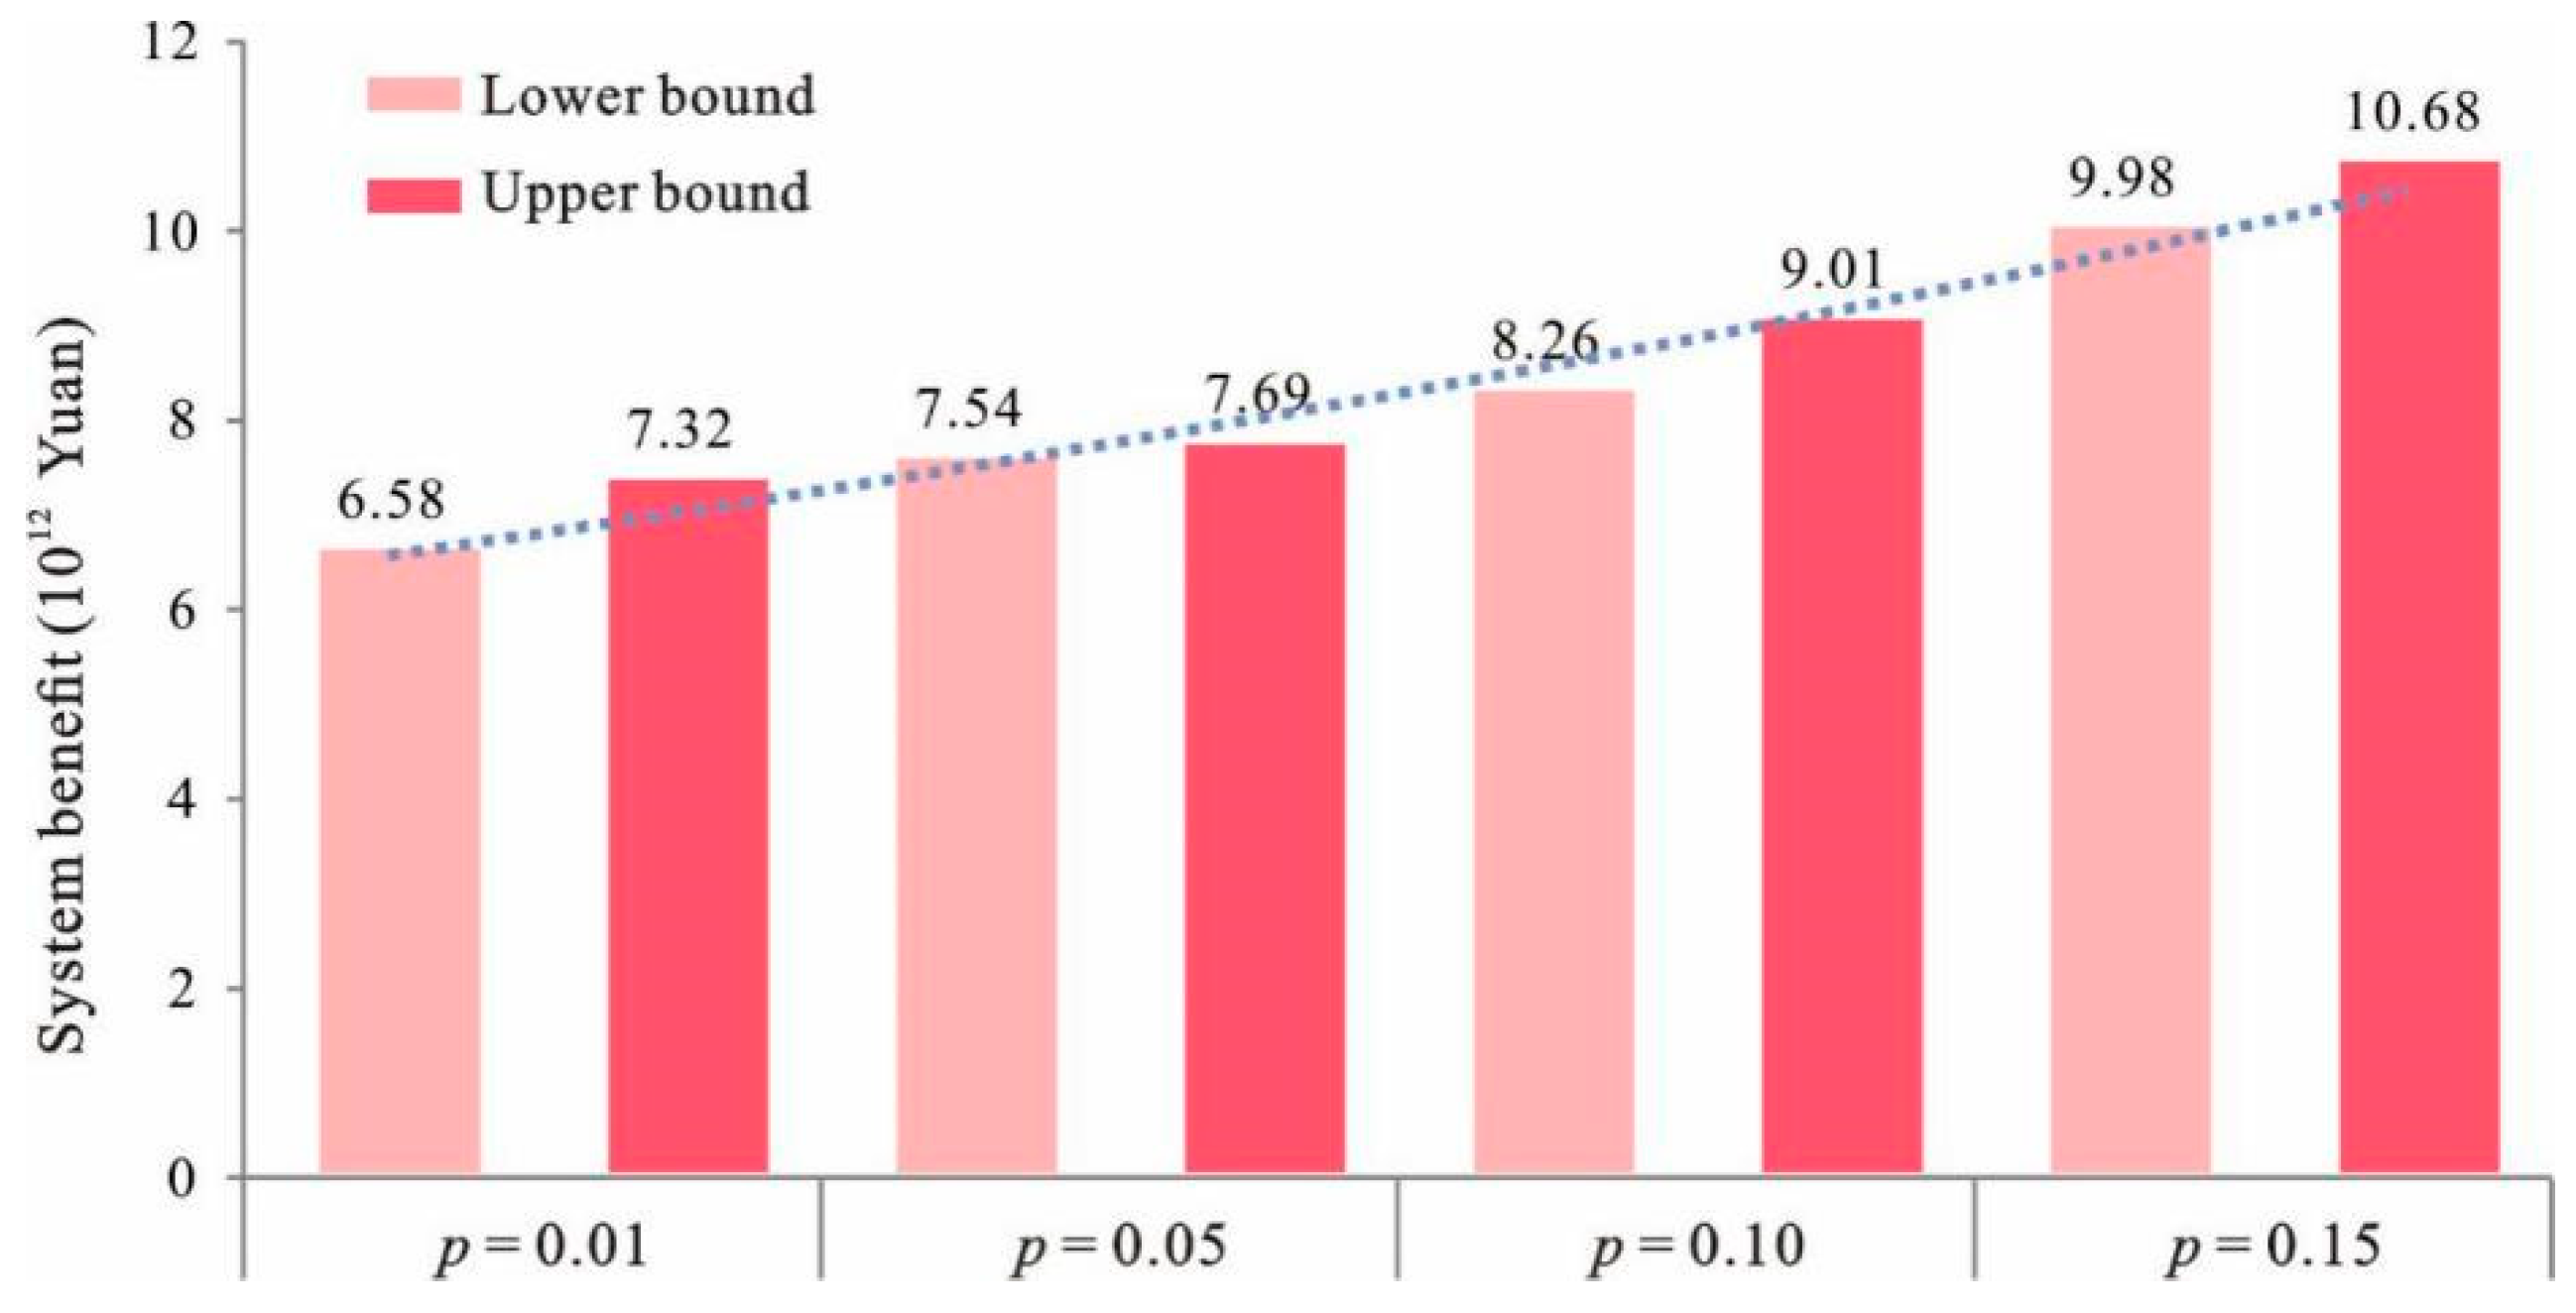
4.3. Trade-Off between the Economic Development and the Ecological Environmental Protection
4.4. Fuzzy Relationship between the Economic Objective and the Constraints
5. Conclusions and Future Outlook
Author Contributions
Funding
Informed Consent Statement
Data Availability Statement
Acknowledgments
Conflicts of Interest
Ethical Statements
Appendix A

| Symbol | Descriptions |
|---|---|
| MGI | The maximum government investment in South Four Lake watershed (RMB) |
| The fuzzy less than symbol | |
| UGP | The unit grain production from cultivated land (ton/km2) |
| DGP | The demand grain production in South Four Lake watershed (ton) |
| The fuzzy greater than symbol | |
| UWP | The unit water production from water land (ton/km2) |
| DWP | The demanded water production in South Four Lake watershed (ton) |
| UWC | The unit water consumption of land-use (j = 1–5, 7, 8) (m3/km2) |
| AWC | The available water supply in South Four Lake watershed (m3) |
| UEC | The unit electric power consumption of all types of land-uses (kilowatt hour/km2, kWh/km2) |
| AES | The available electric power supply in South Four Lake watershed (kilowatt hour, kWh) |
| PP | The planning population (person) |
| MLCC | The maximum LCC in a unit area in South Four Lake watershed (person/km2) |
| PLU | The planning labor in a unit land area (person/km2) |
| AL | The available labor in South Four Lake watershed (person) |
| HSL | The highly suitable land areas for land-use j (km2) |
| WDF | The wastewater discharging factors of some types of land-uses (j = 1–5, ton/km2) |
| WPC | The wastewater treatment plant capacity in the South Four Lake watershed (ton) |
| p | The probability of violating the constraints of environmental capacities; and p ∈ [0,1] |
| SDF | The solid waste discharging factors of some types of land-uses (j = 1–5, ton/km2) |
| SHL | The solid waste handled by unit area of landfill (ton/km2) |
| STC | The solid waste treatment plant capacity (except for the landfill) in South Four Lake watershed (ton) |
| ADF | The air pollutant discharge factors of some types of land-uses (j = 1–5, ton/km2) |
| ADC | The air pollutant discharge capacity in South Four Lake watershed (ton) |
| SER | The SE rate of agricultural land (%) |
| ASE | The available agricultural land SE area in South Four Lake watershed (km2) |
| FCU | The fertilizer consumption in a unit agricultural land (ton/km2) |
| MFC | The maximum fertilizer consumption in South Four Lake watershed (ton) |
| TLA | The total land area of the South Four Lake watershed (km2) |
| Benefit Parameters | Unit | k = 1 | k = 2 | k = 3 | |||
|---|---|---|---|---|---|---|---|
| Lower Bound | Upper Bound | Lower Bound | Upper Bound | Lower Bound | Upper Bound | ||
| j = 1 | 106 | 53.58 | 55.45 | 58.94 | 63.77 | 73.67 | 91.83 |
| j = 2 | 106 | 31.77 | 33.64 | 34.95 | 38.69 | 43.68 | 55.71 |
| j = 3 | 106 | 0.12 | 0.15 | 0.13 | 0.17 | 0.17 | 0.25 |
| j = 4 | 106 | 21.18 | 22.43 | 23.30 | 25.79 | 29.12 | 37.14 |
| j = 5 | 106 | 8.10 | 11.21 | 8.91 | 12.89 | 11.14 | 18.56 |
| j = 6 | 103 | 93.45 | 105.91 | 102.80 | 121.80 | 128.49 | 175.39 |
| Cost Parameters | Unit | k = 1 | k = 2 | k = 3 | |||
| Lower Bound | Upper Bound | Lower Bound | Upper Bound | Lower Bound | Upper Bound | ||
| j = 7 | 103 | 104.04 | 116.50 | 98.84 | 114.17 | 123.55 | 164.40 |
| j = 8 | 103 | 61.05 | 87.10 | 58.00 | 85.36 | 72.50 | 122.92 |
| Land-Use Types | k = 1 | k = 2 | k = 3 | |||
|---|---|---|---|---|---|---|
| Lower Bound | Upper Bound | Lower Bound | Upper Bound | Lower Bound | Upper Bound | |
| j = 1 | 1834.03 | 2677.22 | 1889.05 | 3533.93 | 2342.43 | 5194.87 |
| j = 2 | 822.72 | 1200.97 | 847.40 | 1585.28 | 1050.78 | 2330.36 |
| j = 3 | 15,165.37 | 22,137.68 | 15,620.33 | 29,221.73 | 19,369.20 | 42,955.95 |
| j = 4 | 587.38 | 857.44 | 605.01 | 1131.82 | 750.21 | 1663.77 |
| j = 5 | 227.81 | 332.55 | 234.65 | 438.97 | 290.96 | 645.29 |
| j = 6 | 5801.89 | 8469.32 | 5975.95 | 11,179.50 | 7410.17 | 16,433.87 |
| j = 7 | 29.61 | 40.06 | 29.61 | 40.06 | 29.61 | 40.06 |
| j = 8 | 730.60 | 988.46 | 730.60 | 988.46 | 730.60 | 988.46 |
| Symbol | Lower Bound | Upper Bound | Symbol | Lower Bound | Upper Bound |
|---|---|---|---|---|---|
| MGI (1012 RMB) | 92.15 | 103.99 | MLCC (person/ km2) | 789.00 | 854.00 |
| UGP (ton/km2) | 2.84 | 3.91 | PLU (person/ km2) | 312.58 | 442.19 |
| DGP (106 ton) | 5.34 | 6.97 | AL (103 person) | 4498.00 | 5643.00 |
| UWP (ton/km2) | 2.25 | 6.51 | WDF (103 ton/ km2) | 5.67 | 7.28 |
| DWP (106 ton) | 1.14 | 2.58 | SDF (ton/ km2) | 42.18 | 55.47 |
| UWC (103 m3/km2) | 221.38 | 256.47 | SHL (103 ton/ km2) | 105.24 | 226.37 |
| AWS (109 m3) | 2.69 | 4.32 | SER (%) | 2% | 2.5% |
| UEC (106 kwh/ km2) | 5.12 | 7.58 | MFC (ton) | 12.34 | 13.27 |
| AES (109 kwh) | 39.54 | 72.19 | TUL (103 km2) | 26.00 | 26.00 |
| PP (106 person) | 42.19 | 59.27 |
| Ecological Environmental Capacity | p Level | |||
|---|---|---|---|---|
| p = 0.01 | p = 0.05 | p = 0.10 | p = 0.15 | |
| WPC (109 ton) | 17.72 | 19.25 | 29.34 | 42.68 |
| STC (106 ton) | 146.79 | 168.95 | 198.25 | 249.67 |
| ASE (km2) | 1650.00 | 1750.00 | 1850.00 | 2050.00 |
| MFC (103 ton) | 5.45 | 6.94 | 7.89 | 10.53 |
References
- Chen, I.C.; Chuo, Y.Y.; Ma, H.W. Uncertainty analysis of remediation cost and damaged land value for brownfield investment. Chemosphere 2019, 220, 371–380. [Google Scholar] [CrossRef]
- Lu, D.; Xu, J.; Yue, W.; Mao, W.; Yang, D.; Wang, J. Response of PM2.5 pollution to land use in China. J. Clean. Prod. 2020, 244, 118741. [Google Scholar] [CrossRef]
- Chakir, R.; Gallo, J.L. Predicting land use allocation in France: A spatial panel data analysis. Ecol. Econ. 2013, 92, 114–125. [Google Scholar] [CrossRef]
- Peltonen-Sainio, P.; Jauhiainen, L.; Laurila, H.; Sorvali, J.; Honkavaara, E.; Wittke, S.; Karjalainen, M.; Puttonen, E. Land use optimization tool for sustainable intensification of high-latitude agricultural systems. Land Use Policy 2019, 88, 104104. [Google Scholar] [CrossRef]
- Mendoza, G.A. A mathematical model for generating land-use allocation alternatives for agroforestry systems. Agrofor. Syst. 1987, 5, 443–453. [Google Scholar] [CrossRef]
- Aerts, J.C.; Eisinger, E.; Heuvelink, G.B.M.; Stewart, T.J. Using linear integer programming for multi-site land-use allocation. Geogr. Anal. 2003, 35, 148–169. [Google Scholar] [CrossRef]
- Santé, I.; Crecente, R. LUSE, a decision support system for exploration of rural land use allocation: Application to the Terra Chá district of Galicia (N.W. Spain). Agric. Syst. 2007, 94, 341–356. [Google Scholar] [CrossRef]
- Gong, J.; Liu, Y.; Chen, W. Optimal land use allocation of urban fringe in Guangzhou. J. Geogr. Sci. 2012, 22, 179–191. [Google Scholar] [CrossRef]
- Zimmermann, H.J. Fuzzy set theory. WIREs Comput. Stat. 2010, 2, 317–332. [Google Scholar] [CrossRef]
- Sets, F.; Zadeh, L. Information and Control. Zadeh Lofti 1965, 8, 338–353. [Google Scholar]
- Carranza, E.J.M.; Hale, M. Geologically Constrained Fuzzy Mapping of Gold Mineralization Potential, Baguio District, Philippines. Nat. Resour. Res. 2001, 10, 125–136. [Google Scholar] [CrossRef]
- Liu, B. Fuzzy Random Chance-Constrained Programming. Found. Learn. Classif. Syst. 2002, 9, 273–282. [Google Scholar] [CrossRef]
- Liu, Y. Uncertain random programming with applications. Fuzzy Optim. Decis. Mak. 2013, 12, 153–169. [Google Scholar] [CrossRef]
- Chang, N.-B.; Chen, H.W.; Shaw, D.G.; Yang, C.H. Water Pollution Control in River Basin by Interactive Fuzzy Interval Multiobjective Programming. J. Environ. Eng. 1997, 123, 1208–1216. [Google Scholar] [CrossRef]
- Simic, V.; Dimitrijevic, B. Risk explicit interval linear programming model for long-term planning of vehicle recycling in the EU legislative context under uncertainty. Resour. Conserv. Recycl. 2013, 73, 197–210. [Google Scholar] [CrossRef]
- Haque, A.; Asami, Y. Optimizing urban land use allocation for planners and real estate developers. Comput. Environ. Urban Syst. 2014, 46, 57–69. [Google Scholar] [CrossRef]
- Wang, H.; Gao, Y.; Liu, Q.; Song, J. Land use allocation based on interval multi-objective linear programming model: A case study of Pi County in Sichuan Province. Chin. Geogr. Sci. 2010, 20, 176–183. [Google Scholar] [CrossRef]
- Dai, Z.; Li, Y. A multistage irrigation water allocation model for agricultural land-use planning under uncertainty. Agric. Water Manag. 2013, 129, 69–79. [Google Scholar] [CrossRef]
- Elalamy, Y.; Doyen, L.; Mouysset, L. Contribution of the land use allocation model for agroecosystems: The case of Torrecchia Vecchia. J. Environ. Manag. 2019, 252, 109607. [Google Scholar] [CrossRef]
- Cromley, R.G.; Hanink, D.M. Coupling land use allocation models with raster GIS. J. Geogr. Syst. 1999, 1, 137–153. [Google Scholar] [CrossRef]
- Cromley, R.G.; Hanink, D.M. Scale-independent Land-use Allocation Modeling in Raster GIS. Cartogr. Geogr. Inf. Sci. 2003, 30, 343–350. [Google Scholar] [CrossRef]
- Svoray, T.; Bar, P.; Bannet, T. Urban land-use allocation in a Mediterranean ecotone: Habitat Heterogeneity Model incorpo-rated in a GIS using a multi-criteria mechanism. Landsc. Urban. Plan. 2005, 72, 337–351. [Google Scholar] [CrossRef]
- Santé-Riveira, I.; Crecente-Maseda, R.; Miranda, D. GIS-based planning support system for rural land-use allocation. Comput. Electron. Agric. 2008, 63, 257–273. [Google Scholar] [CrossRef]
- Hoymann, J. Spatial Allocation of Future Residential Land Use in the Elbe River Basin. Environ. Plan. B Plan. Des. 2010, 37, 911–928. [Google Scholar] [CrossRef] [Green Version]
- Arciniegas, G.; Janssen, R.; Omtzigt, N. Map-based multicriteria analysis to support interactive land use allocation. Int. J. Geogr. Inf. Sci. 2011, 25, 1931–1947. [Google Scholar] [CrossRef]
- Nino-Ruiz, M.; Bishop, I.; Pettit, C. Spatial model steering, an exploratory approach to uncertainty awareness in land use allocation. Environ. Model. Softw. 2013, 39, 70–80. [Google Scholar] [CrossRef]
- Caparros-Midwood, D.; Barr, S.; Dawson, R. Optimised spatial planning to meet long term urban sustainability objectives. Comput. Environ. Urban Syst. 2015, 54, 154–164. [Google Scholar] [CrossRef] [Green Version]
- Caparros-Midwood, D.; Barr, S.; Dawson, R. Spatial Optimization of Future Urban Development with Regards to Climate Risk and Sustainability Objectives. Risk Anal. 2017, 37, 2164–2181. [Google Scholar] [CrossRef] [Green Version]
- Tong, H.; Shi, P.; Bao, S.; Zhang, X.; Nie, X. Optimization of Urban Land Development Spatial Allocation Based on Ecology-Economy Comparative Advantage Perspective. J. Urban Plan. Dev. 2018, 144, 05018006. [Google Scholar] [CrossRef]
- Penazzi, S.; Accorsi, R.; Manzini, R. Planning low carbon urban-rural ecosystems: An integrated transport land-use model. J. Clean. Prod. 2019, 235, 96–111. [Google Scholar] [CrossRef]
- Verburg, P.; de Koning, G.; Kok, K.; Veldkamp, T.; Bouma, J. A spatial explicit allocation procedure for modelling the pattern of land use change based upon actual land use. Ecol. Model. 1999, 116, 45–61. [Google Scholar] [CrossRef]
- Ke, X.; Zheng, W.; Zhou, T.; Liu, X. A CA-based land system change model: LANDSCAPE. Int. J. Geogr. Inf. Sci. 2017, 31, 1798–1817. [Google Scholar] [CrossRef]
- Zheng, W.; Ke, X.; Xiao, B.; Zhou, T. Optimising land use allocation to balance ecosystem services and economic benefits—A case study in Wuhan, China. J. Environ. Manag. 2019, 248, 109306. [Google Scholar] [CrossRef]
- Ullah, K.M.; Mansourian, A. Evaluation of Land Suitability for Urban Land-Use Planning: Case Study Dhaka City. Trans. GIS 2015, 20, 20–37. [Google Scholar] [CrossRef]
- Duarte, L.; Teodoro, A.C.; Maia, D.; Barbosa, D. Radio Astronomy Demonstrator: Assessment of the Appropriate Sites through a GIS Open Source Application. ISPRS Int. J. Geo-Inform. 2016, 5, 209. [Google Scholar] [CrossRef] [Green Version]
- Feizizadeh, B.; Blaschke, T. An uncertainty and sensitivity analysis approach for GIS-based multicriteria landslide sus-ceptibility mapping. Int. J. Geogr. Inf. Sci. 2014, 28, 610–638. [Google Scholar] [CrossRef] [PubMed] [Green Version]
- Aerts, J.; Van Herwijnen, M.; Janssen, R.; Stewart, T. Evaluating spatial design techniques for solving land-use allocation problems. J. Environ. Plan. Manag. 2005, 48, 121–142. [Google Scholar] [CrossRef] [Green Version]
- Sharawi, H.A. Optimal land-use allocation in central Sudan. For. Policy Econ. 2006, 8, 10–21. [Google Scholar] [CrossRef]
- Ahmadi, A.; Karamouz, M.; Moridi, A.; Han, D. Integrated Planning of Land Use and Water Allocation on a Watershed Scale Considering Social and Water Quality Issues. J. Water Resour. Plan. Manag. 2012, 138, 671–681. [Google Scholar] [CrossRef]
- Fotakis, D.; Sidiropoulos, E. Combined land-use and water allocation planning. Ann. Oper. Res. 2012, 219, 169–185. [Google Scholar] [CrossRef]
- Santé-Riveira, I.; Boullón-Magán, M.; Crecente-Maseda, R.; Miranda-Barrós, D. Algorithm based on simulated annealing for land-use allocation. Comput. Geosci. 2008, 34, 259–268. [Google Scholar] [CrossRef]
- Eldrandaly, K.A. Integrating gene expression programming and geographic information systems for solving a multi site land use allocation problem. Am. J. Appl. Sci. 2009, 6, 1021–1027. [Google Scholar] [CrossRef] [Green Version]
- Huang, K.; Liu, X.; Li, X.; Liang, J.; He, S. An improved artificial immune system for seeking the Pareto front of land-use allocation problem in large areas. Int. J. Geogr. Inf. Sci. 2013, 27, 922–946. [Google Scholar] [CrossRef]
- Liu, Y.; Liu, D.; Liu, Y.; He, J.; Jiao, L.; Chen, Y.; Hong, X. Rural land use spatial allocation in the semiarid loess hilly area in China: Using a Particle Swarm Optimization model equipped with multi-objective optimization techniques. Sci. China Earth Sci. 2012, 55, 1166–1177. [Google Scholar] [CrossRef]
- Cao, K.; Ye, X. Coarse-grained parallel genetic algorithm applied to a vector based land use allocation optimization problem: The case study of Tongzhou Newtown, Beijing, China. Stoch. Environ. Res. Risk Assess. 2013, 27, 1133–1142. [Google Scholar] [CrossRef]
- Zhou, J.; Xu, Y.; Gao, Y.; Xie, Z. Land use model research in agro-pastoral ecotone in northern China: A case study of Horqin Left Back Banner. J. Environ. Manag. 2019, 237, 139–146. [Google Scholar] [CrossRef]
- Eldrandaly, K. A GEP-based spatial decision support system for multisite land use allocation. Appl. Soft Comput. 2010, 10, 694–702. [Google Scholar] [CrossRef]
- Zhang, H.; Zeng, Y.; Bian, L. Simulating Multi-Objective Spatial Optimization Allocation of Land Use Based on the Integration of Multi-Agent System and Genetic Algorithm. Int. J. Environ. Res. 2010, 4, 765–776. [Google Scholar]
- Chuvieco, E. Integration of linear programming and GIS for land-use modelling. Int. J. Geogr. Inf. Syst. 1993, 7, 71–83. [Google Scholar] [CrossRef]
- Zhang, Y.; Zhang, H.Q.; Ni, D.Y.; Song, W. Agricultural land use optimal allocation system in developing area: Application to Yili watershed, Xinjiang region. Chin. Geogr. Sci. 2012, 22, 232–244. [Google Scholar] [CrossRef] [Green Version]
- Ma, C.; Zhou, M. A GIS-Based Interval Fuzzy Linear Programming for Optimal Land Resource Allocation at a City Scale. Soc. Indic. Res. 2016, 135, 143–166. [Google Scholar] [CrossRef]
- Huang, Q.; Song, W. A land-use spatial optimum allocation model coupling a multi-agent system with the shuffled frog leaping algorithm. Comput. Environ. Urban Syst. 2019, 77, 101360. [Google Scholar] [CrossRef]
- Yang, L.; Sun, X.; Peng, L.; Shao, J.; Chi, T. An improved artificial bee colony algorithm for optimal land-use allocation. Int. J. Geogr. Inf. Sci. 2015, 29, 1–20. [Google Scholar] [CrossRef]
- Liu, X.; Ou, J.; Li, X.; Ai, B. Combining system dynamics and hybrid particle swarm optimization for land use allocation. Ecol. Model. 2013, 257, 11–24. [Google Scholar] [CrossRef]
- Zhou, M. An interval fuzzy chance-constrained programming model for sustainable urban land-use planning and land use policy analysis. Land Use Policy 2015, 42, 479–491. [Google Scholar] [CrossRef]
- Ou, G.L.; Tan, S.K.; Zhou, M.; Lu, S.S.; Tao, Y.H.; Zhang, Z.; Zhang, L.; Yan, D.P.; Guan, X.L.; Wu, G. An interval chance-constrained fuzzy modeling approach for supporting land-use planning and eco-environment planning at a water-shed level. J. Environ. Manag. 2017, 204, 651–666. [Google Scholar] [CrossRef]
- Verburg, P.H.; Tabeau, A.; Hatna, E. Assessing spatial uncertainties of land allocation using a scenario approach and sensitivity analysis: A study for land use in Europe. J. Environ. Manag. 2013, 127, S132–S144. [Google Scholar] [CrossRef] [PubMed]
- Emirhüseyinoğlu, G.; Ryan, S.M. Land use optimization for nutrient reduction under stochastic precipitation rates. Environ. Model. Softw. 2019, 123, 104527. [Google Scholar] [CrossRef]
- Zhou, M.; Tan, S.; Tao, L.; Zhu, X.; Akhmat, G. An interval fuzzy land-use allocation model (IFLAM) for Beijing in association with environmental and ecological consideration under uncertainty. Qual. Quant. 2014, 49, 2269–2290. [Google Scholar] [CrossRef]
- Li, H.; Li, Y.; Huang, G.; Gao, P. Identifying optimal land-use patterns using a copula-based interval stochastic programming model for urban agglomeration under uncertainty. Ecol. Eng. 2020, 142, 105616. [Google Scholar] [CrossRef]
- Wang, S.-H.; Huang, S.-L.; Budd, W.W. Integrated ecosystem model for simulating land use allocation. Ecol. Model. 2012, 227, 46–55. [Google Scholar] [CrossRef]
- Luo, X.; Lu, X.H.; Jin, G.; Wan, Q.; Zhou, M. Optimization of urban land-use structure in China’s rapidly developing regions with eco-environmental constraints. Phys. Chem. Earth 2019, 110, 8–13. [Google Scholar] [CrossRef]
- Carsjens, G.J.; van der Knaap, W. Strategic land-use allocation: Dealing with spatial relationships and fragmentation of ag-riculture. Landsc. Urban. Plan. 2002, 58, 171–179. [Google Scholar] [CrossRef]
- D’Amato, M.; Zrobek, S.; Bilozor, M.R.; Walacik, M.; Mercadante, G. Valuing the effect of the change of zoning on underde-veloped land using fuzzy real option approach. Land. Use Policy 2019, 86, 365–374. [Google Scholar] [CrossRef]
- Wagner, P.D.; Fohrer, N. Gaining prediction accuracy in land use modeling by integrating modeled hydrologic variables. Environ. Model. Softw. 2019, 115, 155–163. [Google Scholar] [CrossRef]
- Klöcking, B.; Ströbl, B.; Knoblauch, S.; Maier, U.; Pfützner, B.; Gericke, A. Development and allocation of land-use scenarios in agriculture for hydrological impact studies. Phys. Chem. Earth Parts A/B/C 2003, 28, 1311–1321. [Google Scholar] [CrossRef]
- Shirmohammadi, B.; Malekian, A.; Salajegheh, A.; Taheri, B.; Azarnivand, H.; Malek, Ž.; Verburg, P.H. Scenario analysis for integrated water resources management under future land use change in the Urmia Lake region, Iran. Land Use Policy 2020, 90, 104299. [Google Scholar] [CrossRef]
- Purnamasari, R.A.; Noguchi, R.; Ahamed, T. Land suitability assessments for yield prediction of cassava using geospatial fuzzy expert systems and remote sensing. Comput. Electron. Agric. 2019, 166, 105018. [Google Scholar] [CrossRef]
- Guldmann, J.-M. Urban land use allocation and environmental pollution control: An intertemporal optimization approach. Socio-Econ. Plan. Sci. 1979, 13, 71–86. [Google Scholar] [CrossRef]
- Kertész, Á.; Nagy, L.A.; Balázs, B. Effect of land use change on ecosystem services in Lake Balaton Catchment. Land Use Policy 2019, 80, 430–438. [Google Scholar] [CrossRef]
- McDonald, J.F. Cost-Benefit Analysis of Local Land Use Allocation Decisions. J. Reg. Sci. 2001, 41, 277–299. [Google Scholar] [CrossRef]


| Objective Function | Maximum Economic Benefit from the Land-Use System |
|---|---|
| Economic constraint | government investment should afford the system cost |
| grain production should meet the demand [65] | |
| water production should meet the demand [66] | |
| water consumption of all land-uses should not exceed the available water supply [67] | |
| electricity power consumption of all land-uses should not exceed the available electricity power supply | |
| Social constraint | maximum population should not exceed the land carrying capacity (LCC) |
| planning labor should not exceed the available labor | |
| Land-use suitability constraint | maximum land areas of each type of land use should accord with the results of the land suitability assessment [68] |
| Environmental constraint | wastewater should not exceed the wastewater treatment capacity |
| solid waste should not exceed the solid waste treatment capacity and solid waste handling capabilities of the landfill | |
| air pollutants should not exceed the discharge limits [69] | |
| Ecological constraint | planning agricultural land soil erosion should not exceed the available soil erosion area |
| fertilizer consumption should not exceed the maximum fertilizer consumption [70] | |
| Technical constraint | the sum of the allocated land area is the total land area of the study area |
| the independent variable cannot be negative |
| Symbol | Descriptions | Symbol | Descriptions |
|---|---|---|---|
| NBL | The objective function, which represents the net benefit from land-use system of South Four Lake watershed (RMB) | x | The independent variable, which means land areas of each land use |
| RMB | Renminbi (RMB) is the legal currency of China | UB | The unit benefit of various types of land-uses j = 1–6 (RMB/km2) |
| ± | Discrete interval values | Fuzzy equal | |
| USTC | The unit solid-waste-tackling cost of various land-uses j = 1–5 (RMB/km2) | UGTC | The unit waste-gas-tackling cost of various land-uses j =1–5 (RMB/km2) |
| UWTC | The unit wastewater tackling cost of various land-uses j = 1–5 (RMB/km2) | UWSC | The unit water-supply cost of various land-uses j = 1–5 (RMB/km2) |
| UMC | The unit maintenance cost of various land-uses j = 6–7 (RMB/km2) | UESC | The unit electric power-supply cost of various land-uses j = 1–5 (RMB/km2) |
| k | The land suitability condition, where k = 1 represents highly suitable, k = 2 represents moderately suitable, k = 3 represents lowly suitable | UDC | The unit developing costs of unused land (RMB/km2) |
| t | The planning period, where t = 1 for the time period of 2021–2025, t = 2 for the time period of 2026–2030, t = 3 for the time period of 2031–2035 | j | The type of land-use, where j = 1 for commercial land, j = 2 for industrial land, j = 3 for agricultural land, j = 4 for transportation land, j = 5 for residential land, j = 6 for water land, j = 7 for landfill, and j = 8 for unused land |
| Land-Use Types | p Level | |||
|---|---|---|---|---|
| p = 0.01 | p = 0.05 | p = 0.10 | p = 0.15 | |
| j = 1 | [1608.8, 2176.6] | [1724.3, 2282.0] | [1743.8, 2348.3] | [1742.3, 2297.9] |
| j = 2 | [721.7, 976.4] | [764.1, 1014.3] | [811.5, 1048.2] | [862.2, 1115.8] |
| j = 3 | [13,303.0,17,998.1] | [13,772.5, 18,386.0] | [13,400.0, 18,074.4] | [13,088.3, 18,541.8] |
| j = 4 | [515.2, 697.1] | [539.5, 718.2] | [555.2, 730.2] | [567.3, 766.4] |
| j = 5 | [199.8, 270.4] | [216.3, 285.6] | [224.7, 269.2] | [229.4, 318.3] |
| j = 6 | [5089.4, 6885.6] | [5448.6, 7212.8] | [5484.1, 6736.0] | [5186.1, 6139.9] |
| j = 7 | [29.6, 40.1] | [27.9, 38.1] | [26.0, 35.4] | [23.9, 33.6] |
| j = 8 | [730.6, 988.5] | [618.9, 872.8] | [599.0, 855.7] | [581.9, 812.9] |
Publisher’s Note: MDPI stays neutral with regard to jurisdictional claims in published maps and institutional affiliations. |
© 2021 by the authors. Licensee MDPI, Basel, Switzerland. This article is an open access article distributed under the terms and conditions of the Creative Commons Attribution (CC BY) license (https://creativecommons.org/licenses/by/4.0/).
Share and Cite
Lu, Y.; Zhou, M.; Ou, G.; Zhang, Z.; He, L.; Ma, Y.; Ma, C.; Tu, J.; Li, S. Sustainable Land-Use Allocation Model at a Watershed Level under Uncertainty. Int. J. Environ. Res. Public Health 2021, 18, 13411. https://0-doi-org.brum.beds.ac.uk/10.3390/ijerph182413411
Lu Y, Zhou M, Ou G, Zhang Z, He L, Ma Y, Ma C, Tu J, Li S. Sustainable Land-Use Allocation Model at a Watershed Level under Uncertainty. International Journal of Environmental Research and Public Health. 2021; 18(24):13411. https://0-doi-org.brum.beds.ac.uk/10.3390/ijerph182413411
Chicago/Turabian StyleLu, Yao, Min Zhou, Guoliang Ou, Zuo Zhang, Li He, Yuxiang Ma, Chaonan Ma, Jiating Tu, and Siqi Li. 2021. "Sustainable Land-Use Allocation Model at a Watershed Level under Uncertainty" International Journal of Environmental Research and Public Health 18, no. 24: 13411. https://0-doi-org.brum.beds.ac.uk/10.3390/ijerph182413411