
Mapping Risk of Malaria as a Function of Anthropic and Environmental Conditions in Sussundenga Village, Mozambique

 , ,
, ,
Abstract
:1. Background
2. Methods
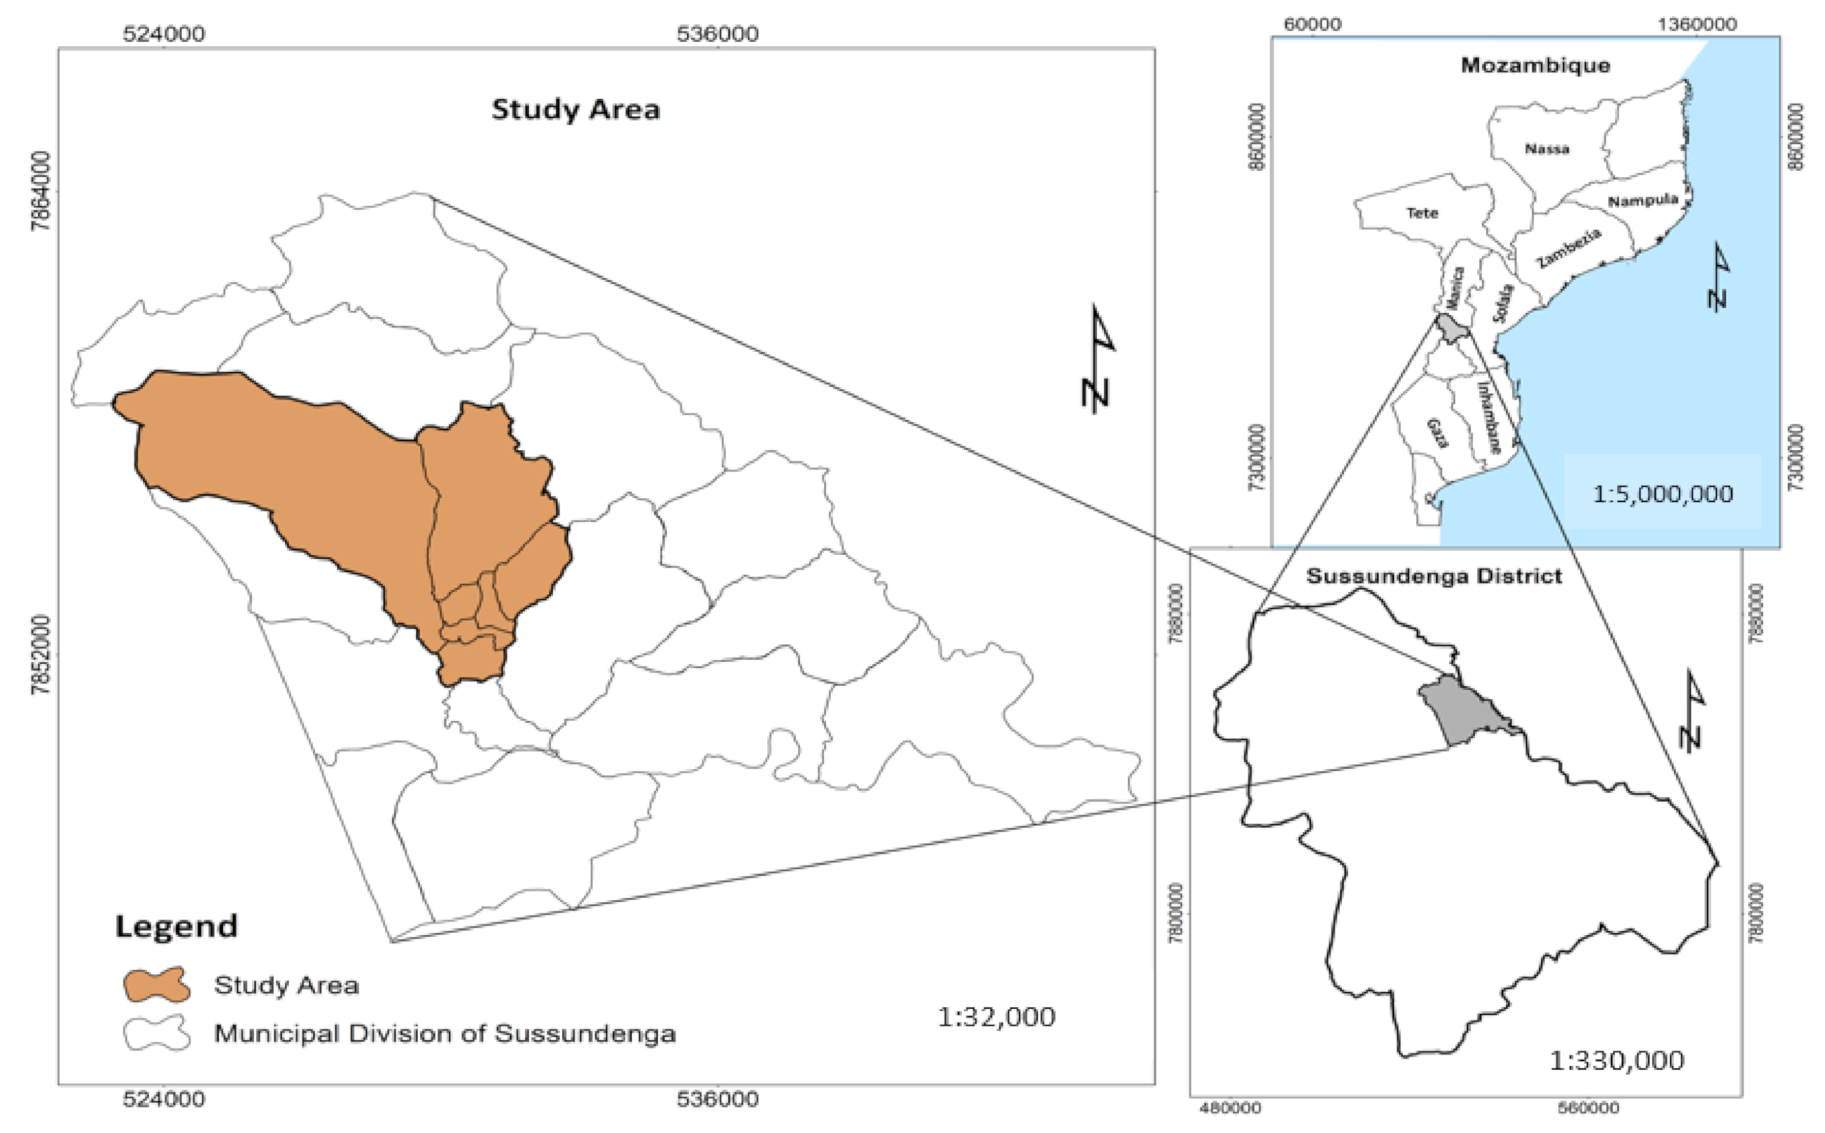
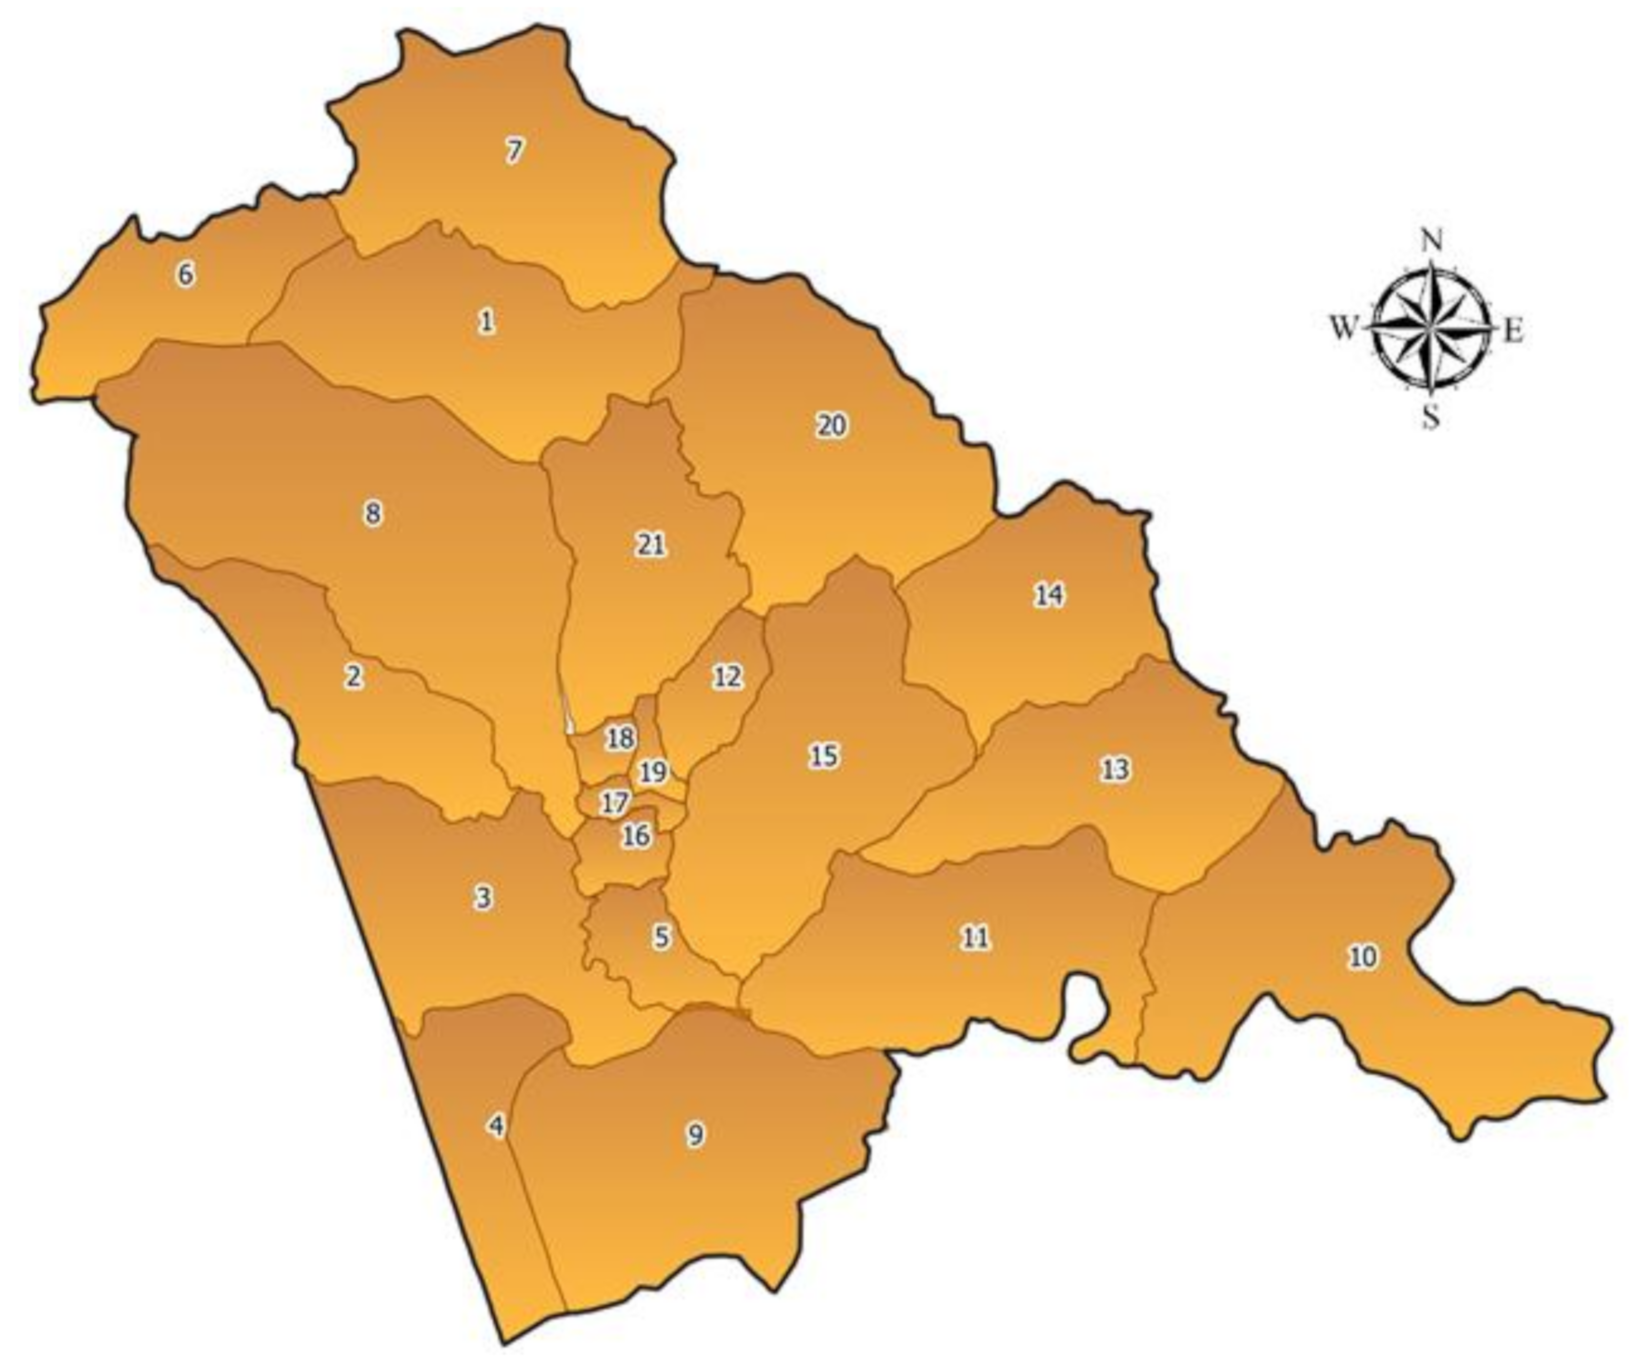
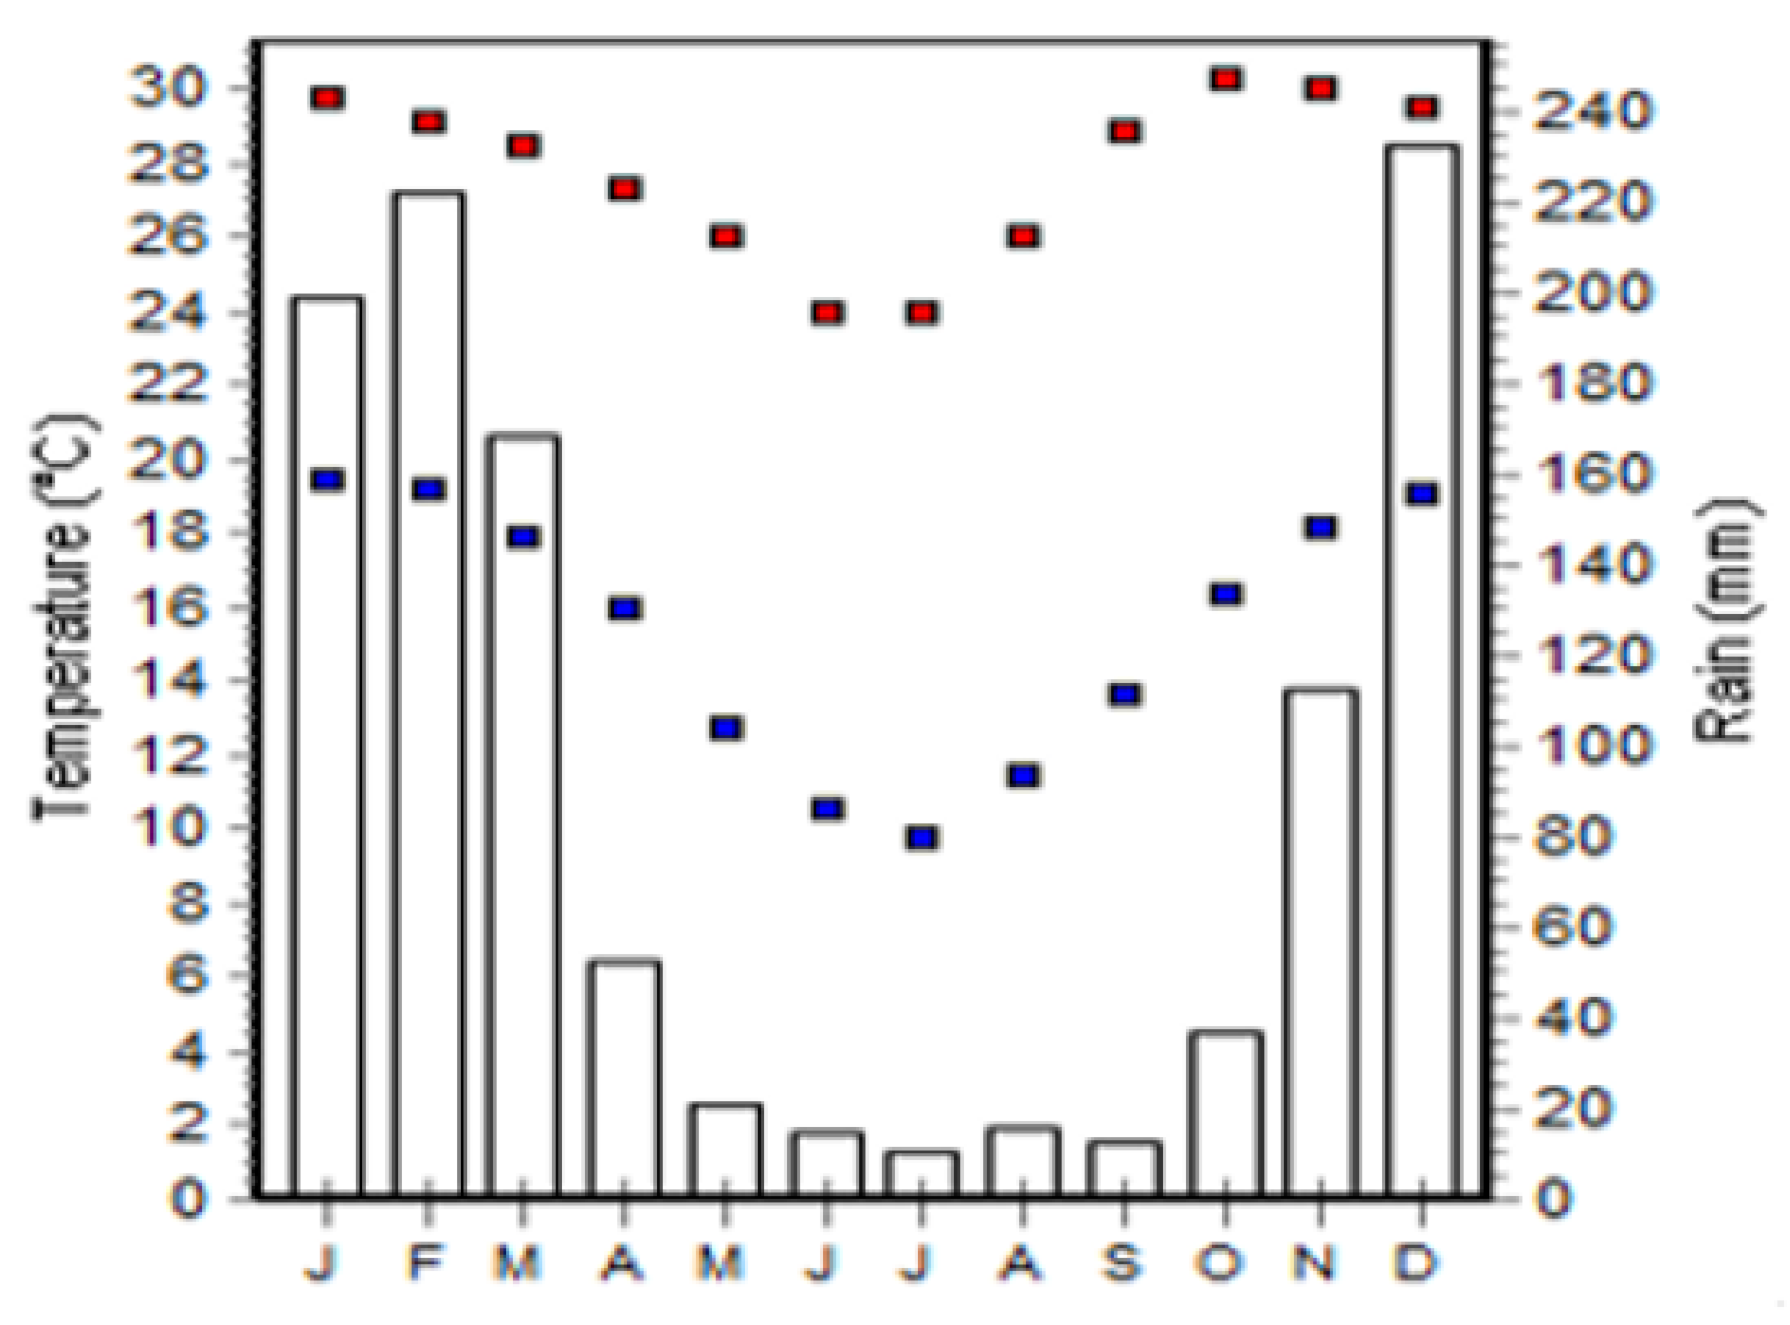
2.1. Study Area
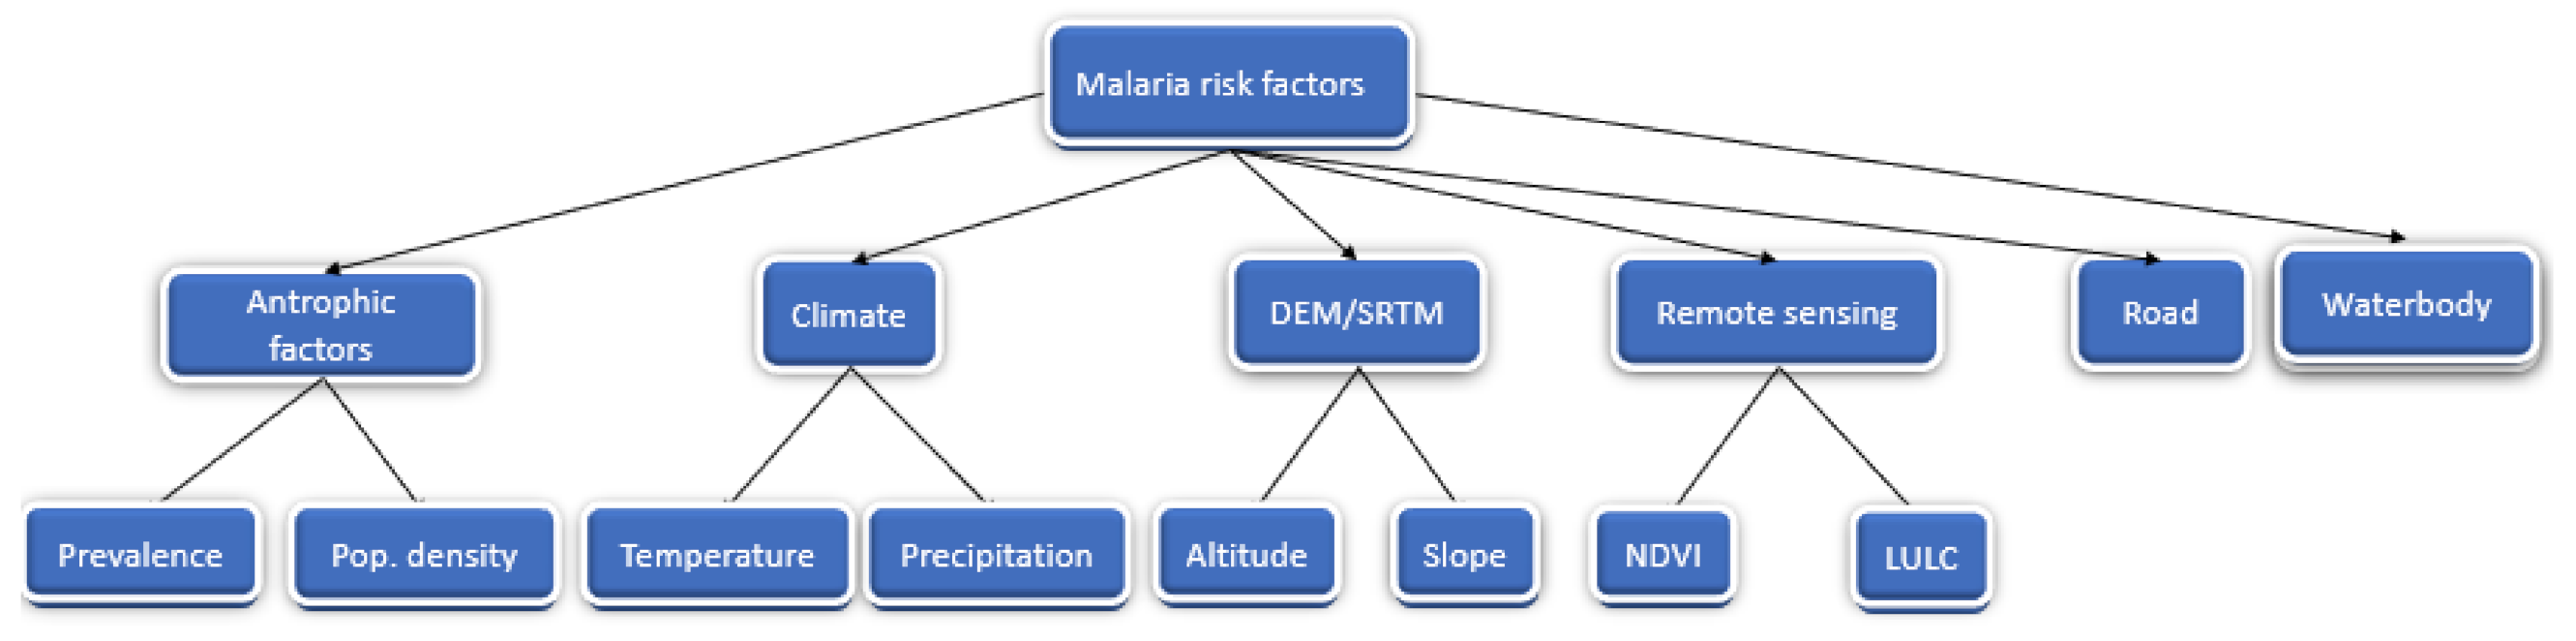
2.2. Data Collection and Analysis
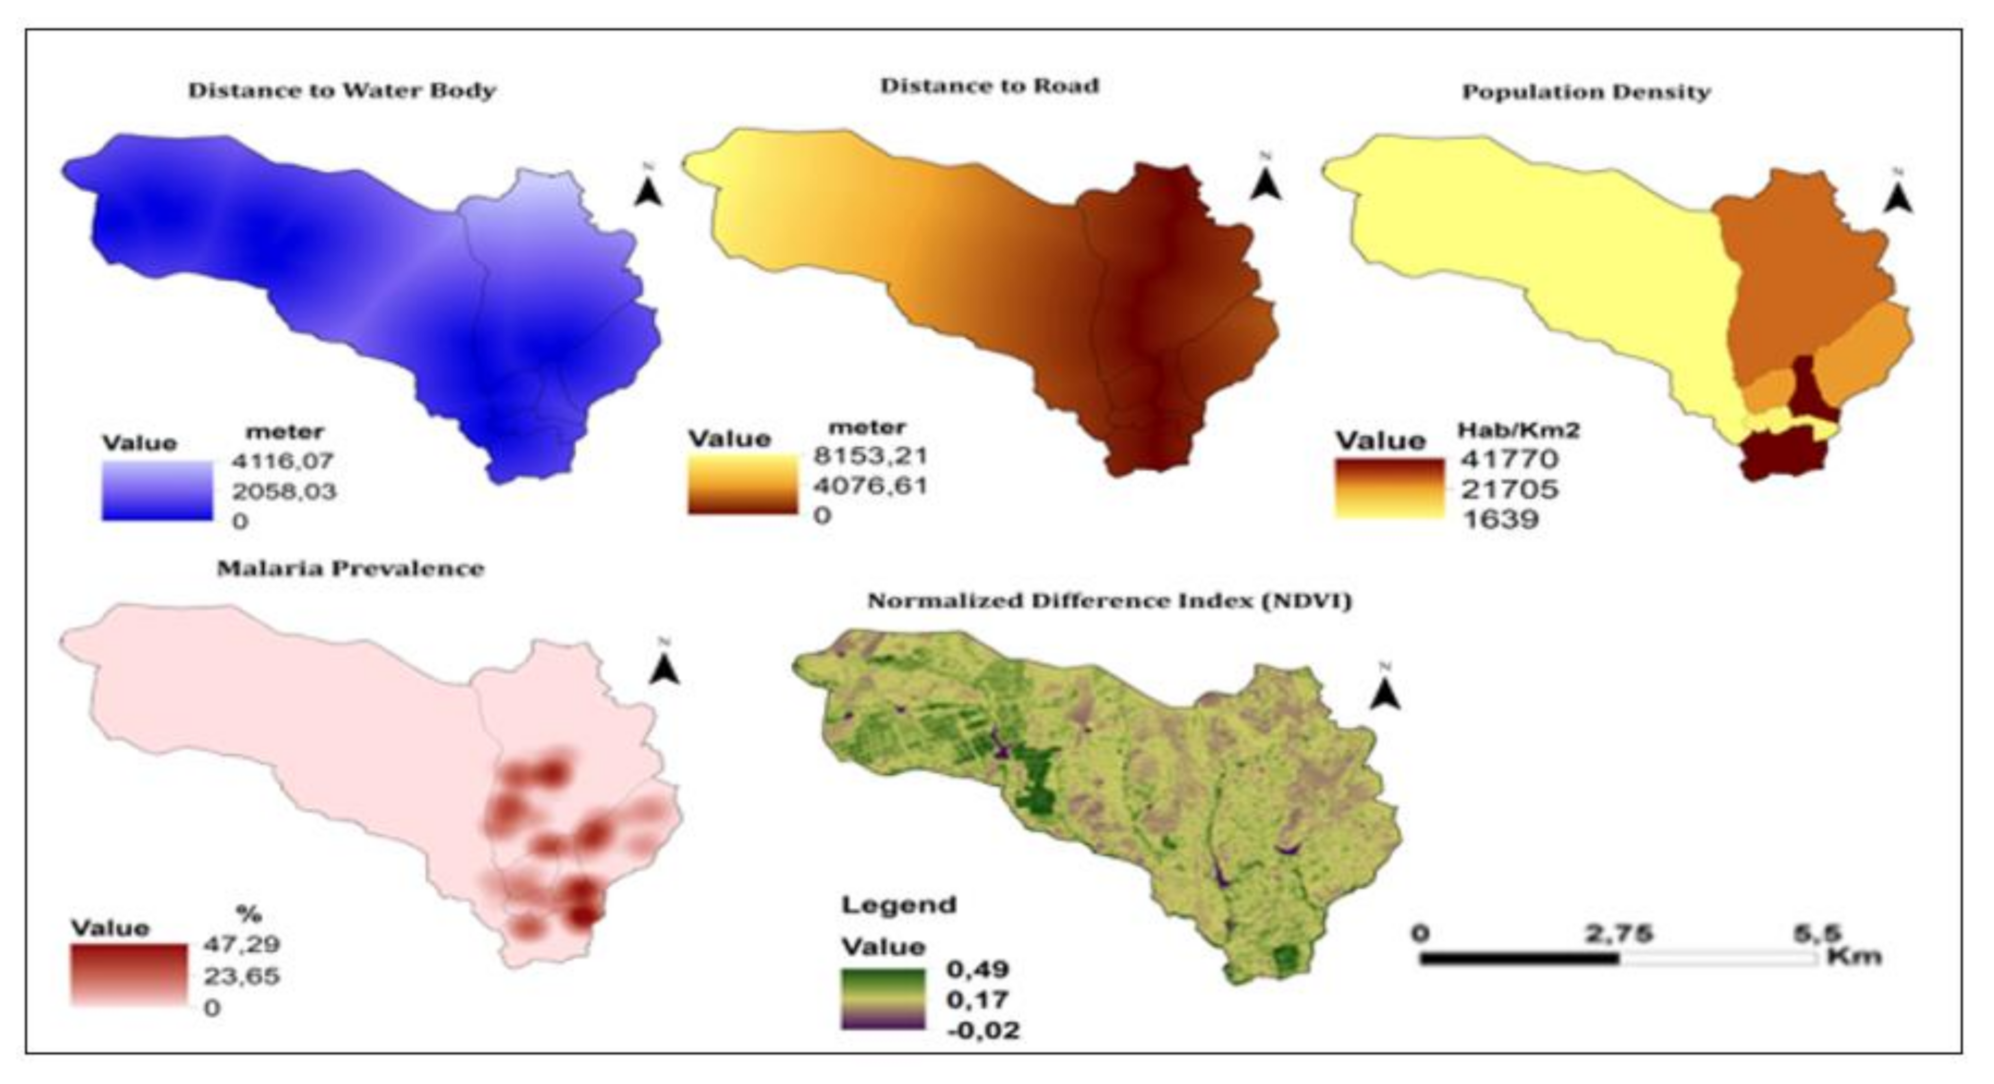
2.2.1. Point Prevalence
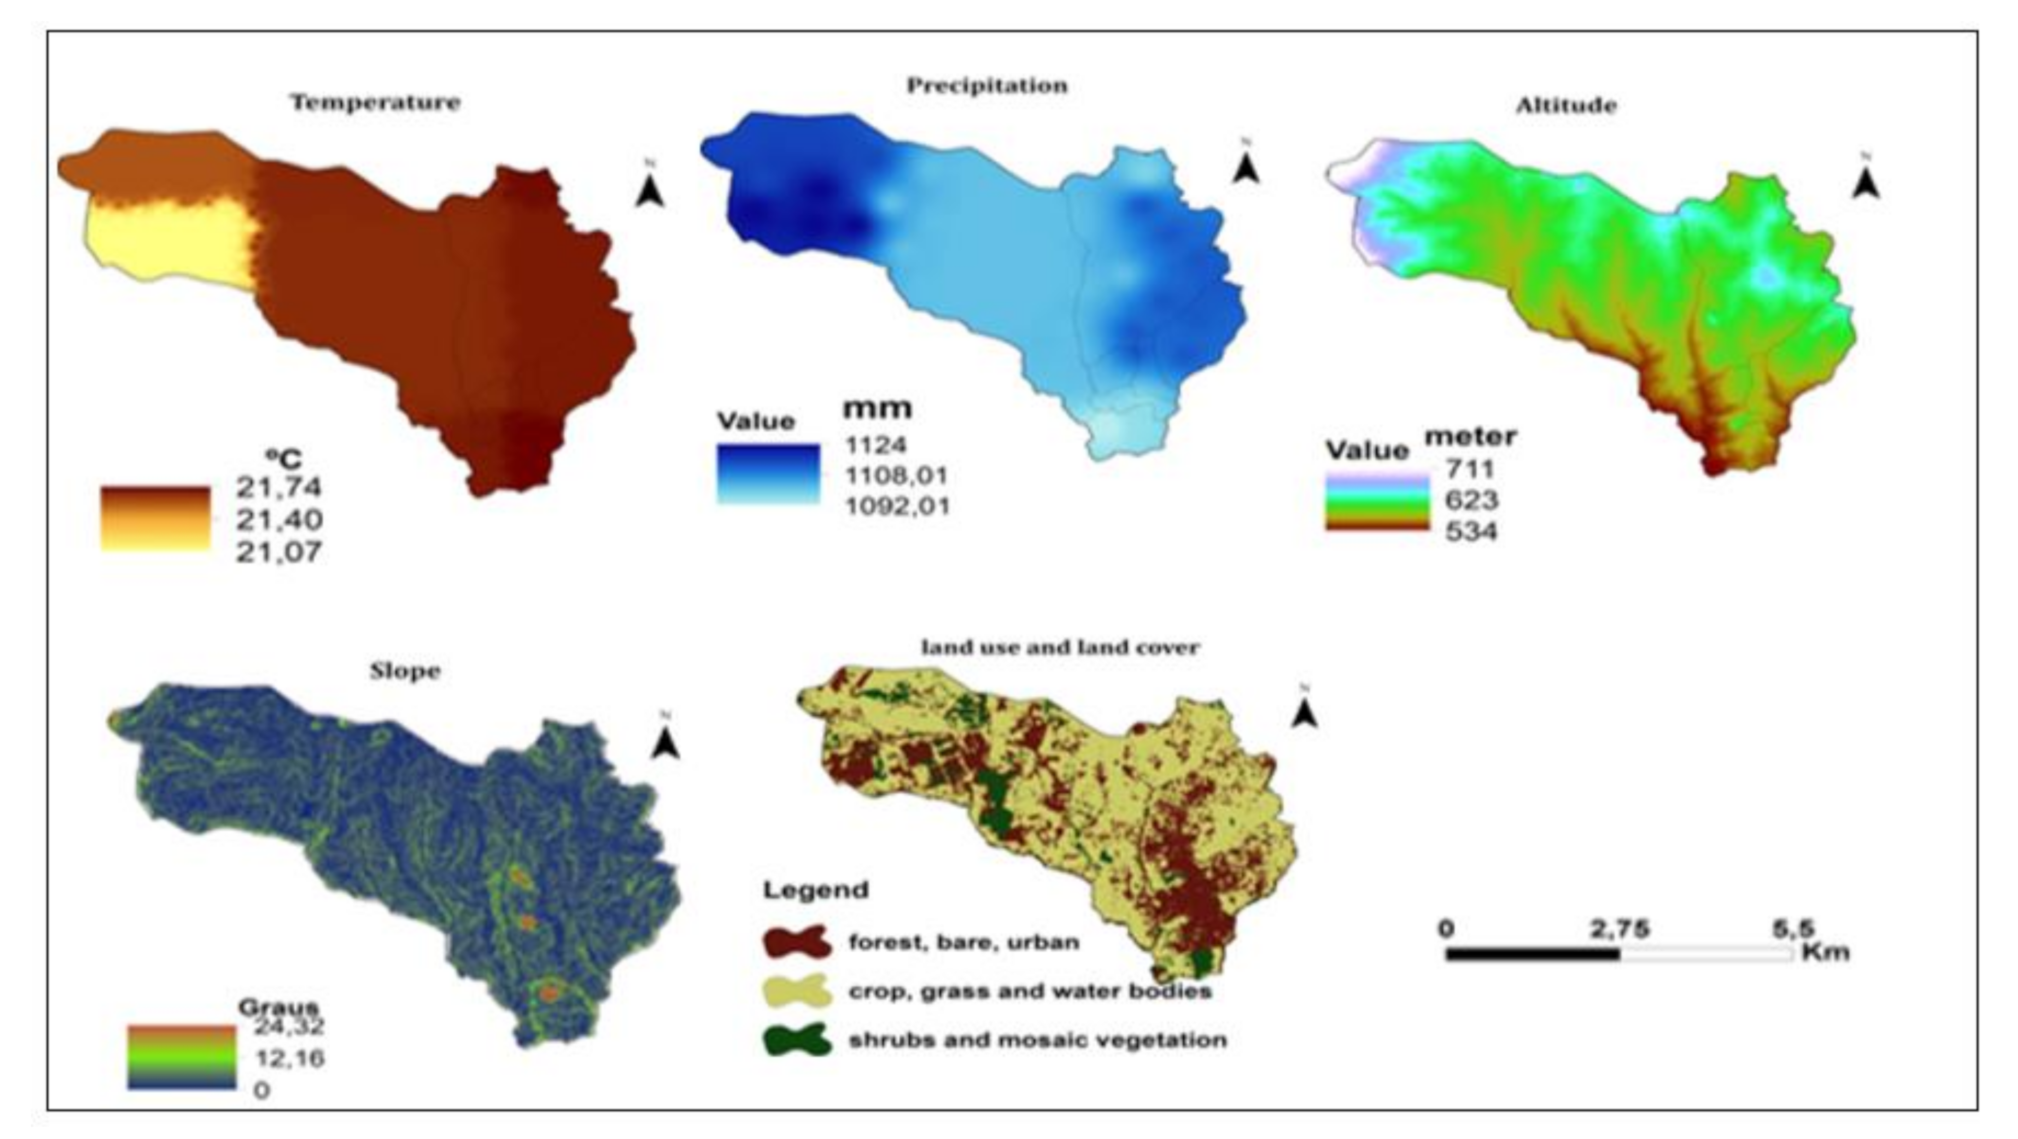
2.2.2. Average Temperature (°C)
2.2.3. Precipitation (mm)
2.2.4. Altitude (Meters)
2.2.5. Slope (Degrees)
2.2.6. Land Cover and Land Use (LULC)
- Agricultural crop area, grass. and water body.
- Shrubland and mosaic cover vegetation
- Forest, bare and urban settlement areas [18].
2.2.7. Distance to the Road (km)
2.2.8. Distance to Waterbodies (km)
2.2.9. Vegetation Index by Normalized Differences (NDVI)
2.2.10. Determining Risk Factor Weights (Analytical Hierarchical Process)
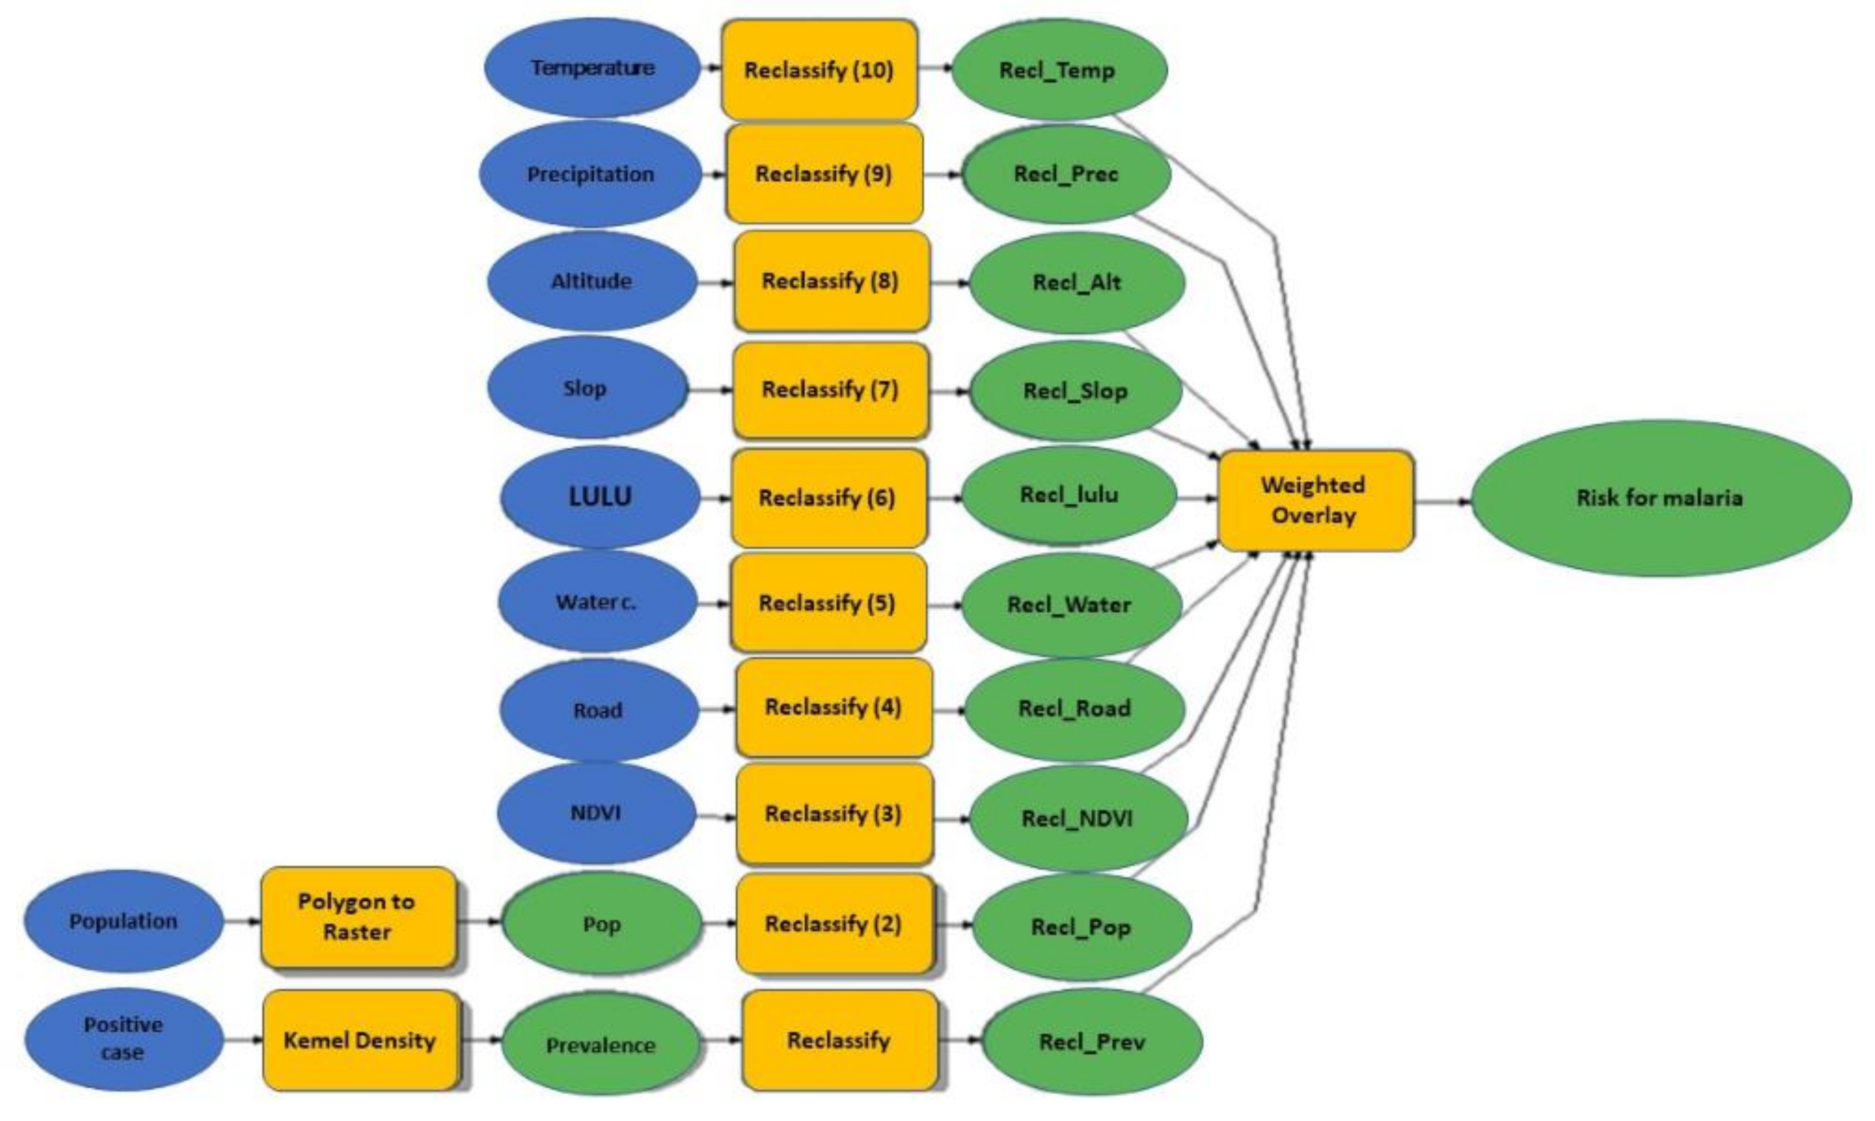
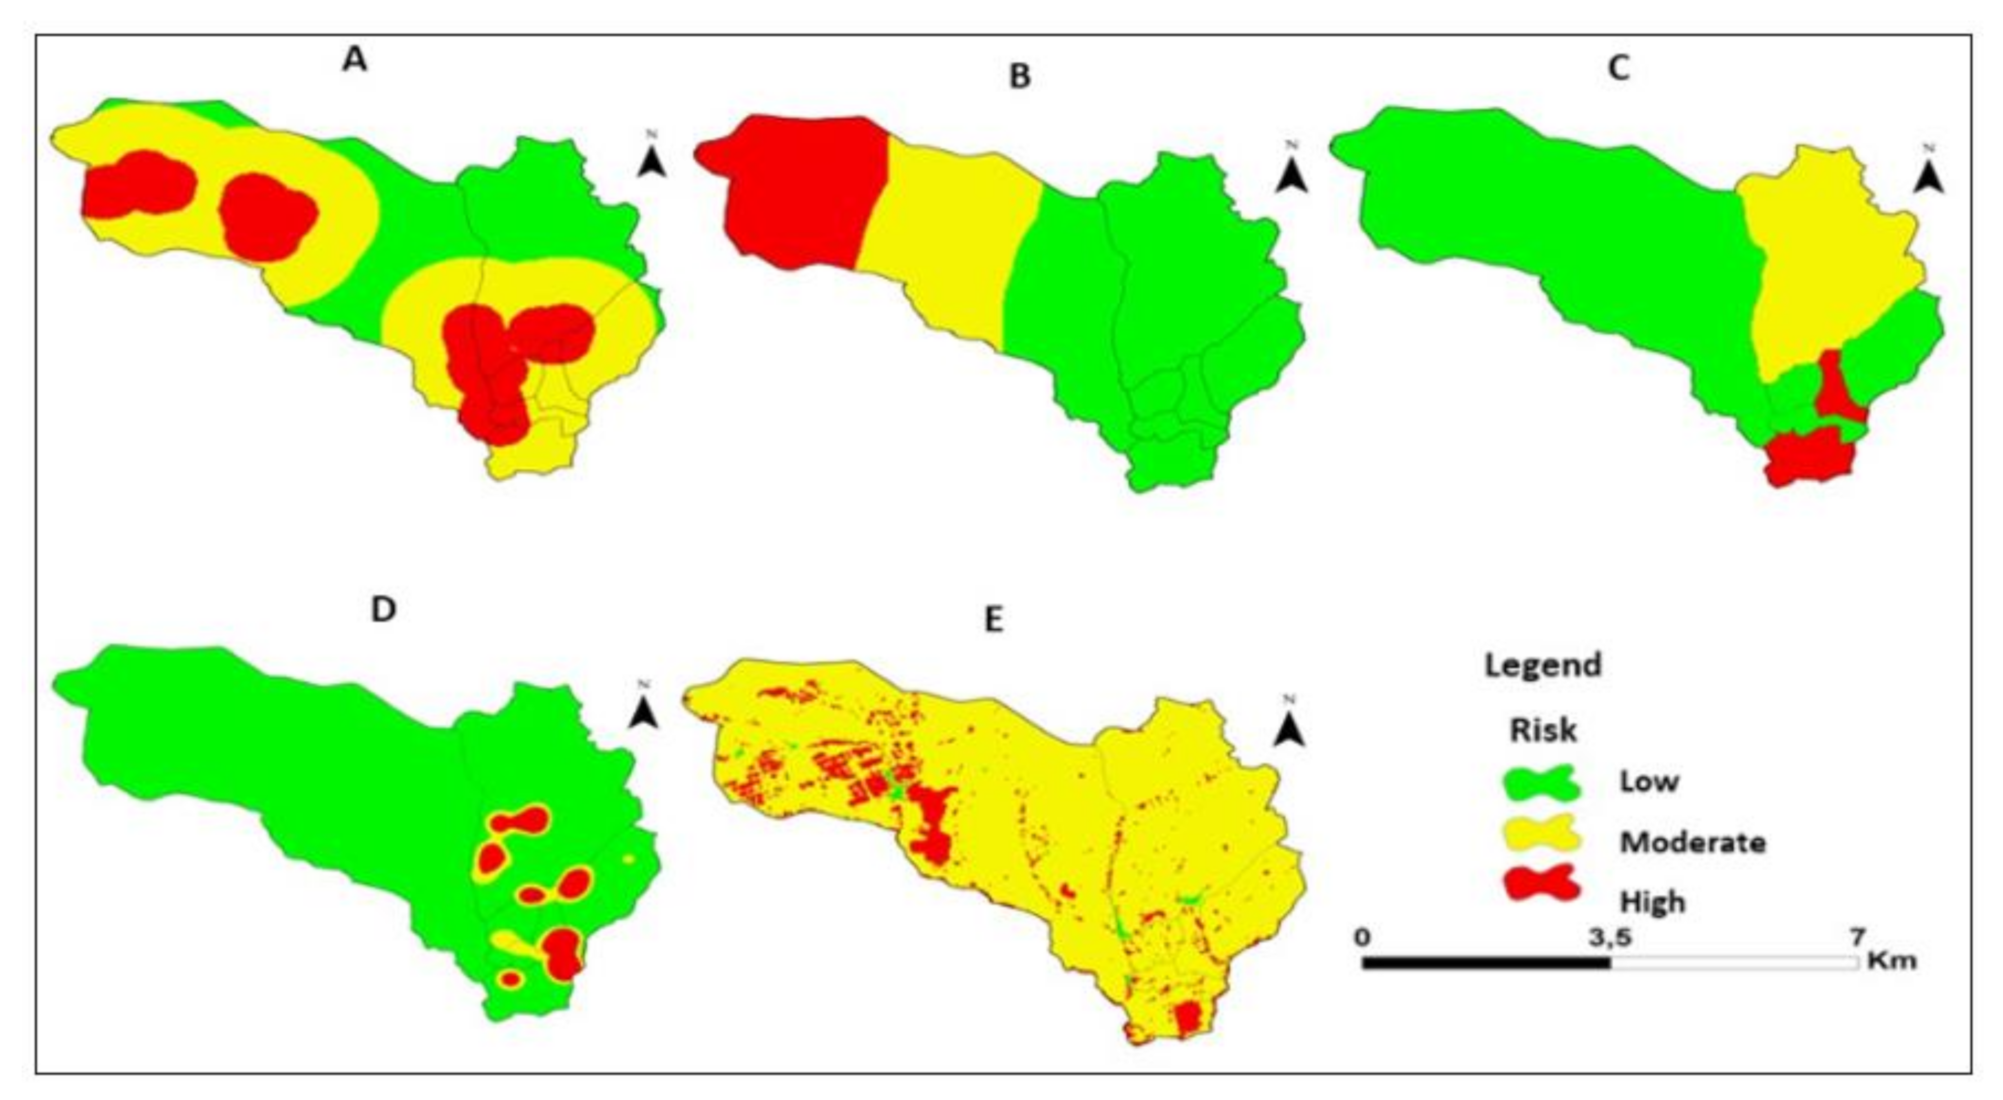
2.2.11. Mapping Risk of Malaria
2.2.12. Accuracy Assessment of the Produced Map
3. Results
Accuracy Check
4. Discussion
5. Limitations of the Study
6. Conclusions
Author Contributions
Funding
Institutional Review Board Statement
Informed Consent Statement
Acknowledgments
Conflicts of Interest
Appendix A
| Bands | Wavelength (µm) | Resolution (m) |
| Band 1—Coastal aerossol | 0.43–0.45 | 30 |
| Band 2—Blue | 0.45–0.51 | 30 |
| Band 3—Green | 0.53–0.59 | 30 |
| Band 4—Red | 0.64–0.67 | 30 |
| Band 5—Near Infrared (NIR) | 0.85–0.88 | 30 |
| Band 6—SWIR 1 | 1.57–1.65 | 30 |
| Band 7—SWIR 2 | 2.11–2.29 | 30 |
| Band 8—Panchromatic | 0.50–0.68 | 15 |
| Band 9—Cirrus | 1.36–1.38 | 30 |
| Band 10—Thermal Infrared (TIRS) 1 | 10.60–11.19 | 100 |
| Band 11—Thermal Infrared (TIRS) 2 | 11.50–12.51 | 100 |
Appendix B. Malaria Origin in Sussundenga Village
| Neighborhood | Number Malaria Patients | % | Accuracy |
| Nhamarenza | 3883 | 14.0 | Ok |
| Nhamizara | 7619 | 27.4 | Ok |
| 25 de Junho 2 | 2807 | 10.1 | Ok |
| 25 de Junho 1 | 2133 | 7.7 | Ok |
| Chicueu | 6575 | 23.6 | Ok |
| Unidade | 2077 | 7.5 | Failed |
| 7 de Abril | 2735 | 9.8 | Ok |
| Total | 27.829 | 100.0 |
References
- Word Health Organization. World Malaria Report 2019. Available online: https://www.who.int/publications/i/item/9789241565721 (accessed on 20 September 2020).
- Making Strides against Malaria in Mozambique. Available online: https://www.who.int/malaria/making-strides-against-malaria-in-mozambique (accessed on 19 April 2020).
- Instituto Nacional de Saúde (INS). Inquérito Nacional sobre Indicadores de Malária (IIM) 2018. Available online: https://microdata.worldbank.org/index.php/catalog/3488 (accessed on 20 September 2020).
- DPS. Relatório do Primeiro Semestre de 2020; Direccao Provincial de Saude de Manica: Chimoio, Mozambique, 2020. [Google Scholar]
- Ferrão, J.L.; Mendes, J.M.; Painho, M. Modelling the influence of climate on malaria occurrence in Chimoio Municipality. Mozambique. Parasites Vectors 2017, 10, 260. [Google Scholar] [CrossRef] [PubMed] [Green Version]
- Global Health Group. Malaria Elimination Country Briefings Published by the UCSF Global Health Group. Available online: https://malariaworld.org/blog/malaria-elimination-country-briefings-published-ucsf-global-health-group (accessed on 22 September 2020).
- Musa, G.J.; Chiang, P.H.; Sylk, T.; Bavley, R.; Keating, W.; Lakew, B.; Tsou, H.C.; Hoven, C.W. Use of GIS Mapping as a Public Health Tool-From Cholera to Cancer. Health Serv. Insights 2013. [Google Scholar] [CrossRef] [PubMed]
- de Oliveira, E.C.; dos Santos, E.S.; Zeilhofer, P.; Souza-Santos, R.; Atanaka-Santos, M. Geographic information systems and logistic regression for high-resolution Mapping risk of malaria in a rural settlement of the southern Brazilian Amazon. Malar. J. 2013. [Google Scholar] [CrossRef] [PubMed] [Green Version]
- Plano Estratégico do Município de Sussundenga. Public Presentation Workshop. 2018. Sussundenga. Manica. Mocambique. Unpublished work 2018.
- Mozambique Sussundega: Climate. Weather. Temperatures. Available online: http://www.levoyageur.net/weather-city-SUSSUNDENGA.html (accessed on 5 October 2020).
- Ferrao, J.L.; Niquisse, S.A.; Mendes, J.M.; Painho, M. Mapping and Modelling Malaria Risk Areas Using Climate. Socio-Demographic and Clinical Variables in Chimoio, Mozambique. Int. J. Environ. Res. Public Health 2018, 15, 795. [Google Scholar] [CrossRef] [PubMed] [Green Version]
- CDC. Principles of Epidemiology in Public Health Practice, 3rd ed.; CDC: Atlanta, GA, USA, 2006. Available online: https://www.cdc.gov/csels/dsepd/ss1978/SS1978.pdf (accessed on 5 October 2020).
- BIOCLIM: WorldClim Bioclimatic Variables (2000. 20. 50. 80). Available online: https://www.edenextdata.com/?q=content/bioclim-worldclim-bioclimatic-variables-2000-20-50-80 (accessed on 10 October 2020).
- ArcGIS Desktop 10.7.1 Quick Start Guide. Available online: https://desktop.arcgis.com/en/arcmap/10.7/get-started/setup/arcgis-desktop-quick-start-guide.htm (accessed on 10 October 2020).
- DIVA-GIS. Available online: https://www.gbif.org/tool/81420/diva-gis (accessed on 15 October 2020).
- USCGS. Digital Elevation Models (DEMs). Available online: https://www.usgs.gov/faqs/what-are-digital-elevation-models-dems?qt-news_science_products=0#qt-news_science_products (accessed on 15 October 2020).
- Lansat 8. Landsat-8 Imagery in the Period 2019. Available online: https://eoportal.org/web/eoportal/satellite-missions/l/landsat-8-2019 (accessed on 15 October 2020).
- NOAA. National Centers for Environmental Information. 2020. Available online: https://www.ncdc.noaa.gov/ (accessed on 15 October 2020).
- Acharya, T.D.; Lee, D.H.; Yang, I.T.; Lee, J.K. Identification of Water Bodies in a Landsat 8 OLI Image Using a J48 Decision Tree. Sensors 2016, 16, 1075. [Google Scholar] [CrossRef] [PubMed] [Green Version]
- Rouse, J.W. Monitoring vegetation systems in the great plains with ERTS. Third Earth Resour. Technol. Satell. Symp. 1973, 1, 309–317. Available online: http://0-doi-org.brum.beds.ac.uk/citeulike-article-id:12009708 (accessed on 2 November 2020).
- Tatjana, A.P.; Pachemska Martin, L.; Riste, T. Analytical Hierarchical Process (AHP) Method Application in the Process of Selection and Evaluation. 2014. Available online: http://rad.ihu.edu.gr/fileadmin/labsfiles/decision_support_systems/lessons/ahp/AHP_Lesson_1.pdf (accessed on 9 September 2020).
- Chikodzi, D. Spatial Modelling of Malaria Risk Zones Using Environmental. Anthropogenic Variables and GeograPhical Information Systems Techniques. J. Geosci. Geomat. 2013, 1, 8–14. [Google Scholar] [CrossRef]
- Hassaan, M.A.; Abdrabo, M.A.; Masabarakiza, P. GIS-Based Model for Mapping Malaria Risk under Climate Change Case Study: Burundi. J. Geosci. Environ. Prot. 2017, 5, 102–117. [Google Scholar] [CrossRef] [Green Version]
- Coile, G. The Analitycal Hierachical Process (AHP). Available online: https://training.fws.gov/courses/references/tutorials/geospatial/CSP7306/Readings/AHP-Technique.pdf (accessed on 5 January 2021).
- ESRI. Available online: https://www.esri.com/about/newsroom/wp-content/uploads/2019/05/understanding-weighted-overlay.pdf (accessed on 5 October 2020).
- Carter, B. Geographic Information System for Geoscientists: Modelling with GIS; Pergamon: Ottawa, ON, Canada, 1991; pp. 319–470. [Google Scholar]
- Bridges, D.J.; Chishimba, S.; Mwenda, M.; Winters, A.M.; Slawsky, E.; Mambwe, B.; Mulube, C.; Searle, K.M.; Hakalima, A.; Mwenechanya, R.; et al. The use of spatial and genetic tools to assess Plasmodium falciparum transmission in Lusaka. Zambia between 2011 and 2015. Malar. J. 2020, 19, 20. [Google Scholar] [CrossRef] [PubMed]
- Amratia, P.; Psychas, P.; Abuaku, B.; Ahorlu, C.; Millar, J.; Oppong, S.; Koram, K.; Valle, D. Characterizing local-scale heterogeneity of malaria risk: A case study in Bunkpurugu-Yunyoo district in northern Ghana. Malar. J. 2019, 18, 81. [Google Scholar] [CrossRef] [PubMed]
- Schubert, H.; Caballero Calvo, A.; Rauchecker, M.; Rojas-Zamora, O.; Brokamp, G.; Schütt, B. Assessment of Land Cover Changes in the Hinterland of Barranquilla (Colombia) Using Landsat Imagery and Logistic Regression. Land 2018, 7, 152. [Google Scholar] [CrossRef] [Green Version]
- Piedrahita, S.; Altamiranda-Saavedra, M.; Correa, M.M. Spatial fine-resolution model of malaria risk for the Colombian Pacific region. Trop. Med. Int. Health 2020, 25, 1024–1031. [Google Scholar] [CrossRef] [PubMed]
- Zhao, X.; Thanapongtharm, W.; Lawawirojwong, S.; Wei, C.; Tang, Y.; Zhou, Y.; Sun, X.; Cui, L.; Sattabongkot, J.; Kaewkungwal, J. Malaria Risk Map Using Spatial Multi-Criteria Decision Analysis along Yunnan Border During the Pre-elimination Period. Am. J. Trop. Med. Hyg. 2020, 103, 793–809. [Google Scholar] [CrossRef] [PubMed]
- Ferrao, J.L. Characterising, Modelling and Mapping Malaria Occurrence and Its Mortality Trend for Precision Public Health. Repositorio Universidade Nova. Available online: https://run.unl.pt/handle/10362/64068?locale=en (accessed on 2 January 2021).
- Sanchez-Ribas, J.; Parra-Henao, G.; Guimaraes, A.E. Impact of dams and irrigation schemes in Anopheline (Diptera: Culicidae) bionomics and malaria epidemiology. Rev. Inst. Med. Trop. São Paulo. 2012, 54, 179–191. Available online: http://www.scielo.br/scielo.php?script=sci_arttext&pid=s0036-46652012000400001&nrm=iso (accessed on 2 September 2020). [CrossRef] [PubMed] [Green Version]
- Kibret, S.; Lautze, J.; McCartney, M.; Nhamo, L.; Yan, G. Malaria around large dams in Africa: Effect of environmental and transmission endemicity factors. Malar. J. 2019, 18, 303. [Google Scholar] [CrossRef] [PubMed] [Green Version]
- Thompson, R.; Begtrup, K.; Cuamba, N.; Dgege, M.; Mendes, C.; Gamage-Mendes, A.; Enosse, S.M.; Barreto, J.; Sinden, R.E.; Hogh, B. The Matola malaria Project: A temporal and spatial transmission of malaria disease in a suburban area of Maputo. Mozambique. Am. J. Trop. Hyg. 1997, 57, 550–559. [Google Scholar] [CrossRef] [PubMed]
- Krefis, A.C.; Schwarz, N.G.; Nkrumah, B.; Acquah, S.; Loag, W.; Oldeland, J.; Sarpong, N.; Adu-Sarkodie, Y.; Ranft, U.; May, J. Spatial Analysis of Land Cover Determinants of Malaria Incidence in the Ashanti Region, Ghana. PLoS ONE 2011, 6, e17905. [Google Scholar] [CrossRef] [PubMed]
- Rakotoarison, H.A.; Rasamimalala, M.; Rakotondramanga, J.M.; Ramiranirina, B.; Franchard, T.; Kapesa, L.; Razafindrakoto, J.; Guis, H.; Tantely, L.M.; Girod, R.; et al. Remote Sensing and Multi-Criteria Evaluation for Malaria Risk Mapping to Support Indoor Residual Spraying Prioritization in the Central Highlands of Madagascar. Remote Sens. 2020, 12, 1585. [Google Scholar] [CrossRef]
- Sturrock, H.J.; Cohen, J.M.; Keil, P.; Tatem, A.J.; Le Menach, A.; Ntshalintshali, N.E.; Hsiang, M.S.; Gosling, R.D. Fine-scale Mapping risk of malaria from routine aggregated case data. Malar. J. 2014, 13, 421. [Google Scholar] [CrossRef] [PubMed] [Green Version]


| Risk Factor | Weight % | Class | Rank | Risk Degree |
|---|---|---|---|---|
| Average Temperature °C | 22.4 | 22–32 | 3 | High |
| >32 | 2 | Moderate | ||
| <22 | 1 | Low | ||
| Precipitation (mm) | 20.8 | >700 | 3 | High |
| 450–700 | 2 | Moderate | ||
| <450 | 1 | Low | ||
| Altitude (mm) | 10.4 | <200 | 3 | High |
| 201–500 | 2 | Moderate | ||
| >500 | 1 | Low | ||
| Slope (degrees) | 7.3 | 0–5 | 3 | High |
| 5–15 | 2 | Moderate | ||
| >15 | 1 | Low | ||
| LULC | 8.2 | Agric. crop area, grass and water body. | 3 | High |
| Shrubland & mosaic cover vegetation | 2 | Moderate | ||
| Forest, bare and urban settlement | 1 | Low | ||
| DTWB (km) | <500 | 3 | High | |
| 500–1500 | 2 | Moderate | ||
| >1500 | 1 | Low | ||
| DTR (km) | 3.8 | >5 | 3 | High |
| 2.5–5 | 2 | Moderate | ||
| <2.5 | 1 | Low | ||
| Pop. Density | 5.1 | >9000 | 3 | High |
| 6001–9000 | 2 | Moderate | ||
| <6000 | 1 | Low | ||
| Prevalence (%) | 5.1 | >21 | 3 | High |
| 14–21 | 2 | Moderate | ||
| <14 | 1 | Low | ||
| NDVI | 4.7 | 0.255–0.986 | 3 | High |
| 0–0.25 | 2 | Moderate | ||
| −0.288–0 | 1 | Low |
| 1 | Equal importance | Two factors also contribute equally to the objective. |
| 3 | Moderate importance | Experience and judgment slightly favor one factor in relation to the other. |
| 5 | Much more important | Experience and judgment strongly favor one factor over the other |
| 7 | Very important | Experience and judgment very strongly favor one over the other factor. |
| 9 | Absolutely important | The evidence favoring one over the other is the highest possible validity |
| 2,4,6,8 | Intermediate values | When compromise is needed |
| Risk Factor | T Average | Prep | Alt | SLP | LULC | DTWB | DTR | Pop | Prev | NDVI |
|---|---|---|---|---|---|---|---|---|---|---|
| T average | 1.00 | 1.00 | 3.00 | 4.00 | 4.00 | 2.00 | 7.00 | 4.00 | 4.00 | 5.00 |
| PP | 1.00 | 1.00 | 3.00 | 4.00 | 3.00 | 1.00 | 7.00 | 4.00 | 4.00 | 3.00 |
| Alt | 0.33 | 0.33 | 1.00 | 3.00 | 3.00 | 1.00 | 4.00 | 2.00 | 2.00 | 3.00 |
| SLP | 0.25 | 0.25 | 0.33 | 1.00 | 1.00 | 2.00 | 1.00 | 3.00 | 2.00 | 2.00 |
| LULC | 0.25 | 0.33 | 0.33 | 1.00 | 1.00 | 2.00 | 2.00 | 3.00 | 1.00 | 1.00 |
| DTWB | 0.50 | 1.00 | 1.00 | 0.50 | 0.50 | 1.00 | 2.00 | 3.00 | 3.00 | 2.00 |
| DTR | 0.14 | 0.14 | 0.25 | 1.00 | 0.50 | 0.50 | 1.00 | 1.00 | 1.00 | 2.00 |
| Pop den | 0.25 | 0.25 | 0.50 | 0.33 | 0.33 | 0.33 | 1.00 | 1.00 | 2.00 | 4.00 |
| Prevalence | 0.25 | 0.25 | 0.50 | 0.50 | 1.00 | 0.33 | 1.00 | 0.50 | 1.00 | 2.00 |
| NDVI | 0.20 | 0.33 | 0.33 | 0.50 | 1.00 | 0.50 | 0.50 | 0.25 | 0.50 | 1.00 |
| Value | Risk Classification | Area (Hectare) | Percentage |
|---|---|---|---|
| 1 | Hight | 244.44 | 7.59 |
| 2 | Moderate | 2972.34 | 92.41 |
| Total | 3216.78 | 100 |
Publisher’s Note: MDPI stays neutral with regard to jurisdictional claims in published maps and institutional affiliations. |
© 2021 by the authors. Licensee MDPI, Basel, Switzerland. This article is an open access article distributed under the terms and conditions of the Creative Commons Attribution (CC BY) license (http://creativecommons.org/licenses/by/4.0/).
Share and Cite
Ferrão, J.L.; Earland, D.; Novela, A.; Mendes, R.; Ballat, M.F.; Tungaza, A.; Searle, K.M. Mapping Risk of Malaria as a Function of Anthropic and Environmental Conditions in Sussundenga Village, Mozambique. Int. J. Environ. Res. Public Health 2021, 18, 2568. https://0-doi-org.brum.beds.ac.uk/10.3390/ijerph18052568
Ferrão JL, Earland D, Novela A, Mendes R, Ballat MF, Tungaza A, Searle KM. Mapping Risk of Malaria as a Function of Anthropic and Environmental Conditions in Sussundenga Village, Mozambique. International Journal of Environmental Research and Public Health. 2021; 18(5):2568. https://0-doi-org.brum.beds.ac.uk/10.3390/ijerph18052568
Chicago/Turabian StyleFerrão, João L., Dominique Earland, Anísio Novela, Roberto Mendes, Marcos F. Ballat, Alberto Tungaza, and Kelly M. Searle. 2021. "Mapping Risk of Malaria as a Function of Anthropic and Environmental Conditions in Sussundenga Village, Mozambique" International Journal of Environmental Research and Public Health 18, no. 5: 2568. https://0-doi-org.brum.beds.ac.uk/10.3390/ijerph18052568