
Evaluation of Social Values for Ecosystem Services in Urban Riverfront Space Based on the SolVES Model: A Case Study of the Fenghe River, Xi’an, China

Abstract
:1. Introduction
2. Materials and Methods
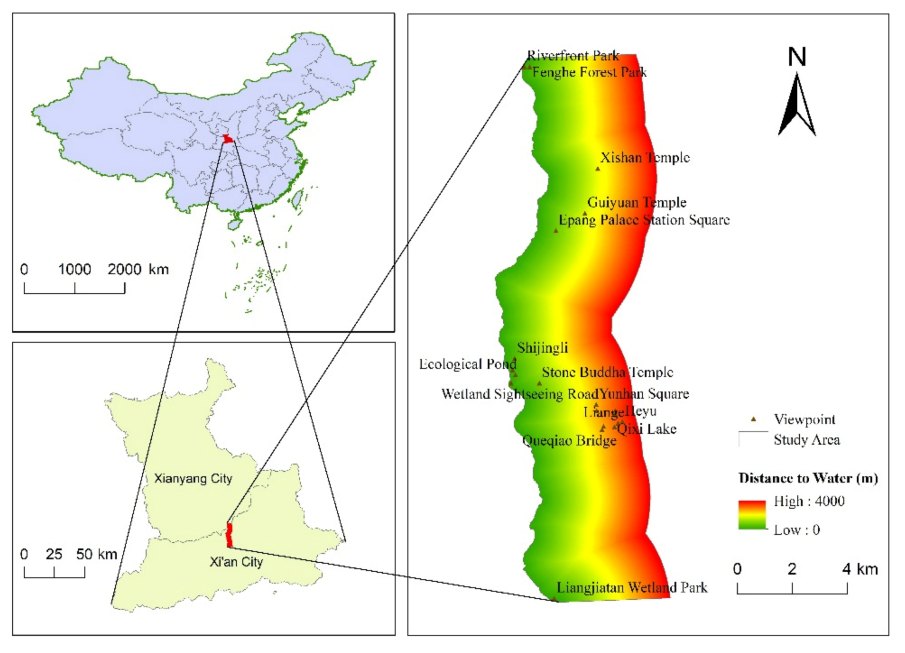
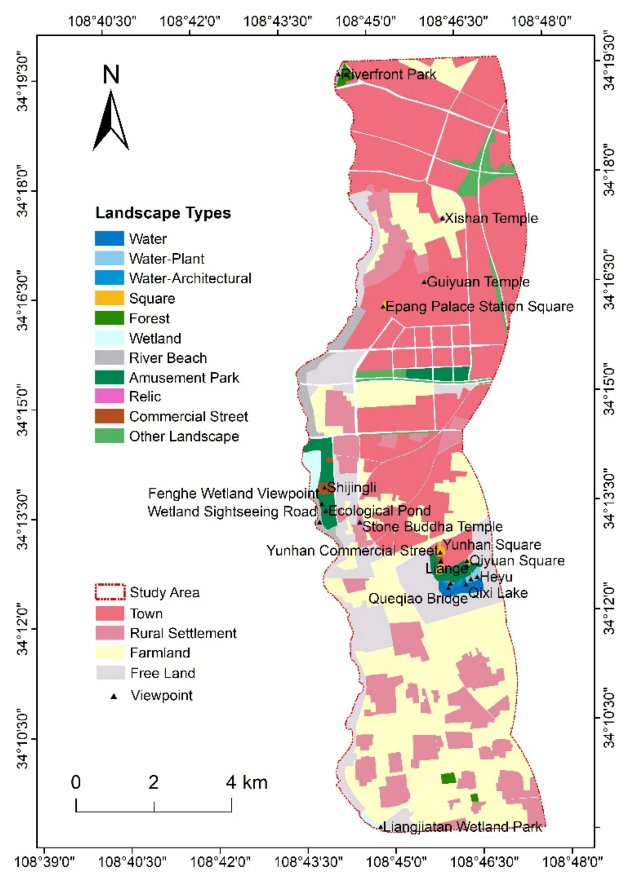
2.1. Study Area
2.2. Survey Data Collection
2.3. Spatial Data
2.4. SolVES as a Value Assessment Tool
2.5. Data Analysis
- (1)
- We entered the collected valid questionnaires into SPSS and Excel, and counted the age, gender, travel season, travel satisfaction, etc. of the respondents to determine the demographic characteristics of the respondents.
- (2)
- By using the SolVES model of ArcGIS 10.0, the average nearest neighbor tool was used to analyze the social value points labeled by each social value type, and the spatial clustering results of social value points on the east bank of the Fenghe River were obtained.
- (3)
- By comparing the spatial distribution characteristics of various social values in the social value maps output by the SolVES model based on four environmental variables (DTW univariate; DTR univariate; LT univariate; and DTW, DTR, and LT integrated variables), the influences of these variables on the spatial distribution pattern of social value were determined.
- (4)
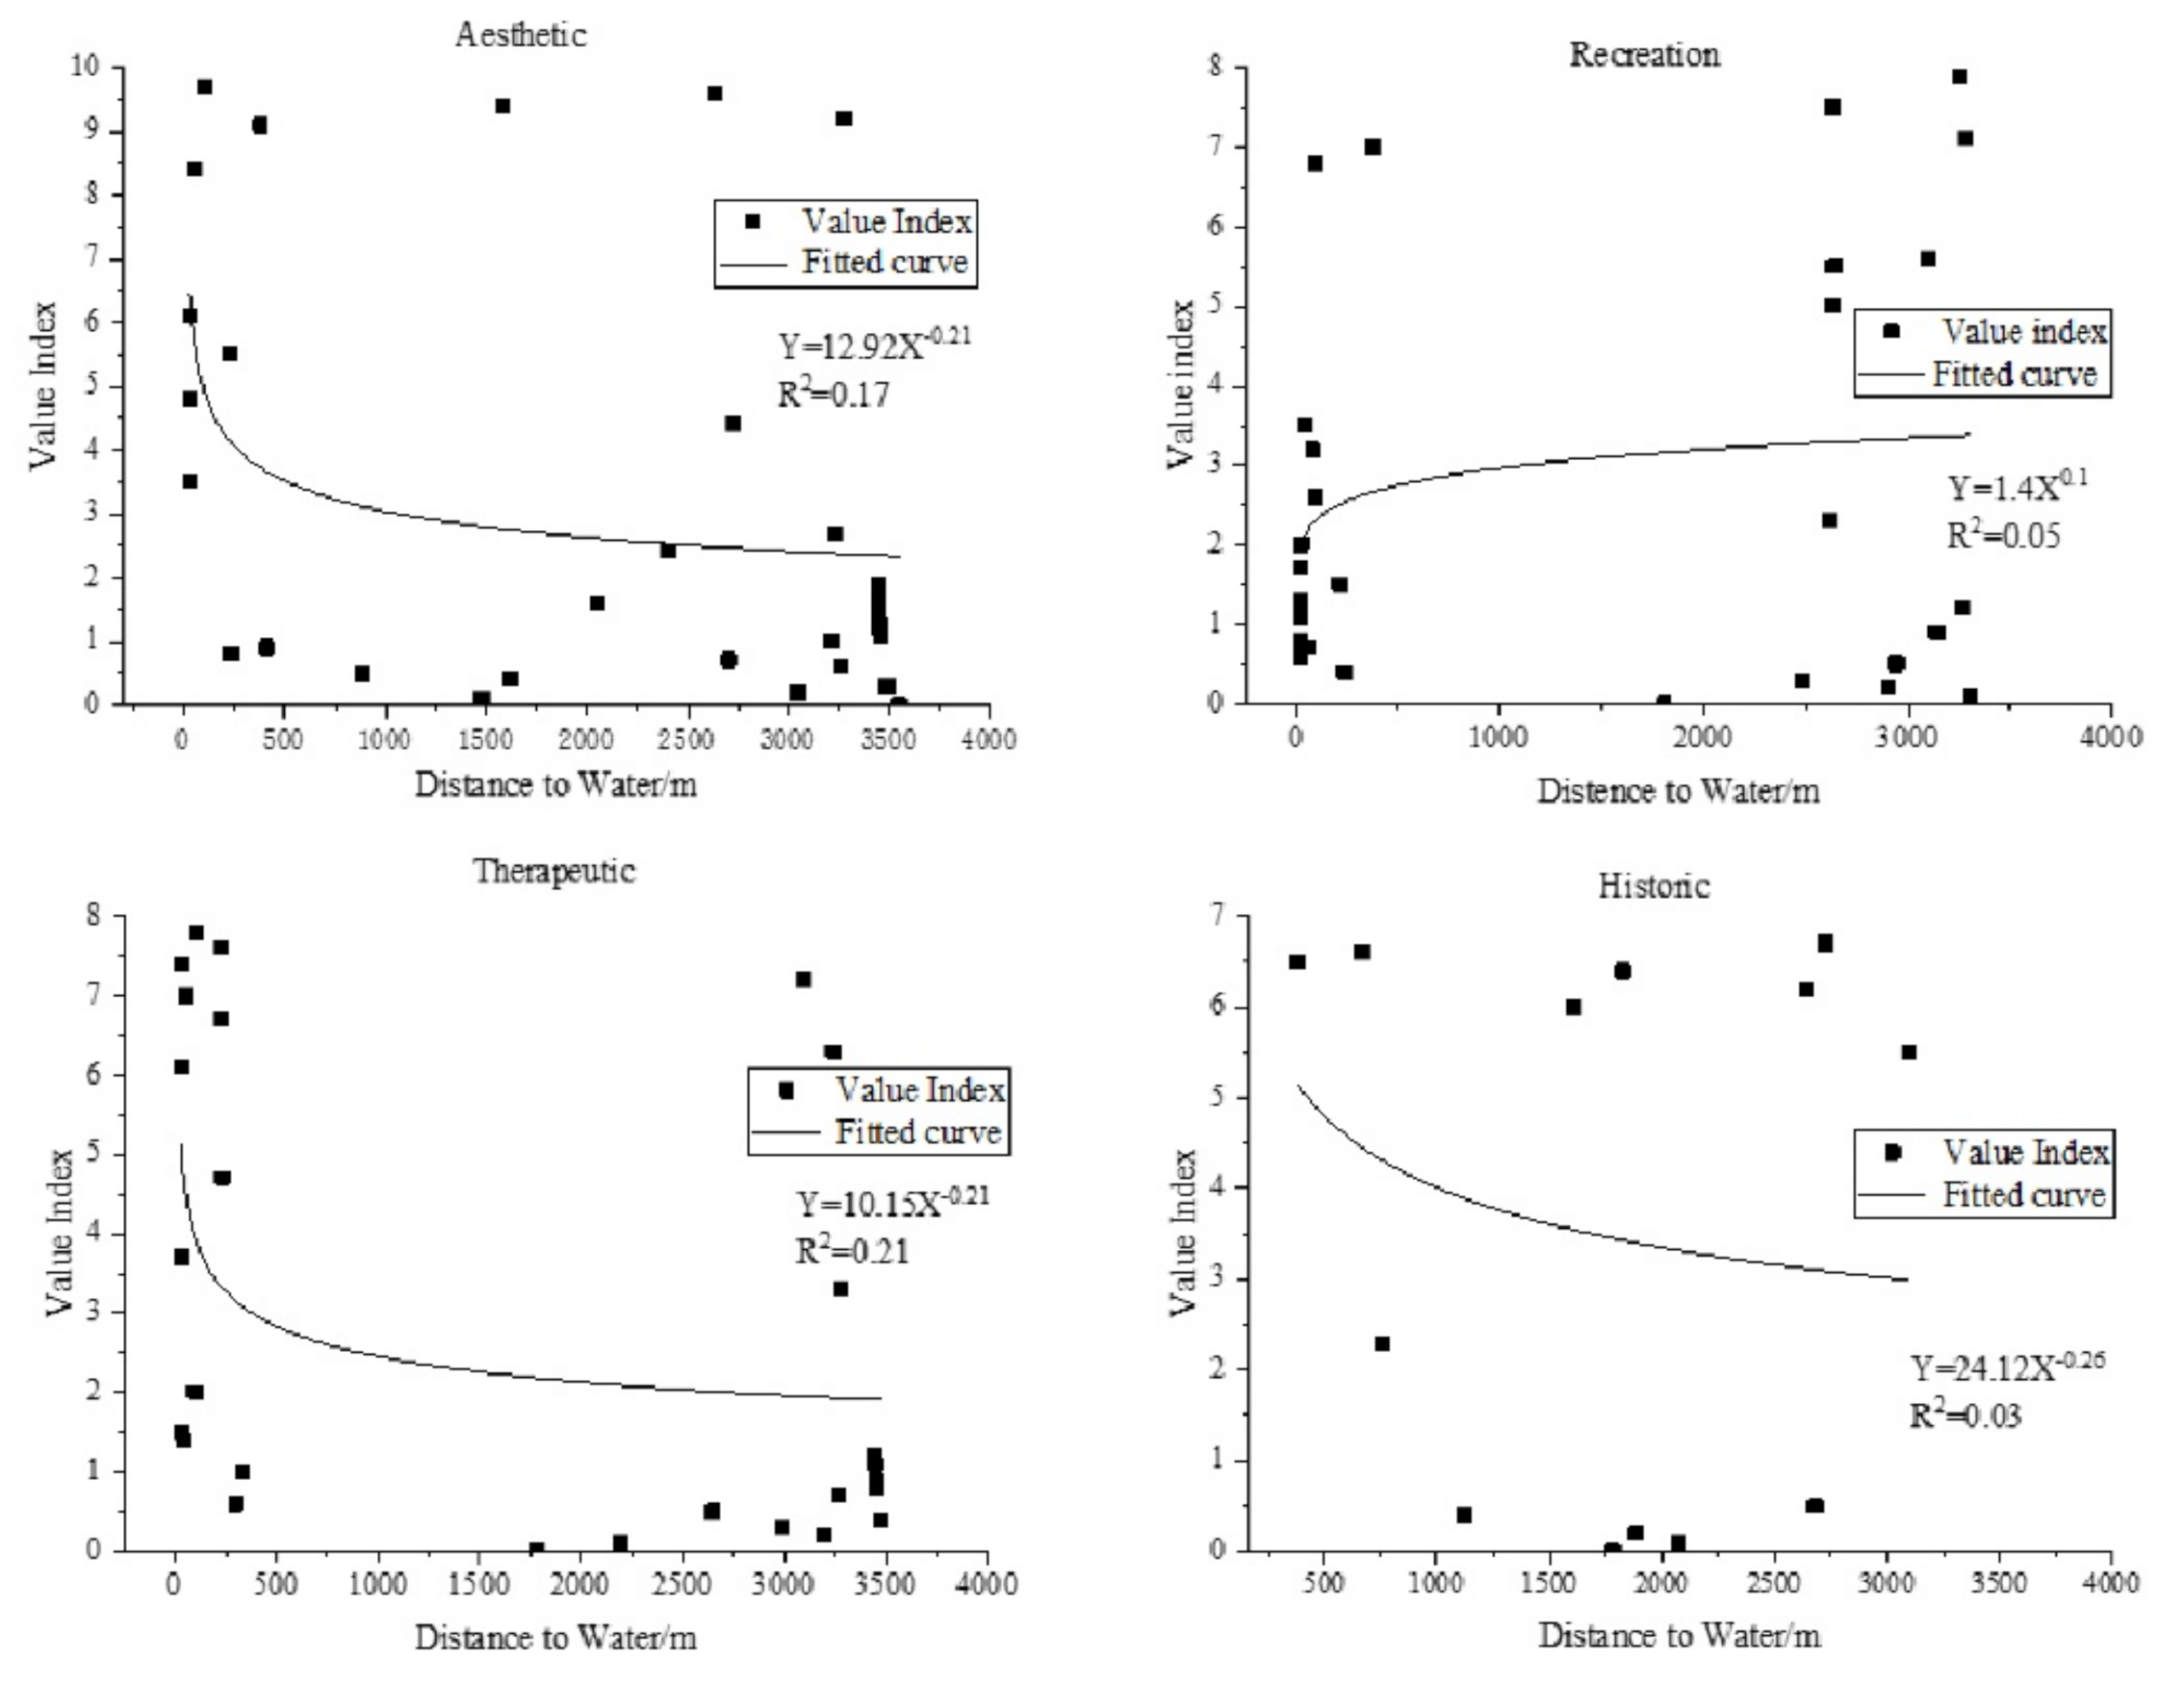
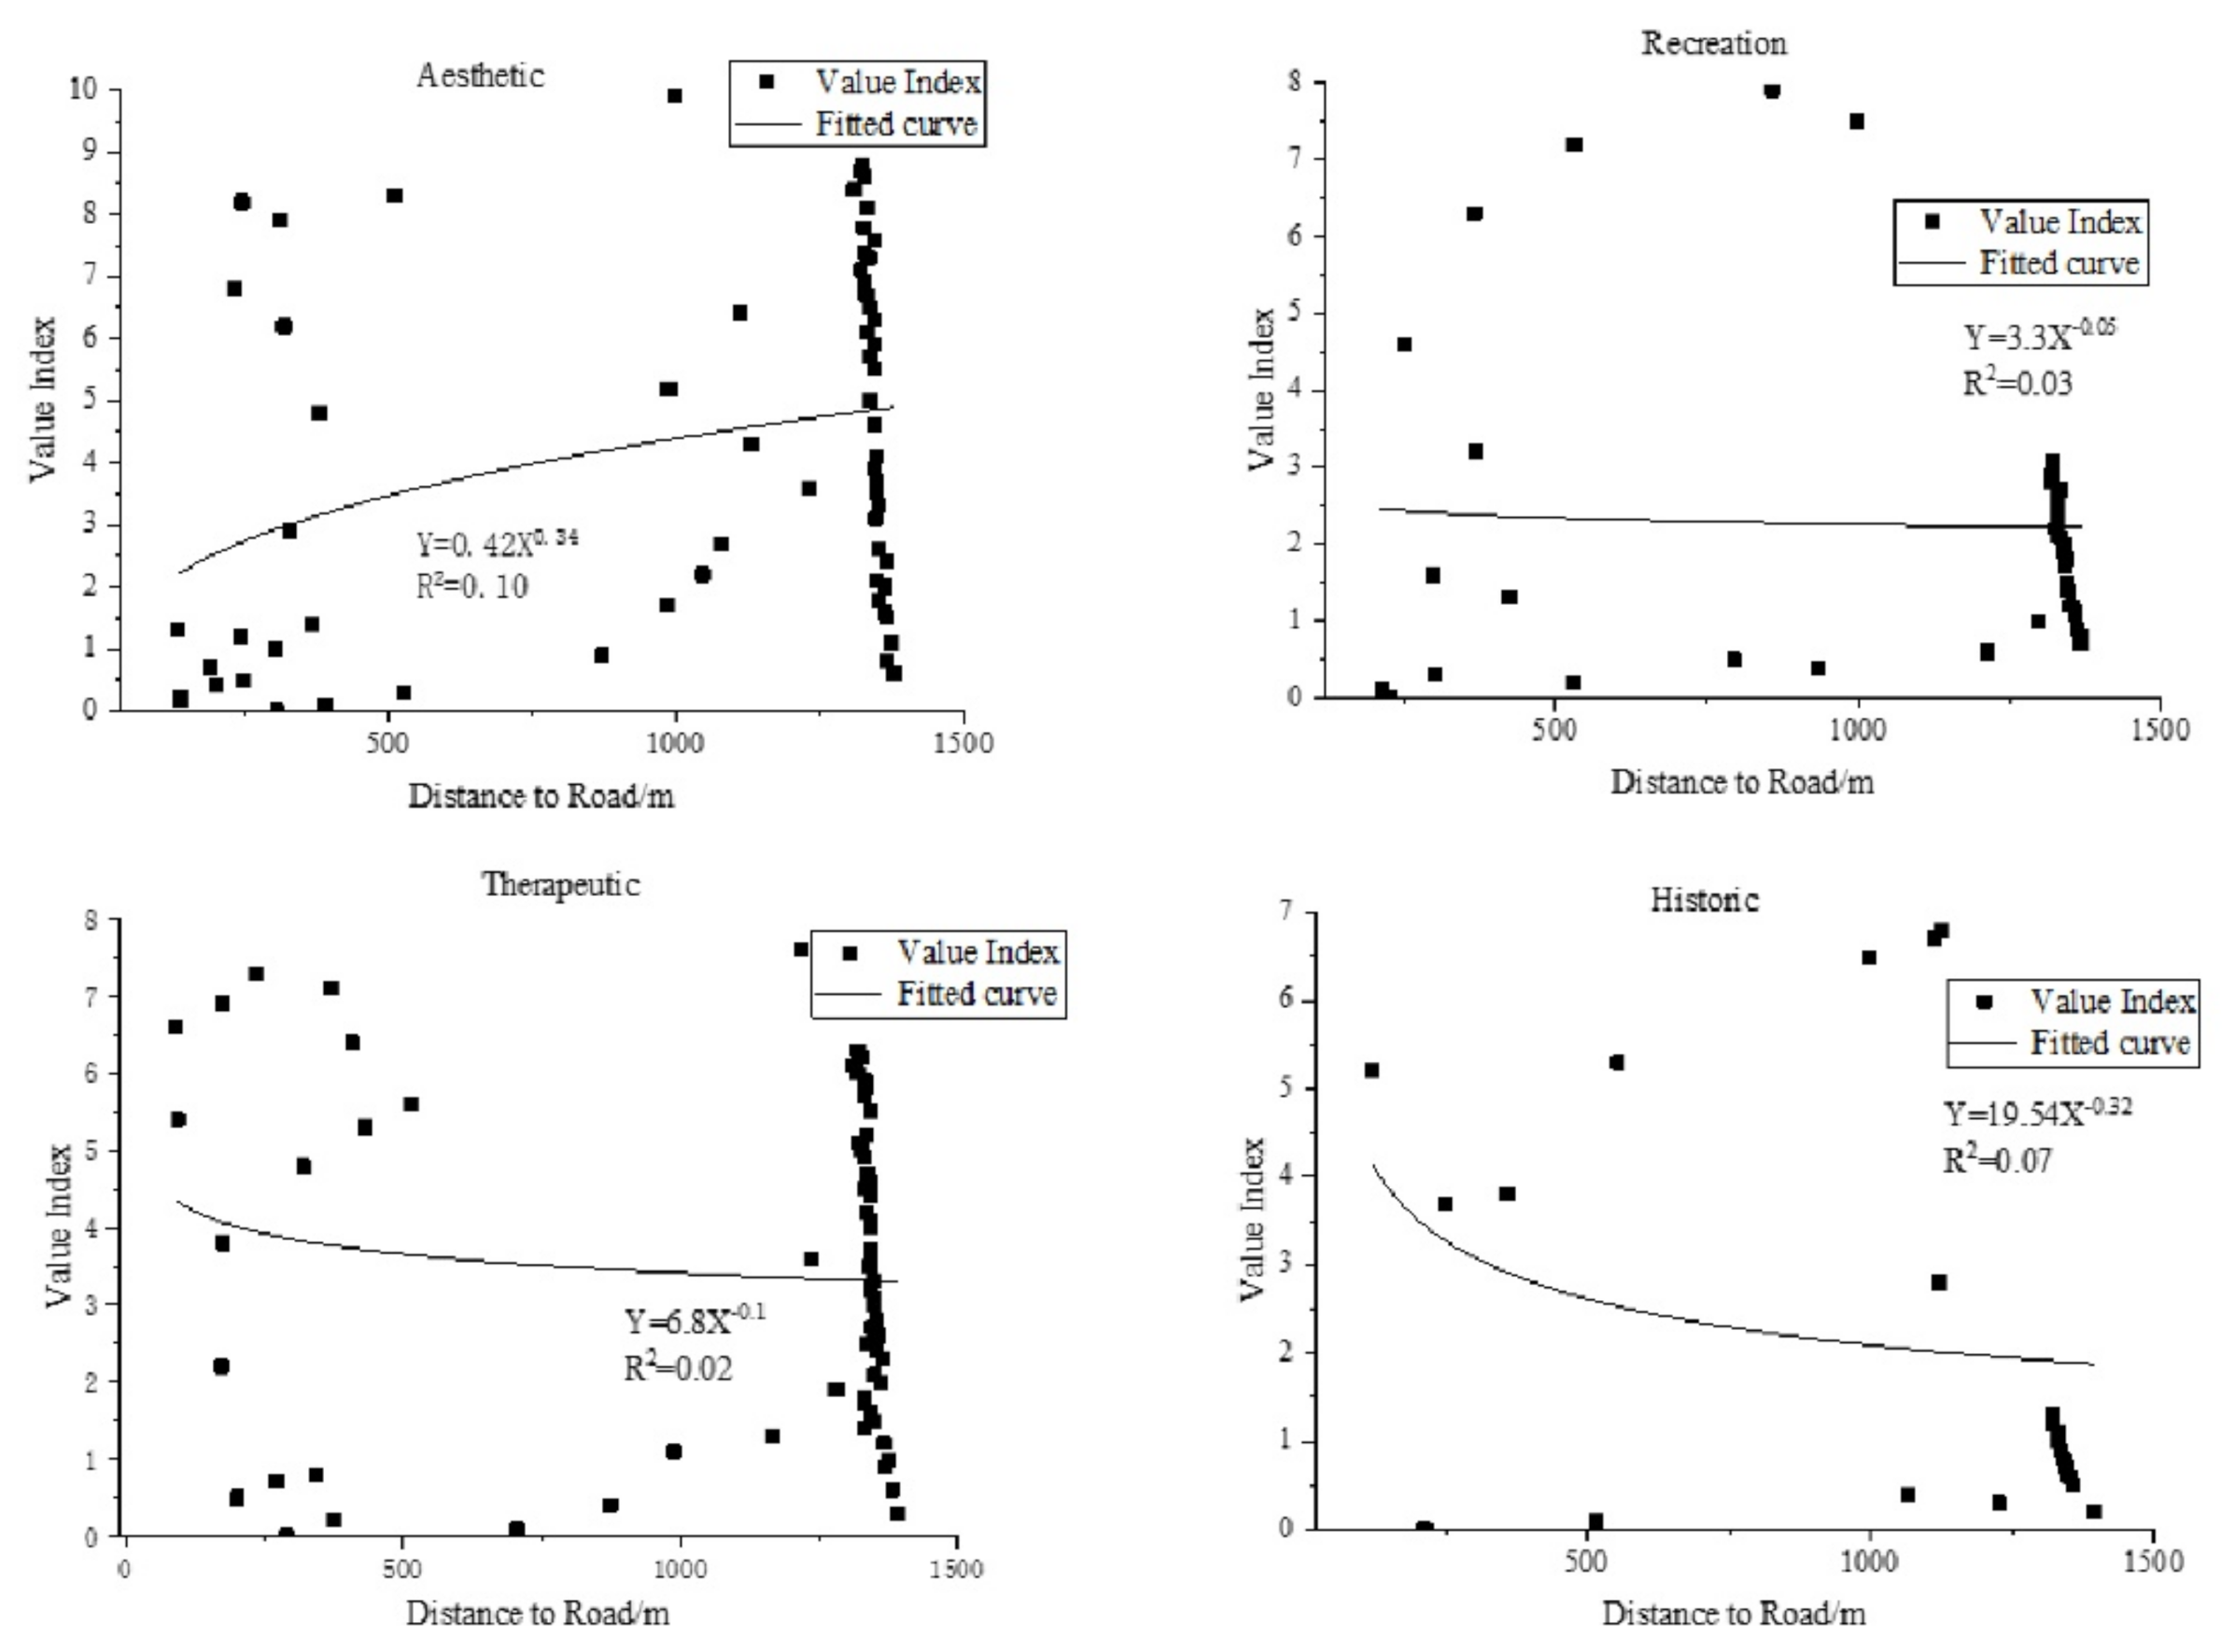
- We imported the nonlinear data between mean VI and distance variables (DTW and DTR) output by SolVES into Origin software to obtain the fitted linear equations and the fitted curves. Then the correlation between the VI of various social values and the distance variables on the east bank of Fenghe River were analyzed by using these curves and equations. At the same time, we calculated the average VI of each landscape with the help of the zonal statistics tool in ArcGIS to analyze which type of landscape has a higher average VI.
- (5)
- We used eight-neighbor to define the weight matrix and performed spatial autocorrelation statistics in GeoDa. Moran’s I, p values, and Z scores are used to analyze the spatial correlation between the distance variables (DTW and DTR) and VI when DTW, DTR, and LT were used together as environmental variables.
- (6)
- We used the environmental variable contribution rate output from MaxEnt to determine the contribution rate of each variable to social value types when DTW, DTR, and LT were used together as environmental variables.
3. Results
3.1. Demographic Analysis of Respondents
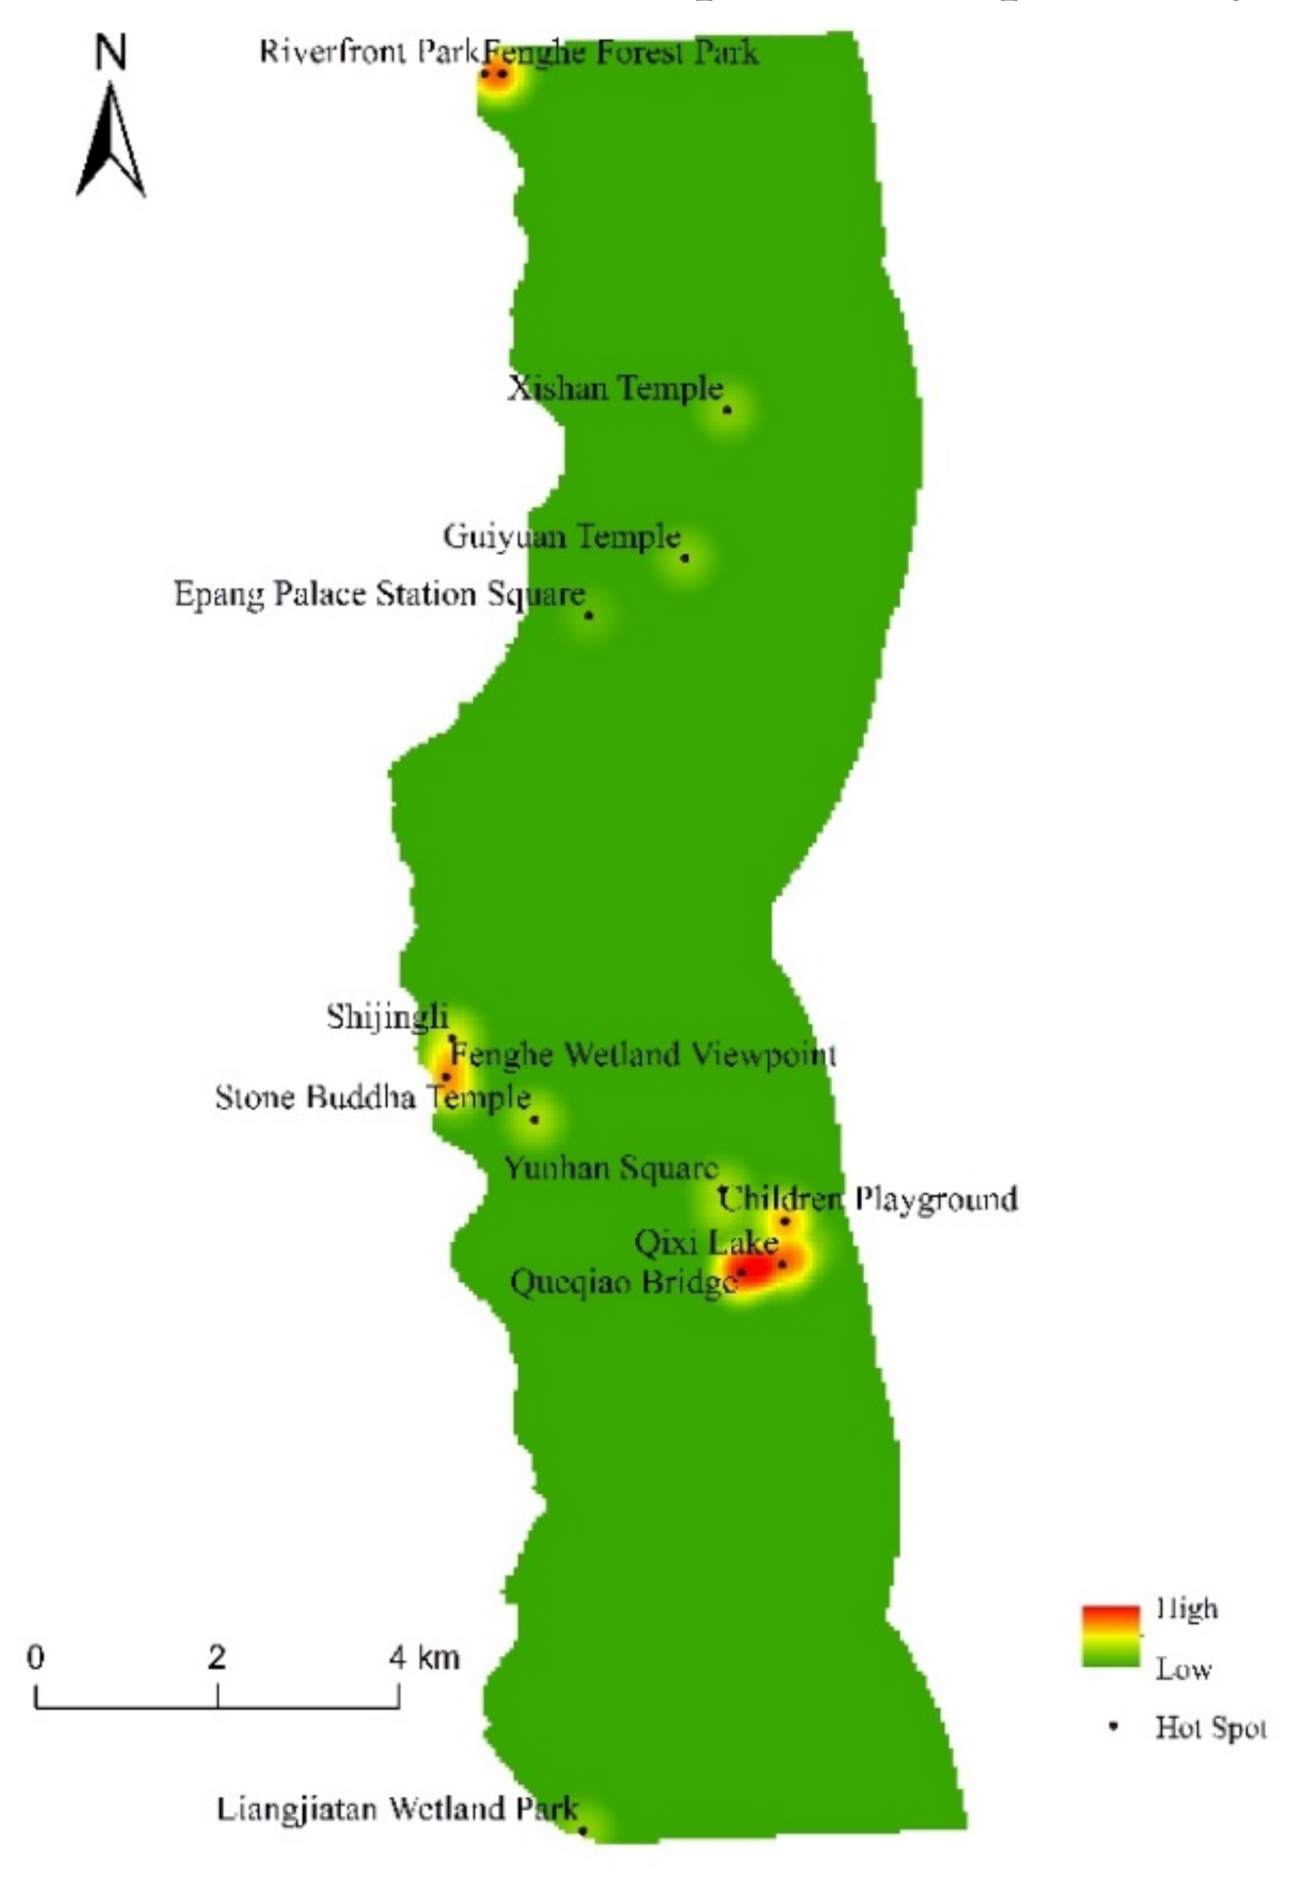
3.2. Spatial Cluster Analysis
3.2.1. Distribution of Social Value Points
3.2.2. Spatial Cluster Analysis of Social Value Based on Different Variables
3.3. Evaluation of the Social Value for ES
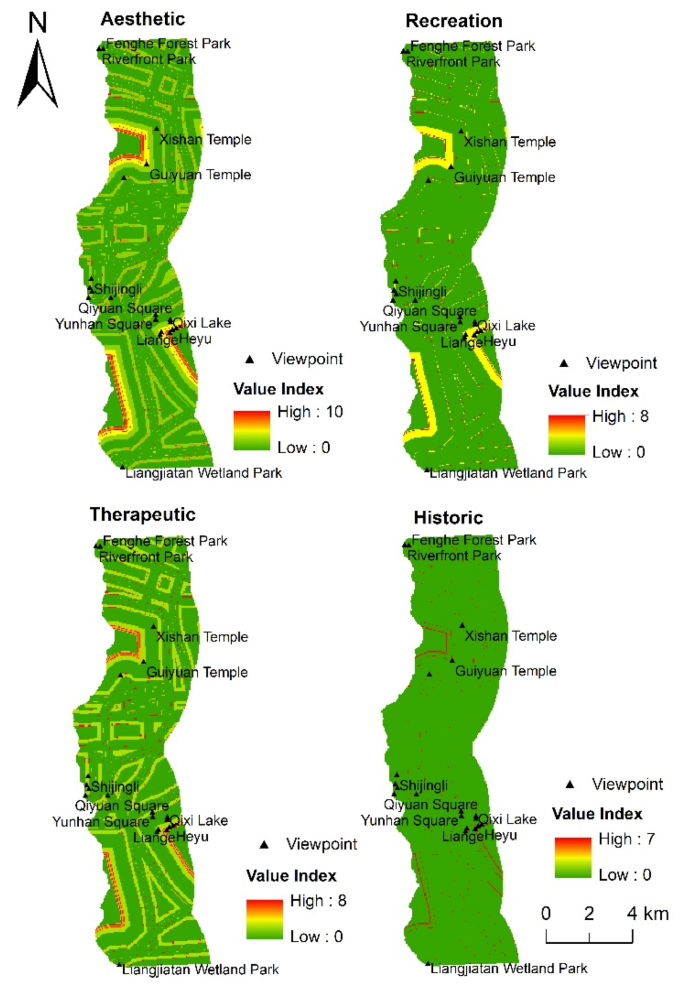
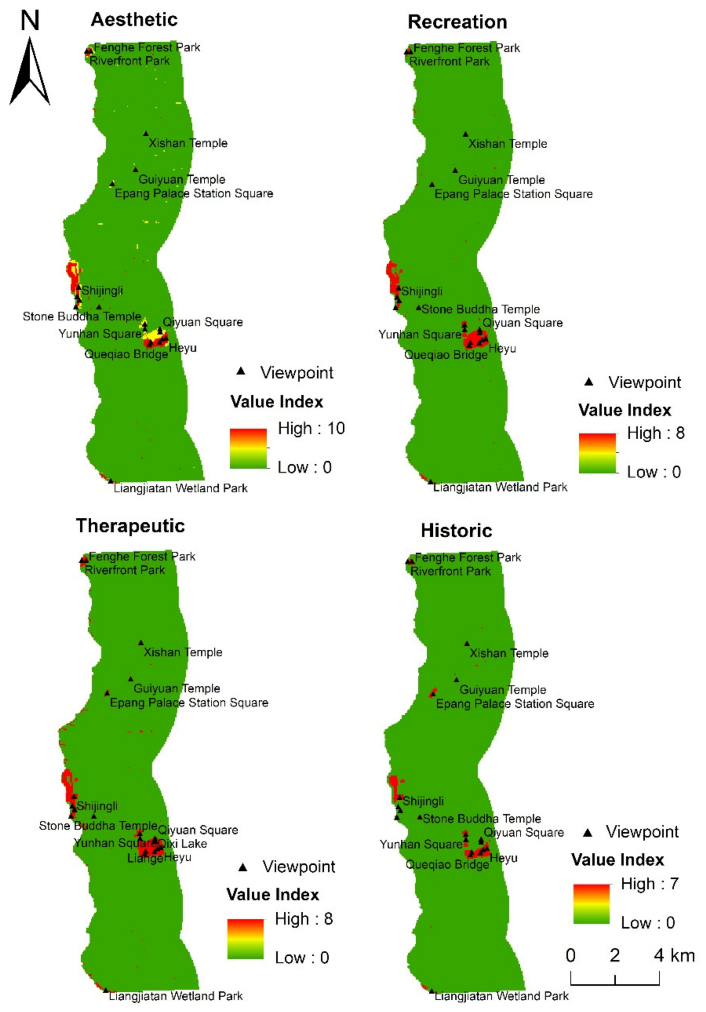
3.3.1. Evaluation of Social Value Based on the DTW Model
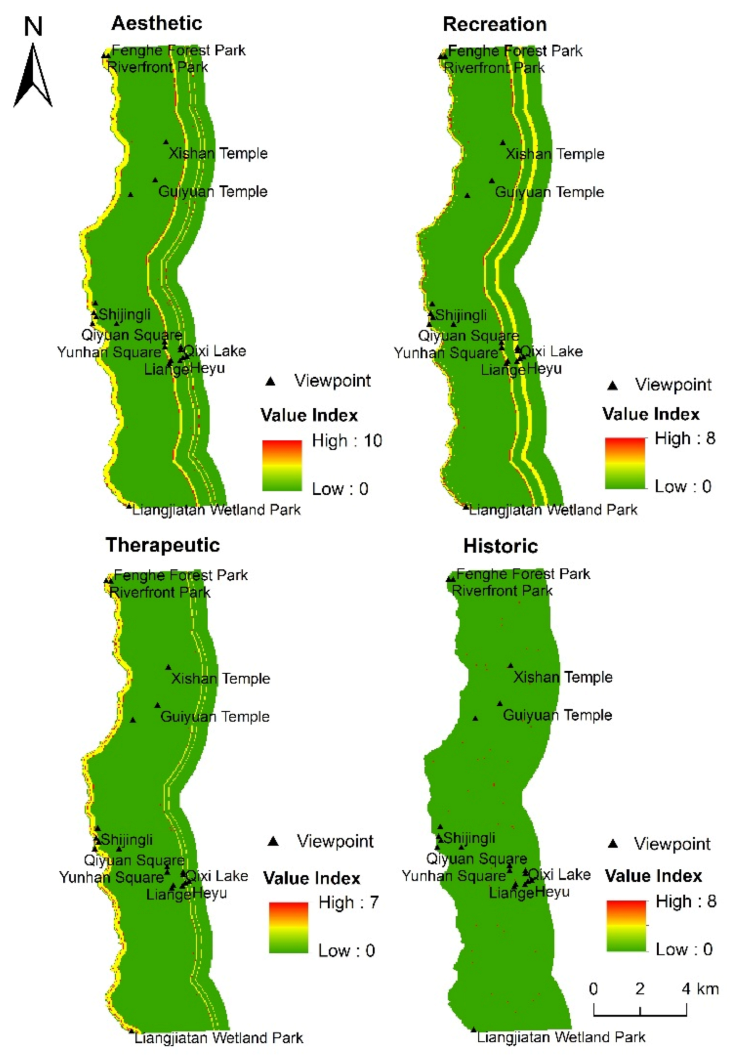
3.3.2. Evaluation of Social Value Based on the DTR Model
3.3.3. Evaluation of Social Value Based on the LT Model
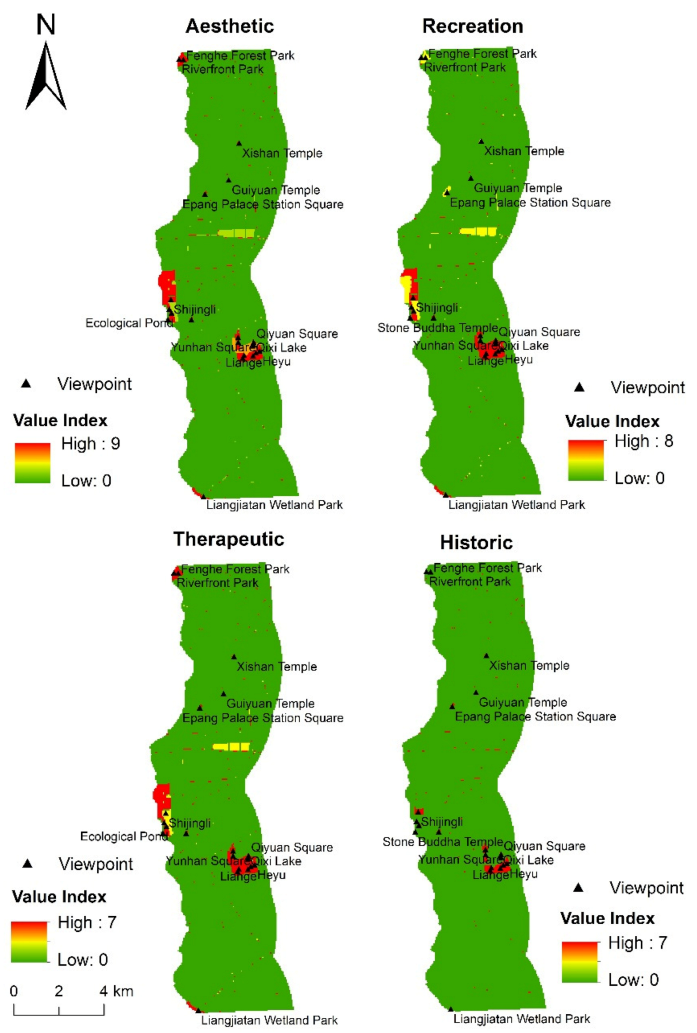
3.3.4. Evaluation of Social Value Based on the DTW-DTR-LT Model
4. Discussion
4.1. Responses of Social Values to Environmental Variables and Preferences of Respondents
4.2. Thoughts on Landscape Construction
5. Conclusions
Author Contributions
Funding
Informed Consent Statement
Data Availability Statement
Conflicts of Interest
Appendix A

| Number | Place Name | Number | Place Name | Number | Place Name | Number | Place Name |
|---|---|---|---|---|---|---|---|
| 1 | Riverfront Park | 6 | Shijingli | 11 | Qixi Lake | 16 | Yunhan Commercial Street |
| 2 | Fenghe Forest Park | 7 | Fenghe Wetland Viewpoint | 12 | Queqiao Bridge | 17 | Kunmingchi Remains |
| 3 | Xishan Temple | 8 | Stone Buddha Temple | 13 | Liangjiatan Wetland Park | 18 | Qiyuan Square |
| 4 | Guiyuan Temple | 9 | Yunhan Square | 14 | Wetland Sightseeing Road | 19 | Heyu |
| 5 | Epang Palace Station Square | 10 | Children Playground | 15 | Ecological Pond | 20 | Liange |
| Social Value types | Place Name or Number |
|---|---|
| Aesthetic | |
| Economic | |
| Historic | |
| Recreation | |
| Spiritual | |
| Therapeutic | |
| Future |

Appendix B
- (1)
- Pearson correlation coefficient
| Variable | Reference Item | Distance to Road | Distance to Water | Landscape Type | Value Index |
|---|---|---|---|---|---|
| Distance to Road | Pearson Correlation | 1 | 0.826 ** | −0.321 ** | −0.132 * |
| Sig. (2-tailed) | 0.000 | 0.000 | 0.018 | ||
| N | 324.000 | 324.000 | 324.000 | 324.000 | |
| Distance to Water | Pearson Correlation | 0.826 ** | 1 | −0.134 * | −0.300 ** |
| Sig. (2-tailed) | 0.000 | 0.015 | 0.000 | ||
| N | 324.000 | 324.000 | 324.000 | 324.000 | |
| Landscape Type | Pearson Correlation | −0.321 ** | −0.134 * | 1 | 0.115 * |
| Sig. (2-tailed) | 0.000 | 0.015 | 0.039 | ||
| N | 324.000 | 324.000 | 324.000 | 324.000 | |
| Value Index | Pearson Correlation | −0.132 * | −0.300 ** | 0.115 * | 1 |
| Sig. (2-tailed) | 0.018 | 0.000 | 0.039 | ||
| N | 324.000 | 324.000 | 324.000 | 324.000 |
- (2)
- Variance inflation factors
| Environmental Variable | Collinearity Statistics | |
|---|---|---|
| Tolerance | Variance Inflation Factor | |
| Distance to Road | 0.273 | 3.663 |
| Distance to Water | 0.299 | 3.345 |
| Landscape Type | 0.843 | 1.186 |
- (3)
- Eigenvalue and condition index
| Dimension | Eigenvalue | Condition Index | Variance Proportions | Distance to Water | Landscape Type | |
|---|---|---|---|---|---|---|
| (Constant) | Distance to Road | |||||
| 1 | 3.522 | 1.000 | 0.010 | 0.000 | 0.010 | 0.010 |
| 2 | 0.366 | 3.103 | 0.010 | 0.030 | 0.060 | 0.220 |
| 3 | 0.082 | 6.545 | 0.370 | 0.060 | 0.320 | 0.380 |
| 4 | 0.030 | 10.892 | 0.610 | 0.910 | 0.610 | 0.390 |
References
- Burkhard, B.; Kroll, F.; Nedkov, S.; Müller, F. Mapping ecosystem service supply, demand and budgets. Ecol. Indic. 2012, 21, 17–29. [Google Scholar] [CrossRef]
- SCEP Study of critical environmental problems. In Man’s Impact on the Global Environment: Assessment and Recommendations for Action; MIT Press: Cambridge, MA, USA, 1970.
- Grasdalen, H.; Eriksson, L.E.G.; Westman, J.; Ehrenberg, A. Surface potential effects on metal ion binding to phosphatidylcholine membranes. 31 P NMR Study Lanthan. Calcium Ion Bind. Egg-Yolk Lecithin Vesicles 1977, 469, 151–162. [Google Scholar]
- Ehrilich, P.R.; Ehrilich, A.H. Extinction: The Causes and Consequences of the Disappearance of Species; Random House: New York, NY, USA, 1981. [Google Scholar]
- Costanza, R.; Arge, R.; De Groot, R.; Farber, S.; Grasso, M.; Hannon, B.; Limburg, K.; Naeem, S.; O’Neill, R.V.; Paruelo, J.; et al. The value of the world ecosystem services and natural capital. Nature 1997, 387, 253–260. [Google Scholar] [CrossRef]
- Daily, G.C. Nature’s Services: Societal Dependence on Natural Ecosystems; Island Press: Washington, DC, USA, 1997; pp. 49–68. [Google Scholar]
- Carpenter, S.R.; Pingali, P.L.; Bennett, E.M. Ecosystems and Human Well-Being; Island Press: Washington, DC, USA, 2005. [Google Scholar]
- Haines-Young, R.H. Exploring ecosystem service issues across diverse knowledge domains using Bayesian Belief Networks. Prog. Phys. Geogr. 2011, 35, 681–699. [Google Scholar] [CrossRef]
- Wallace, K.J. Classification of ecosystem services: Problems and solutions. Biol. Conserv. 2007, 139, 235–246. [Google Scholar] [CrossRef] [Green Version]
- Bennett, E.M.; Peterson, G.D.; Gordon, L.J. Understanding relationships among multiple ecosystem services. Ecol. Lett. 2009, 12, 1394–1404. [Google Scholar] [CrossRef]
- MEA Millennium Ecosystem Assessment. Ecosystems and Human Well-Being: A Framework for Assessment; Island Press: Washington, DC, USA, 2003. [Google Scholar]
- Carpenter, S.R.; Mooney, H.A.; Agard, J.; Capistrano, D.; Defries, R.S.; Diaz, S.; Dietz, T.; Duraiappah, A.K.; Oteng-Yeboah, A.; Pereira, H.M.; et al. Science for managing ESs: Beyond the millennium ecosystem assessment. PNAS 2009, 106, 1305–1312. [Google Scholar] [CrossRef] [Green Version]
- Teller, A. Presentation for the European MAES Working Group. MAES-Related Activities in MS 2014–2015, 8 December 2014; European Commission: Brussels, Belgium, 2016. [Google Scholar]
- Maes, J.; Teller, A.; Erhard, M.; Liquete, C.; Braat, L.; Berry, P.; Egoh, B.; Puydarrieux, P.; Fiorina, C.; Santos, F.; et al. An Analytical Framework for Ecosystem Assessments under Action 5 of the EU Biodiversity Strategy to 2020; Mapping and Assessment of Ecosystems and Their Services, Publications Office of the European Union: Luxembourg, 2013; Available online: http://ec.europa.eu/environment/nature/knowledge/ecosystem_assessment/pdf/MAESWorkingPaper2013.pdf (accessed on 6 November 2020).
- Schröter, M.; Albert, C.; Marques, A.; Tobon, W.; Lavorel, S.; Maes, J.; Brown, C.; Klotz, S.; Bonn, A. National Ecosystem Assessments in Europe: A Review. BioScience 2016, 66, 813–828. [Google Scholar] [CrossRef] [PubMed] [Green Version]
- Liquete, C.; Kleeschulte, S.; Dige, G.; Maes, J.; Grizzetti, B.; Olah, B.; Zulian, G. Mapping green infrastructure based on ecosystem services and ecological networks: A Pan-European case study. Environ. Sci. Policy 2015, 54, 268–280. [Google Scholar] [CrossRef]
- Sherrouse, B.C.; Semmens, D.J. Validating a method for transferring social values of ESs between public lands in the Rocky Mountain region. Ecosyst. Serv. 2014, 8, 166–177. [Google Scholar] [CrossRef]
- Brown, G.; Brabyn, L. The extrapolation of social landscape values to a national level in New Zealand using landscape character classification. Appl. Geogr. 2012, 35, 84–94. [Google Scholar] [CrossRef]
- Sherrouse, B.C.; Semmens, D.J. Social Values for Ecosystem Services, Version 2.0 (SolVES 2.0): Documentation and User Manual. Available online: https://pubs.usgs.gov/of/2012/1023/contents/OF12-1023.pdf (accessed on 6 November 2020).
- Sherrouse, B.C.; Clement, J.M.; Semmens, D.J. A GIS application for assessing, mapping, and quantifying the social values of ecosystem services. Appl. Geogr. 2011, 31, 748–760. [Google Scholar] [CrossRef]
- Riper, C.J.V.; Kyle, G.T.; Sutton, S.G.; Barnes, M.; Sherrouse, B.C. Mapping outdoor recreationists’ perceived social values for ecosystem services at Hinchinbrook Island National Park, Australia. Appl. Geogr. 2012, 35, 164–173. [Google Scholar] [CrossRef]
- Brown, G.; Pullar, D.; Hausner, V. An empirical evaluation of spatial value transfer methods for identifying cultural ESs. Ecol. Indic. 2016, 69, 1–11. [Google Scholar] [CrossRef] [Green Version]
- Brander, L.M.; Wagtendonk, A.J.; Hussain, S.S.; Mcvittie, A.; Verburg, P.H. Ecosystem service values for mangroves in Southeast Asia: A meta-analysis and value transfer application. Ecosyst. Serv. 2012, 1, 62–69. [Google Scholar] [CrossRef] [Green Version]
- Chaikumbung, M.; Doucouliagos, H.; Scarborough, H. The economic value of wetlands in developing countries: A meta-regression analysis. Ecol. Econ. 2016, 124, 164–174. [Google Scholar] [CrossRef]
- Ghermandi, A.; Sheela, A.M.; Justus, J. Integrating similarity analysis and ecosystem service value transfer: Results from a tropical coastal wetland in India. Ecosyst. Serv. 2016, 22, 73–82. [Google Scholar] [CrossRef]
- Zhang, H.; Gao, Y.; Hua, Y.; Zhang, Y.; Liu, K. Assessing and mapping recreationists’ perceived social values for ecosystem services in the Qinling Mountains, China. Ecosyst. Serv. 2019, 39, 101006. [Google Scholar] [CrossRef]
- Wang, Y.; Fu, B.; Lyu, Y.P.; Yang, K.; Che, Y. Assessment of the social values of ecosystem services based on SolVES model: A case study of Wusong Paotaiwan Wetland Forest Park. Chin. J. Appl. Ecol. 2016, 27, 1767–1774. [Google Scholar]
- Zhao, Q.; Li, J.; Liu, J.; Qin, K.; Tian, T. Assessment and analysis of social values of cultural ecosystem services based on the solves model in the Guanzhong-Tianshui Economic Region. Acta Ecol. Sin. 2018, 38, 3673–3681. [Google Scholar]
- Cheng, D.Y.; Li, M.T.; Ding, Y.Y.; Che, Y. Assessment of the urban waterfront based on social values of ecosystem services: A case study of the Huangpu River waterfront. Shanghai Urban Plan. Rev. 2018, 05, 125–130. [Google Scholar]
- Gao, Y.; Liu, K.; Ma, Q.; Li, Y.; Fan, Y.-N.; Li, X.-Q.; Gu, C. Assessment of the social value of ecosystem services based on SolVES model and visitor’s preference: A case study of Taibai Mountain National Forest Park. Chin. J. Ecol. 2017, 36, 3564–3573. [Google Scholar]
- Allan, J.D. LANDSCAPES AND RIVERSCAPES: The Influence of Land Use on Stream Ecosystems. Annu. Rev. Ecol. Evol. Syst. 2004, 35, 257–284. [Google Scholar] [CrossRef] [Green Version]
- Karen, T.; Peter, S. An Investigation of the relationship between public transport performance and destination satisfaction. J. Transp. Geogr. 2007, 15, 136–144. [Google Scholar]
- Zhang, F.P.; Zhao, S.; Zhou, Z.C.; Wei, Y.F. Relationship between changes of land use pattern and water quality in Fenghe River Basin. Bull. Soil Water Conserv. 2014, 34, 308–312. [Google Scholar]
- Ma, Q.; Liu, K.; Gao, Y.; Li, Y.; Fan, Y.N.; Gu, C. Assessment on social values of ecosystem services in Xi’an Chanba National Wetland Park based on SolVES model. Wetl. Sci. 2018, 16, 51–58. [Google Scholar]
- Sherrouse, B.C.; Semmens, D.J. Social Values for Ecosystem Services, version 3.0 (SolVES 3.0): Documentation and User Manual. Available online: https://pubs.usgs.gov/of/2015/1008/pdf/ofr2015-1008.pdf (accessed on 6 November 2020).
- Wetherbee, G.A.; Debey, T.M.; Nilles, M.A.; Lehmann, C.M.B.; Gay, D.A. Social Values for Ecosystem Services, Version 2.0 (SolVES 2.0): Documentation and User Manual; U.S. Geological Survey: Lestown, VA, USA, 2012.
- Phillips, S.J.; Anderson, R.P.; Schapire, R.E. Maximum entropy modeling of species geographic distributions. Ecol. Model. 2013, 190, 231–259. [Google Scholar] [CrossRef] [Green Version]
- Hosmer, D.W.; Lemeshow, S. Applied Logistical Regression, 2nd ed.; John Wiley & Sons: Hoboken, NJ, USA, 2000. [Google Scholar]
- Swets, J.A. Measuring the accuracy of diagnostic systems. Science 1988, 240, 1285–1293. [Google Scholar] [CrossRef] [PubMed] [Green Version]
- Huang, C.H.; Yang, J.; Zhang, W.J. Development of ecosystem services evaluation models: Research progress. Chin. J. Ecol. 2013, 32, 3360–3367. [Google Scholar]
- Sherrouse, B.C.; Semmens, D.J.; Clement, J.M. An application of Social Values for Ecosystem Services (SolVES) to three national forests in Colorado and Wyoming. Ecol. Indic. 2014, 36, 68–79. [Google Scholar] [CrossRef]
- Sun, F.Y.; Xiang, J.Y.; Tao, Y.; Tong, C.; Che, Y. Mapping the social values for ecosystem services in urban green spaces: Integrating a visitor-employed photography method into SolVES. Urban For. Urban Green. 2019, 38, 105–113. [Google Scholar] [CrossRef]
- Plieninger, T.; Dijks, S.; Oteros-Rozas, E.; Bieling, C. Assessing, mapping, and quantifying cultural ecosystem services at community level. Land Use Policy 2013, 33, 118–129. [Google Scholar] [CrossRef] [Green Version]
- Larson, L.R.; Keith, S.J.; Fernandez, M.; Hallo, J.C.; Shafer, C.S.; Jennings, V. Ecosystem services and urban greenways: What’s the public’s perspective? Ecosyst. Serv. 2016, 22, 111–116. [Google Scholar] [CrossRef]
- Ives, C.D.; Oke, C.; Hehir, A.; Gordon, A.; Wang, Y.; Bekessy, S.A. Capturing residents’ values for urban green space: Mapping, analysis and guidance for practice. Landsc. Urban Plan 2017, 161, 32–43. [Google Scholar] [CrossRef] [Green Version]
- Swanwick, C. Society’s attitudes to and preferences for land and landscape. Land Use Policy 2009, 26, S62–S75. [Google Scholar] [CrossRef]
- Kaplan, R.; Kaplan, S. The Experience of Nature: A Psychological Perspective; Cambridge University Library: Cambridge, UK, 1989; pp. 150–174. [Google Scholar]
- Preussner, D.C. The Sustainable Landscaping: Recycling Materials Water Conservation; Schiffer Pub: Pennsylvania, PA, USA, 2010. [Google Scholar]
- Calkins, M. Materials for Sustainable Sites: A Complete Guide to the Evaluation, Selection, and Use of Sustainable Construction Materials; John Wiley Sons: Hoboken, NJ, USA, 2008. [Google Scholar]
- Grübler, A. Changes in Land Use and Land Cover: A Global Perspective; Meyer, W.B., Turner, B.L., Eds.; Cambridge Univ. Press: New York, NY, USA, 1994; p. 537. [Google Scholar]
- Maes, J.; Jacobs, S. Nature-Based Solutions for Europe’s Sustainable Development. Soc. Conserv. Biol. 2017, 10, 121–124. [Google Scholar] [CrossRef] [Green Version]
- Quinn, J.M.; Brown, P.M.; Boyce, W.; Mackay, S.; Taylor, A.; Fenton, T. Riparian zone classification for management of stream water quality and ecosystem health. J. Am. Water Resour. Assoc. 2001, 37, 1509–1515. [Google Scholar] [CrossRef]
- Zhang, X.; Zhang, Q. Improvement of the construction of sociecological environment and enhancement of subjective well-being of urban residents. J. Liaoning Norm. Univ. 2021, 44, 51–57. [Google Scholar]
- Herzog, T.R. A cognitive analysis of preference for waterscapes. J. Environ. Psychol 1985, 5, 225–241. [Google Scholar] [CrossRef]
- Chiesura, A. The role of urban parks for the sustainable city. Landsc. Urban Plan 2004, 68, 129–138. [Google Scholar] [CrossRef]
- Gobster, P.H.; Nassauer, J.I.; Daniel, T.C.; Fry, G. The shared landscape: What does aesthetics have to do with ecology? Landsc. Ecol. 2007, 22, 959–972. [Google Scholar] [CrossRef]
- Maes, J.; Barbosa, A.; Baranzelli, C.; Zulian, G.; de Silva, F.B.; Vandecasteele, I.; Hiederer, R.; Liquete, C.; Paracchini, M.L.; Mubareka, S.; et al. More green infrastructure is required to maintain ecosystem services under current trends in land-use change in Europe. Landsc. Ecol. 2015, 30, 517–534. [Google Scholar] [CrossRef] [PubMed] [Green Version]
- Lu, M. A comparative study of several methods for dealing with multicollinearity. TJYJC 2007, 241, 8–10. [Google Scholar]
- Zhu, Y.; Zheng, Y.; Yin, M. Multicollinearity Test Under Statistical Significance. TJYJC 2020, 547, 34–36. [Google Scholar]
- Zhang, W.T. Advanced Tutorial on SPSS Statistical Analysis, 2nd ed.; Higher Education Press: Beijing, China, 2013; pp. 115–116. [Google Scholar]


| Social Value Type | Description |
|---|---|
| Aesthetic | I enjoy the scenery, sights, sounds, smells, etc. |
| Economic | It creates economic benefits for the region, and/or provides tourism opportunities. |
| Historic | It has places of natural and human historical significance that matter to me, others, or the nation. |
| Recreation | It provides a place for my favorite outdoor recreation activities. |
| Spiritual | It is a sacred, religious, or spiritually special place to me and/or I feel reverence and respect for nature there. |
| Therapeutic | It makes me feel better, physically and/or mentally. |
| Future | It allows future generations to know and experience it as it is now. |
| Data Type | Description | Source | |
|---|---|---|---|
| Study area boundary | Outer boundary of the study area | Using ArcGIS 10.2 to digitally process the 4000-m buffer zone on the east bank of the Fenghe River vector data. | |
| Social value points | Social values assigned to places by respondents | Using ArcGIS 10.2 to digitally process the social value points obtained from the survey. | |
| Environmental variables | Distance to Water | Distance to the east bank of Fenghe River | Obtained from the Fenghe vector data using the ArcGIS Euclidean distance tool |
| Distance to Road | Distance to the main road in the study area | Obtained from the road vector data using the ArcGIS Euclidean distance tool | |
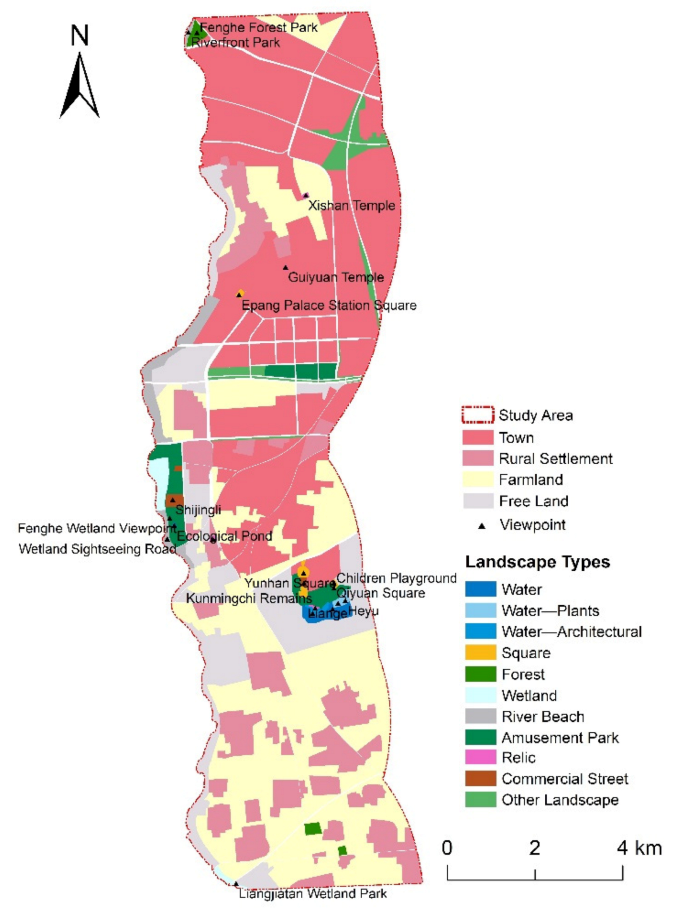
| Landscape Type | 11 types of landscapes in the study area | Using ArcGIS 10.2 to visually interpret satellite images of the study area and convert them into raster data. | |
| Social Value Type | Test AUC1 | Test AUC2 | Test AUC3 | Test AUC4 |
|---|---|---|---|---|
| Aesthetic | 0.981 | 0.985 | 0.973 | 0.993 |
| Economic | 0.983 | 0.961 | 0.949 | 0.985 |
| Historic | 0.976 | 0.986 | 0.974 | 0.998 |
| Recreation | 0.986 | 0.975 | 0.973 | 0.989 |
| Spiritual | 0.979 | 0.986 | 0.970 | 0.995 |
| Therapeutic | 0.981 | 0.989 | 0.974 | 0.993 |
| Future | 0.981 | 0.950 | 0.920 | 0.985 |
| Social Value Type | DTW | DTR | LT | DTW-DTR-LT | ||||
|---|---|---|---|---|---|---|---|---|
| M-VI | R Value | M-VI | R Value | M-VI | R Value | M-VI | R Value | |
| Aesthetic | 10 | 0.0017 | 10 | 0.0017 | 9 | 0.0017 | 10 | 0.0017 |
| Economic | 5 | 0.0017 | 5 | 0.0017 | 5 | 0.0017 | 5 | 0.0017 |
| Historic | 7 | 0.0501 | 7 | 0.0501 | 7 | 0.0501 | 7 | 0.0501 |
| Recreation | 8 | 0.0018 | 8 | 0.0018 | 8 | 0.0018 | 8 | 0.0018 |
| Spiritual | 4 | 0.0026 | 4 | 0.0026 | 3 | 0.0026 | 3 | 0.0026 |
| Therapeutic | 8 | 0.0144 | 8 | 0.0144 | 7 | 0.0144 | 8 | 0.0144 |
| Future | 5 | 0.0019 | 5 | 0.0019 | 5 | 0.0019 | 5 | 0.0019 |
| Landscape Type | Aesthetic | Recreation | Therapeutic | Historic | ||||||||
|---|---|---|---|---|---|---|---|---|---|---|---|---|
| Mean | Min | Max | Mean | Min | Max | Mean | Min | Max | Mean | Min | Max | |
| Water | 6.80 | 0 | 8 | 3.40 | 0 | 4 | 4.32 | 0 | 7 | 0.85 | 0 | 1 |
| Water‒Plants | 6.89 | 0 | 8 | 3.89 | 0 | 4 | 4.92 | 0 | 7 | 0.97 | 0 | 1 |
| Water‒Architectural | 6.32 | 6 | 8 | 4.00 | 4 | 4 | 5.00 | 5 | 5 | 1.00 | 1 | 1 |
| Amusement Park | 2.01 | 0 | 8 | 1.90 | 0 | 8 | 2.26 | 0 | 7 | 0.06 | 0 | 6 |
| Square | 4.76 | 0 | 8 | 3.36 | 0 | 8 | 2.00 | 0 | 5 | 1.09 | 0 | 3 |
| Forest | 2.9 | 0 | 7 | 0.51 | 0 | 4 | 2.41 | 0 | 5 | 0.01 | 0 | 1 |
| Wetland | 3.23 | 1 | 7 | 1.23 | 1 | 4 | 2.70 | 1 | 7 | 0.04 | 0 | 5 |
| Beach | 0.29 | 0 | 6 | 0.00 | 0 | 0 | 0.23 | 0 | 6 | 0.00 | 0 | 0 |
| Relic | 4.92 | 0 | 9 | 1.96 | 0 | 4 | 2.88 | 0 | 5 | 4.54 | 0 | 7 |
| Commercial Street | 4.81 | 0 | 7 | 3.43 | 0 | 5 | 1.28 | 0 | 4 | 1.77 | 0 | 6 |
| Other Landscape | 0.16 | 0 | 9 | 0.09 | 0 | 8 | 0.11 | 0 | 7 | 0.02 | 0 | 7 |
| Environmental Variable | Reference Item | Value Index of Aesthetic | Value Index of Recreation | Value Index of Therapeutic | Value Index of Historic |
|---|---|---|---|---|---|
| Distance to Water | Moran’s I | −0.061 | −0.028 | −0.068 | 0 |
| p value | 0.001 | 0.001 | 0.001 | 0.467 | |
| Z score | −31.4173 | −14.5657 | −35.1869 | −0.1226 | |
| Distance to Road | Moran’s I | 0.068 | 0.084 | 0.071 | 0.091 |
| p value | 0.001 | 0.001 | 0.001 | 0.001 | |
| Z score | 35.3432 | 43.8966 | 36.7976 | 46.6648 |
| Social Value Type | Contribution of Distance to Water | Contribution of Distance to Road | Contribution of Landscape Type |
|---|---|---|---|
| Aesthetic | 30.5% | 21.9% | 47.6% |
| Recreation | 43.1% | 17.8% | 39.1% |
| Therapeutic | 29.3% | 20.2% | 50.5% |
| Historic | 9.9% | 10.1% | 80.0% |
Publisher’s Note: MDPI stays neutral with regard to jurisdictional claims in published maps and institutional affiliations. |
© 2021 by the authors. Licensee MDPI, Basel, Switzerland. This article is an open access article distributed under the terms and conditions of the Creative Commons Attribution (CC BY) license (http://creativecommons.org/licenses/by/4.0/).
Share and Cite
Zhang, Z.; Zhang, H.; Feng, J.; Wang, Y.; Liu, K. Evaluation of Social Values for Ecosystem Services in Urban Riverfront Space Based on the SolVES Model: A Case Study of the Fenghe River, Xi’an, China. Int. J. Environ. Res. Public Health 2021, 18, 2765. https://0-doi-org.brum.beds.ac.uk/10.3390/ijerph18052765
Zhang Z, Zhang H, Feng J, Wang Y, Liu K. Evaluation of Social Values for Ecosystem Services in Urban Riverfront Space Based on the SolVES Model: A Case Study of the Fenghe River, Xi’an, China. International Journal of Environmental Research and Public Health. 2021; 18(5):2765. https://0-doi-org.brum.beds.ac.uk/10.3390/ijerph18052765
Chicago/Turabian StyleZhang, Zhicheng, Hongjuan Zhang, Juan Feng, Yirong Wang, and Kang Liu. 2021. "Evaluation of Social Values for Ecosystem Services in Urban Riverfront Space Based on the SolVES Model: A Case Study of the Fenghe River, Xi’an, China" International Journal of Environmental Research and Public Health 18, no. 5: 2765. https://0-doi-org.brum.beds.ac.uk/10.3390/ijerph18052765