
Time–Motion Analysis by Playing Positions of Male Handball Players during the European Championship 2020


Abstract
:1. Introduction
2. Materials and Methods
2.1. Subjects
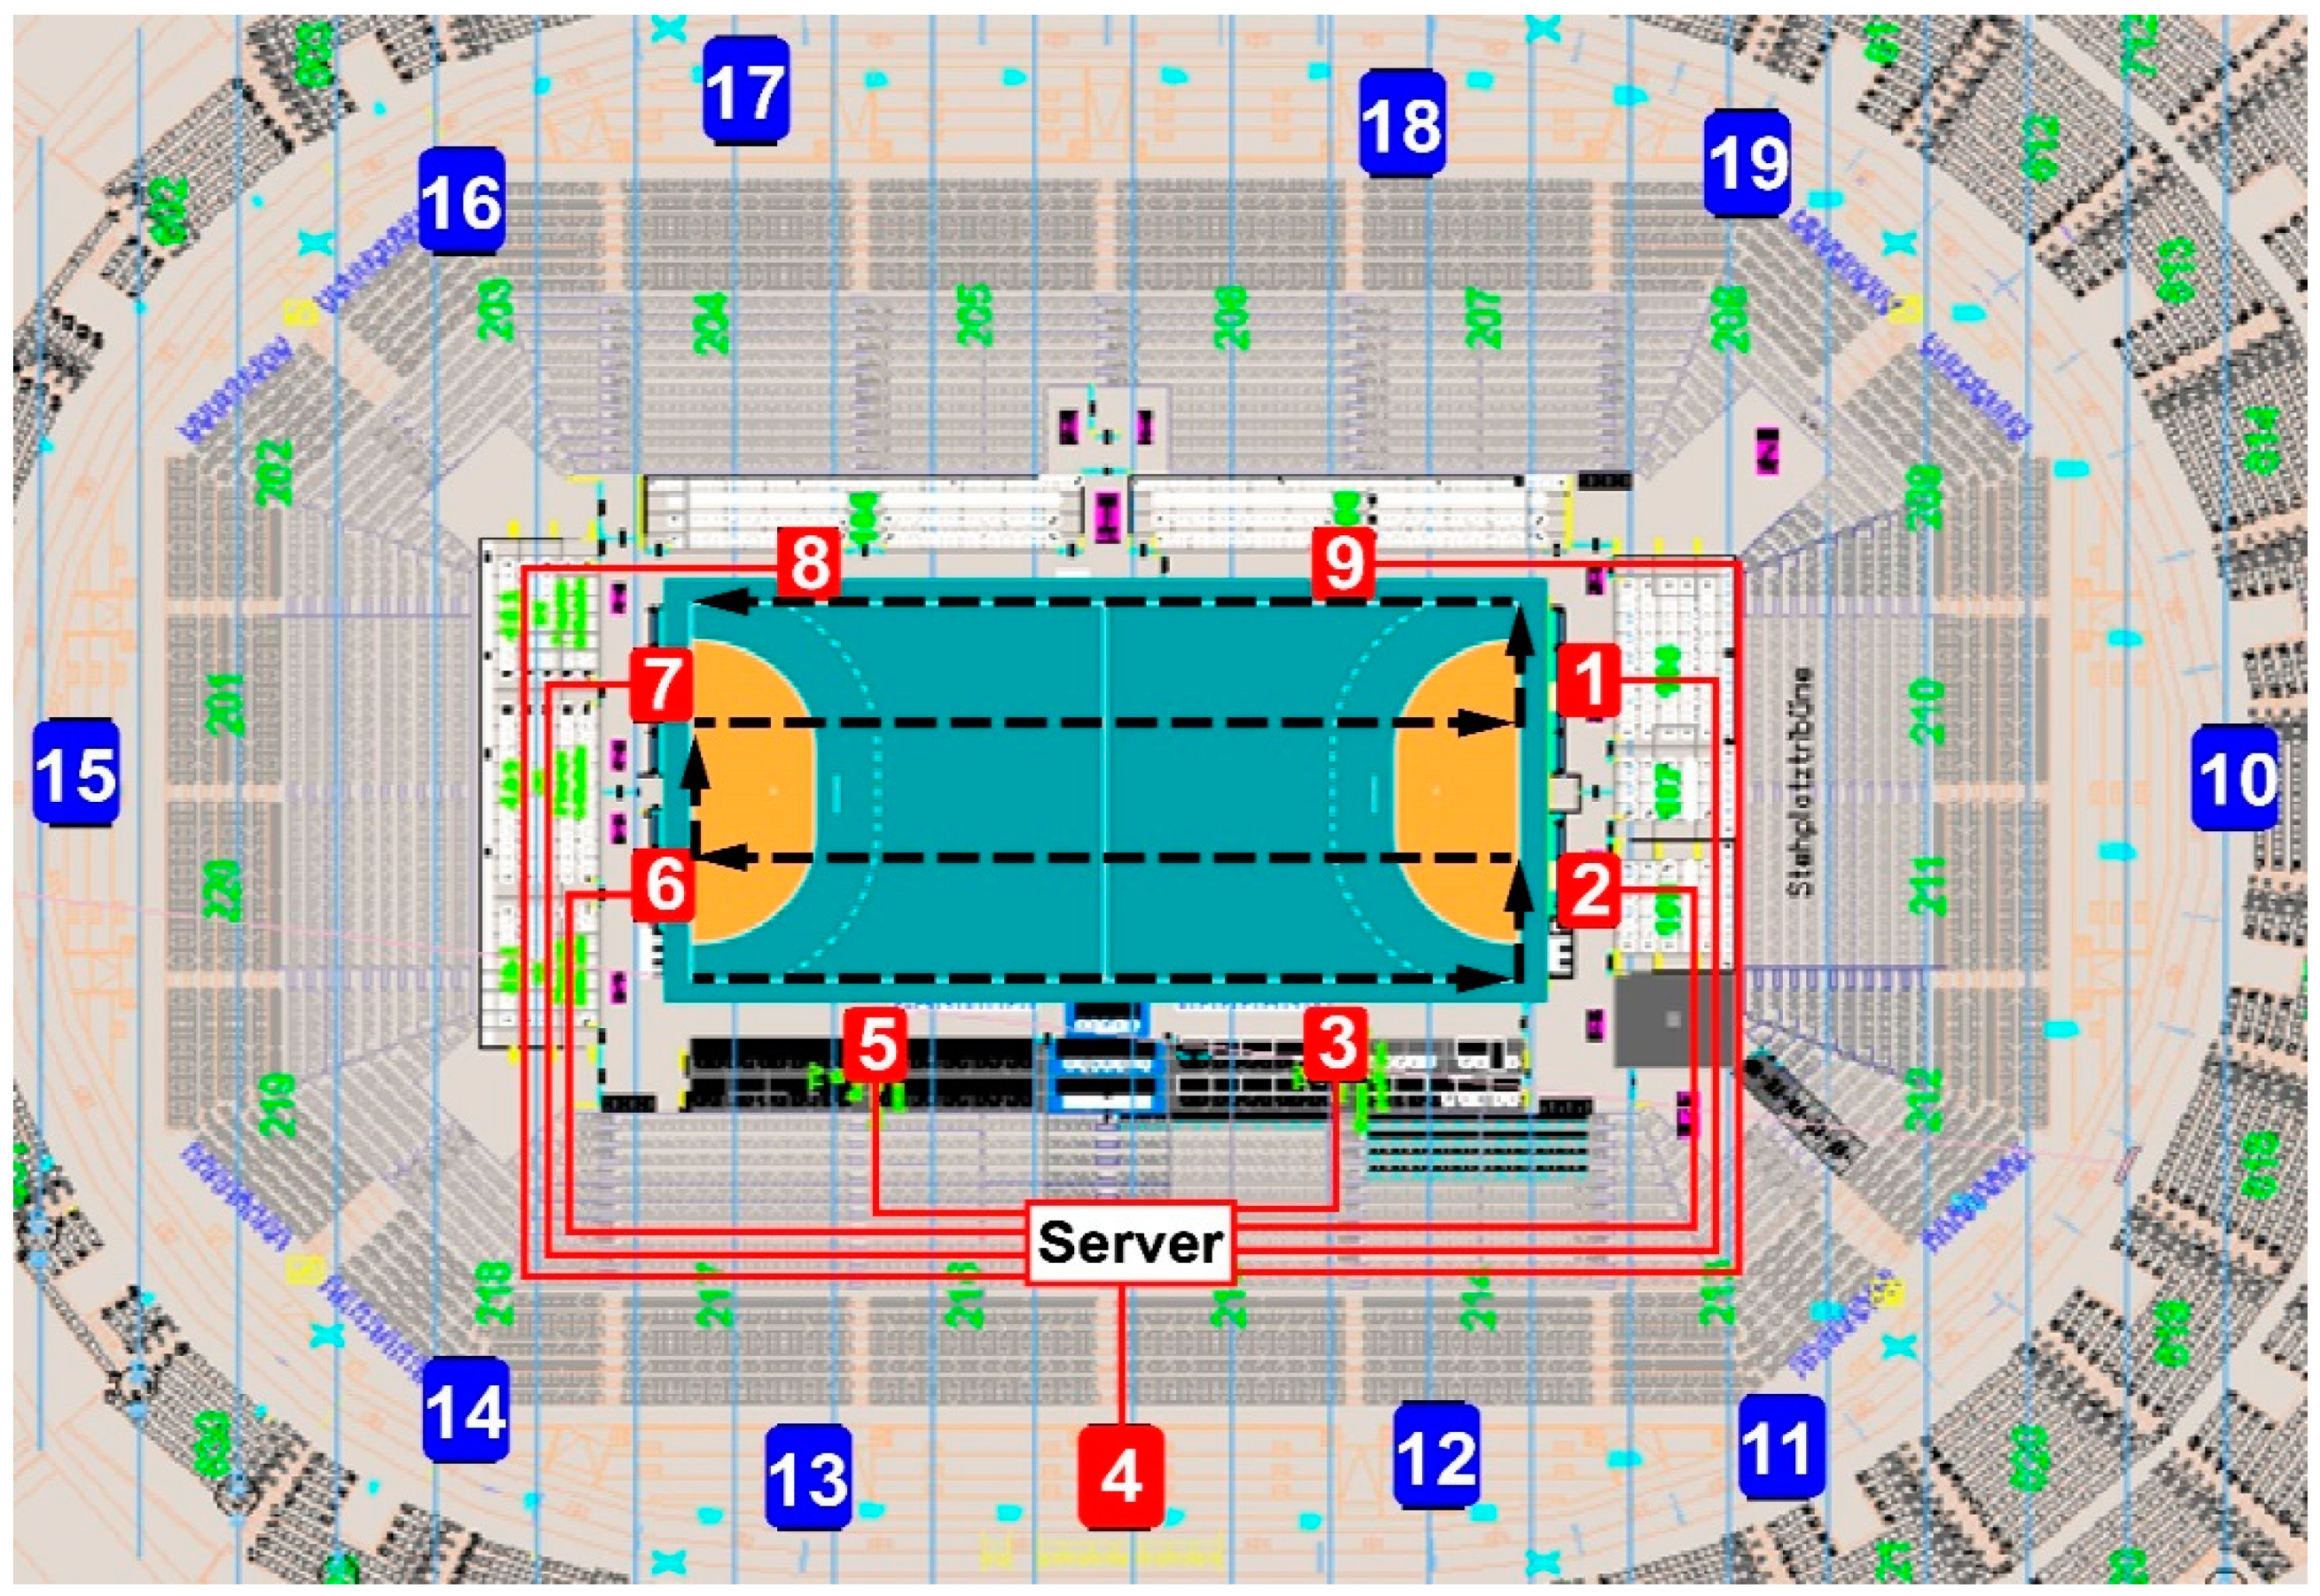
2.2. Instruments
2.3. Procedure
2.4. Statistical Analysis
3. Results
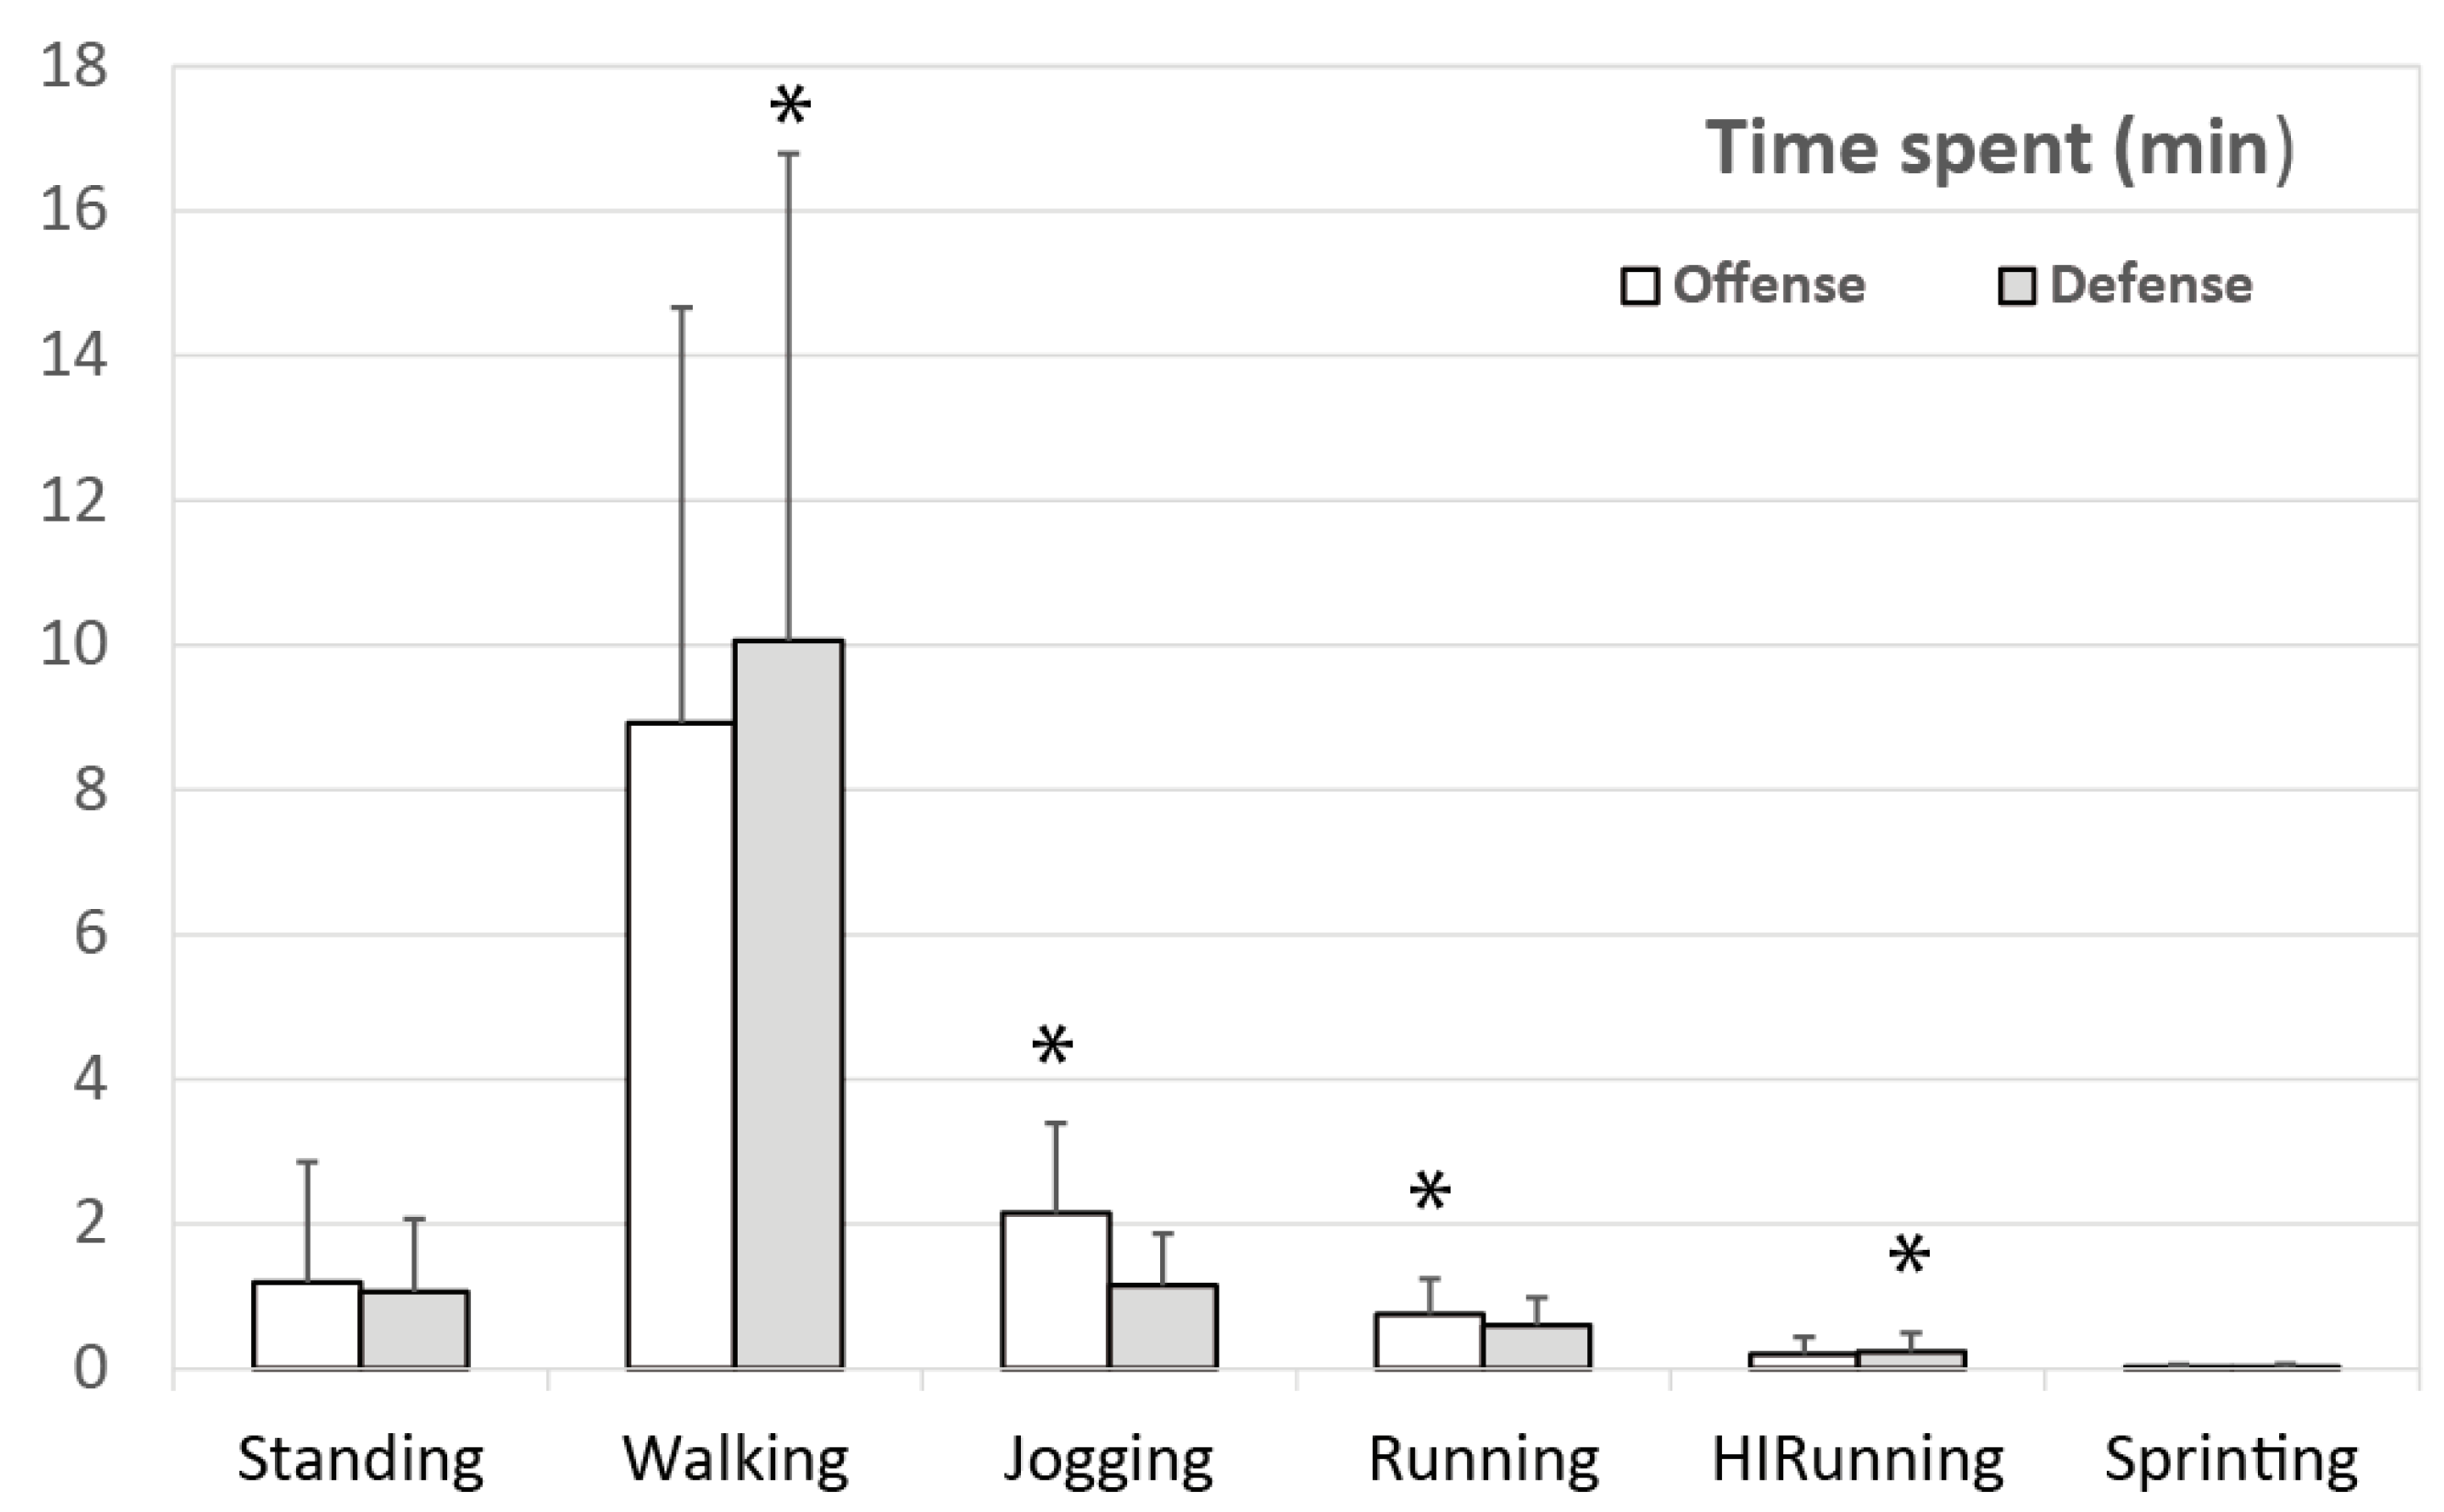
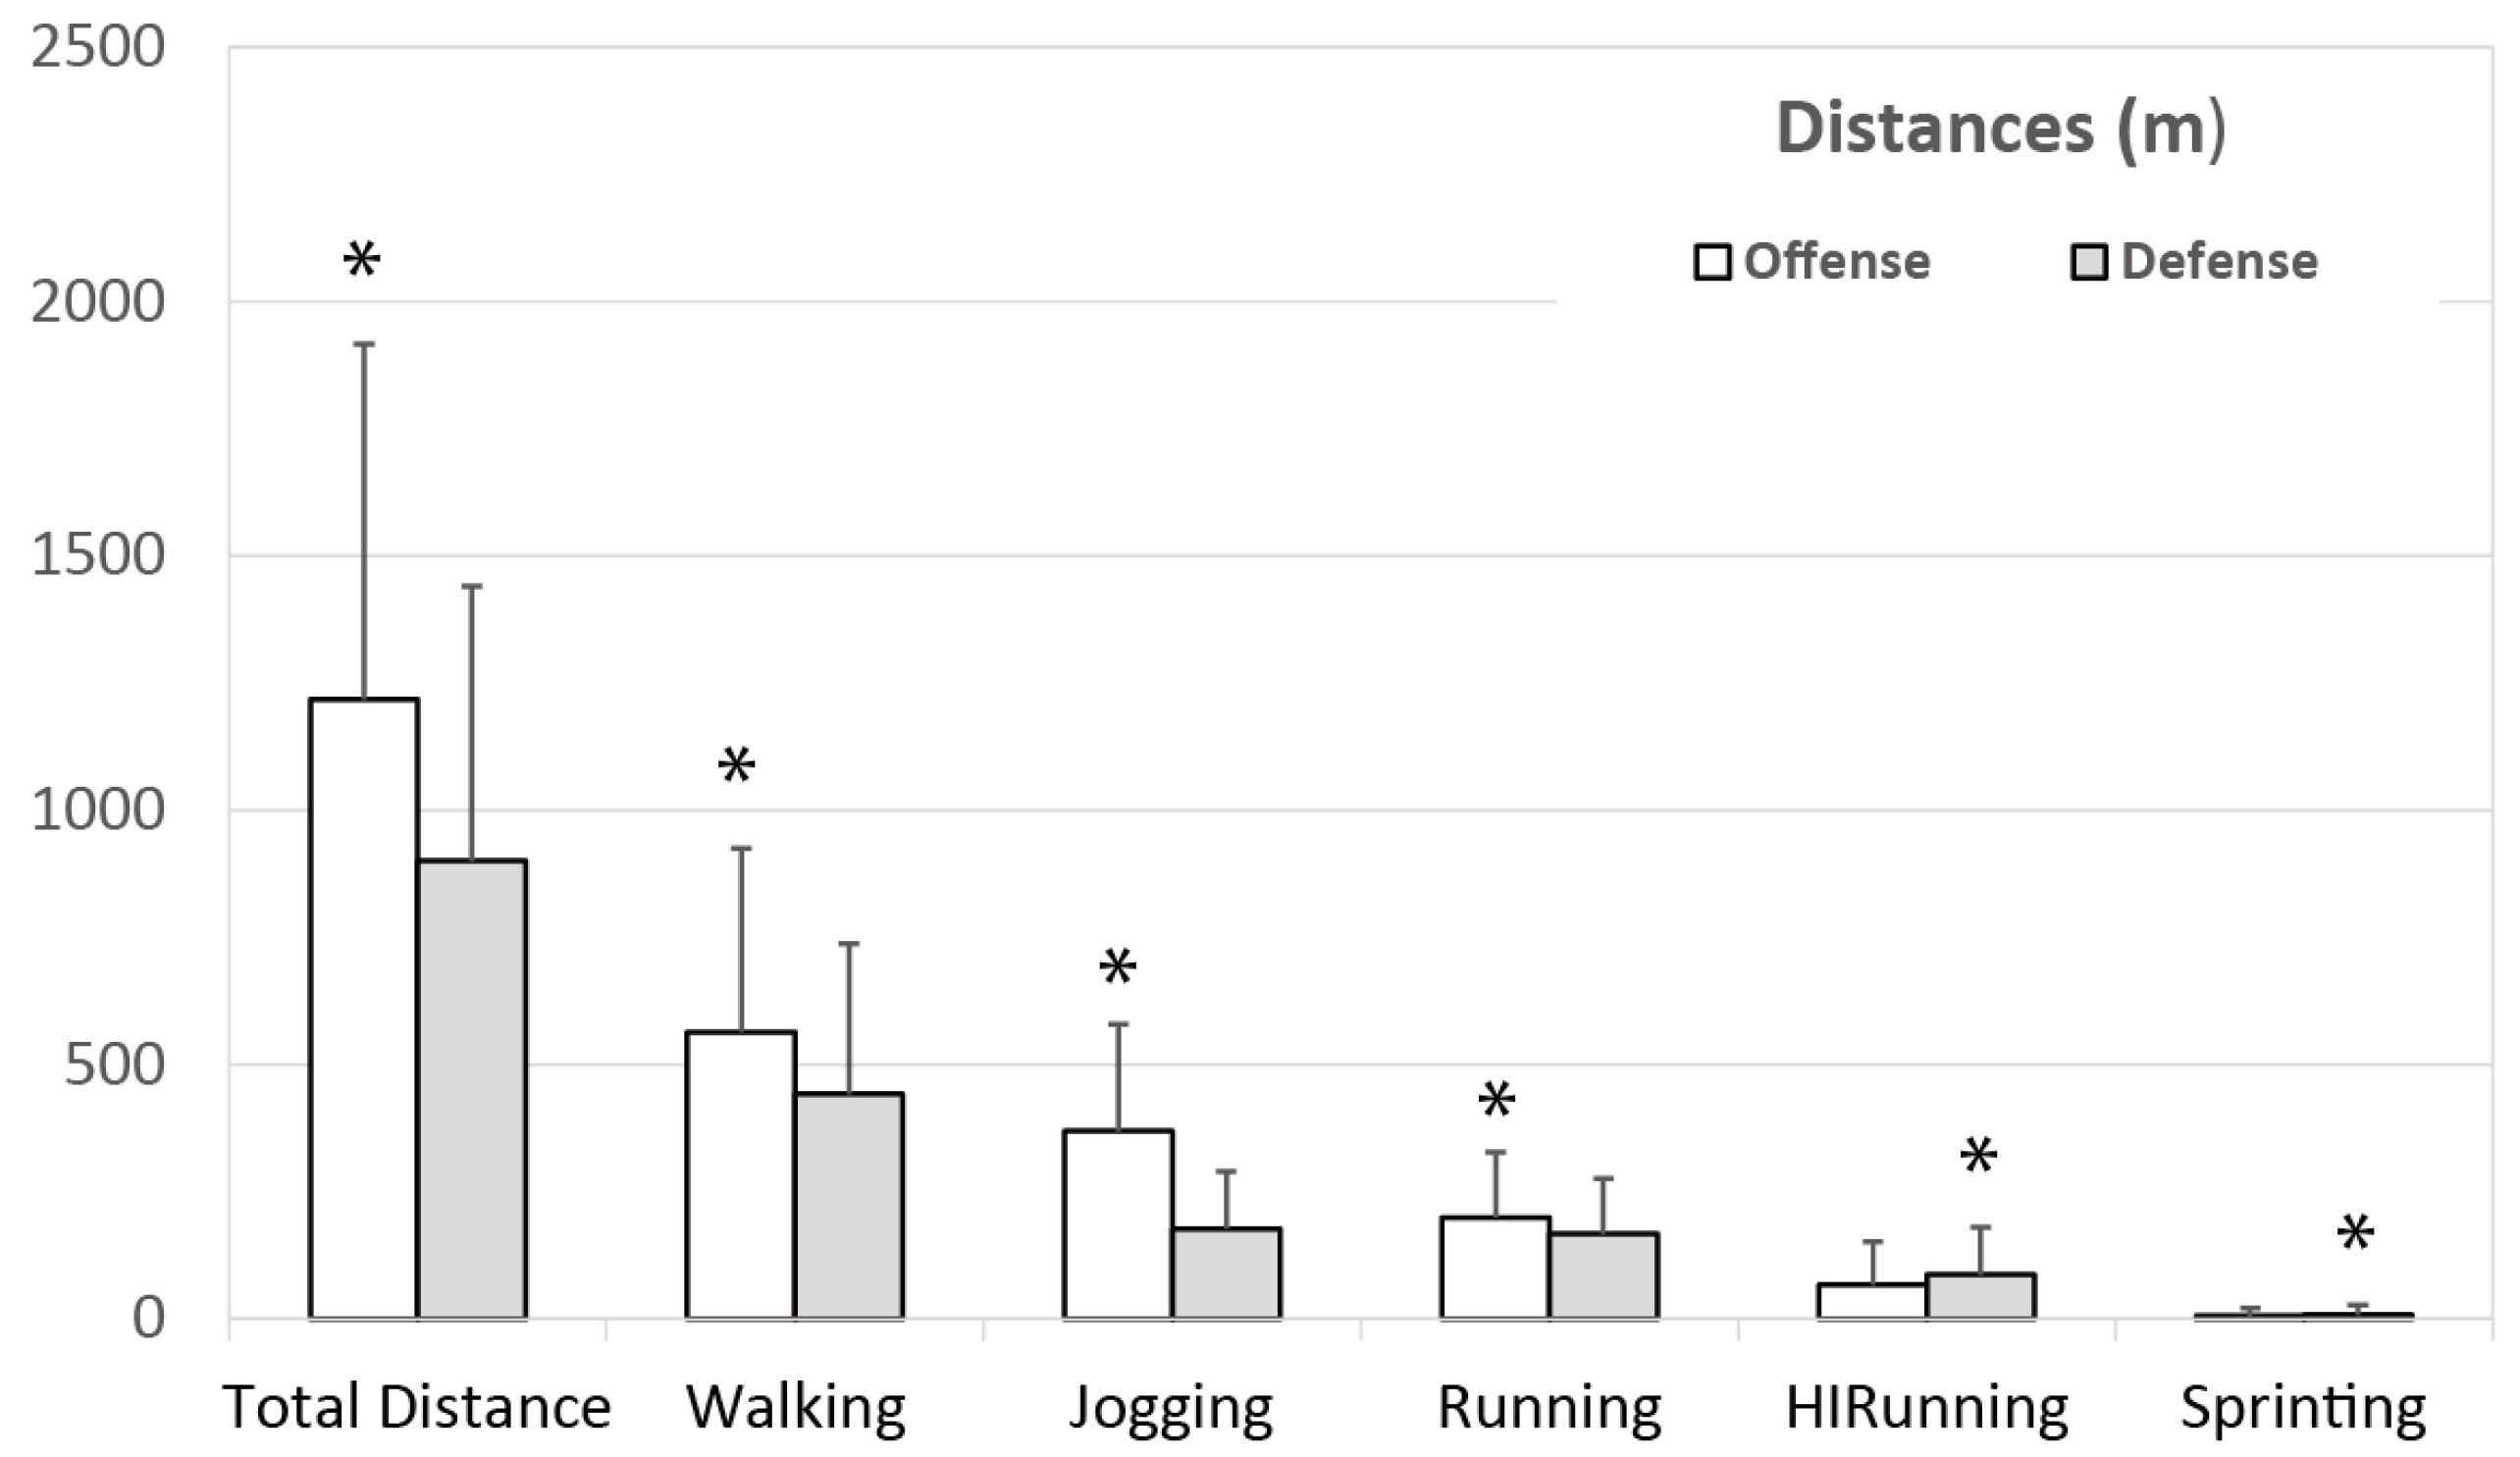
3.1. Time on Court, Distance Covered, and Running Pace in Offense and Defense
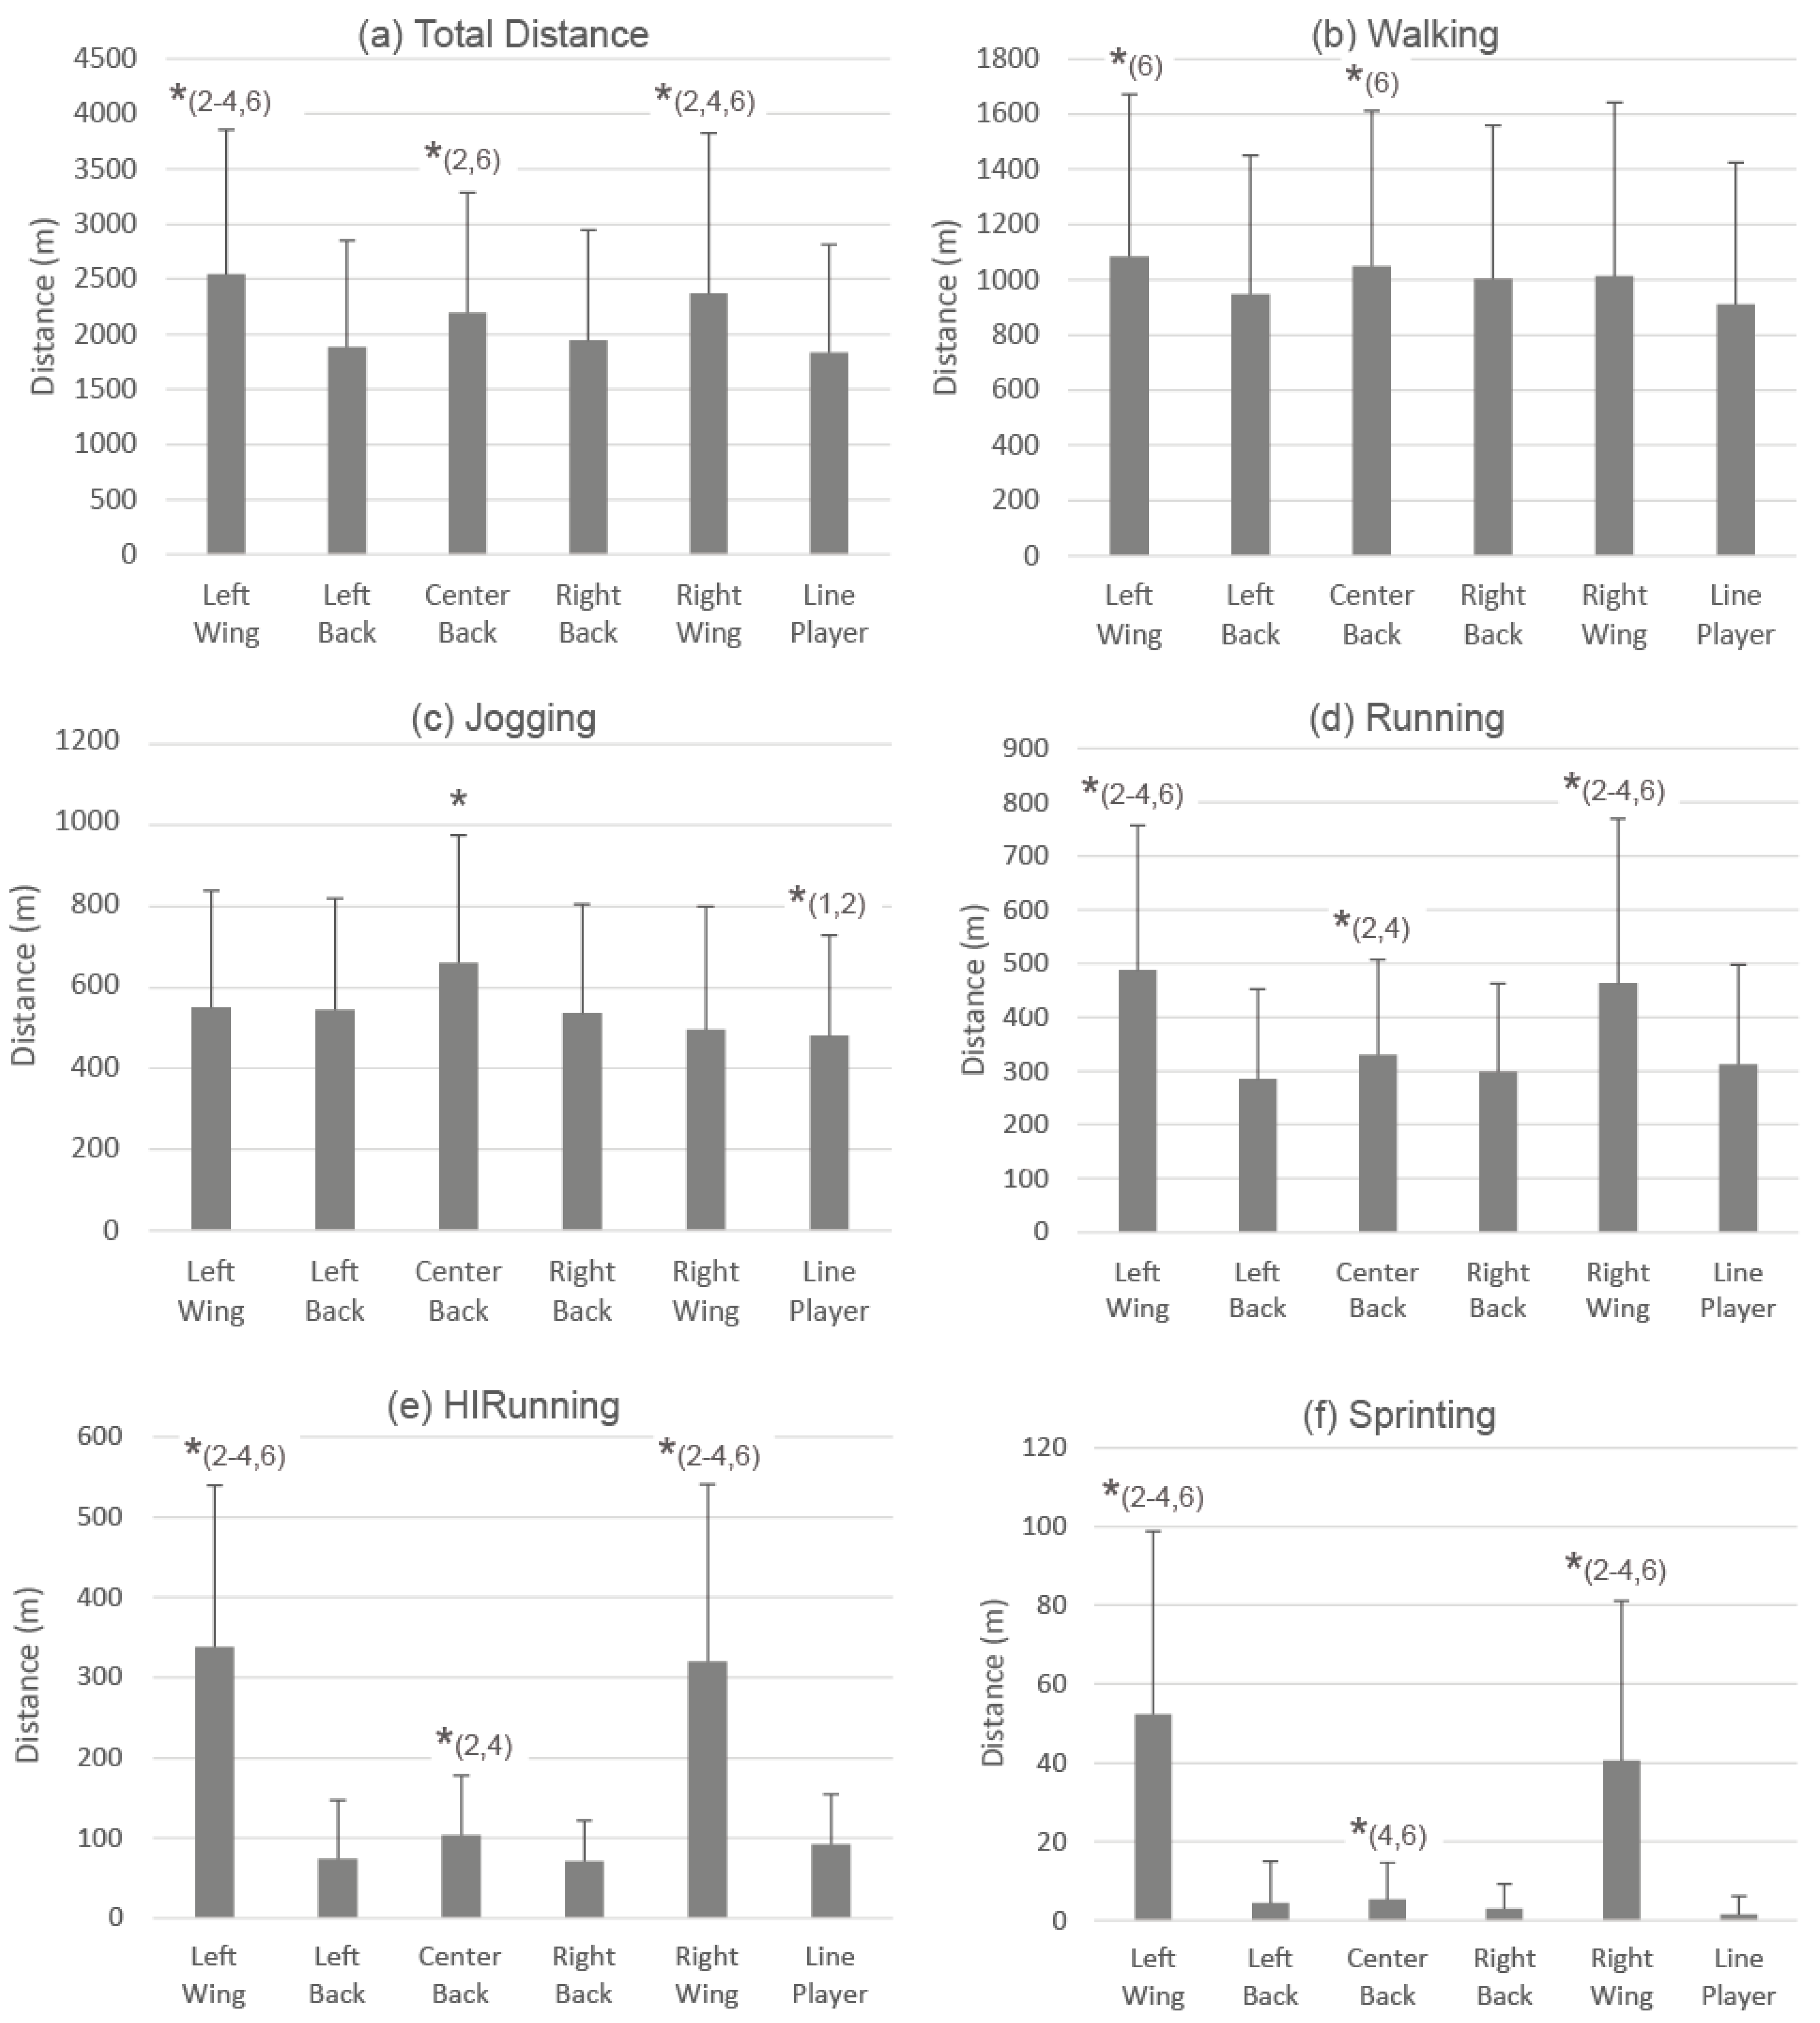
3.2. Time on Court, Distance Covered and Running Pace by Playing Positions
3.3. Differences by Winners and Losers and between Top and Lower Ranked Teams
4. Discussion
4.1. Time on Court, Distance Covered, and Running Pace in Offense and Defense
4.2. Time on Court, Distance Covered, and Running Pace by Playing Positions
4.3. Differences by Winners and Losers and between Top and Lower Ranked Teams
5. Conclusions
6. Practical Applications
Author Contributions
Funding
Institutional Review Board Statement
Informed Consent Statement
Data Availability Statement
Conflicts of Interest
References
- Marczinka, Z. Playing Handball. A Comprehensive Study of the Game; Kék Európa Stúdió Publishing House: Budapest, Hungary, 2016. [Google Scholar]
- International Handball Federation. The Rules of the Game; International Handball Federation: Basle, Switzerland, 2016. [Google Scholar]
- Marczinka, Z.; Gál, A. The chain reaction between the media and sport. the impact of rule changes in Handball. Phys. Cult. Sport Stud. Res. 2018, 80, 39–47. [Google Scholar] [CrossRef] [Green Version]
- Manchado, C.; Hoffmann, E.; Valdivielso, F.N.; Platen, P. Physiological demands in female handball—Demands and heart rate during matches of the German National Team. Dtsch. Z. Sportmed. 2007, 58, 368–373. [Google Scholar]
- Manchado, C.; Tortosa-Martinez, J.; Vila, H.; Ferragut, C.; Platen, P. Performance factors in women’s team handball: Physical and Physiological aspects—A review. J. Strength Cond. Res. 2013, 27, 1708–1719. [Google Scholar] [CrossRef] [Green Version]
- Di Salvo, V.; Baron, R.; Tschan, H.; Calderon Montero, F.J.; Bachl, N.; Pigozzi, F. Performance characteristics according to playing position in elite soccer. Int. J. Sports Med. 2007, 28, 222–227. [Google Scholar] [CrossRef] [PubMed]
- Michalsik, L.B.; Aagaard, P.; Madsen, K. Locomotion characteristics and match-induced impairments in physical performance in male elite team handball players. Int. J. Sports Med. 2013, 34, 590–599. [Google Scholar] [CrossRef] [PubMed]
- Póvoas, S.; Seabra, A.; Ascensao, A.; Magalhraes, J.; Soares, J.; Rebelo, A. Physical and Physiological demands of elite team handball. J. Strength Cond. Res. 2012, 26, 3366–3376. [Google Scholar] [CrossRef]
- Luig, P.; Manchado, C.; Schander, I.; Zimmermann, M.; Henke, T.; Platen, P. Motion characteristics according to playing position in international men’s team handball. In Proceedings of the 13th Annual Congress of the European College of Sports Science, Estoril, Portugal, 9–12 July 2008; Cabri, F.J., Alves, D., Araújo, J., Barreiros, J.D., Eds.; Editorial do Ministério da Educaçao: Estoril, Portugal, 2008; p. 255. [Google Scholar]
- Hoppe, M.W.; Baumgart, C.; Polglaze, T.; Freiwald, J. Validity and reliability of GPS and LPS for measuring distances covered and sprint mechanical properties in team sports. PLoS ONE 2018, 13, 0192708. [Google Scholar] [CrossRef] [Green Version]
- Fleureau, A.; Lacome, M.; Buchheit, M.; Couturier, A.; Rabita, G. Validity of an ultra-wideband local positioning system to assess specific movements in handball. Biol. Sport 2020, 37, 351–357. [Google Scholar] [CrossRef]
- Alt, P.S.; Baumgart, C.; Ueberschär, O.; Freiwald, J.; Hoppe, M.W. Validity of a local positioning system during outdoor and indoor conditions for team sports. Sensors 2020, 20, 5733. [Google Scholar] [CrossRef]
- Manchado, C.; Martínez, J.T.; Pueo, B.; Tormo, J.M.C.; Vila, H.; Ferragut, C.; Sánchez, F.S.; Busquier, S.; Amat, S.; Ríos, L.J.C. High-performance handball player’s time-motion analysis by playing positions. Int. J. Environ. Res. Public Health 2020, 17, 6768. [Google Scholar] [CrossRef]
- Link, D.; Weber, M.; Linke, D.; Lames, M. Can positioning systems replace timing gates for measuring sprint time in Ice Hockey? Front. Physiol. 2019, 10, 1882. [Google Scholar] [CrossRef] [Green Version]
- Pori, P.; Kovacic, S.; Bon, M.; Dolenec, M.; Sibila, M. Various age category-related differences in the volume and intensity of the large-scale cyclic movements of male players in team handball. Acta Univ. Palacki. Olomuc. Gymn. 2005, 35, 119–126. [Google Scholar]
- Póvoas, S.C.A.; Ascensaõ, A.A.M.R.; Magalhães, J.; Seabra, A.F.; Krustrup, P.; Soares, J.M.C.; Rebelo, A.N.C. Physiological demands of elite team handball with special reference to playing position. J. Strength Cond. Res. 2014, 28, 430–442. [Google Scholar] [CrossRef]
- Bělka, J.; Hůlka, K.; Šafář, M.; Weisser, R. External and internal load of playing positions of elite female handball players (U19) during competitive matches. Acta Gymn. 2016, 46, 12–20. [Google Scholar] [CrossRef] [Green Version]
- Pueo, B.; Jimenez-Olmedo, J.M.; Penichet-Tomas, A.; Ortega Becerra, M.; Espina Agullo, J.J. Analysis of time-motion and heart rate in elite male and female beach handball. J. Sport. Sci. Med. 2017, 16, 450. [Google Scholar]
- Higham, D.G.; Pyne, D.B.; Anson, J.M.; Eddy, A. Movement patterns in rugby sevens: Effects of tournament level, fatigue and substitute players. J. Sci. Med. Sport 2012, 15, 277–282. [Google Scholar] [CrossRef] [PubMed]
- Akenhead, R.; Hayes, P.; Thompson, K.; French, D. Diminutions of acceleration and deceleration output during professional football match play. J. Sci. Med. Sport 2013, 16, 556–561. [Google Scholar] [CrossRef] [PubMed]
- Cardinale, M.; Whiteley, R.; Ahmed, H.A.; Popovic, N. Activity profiles and positional differences of handball players during the World Championships in Qatar 2015. Int. J. Sports Physiol. Perform. 2017, 12, 908–915. [Google Scholar] [CrossRef]
- Hopkins, W.G. A Scale of Magnitudes for Effect Statistics. A New View of Statistics. Available online: www.sportsci.org/resource/stats/effectmag.html (accessed on 8 September 2020).
- Büchel, D.; Jakobsmeyer, R.; Döring, M.; Adams, M.; Rückert, U.; Baumeister, J. Effect of playing position and time on-court on activity profiles in german elite team handball. Int. J. Perform. Anal. Sport 2019, 19, 832–844. [Google Scholar] [CrossRef]
- Gómez-Carmona, C.D.; Bastida-Castillo, A.; Ibáñez, S.J.; Pino-Ortega, J. Accelerometry as a method for external workload monitoring in invasion team sports. A systematic review. PLoS ONE 2020, 15, 0236643. [Google Scholar] [CrossRef] [PubMed]
- Iacono, A.D.; Eliakim, A.; Meckel, Y. Improving fitness of elite handball players: Small sided games vs. high-intensity intermittent training. J. Strength Cond. Res. 2015, 29, 835–843. [Google Scholar] [CrossRef]
- Fernandez-Fernandez, J.; Martinez-Martin, I.; Garcia-Tormo, V.; Garcia-Lopez, J.; Centeno-Esteban, M.; Pereira, L.A.; Loturco, I. Age differences in selected measures of physical fitness in young handball players. PLoS ONE 2020, 12, 0242385. [Google Scholar] [CrossRef] [PubMed]
- Maric, D.; Gilic, B.; Foretic, N. Monitoring the Internal and External Loads of Young Team Handball Players during Competition. Sport Mont 2021, 19, 3–7. [Google Scholar] [CrossRef]
- Vujkov, S.; Đukic, M.; Drid, P. Aerobic capacity of handball players with hearing impairment. Biomed. Hum. Kinet. 2010, 2, 13–17. [Google Scholar] [CrossRef] [Green Version]
- González-Haro, P.J.; Gómez-Carmona, C.D.; Bastida-Castillo, A.; Rojas-Valverde, D.; Gómez-López, M.; Pino-Ortega, J. Analysis of playing position and match status-related differences in external load demands on amateur handball: A case study. Rev. Bras. Cineantropometria Desempenho Hum. 2020, 22, 1–13. [Google Scholar] [CrossRef]
- Taylor, J.B.; Wright, A.A.; Dischiavi, S.L.; Townsend, M.A.; Marmon, A.R. Activity Demands During Multi-Directional Team Sports: A Systematic Review. Sports Med. 2017, 47, 2533–2551. [Google Scholar] [CrossRef]
- Whitehead, S.; Till, K.; Weaving, D.; Jones, B. The Use of Microtechnology to Quantify the Peak Match Demands of the Football Codes: A Systematic Review. Sports Med. 2018, 48, 2549–2575. [Google Scholar] [CrossRef] [Green Version]
- Barbero, J.C.; Granda-Vera, J.; Calleja-González, J.; Del Coso, J. Physical and physiological demands of elite team handball players. Int. J. Perform. Anal. Sport 2014, 14, 921–933. [Google Scholar] [CrossRef]
- Ortega-Becerra, M.; Belloso-Vergara, A.; Pareja-Blanco, F. Physical and Physiological Demands During Handball Matches in Male Adolescent Players. J. Hum. Kinet. 2020, 72, 254–263. [Google Scholar] [CrossRef] [Green Version]


| Playing Position | n | Height (cm) | Body Mass (kg) | BMI (kg/m2) | Age (Years) |
|---|---|---|---|---|---|
| Left Wing | 48 | 186.9 ± 5.7 | 84.4 ± 7.9 | 24.2 | 28.3 ± 4.6 |
| Left Back | 73 | 196.1 ± 4.2 | 97.2 ± 6.5 | 25.3 | 26.8 ± 4.7 |
| Center Back | 55 | 189.7 ± 5.8 | 90.3 ± 6.9 | 25.1 | 27.5 ± 5.0 |
| Right Back | 52 | 194.4 ± 5.8 | 95.7 ± 8.9 | 25.3 | 27.9 ± 4.8 |
| Right Wing | 50 | 184.6 ± 5.4 | 83.1 ± 6.3 | 24.4 | 28.0 ± 4.4 |
| Line Player | 79 | 196.8 ± 4.6 | 105.3 ± 8.5 | 27.2 | 28.5 ± 4.7 |
| Total | 414 | 192.4 ± 6.7 | 94.3 ± 10.5 | 25.5 | 28.1 ± 4.8 |
| Left Wing | Left Back | Center Back | Right Back | Right Wing | Line Player | |
|---|---|---|---|---|---|---|
| n | 213 | 320 | 248 | 246 | 230 | 374 |
| Total Time | 32.08 ± 17.01 | 23.77 ± 12.58 | 24.91 ± 13.64 | 24.46 ± 13.30 | 29.98 ± 18.43 | 24.53 ± 13.81 |
| Standing | 4.57 ± 3.18 | 1.37 ± 1.36 | 1.02 ± 0.98 | 1.27 ± 0.98 | 4.22 ± 3.08 | 1.77 ± 1.31 |
| Walking | 21.23 ± 11.30 | 17.44 ± 9.43 | 17.85 ± 10.25 | 18.26 ± 10.29 | 19.98 ± 12.33 | 18.05 ± 10.40 |
| Jogging | 3.22 ± 1.71 | 3.36 ± 1.69 | 4.04 ± 1.91 | 3.29 ± 1.65 | 2.88 ± 1.76 | 2.96 ± 1.52 |
| Running | 1.81 ± 0.99 | 1.11 ± 0.64 | 1.29 ± 0.68 | 1.16 ± 0.64 | 1.72 ± 1.13 | 1.19 ± 0.70 |
| HIRunning | 0.97 ± 0.58 | 0.22 ± 0.22 | 0.32 ± 0.22 | 0.21 ± 0.15 | 0.93 ± 0.64 | 0.28 ± 0.19 |
| Sprinting | 0.13 ± 0.11 | 0.01 ± 0.02 | 0.01 ± 0.02 | 0.01 ± 0.02 | 0.10 ± 0.10 | 0.00 ± 0.01 |
| Left Wing | Left Back | Center Back | Right Back | Right Wing | Line Player | |
|---|---|---|---|---|---|---|
| n | 213 | 320 | 248 | 246 | 230 | 374 |
| Total Distance | 2547.14 ± 1309.52 | 1887.90 ± 962.22 | 2194.39 ± 1093.97 | 1943.25 ± 1003.03 | 2371.89 ± 1456.80 | 1835.23 ± 979.15 |
| Walking | 1083.56 ± 586.68 | 945.81 ± 505.53 | 1049.13 ± 561.89 | 1002.57 ± 557.20 | 1013.69 ± 629.55 | 912.11 ± 512.94 |
| Jogging | 550.19 ± 290.46 | 545.04 ± 274.35 | 661.30 ± 314.51 | 536.77 ± 268.38 | 495.91 ± 304.41 | 480.67 ± 248.13 |
| Running | 489.65 ± 268.09 | 285.83 ± 167.70 | 330.35 ± 177.98 | 297.88 ± 165.59 | 464.45 ± 304.97 | 312.72 ± 185.30 |
| HIRunning | 337.86 ± 202.40 | 73.79 ± 73.74 | 103.93 ± 74.43 | 70.78 ± 50.92 | 320.48 ± 221.36 | 92.07 ± 62.90 |
| Sprinting | 52.16 ± 46.48 | 4.32 ± 10.66 | 5.37 ± 9.36 | 2.95 ± 6.33 | 40.70 ± 40.46 | 1.47 ± 4.68 |
| Total | Offense | Defense | |
|---|---|---|---|
| Left Wings | 83.68 ± 23.50 | 90.65 ± 18.28 | 76.56 ± 25.96 |
| Left Backs | 90.83 ± 35.49 | 105.95 ± 25.20 | 75.67 ± 37.80 |
| Center backs | 98.34 ± 36.11 | 100.98 ± 15.48 | 95.76 ± 48.90 |
| Right backs | 86.52 ± 30.16 | 94.12 ± 18.04 | 78.92 ± 37.17 |
| Right wings | 85.12 ± 32.92 | 87.74 ± 12.32 | 82.19 ± 43.12 |
| Line players | 91.17 ± 42.67 | 95.84 ± 29.38 | 86.48 ± 52.39 |
| Total | 89.63 ± 35.32 | 96.53 ± 22.57 | 82.72 ± 43.28 |
Publisher’s Note: MDPI stays neutral with regard to jurisdictional claims in published maps and institutional affiliations. |
© 2021 by the authors. Licensee MDPI, Basel, Switzerland. This article is an open access article distributed under the terms and conditions of the Creative Commons Attribution (CC BY) license (http://creativecommons.org/licenses/by/4.0/).
Share and Cite
Manchado, C.; Pueo, B.; Chirosa-Rios, L.J.; Tortosa-Martínez, J. Time–Motion Analysis by Playing Positions of Male Handball Players during the European Championship 2020. Int. J. Environ. Res. Public Health 2021, 18, 2787. https://0-doi-org.brum.beds.ac.uk/10.3390/ijerph18062787
Manchado C, Pueo B, Chirosa-Rios LJ, Tortosa-Martínez J. Time–Motion Analysis by Playing Positions of Male Handball Players during the European Championship 2020. International Journal of Environmental Research and Public Health. 2021; 18(6):2787. https://0-doi-org.brum.beds.ac.uk/10.3390/ijerph18062787
Chicago/Turabian StyleManchado, Carmen, Basilio Pueo, Luis Javier Chirosa-Rios, and Juan Tortosa-Martínez. 2021. "Time–Motion Analysis by Playing Positions of Male Handball Players during the European Championship 2020" International Journal of Environmental Research and Public Health 18, no. 6: 2787. https://0-doi-org.brum.beds.ac.uk/10.3390/ijerph18062787