
Impact of Covid-19 Lockdown on Availability of Drinking Water in the Arsenic-Affected Ganges River Basin


 ,
, 
 , and
, and
Abstract
:1. Introduction
2. Methods
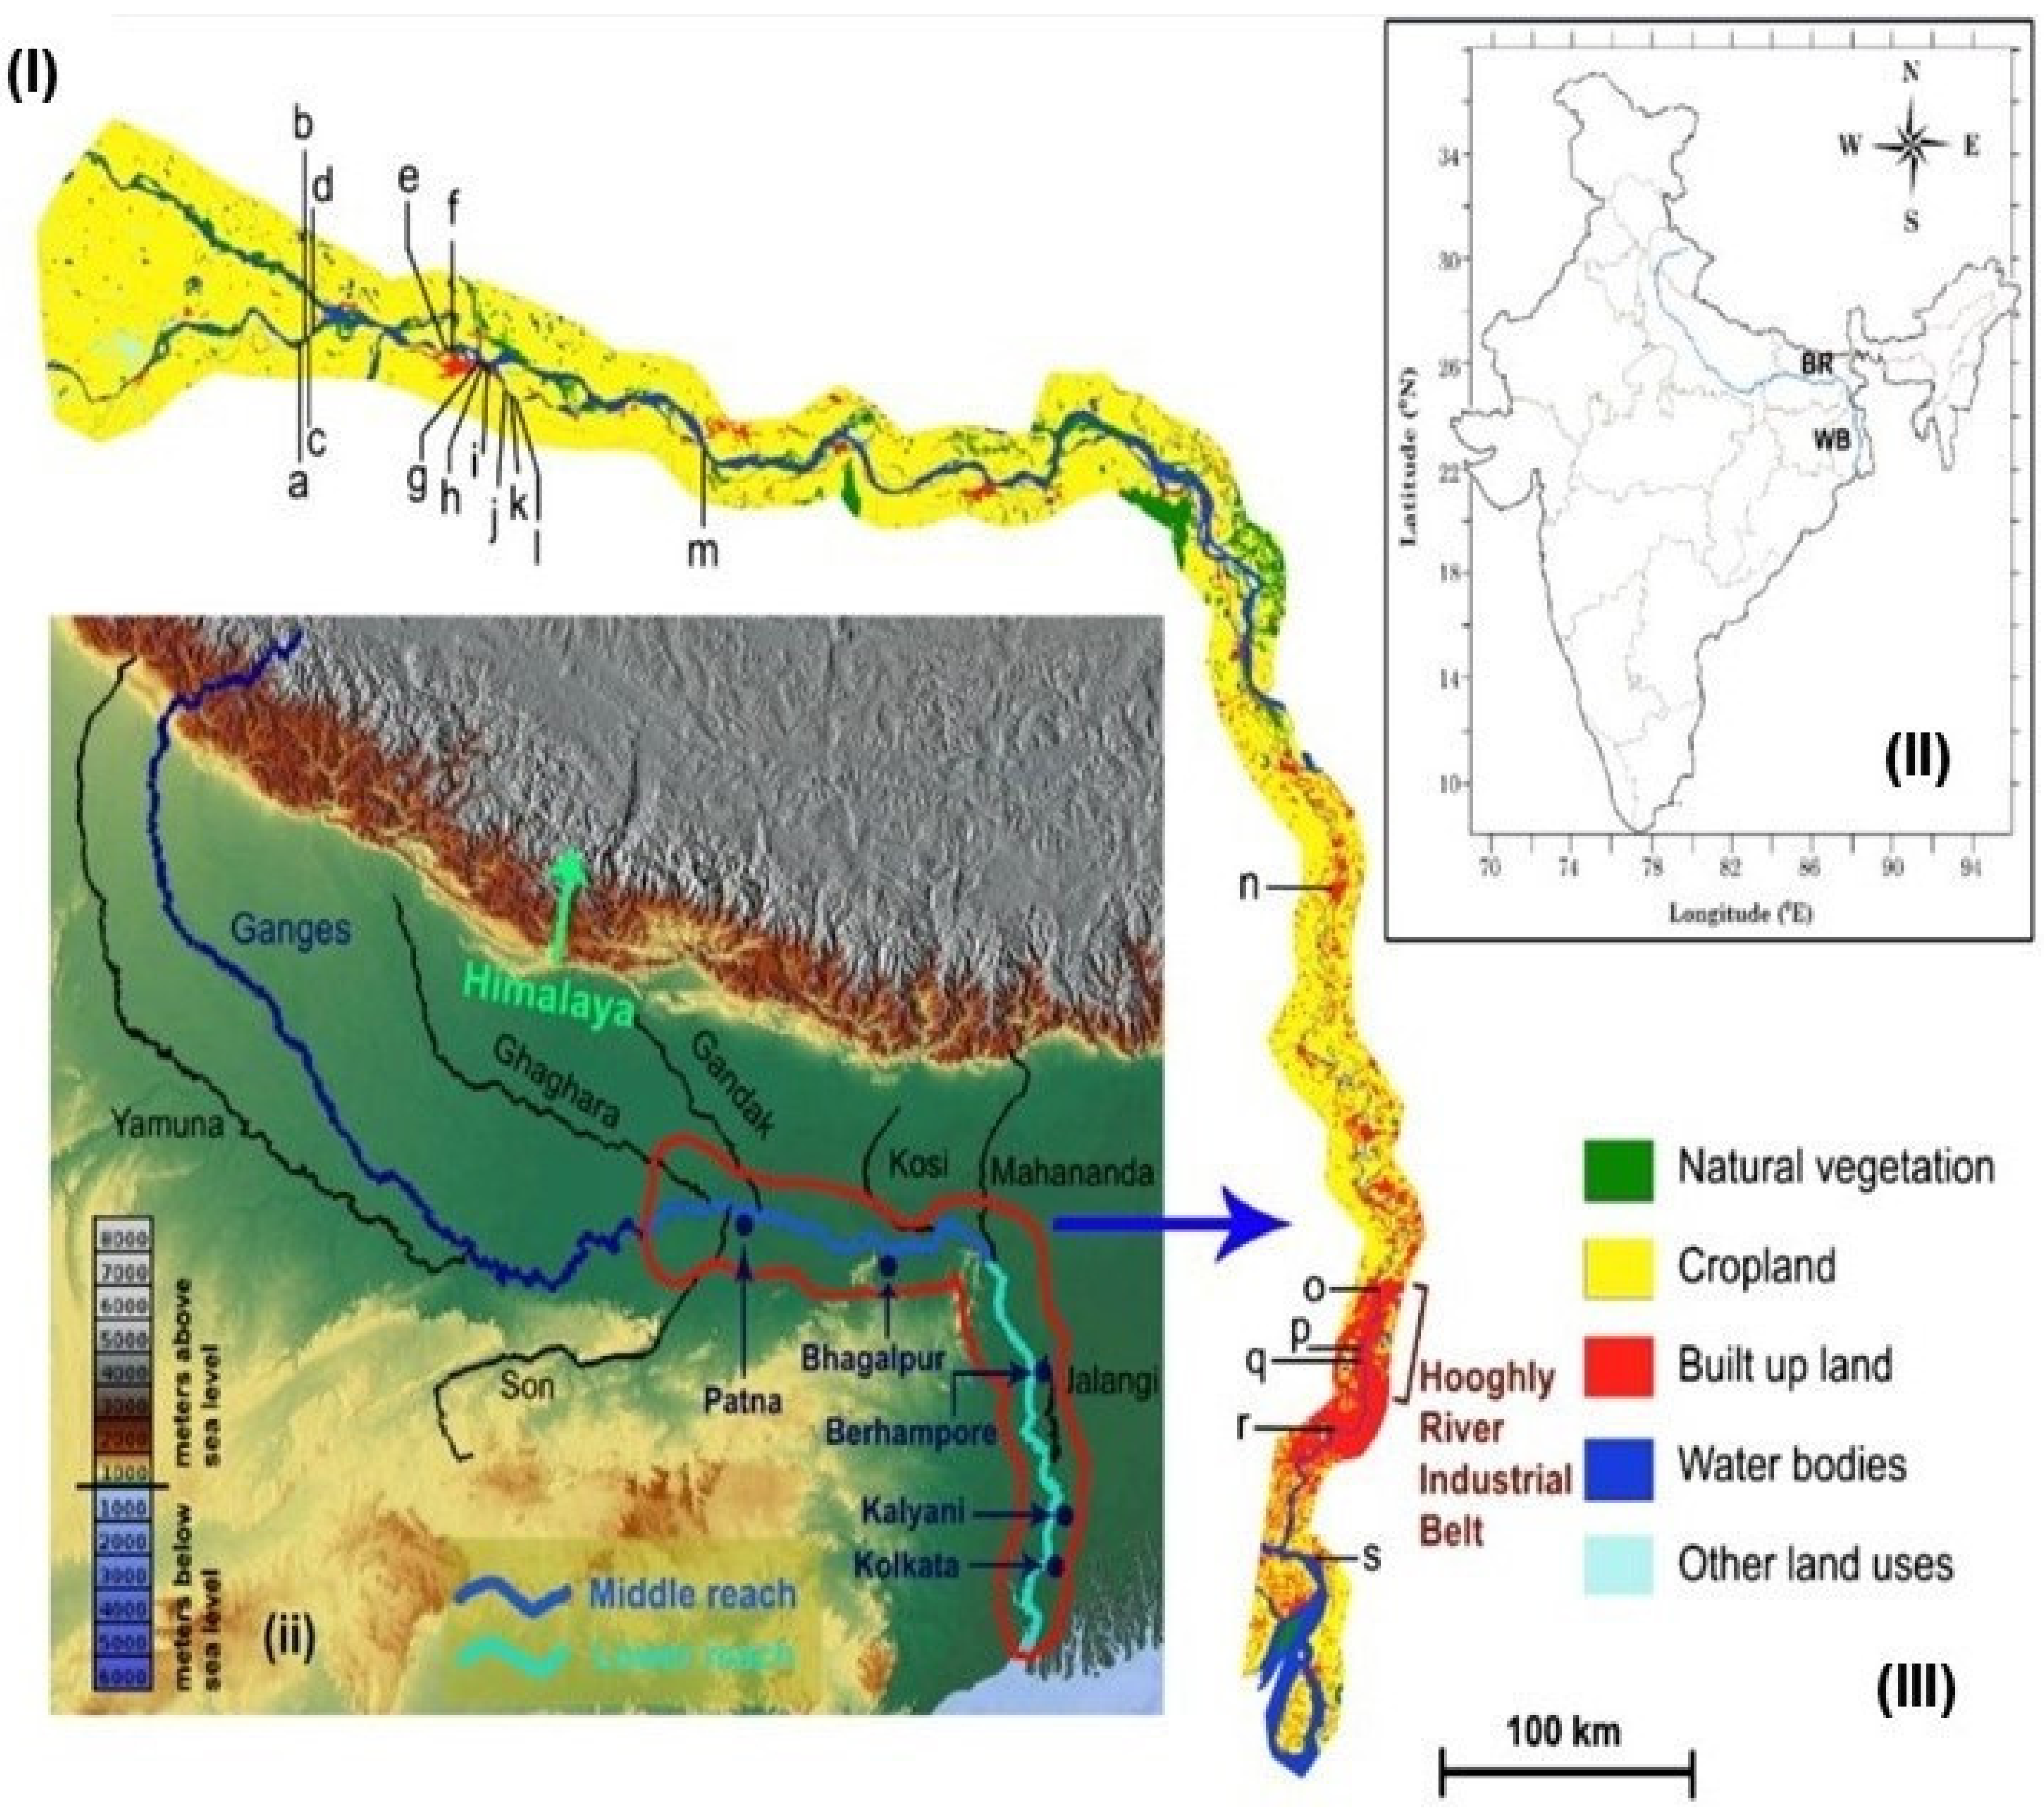
2.1. Study Area

2.2. Data Acquisition and Analyses
2.2.1. Ganges River Water Quality
2.2.2. Groundwater Arsenic and Water Quality
2.3. Assessment and Predictions
Risk Analysis and Random Forest Modeling
2.4. Statistical Analysis
2.4.1. Correlation and Multivariate Analyses for Pre-, During- and Post-Lockdown Periods
2.4.2. Panel Data Analysis
2.5. Assumptions and Limitations
3. Results and Discussion
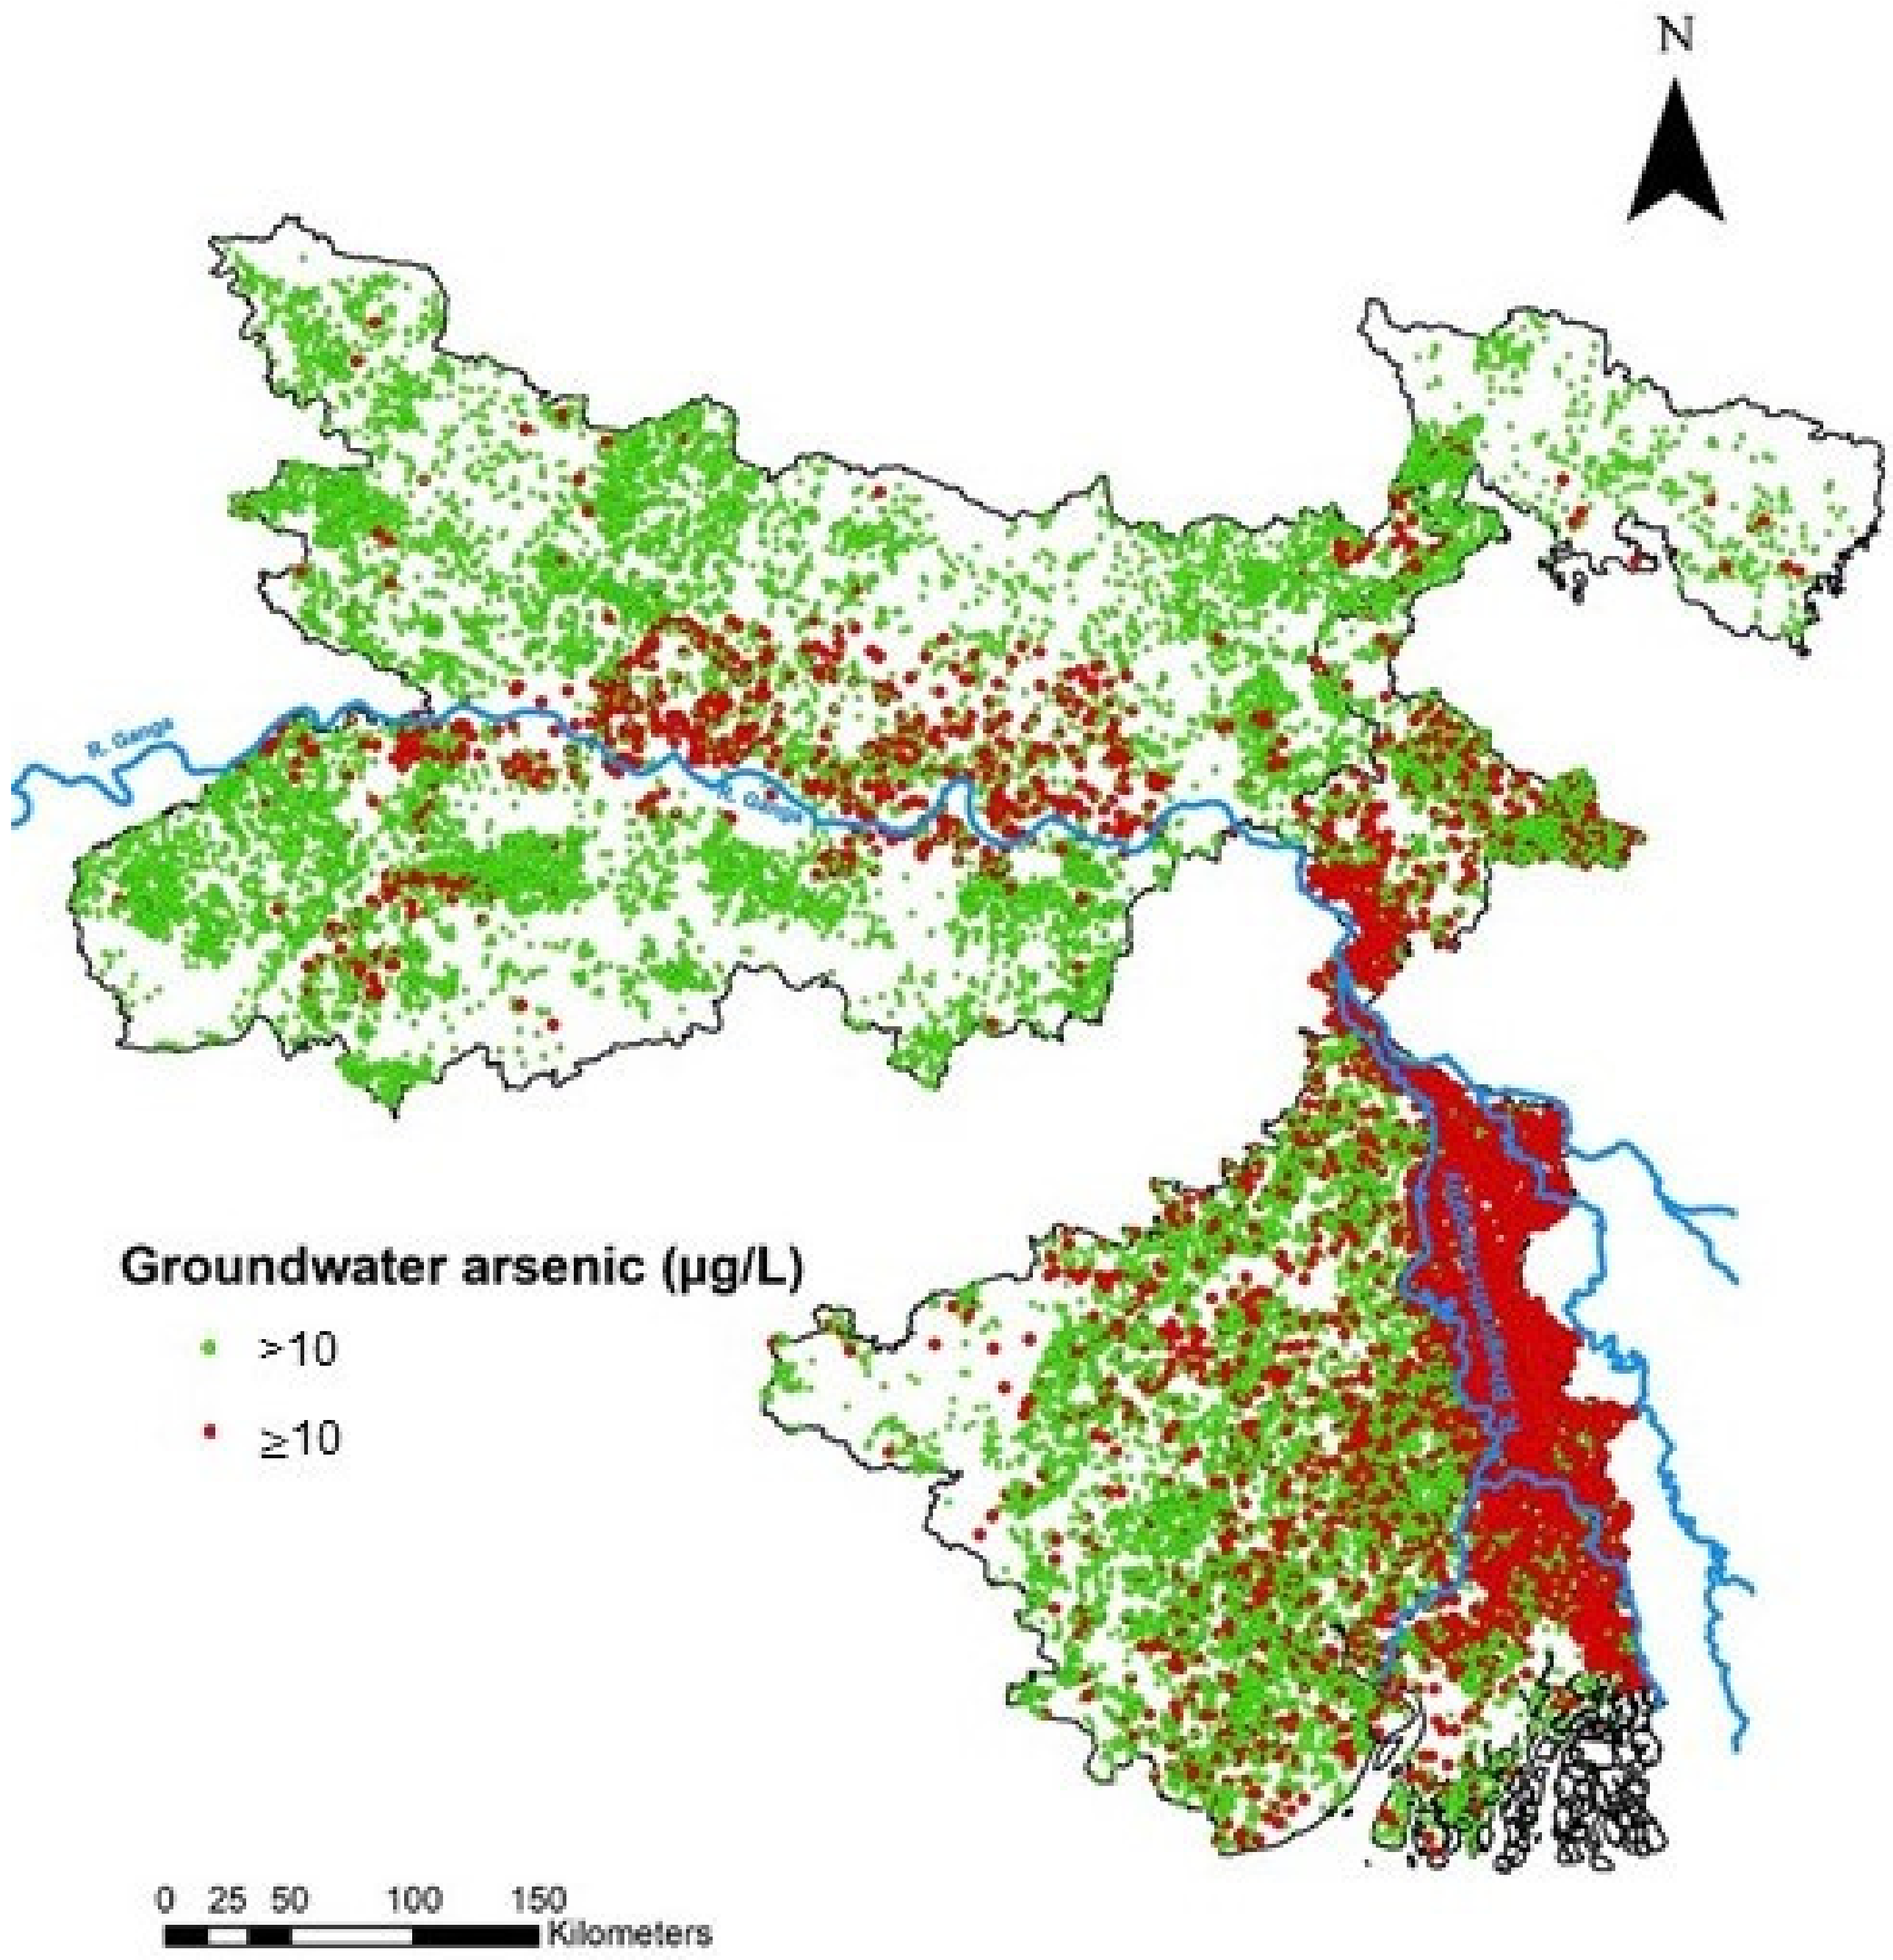
3.1. Present Scenario of Groundwater Quality with Respect to Arsenic Pollution in Ganges River Basin
3.1.1. Occurrence of Arsenic in Groundwater
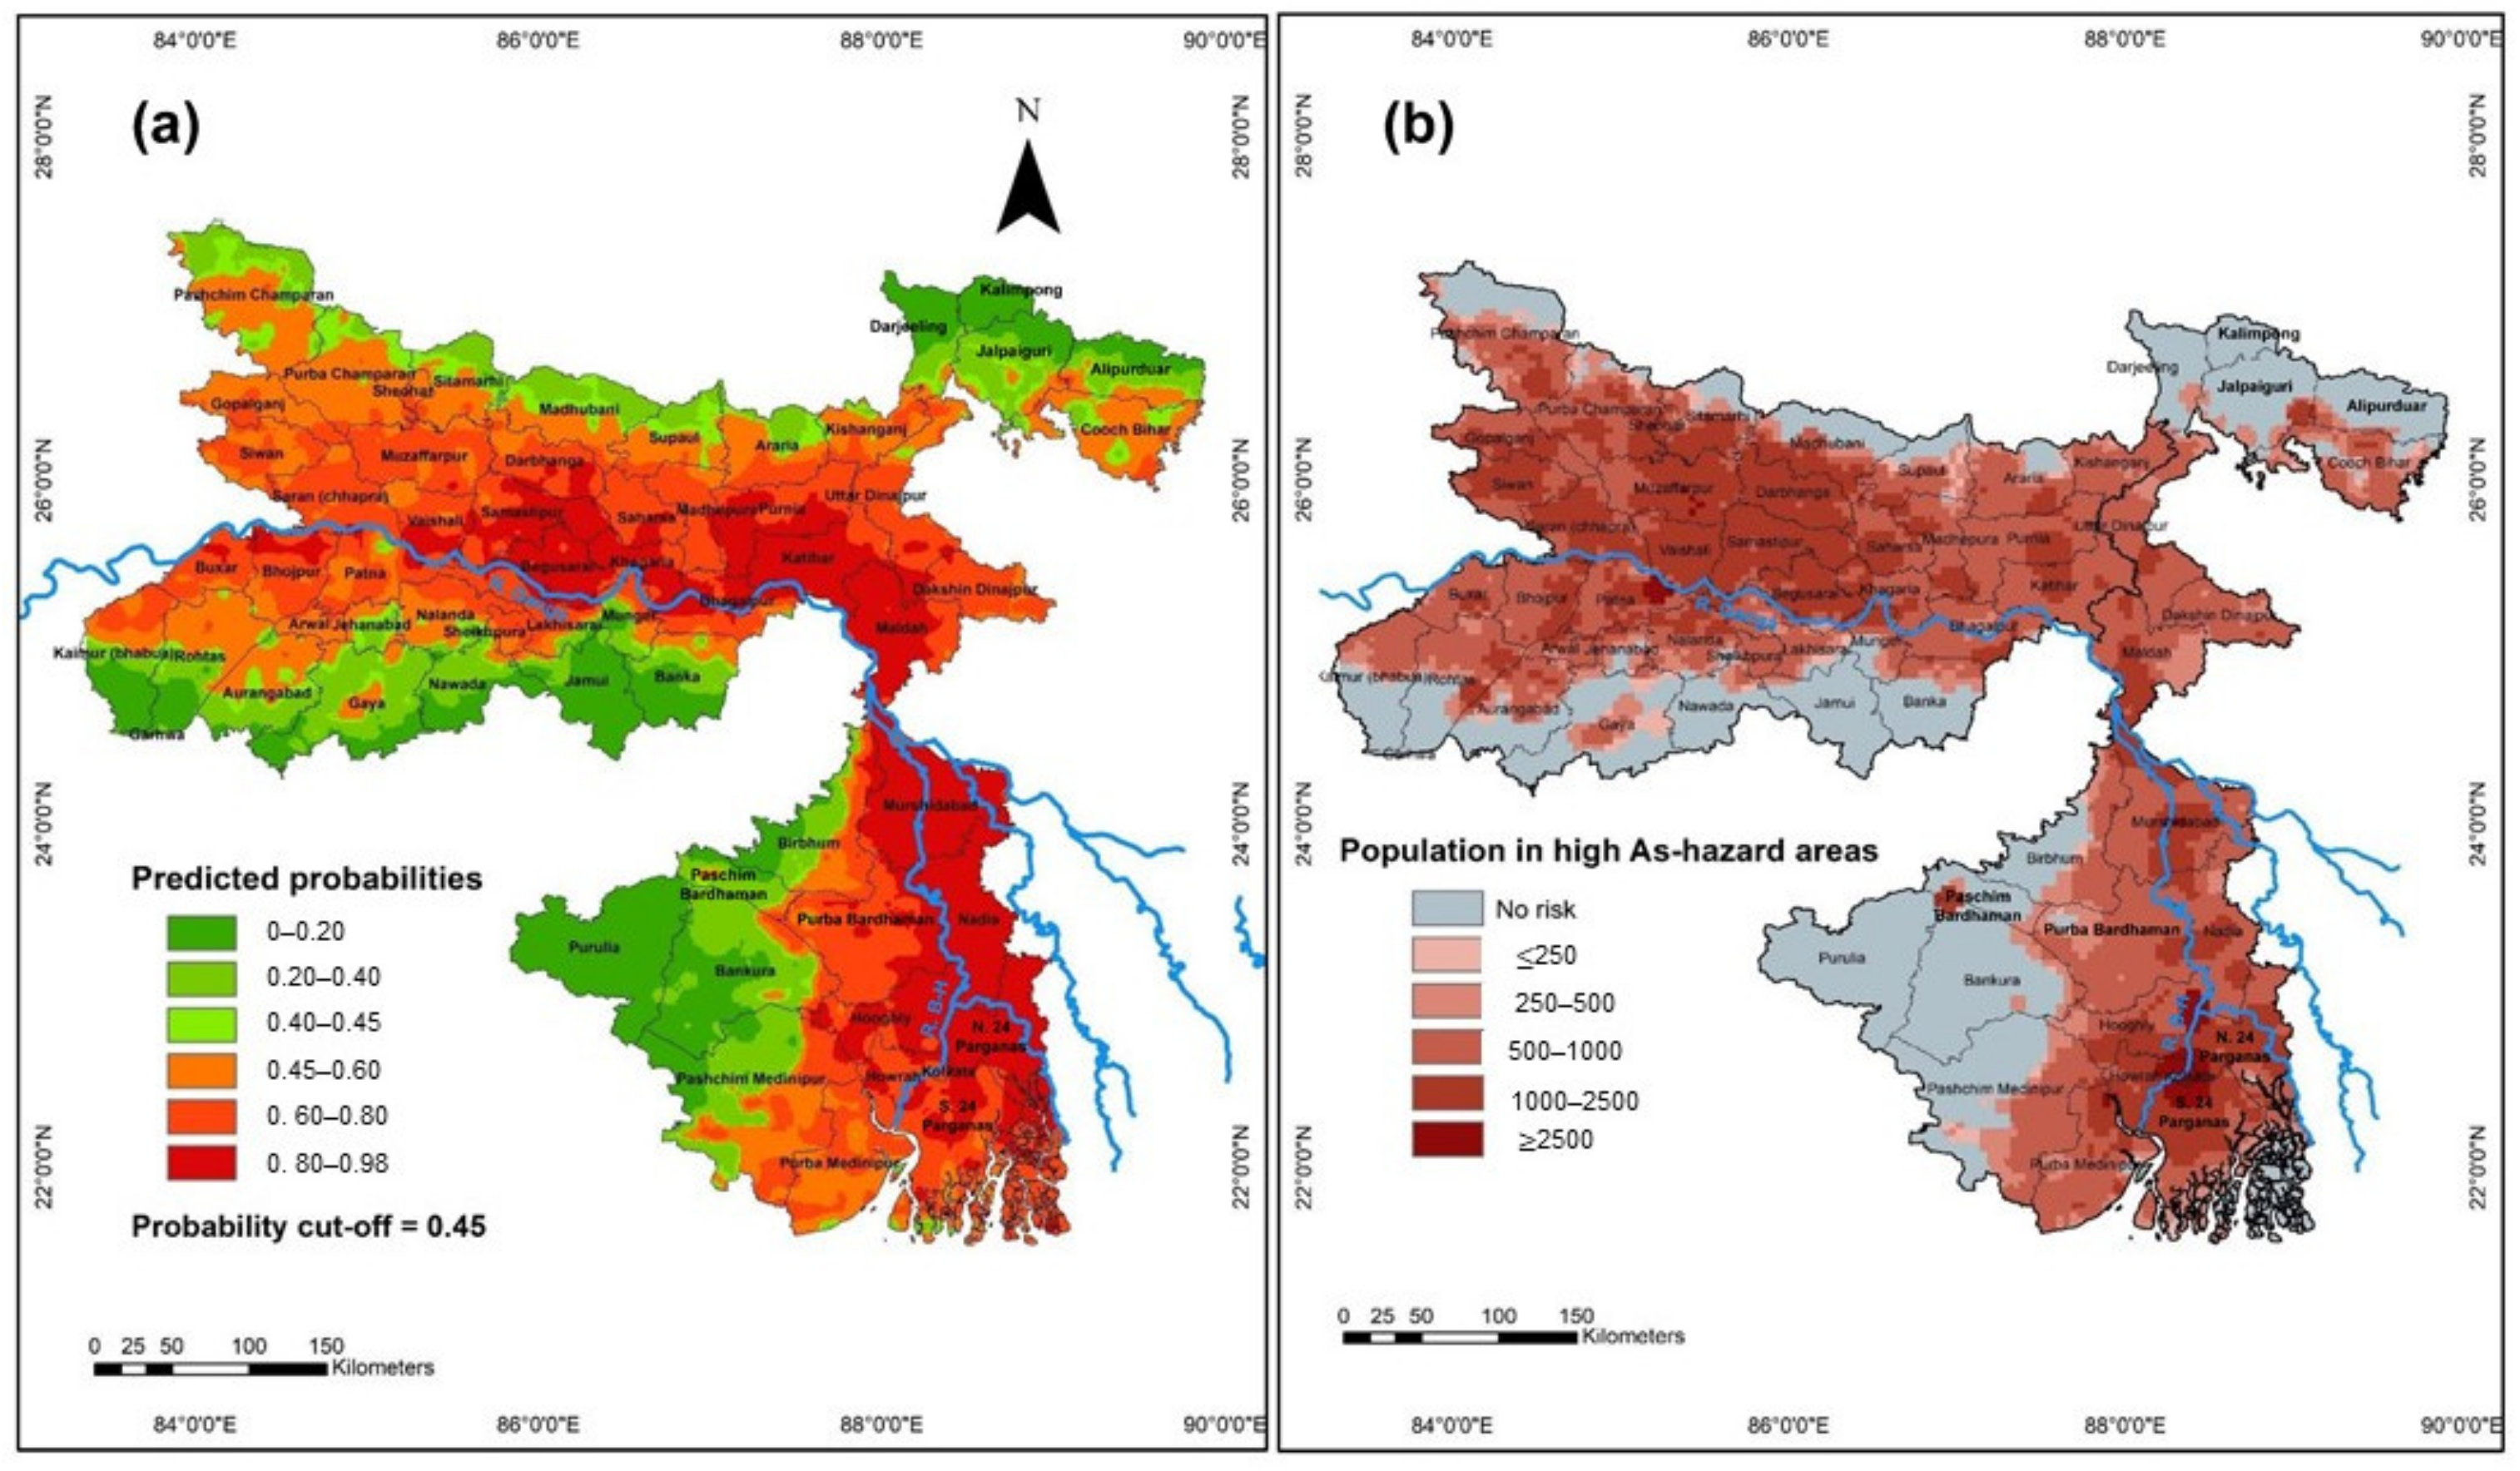
3.1.2. Prediction of Groundwater Arsenic Concentration Using Machine Learning Based Approach
3.1.3. Population Exposed to Elevated Groundwater Arsenic Concentration
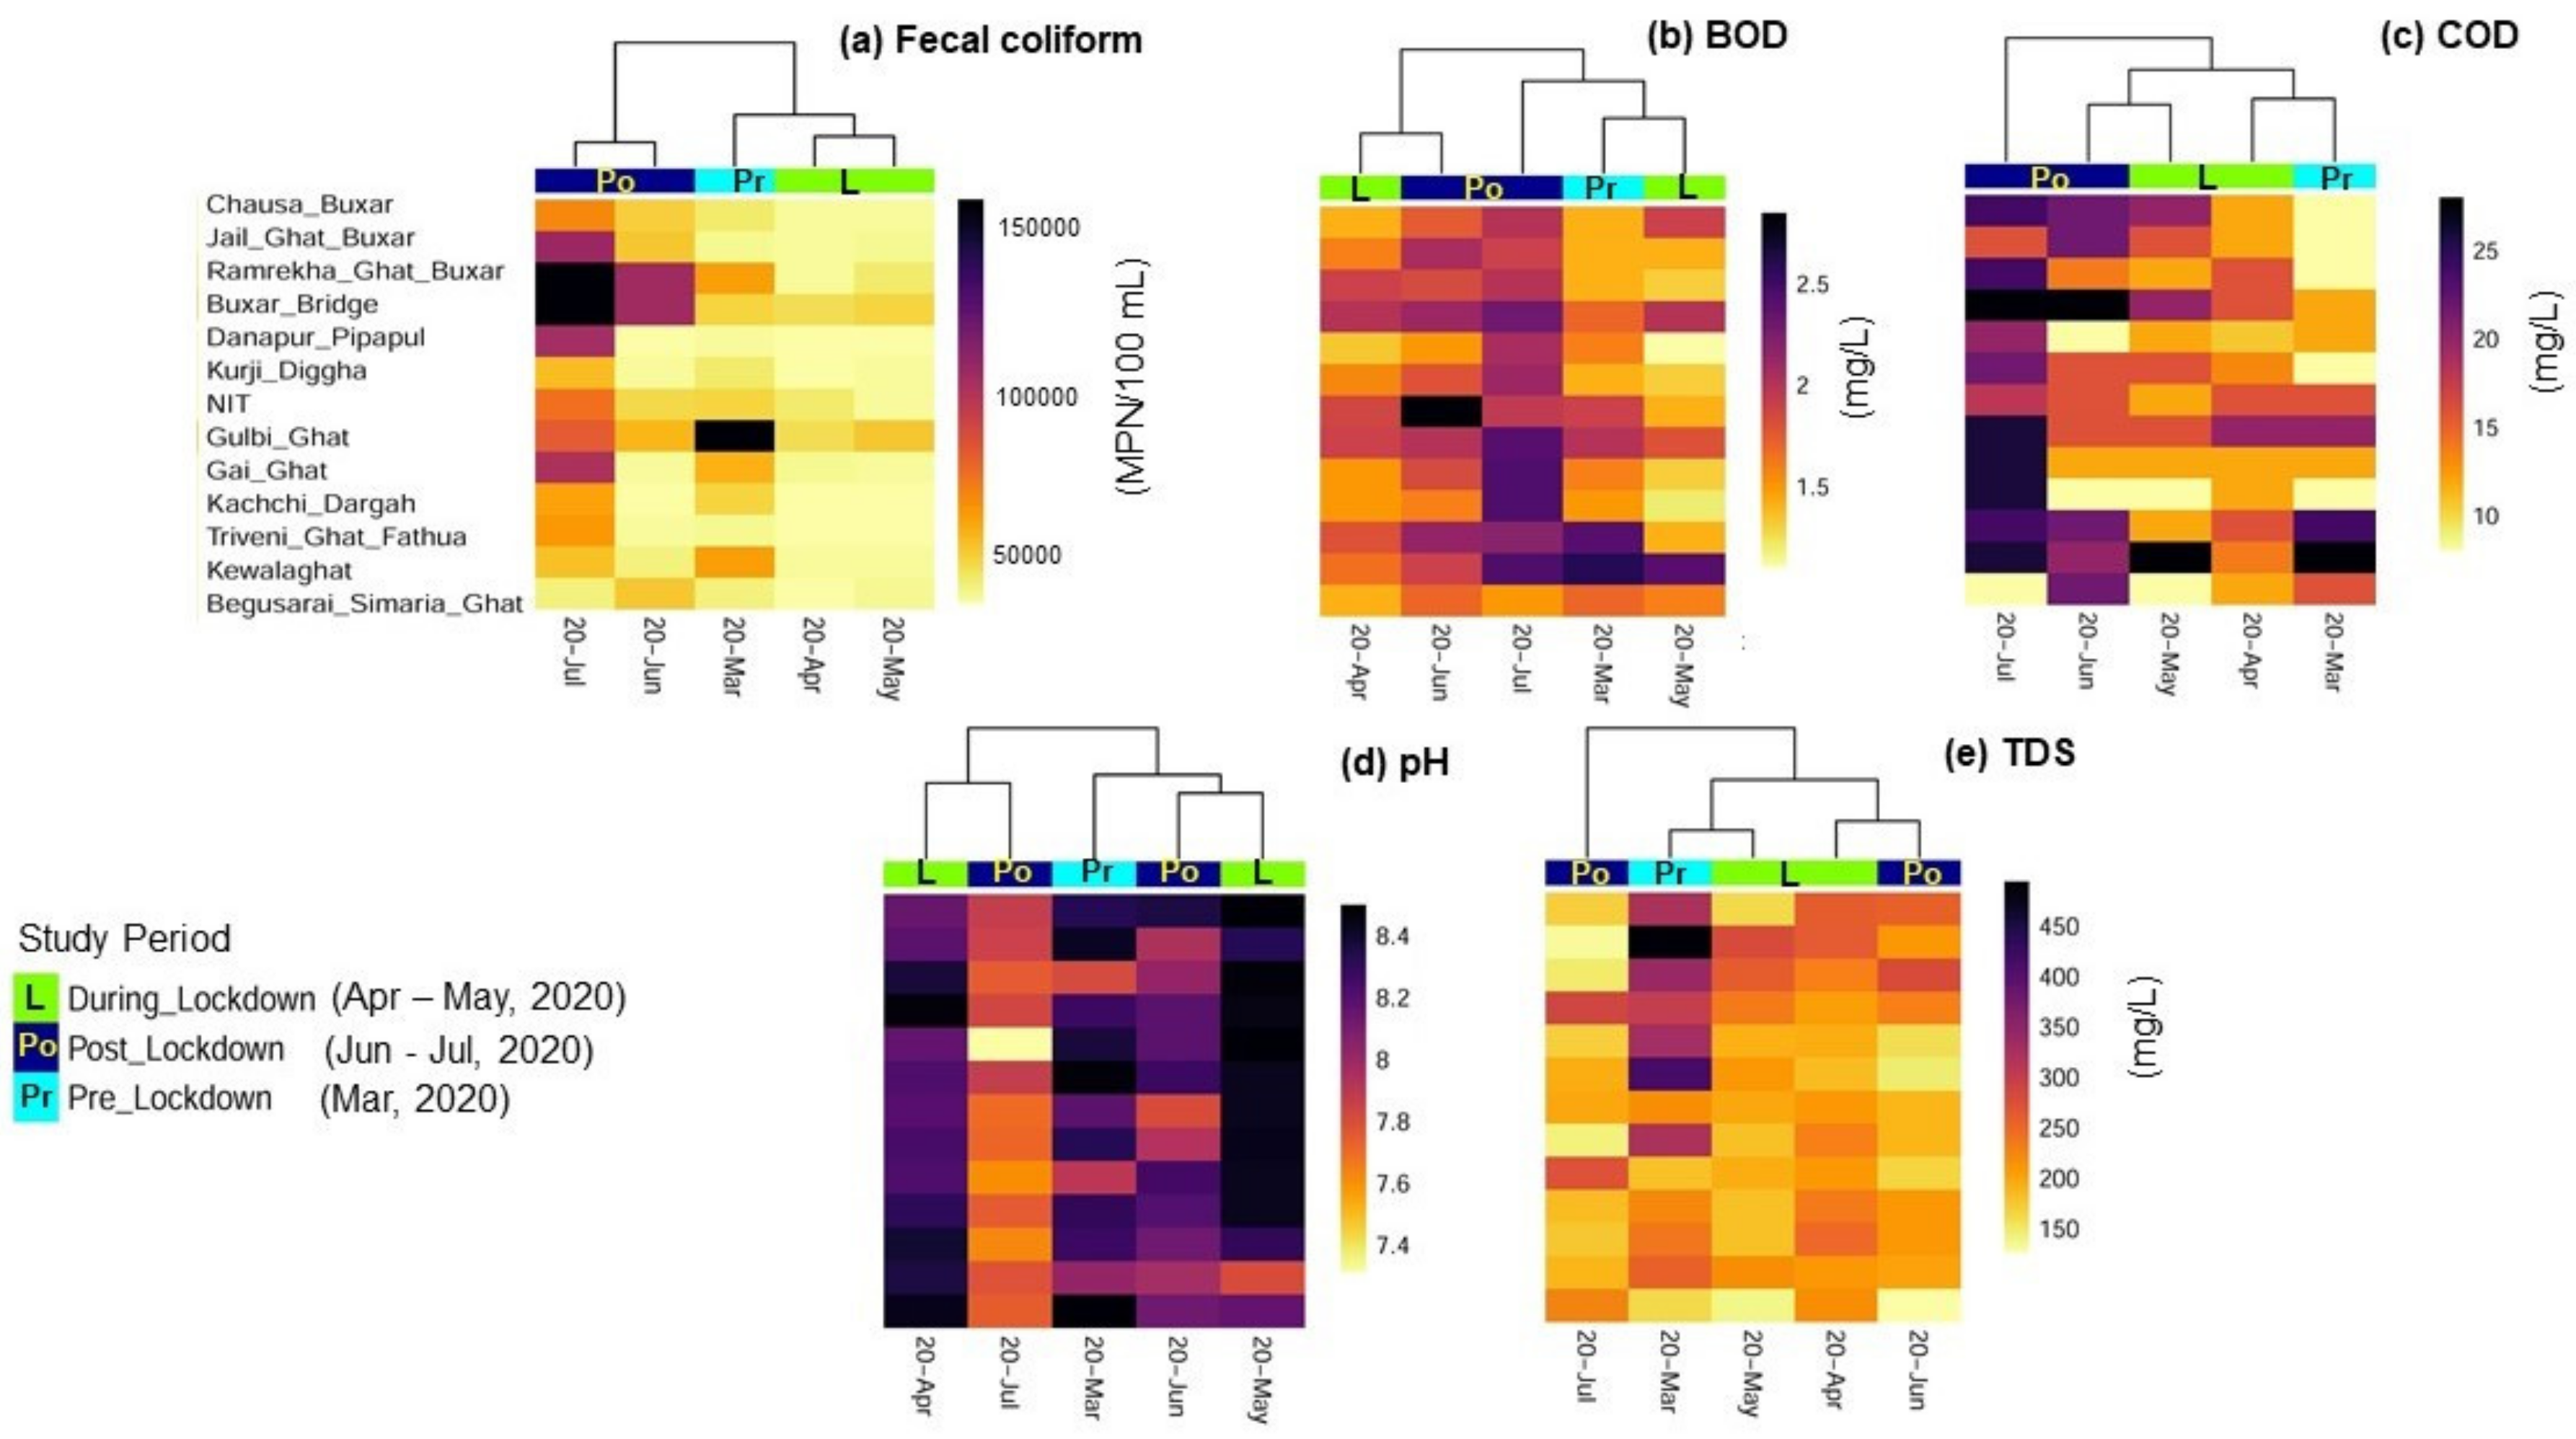
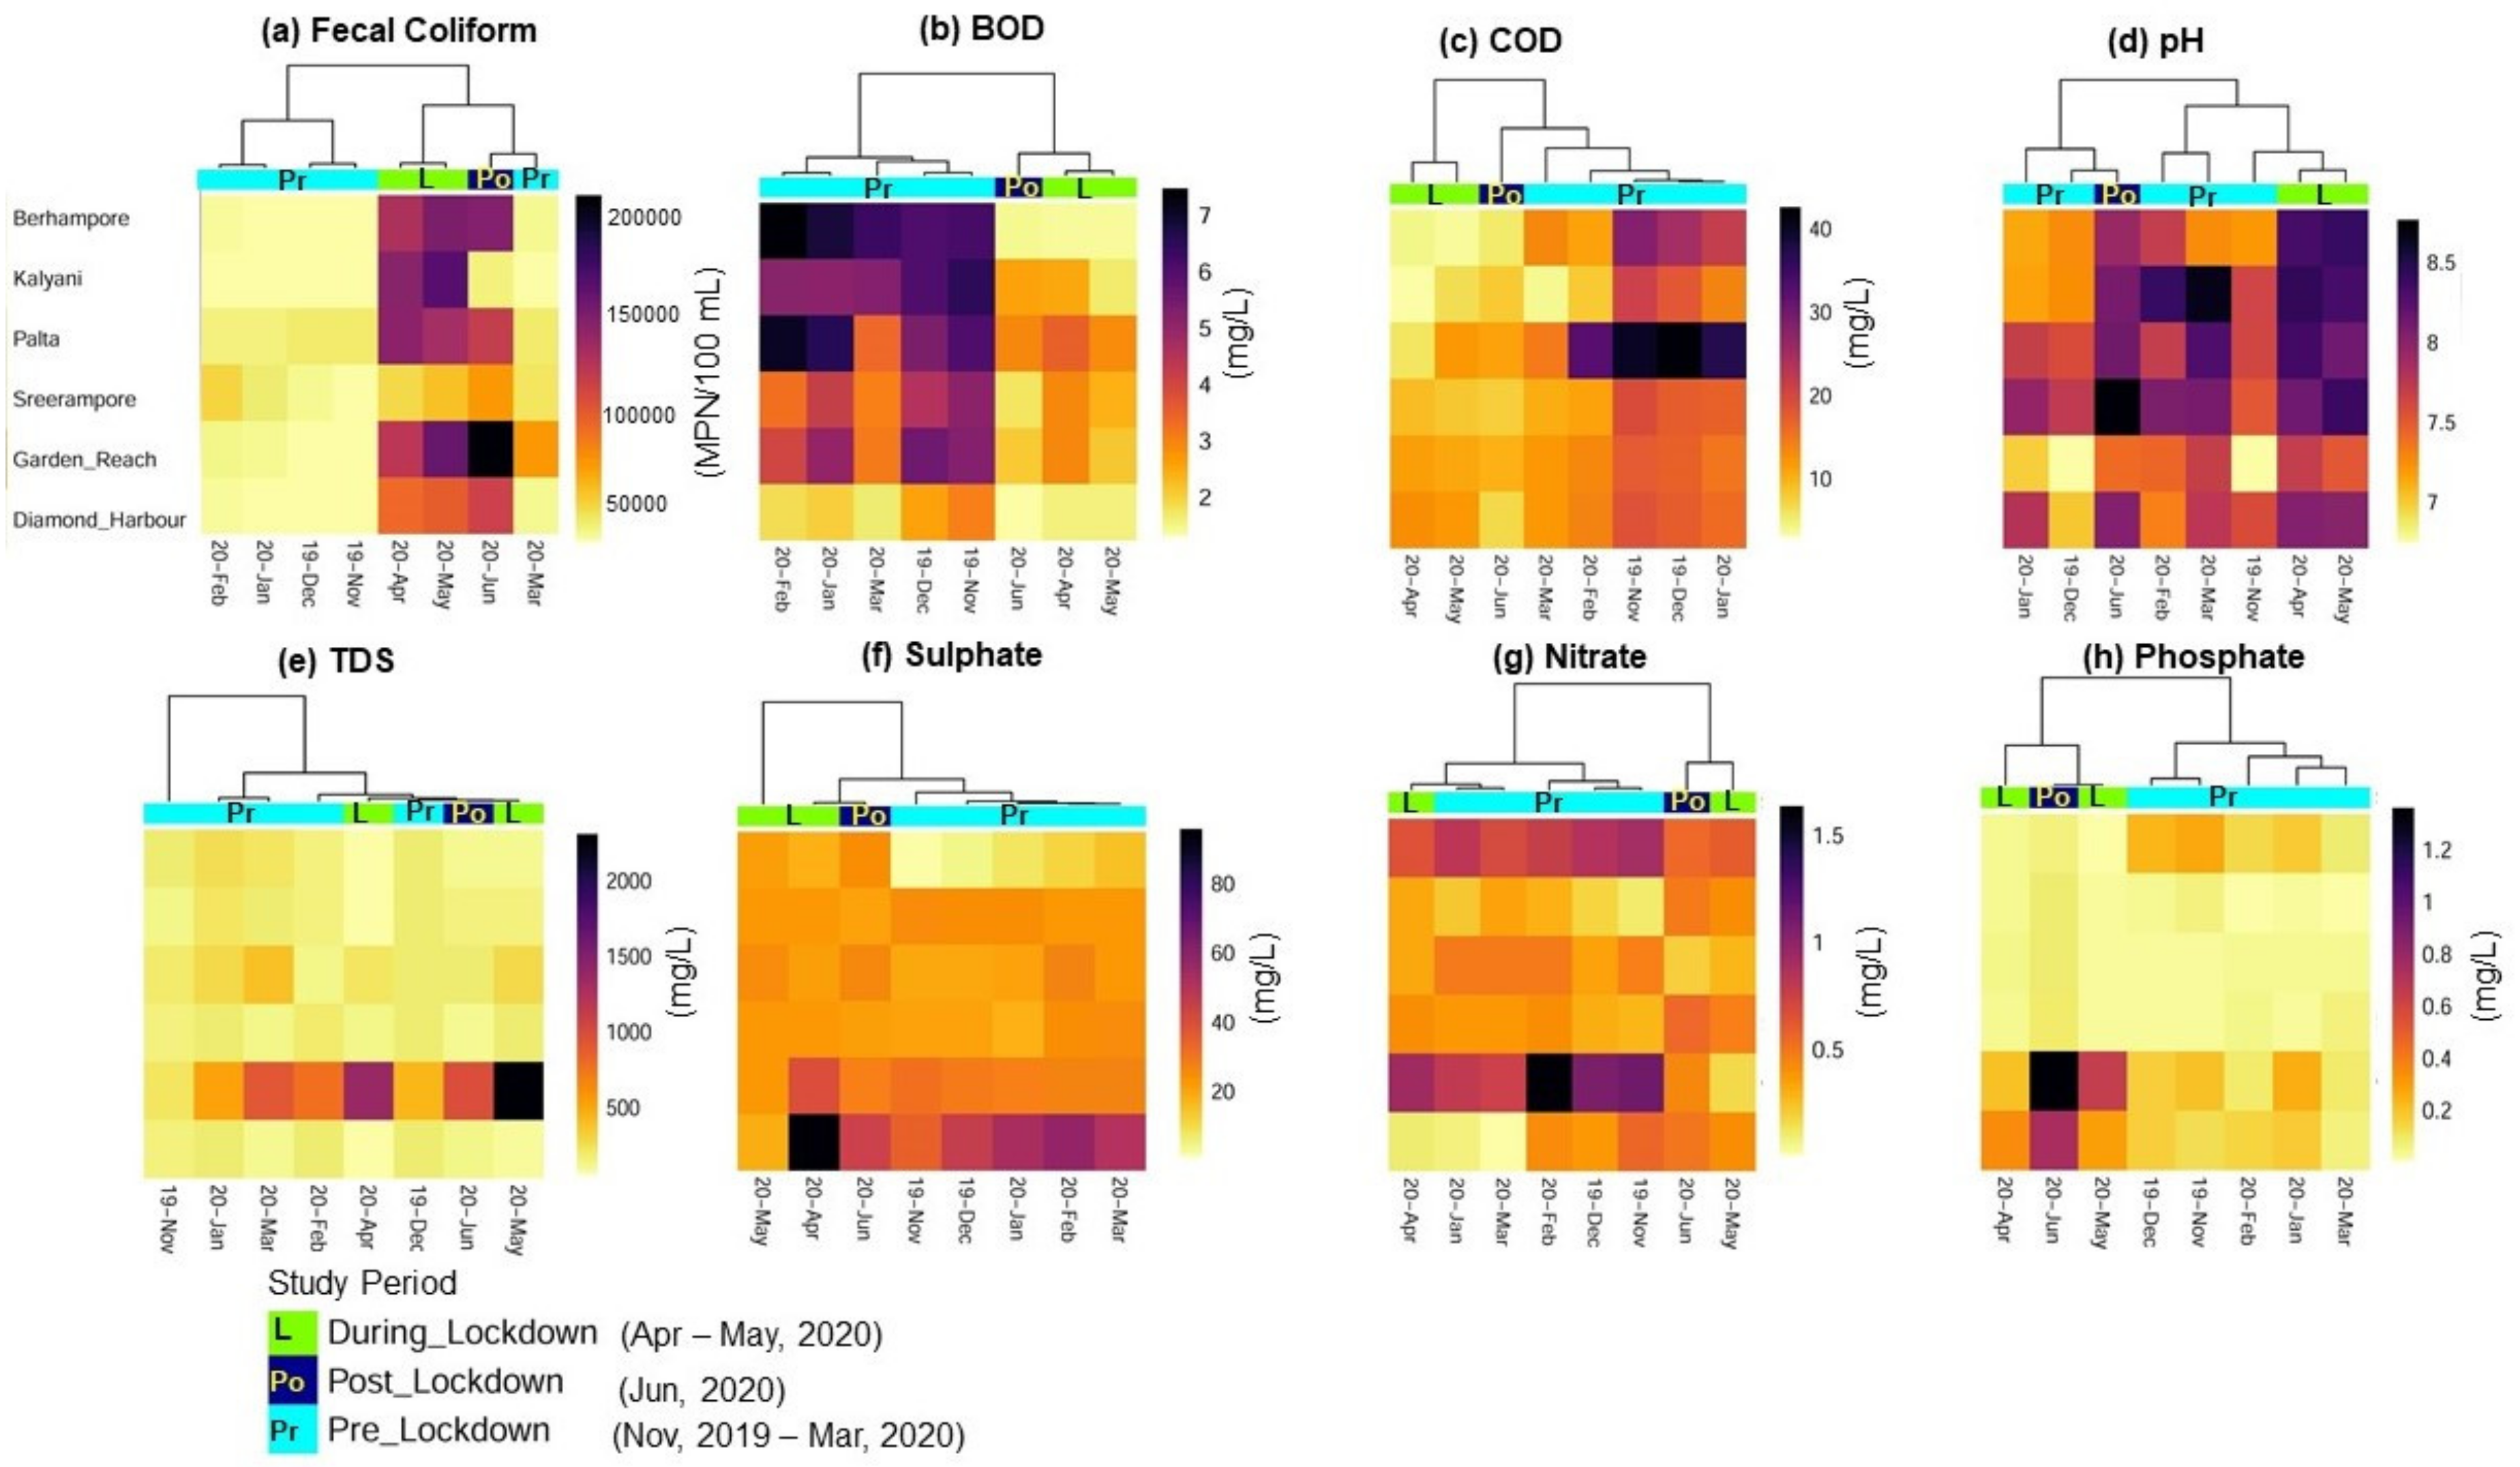
3.2. Observations and Evaluation of Ganges River Water Quality
Impact of Lockdown in Arsenic Affected Parts of Ganges River Basin
3.3. Impact of Natural and Human Factors on Lockdown River Water Quality
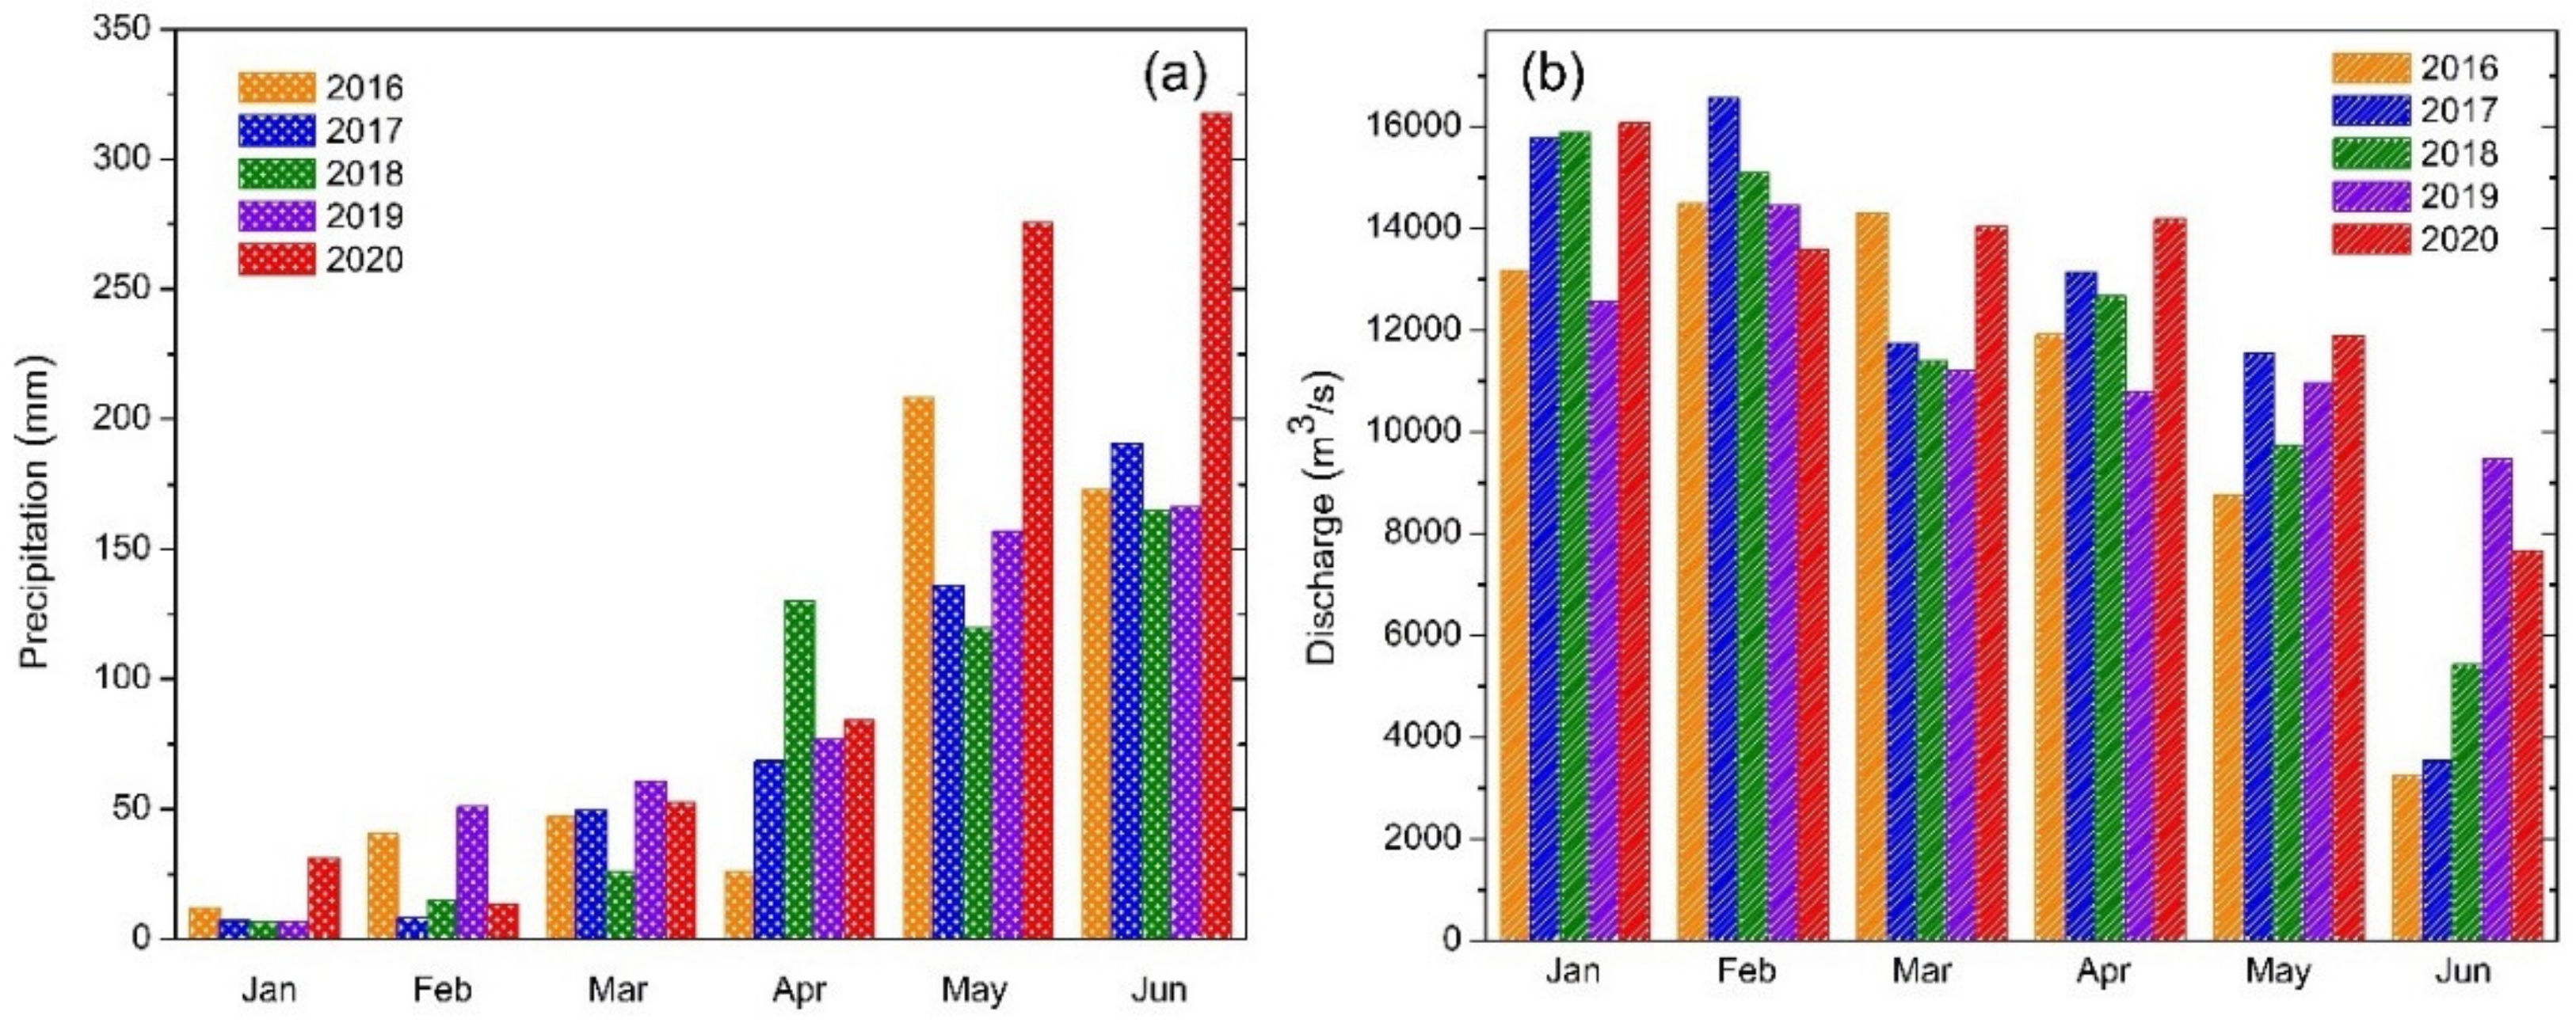
3.3.1. Rainfall and River Flow
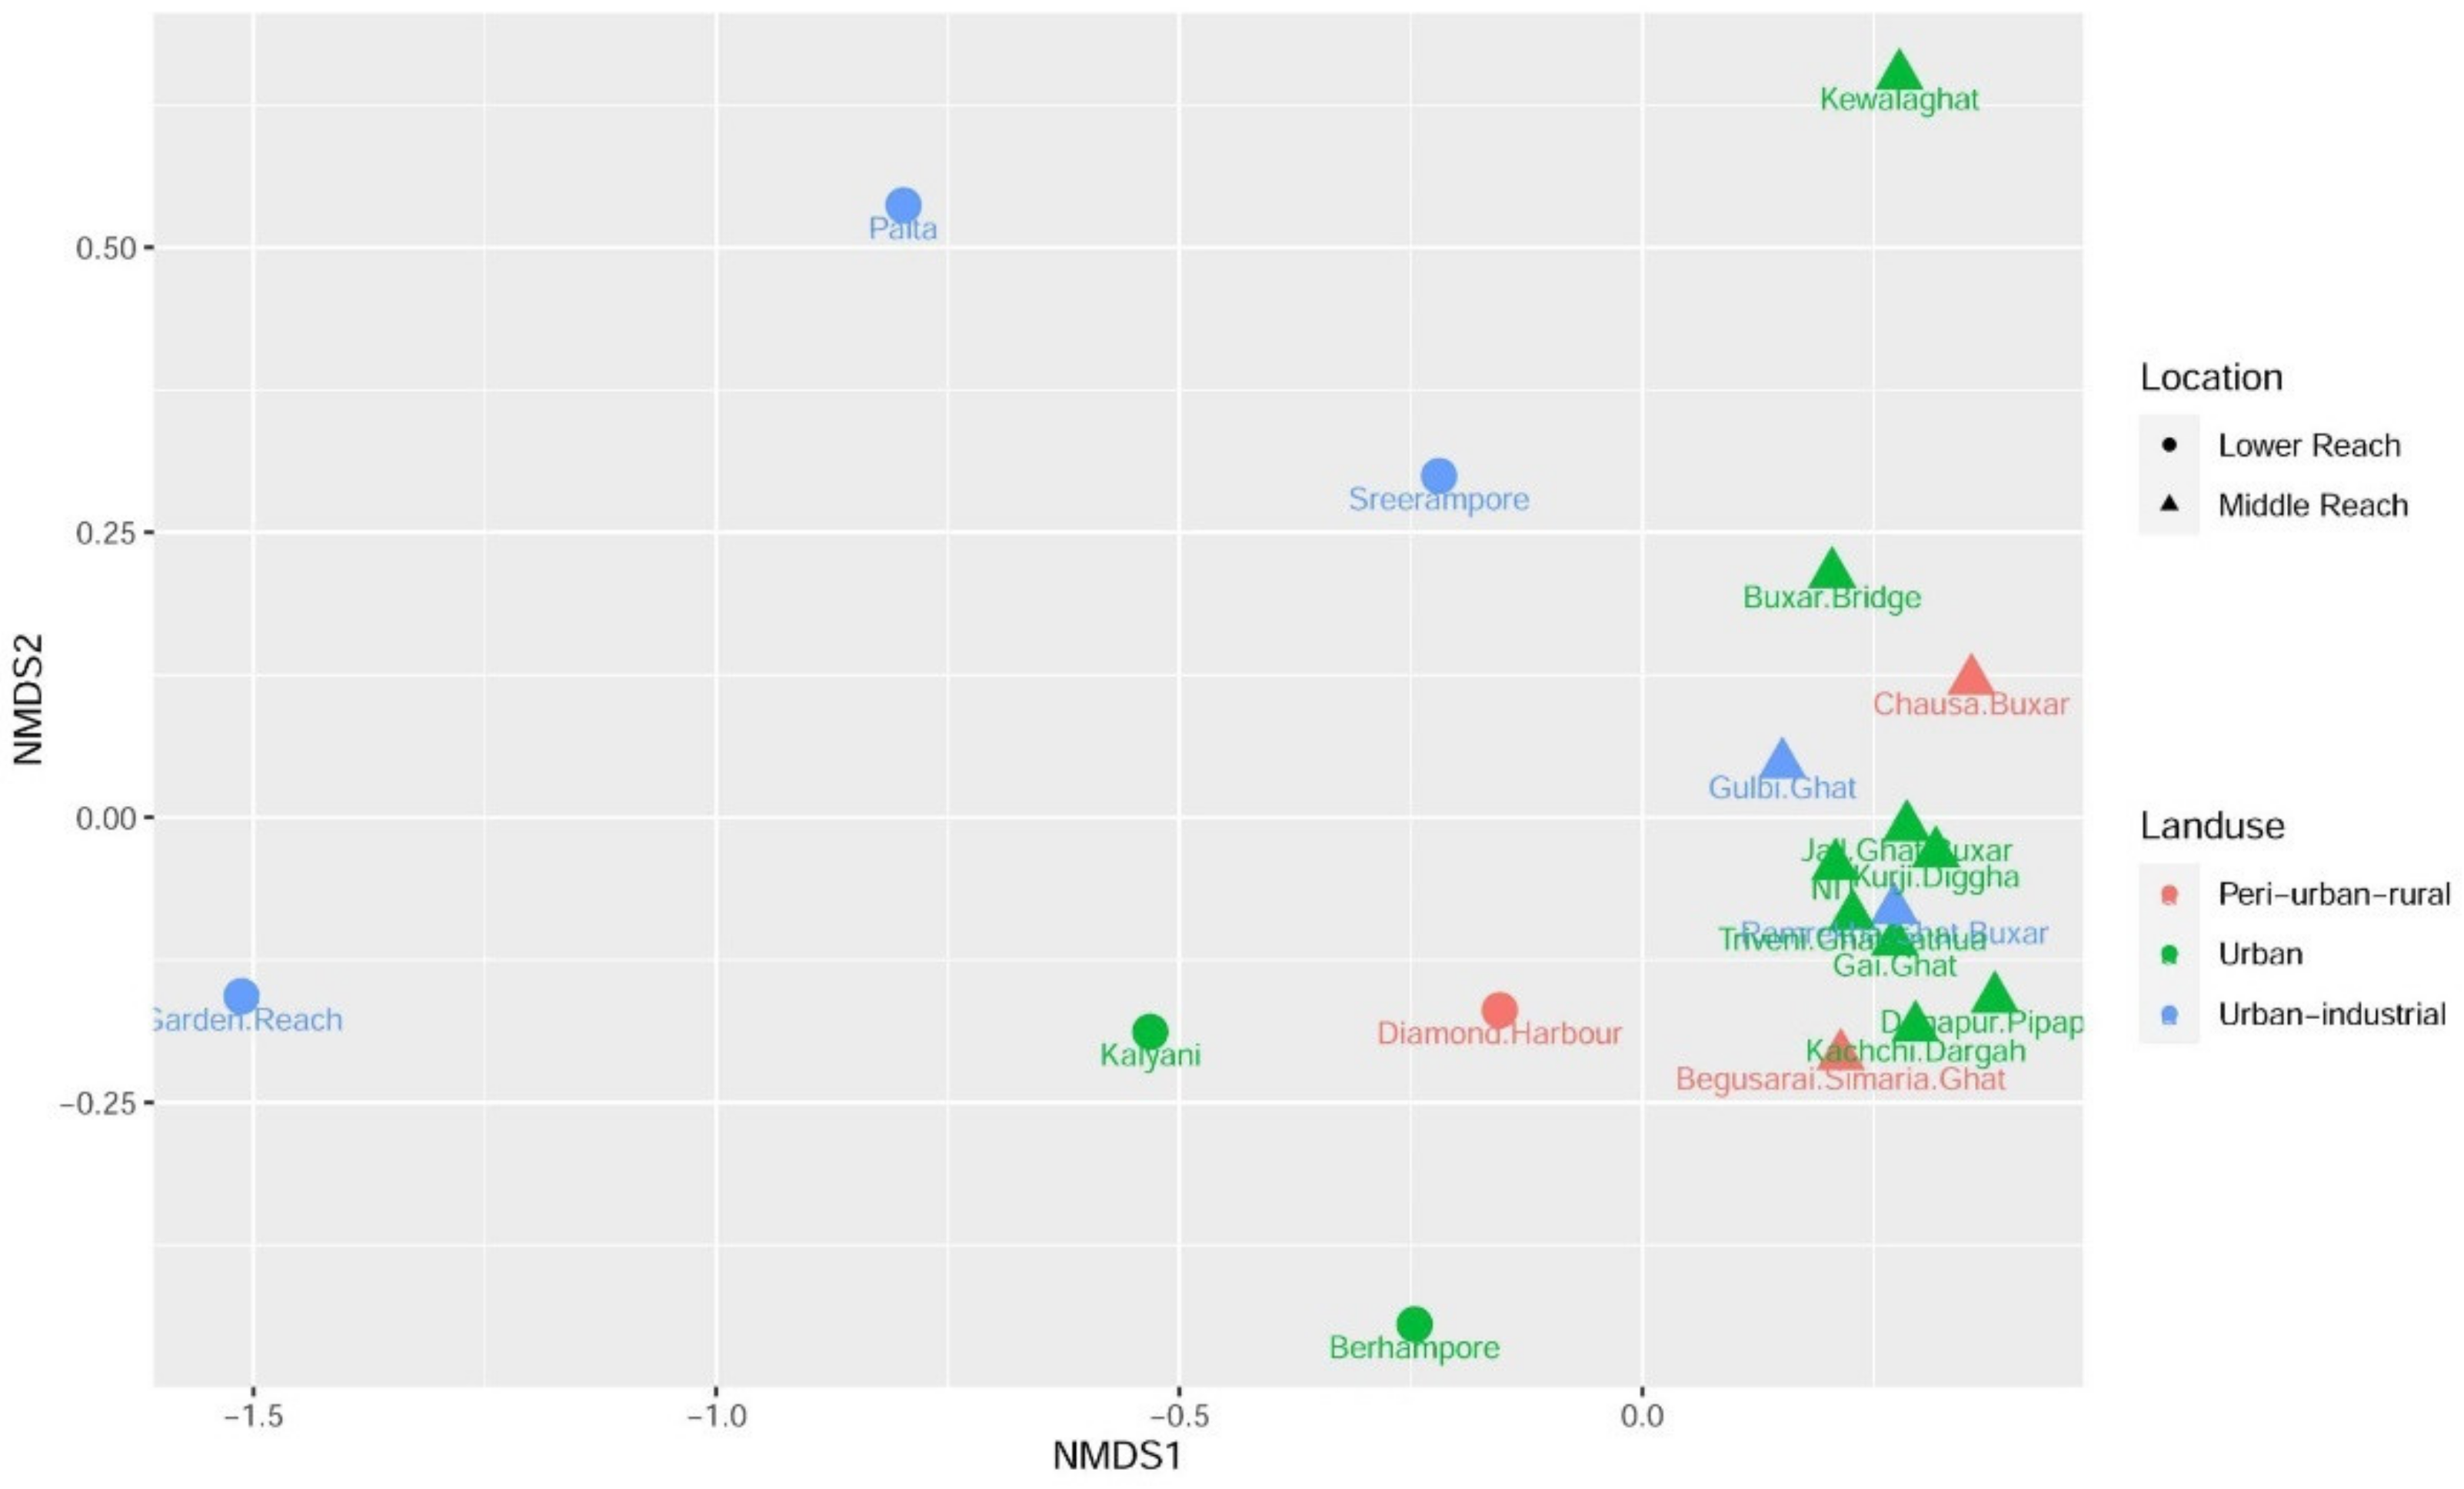
3.3.2. Land Use and Land Cover
3.3.3. Human Influence in Changing River Water Quality
3.4. Groundwater-Sourced Drinking Water/Ganges River Sourced Drinking Water
- Efficient disposal of hazardous industrial and urban effluents like oils, anti-freeze, paint, solvents, cleaners, preservatives, and biomedical, which should not be directly introduced to the river water.
- Introduction of zero-discharge waste-water treatment facilities with integration of existing traditional water remediation techniques with emerging, locally adaptive technologies such as phytoremediation, bioremediation, riverbank filtration, etc.
- Enhanced sanitation and structured and planned septic systems need to be in place and measures need to be taken to restrict defecation outflow to the river water.
- Irrigational water preservation through regulated groundwater usage may be adapted through cropping of native food crops and reduction of water-guzzling cash-crops.
- Enhance natural groundwater infiltration and recharge through resurface with permeable land cover in urban brawls.
- Knowledge dissemination through participatory local training and utilization of ground knowledge for long-term sustainable rejuvenation.
- Introduction and implementation of a stringent regulatory framework for river water quantity and quality, replenishment and rejuvenation.
4. Conclusions
Supplementary Materials
Author Contributions
Funding
Institutional Review Board Statement
Informed Consent Statement
Data Availability Statement
Acknowledgments
Conflicts of Interest
References
- Diffenbaugh, N.S.; Field, C.B.; Appel, E.A.; Azevedo, I.L.; Baldocchi, D.D.; Burke, M.; Burney, J.A.; Ciais, P.; Davis, S.J.; Fiore, A.M. The COVID-19 lockdowns: A window into the earth system. Nat. Rev. Earth Environ. 2020, 1, 470–481. [Google Scholar] [CrossRef]
- WHO. Coronavirus Disease (COVID-19) Situation Report-197. Available online: https://www.who.int/docs/default-source/coronaviruse/situation-reports/20200804-covid-19-sitrep-197.pdf?sfvrsn=94f7a01d_2 (accessed on 5 August 2020).
- Business Today. Coronavirus in India LIVE Updates: PM Modi Announces 21-Day National Lockdown. y. 24 March 2020. Available online: https://www.businesstoday.in/latest/trends/coronavirus-in-india-live-updates-9-dead-471-infected-govt-mounts-pressure-to-self-isolate/story/399029.html (accessed on 27 July 2020).
- The Financial Express. Lockdown 5.0 Guidelines in India (State-Wise): New Lockdown Extension Rules Announced. Night Curfew Relaxed. 30 May 2020. Available online: https://www.financialexpress.com/lifestyle/health/lockdown-5-0-guidelines-state-wise-lockdown-extension-5-0-rules-latest-updates/1975135 (accessed on 27 July 2020).
- Mahato, S.; Pal, S.; Ghosh, K.G. Effect of lockdown amid COVID-19 pandemic on air quality of the megacity Delhi, India. Sci. Total Environ. 2020, 730, 139086. [Google Scholar] [CrossRef]
- Selvam, S.; Jesuraja, K.; Venkatramanan, S.; Chung, S.; Roy, P.; Muthukumar, P.; Kumar, M. Imprints of pandemic lockdown on subsurface water quality in the coastal industrial city of Tuticorin, South India: A Revival Perspective. Sci. Total Environ. 2020, 738, 139848. [Google Scholar] [CrossRef]
- Yunus, A.P.; Masago, Y.; Hijioka, Y. COVID-19 and Surface water quality: Improved lake water quality during the lockdown. Sci. Total Environ. 2020, 731, 139012. [Google Scholar] [CrossRef] [PubMed]
- Mukherjee, A.; Duttagupta, S.; Chattopadhyay, S.; Bhanja, S.N.; Bhattacharya, A.; Chakraborty, S.; Sarkar, S.; Ghosh, T.; Bhattacharya, J.; Sahu, S. Impact of sanitation and socio-economy on groundwater fecal pollution and human health towards achieving sustainable development goals across India from ground-observations and satellite-derived nightlight. Sci. Rep. 2019, 9, 1–11. [Google Scholar]
- Duttagupta, S.; Bhattacharya, A.; Mukherjee, A.; Chattopadhyay, S.; Bhanja, S.N.; Sarkar, S.; Malakar, P.; Bhattacharya, J. Groundwater Faecal Pollution observation in parts of Indo-Ganges–Brahmaputra river basin from in-situ measurements and satellite-based observations. J. Earth Syst. Sci. 2019, 128, 44. [Google Scholar] [CrossRef] [Green Version]
- Mukherjee, A.; Saha, D.; Harvey, C.F.; Taylor, R.G.; Ahmed, K.M.; Bhanja, S.N. Groundwater systems of the Indian sub-continent. J. Hydrol. Reg. Stud. 2015, 4, 1–14. [Google Scholar] [CrossRef] [Green Version]
- Mukherjee, A.; Babu, S.S.; Ghosh, S. Thinking about water and air to attain sustainable development goals during times of COVID-19 pandemic. J. Earth Syst. Sci. 2020, 129, 1–8. [Google Scholar] [CrossRef]
- Mukherjee, A. Changing the groundwater landscape of India: Implications to drinking water, food security, socio-economy and public health. Proc. Indian Natn. Sci. Acad. 2020, 86, 1295–1312. [Google Scholar] [CrossRef]
- Chakraborty, M.; Sarkar, S.; Mukherjee, A.; Shamsudduha, M.; Ahmed, K.M.; Bhattacharya, A.; Mitra, A. Modeling regional-scale groundwater arsenic hazard in the transboundary Ganges River Delta, India and Bangladesh: Infusing physically-based model with machine learning. Sci. Total Environ. 2020, 748, 141107. [Google Scholar] [CrossRef]
- Mukherjee, A. Groundwater of South Asia; Springer: New Delhi, India, 2018. [Google Scholar]
- West Bengal Central Pollution Control Board. Available online: http://www.wbpcb.gov.in (accessed on 22 July 2020).
- Roy, P.S.; Meiyappan, P.; Joshi, P.K.; Kale, M.P.; Srivastav, V.K.; Srivasatava, S.K.; Behera, M.D.; Roy, A.; Sharma, Y.; Ramachandran, R.M.; et al. Decadal Land Use and Land Cover Classifications across India, 1985, 1995, 2005; ORNL DAAC: Oak Ridge, TN, USA, 2016. [Google Scholar] [CrossRef]
- American Public Health Association; American Water Works Association; Water Environment Federation (Eds.) Standard Methods for the Examination of Water and Wastewater, 23rd ed.; Joint Editorial Board: Washington, DC, USA, 2017. [Google Scholar]
- Bihar State Pollution Control Board. Available online: http://www.bspcb.bih.nic.in (accessed on 6 October 2020).
- Tukey, J.W. Exploratory Data Analysis; Addison Wesley Publishing Company: Reading, MA, USA, 1977; Volume 2. [Google Scholar]
- Central Ground Water Board; Ministry of Water Resources; Government of India. Concept Note on Geogenic Contamination of Ground Water in India with Special Reference to Nitrate; Central Ground Water Board (CGWB): Faridabad, India, 2014; p. 99.
- Hastie, T.; Tibshirani, R.; Friedman, J. Random Forests. In The Elements of Statistical Learning; Springer: New York, NY, USA, 2009; pp. 587–604. [Google Scholar]
- Breiman, L. Random Forests. Mach. Learn. 2001, 45, 5–32. [Google Scholar] [CrossRef] [Green Version]
- Liaw, A.; Wiener, M. Classification and regression by randomForest. R News 2002, 2, 18–22. [Google Scholar]
- Mukherjee, A.; Sarkar, S.; Chakraborty, M.; Duttagupta, S.; Bhattacharya, A.; Saha, D.; Bhattacharya, P.; Mitra, A.; Gupta, S. Occurrence, predictors and hazards of elevated groundwater arsenic across India through field observations and regional-scale modeling. Sci. Total Environ. 2020, 759, 143511. [Google Scholar] [CrossRef]
- Breiman, L.; Friedman, J.; Stone, C.J.; Olshen, R.A. Classification and Regression Trees; CRC Press: Washington, DC, USA, 1984. [Google Scholar]
- Center for International Earth Science Information Network (CIESIN), Columbia University. 2018. Documentation for the Gridded Population of the World, Version 4, (GPWv4), Revision 11 Data Sets. Palisades NY: NASA Socioeconomic Data and Applications Center (SEDAC). Available online: https://0-doi-org.brum.beds.ac.uk/10.7927/H45Q4T5F (accessed on 11 October 2020).
- RStudio Team. RStudio: Integrated Development for R; RStudio, Inc.: Boston, MA, USA, 2015; Available online: http://www.rstudio.com (accessed on 19 November 2020).
- Kolde, R. Package ‘Pheatmap’. Available online: https://cran.r-project.org/web/packages/pheatmap/index.html (accessed on 7 December 2020).
- McMurdie, P.J.; Holmes, S. Phyloseq: An R package for reproducible interactive analysis and graphics of microbiome census data. PLoS ONE 2013, 8, e61217. [Google Scholar] [CrossRef] [Green Version]
- Borenstein, M.; Hedges, L.; Rothstein, H. Meta-Analysis: Fixed Effect vs. Random Effects. Available online: https://www.meta-analysis.com (accessed on 19 November 2020).
- Torres-Reyna, O. Panel Data Analysis Fixed and Random Effects Using Stata; Version 4.2; Data & Statistical Services; Priceton University: Princeton, NJ, USA, 2007; pp. 1–40. [Google Scholar]
- Datta, D.; Kaul, M. Arsenic Content of Drinking Water in Villages in Northern India. A Concept of Arsenicosis. J. Assoc. Phys. India 1976, 24, 599. [Google Scholar]
- Mulliick, J. Covid-19 Cases Spike in 6 States as Migrants Return. Hindustan Times, 10 June 2020; Retrieved on 27 July 2020. [Google Scholar]
- Kumar, A.; Kumar, M. Marginalised Migrants and Bihar as an Area of Origin. Kerala Exp. 2020, 55, 21. [Google Scholar]
- Zouch, H.; Cabrol, L.; Chifflet, S.; Tedetti, M.; Karray, F.; Zaghden, H.; Sayadi, S.; Quéméneur, M. Effect of Acidic Industrial Effluent Release on Microbial Diversity and Trace Metal Dynamics During Resuspension of Coastal Sediment. Front. Microbiol. 2018, 9, 3103. [Google Scholar] [CrossRef]
- Dutta, A.; Duttagupta, S.; Gupta, A.; Sarkar, J.; Roy, S.; Mukherjee, A.; Sar, P. Exploration of deep terrestrial subsurface microbiome in late cretaceous deccan traps and underlying archean basement, India. Sci. Rep. 2018, 8, 17459. [Google Scholar] [CrossRef]
- Sengupta, C.; Sukumaran, D.; Barui, D.; Saha, R.; Chattopadhyay, A.; Naskar, A.; Dave, S. Water health status in lower reaches of river Ganga, India. Appl. Ecol. Environ. Sci. 2014, 2, 20–24. [Google Scholar] [CrossRef] [Green Version]
- Hendry, G.; Janhurst, S.; Horsnell, G. Some effects of pulp and paper wastewater on microbiological water quality of a river. Water Res. 1982, 16, 1291–1295. [Google Scholar] [CrossRef]
- NamamiGange Program, Ministry of Jal Shakti, Department of Water Resources, River Development and Ganga Rejuvenation, Government of India. Available online: https://pib.gov.in/PressReleasePage.aspx?PRID=1683785 (accessed on 14 October 2020).
- Central Water Commission, Ministry of Jal Shakti, Govt. of India. Available online: http://cwc.gov.in/reservoir-storage (accessed on 14 October 2020).
- Alam, M.J.; Islam, M.; Muyen, Z.; Mamun, M.; Islam, S. Water Quality Parameters along Rivers. Int. J. Environ. Sci. Technol. 2007, 4, 159–167. [Google Scholar] [CrossRef] [Green Version]
- Duttagupta, S.; Mukherjee, A.; Bhattacharya, A.; Bhattacharya, J. Wide Exposure of Persistent Organic Pollutants (PoPs) in Natural Waters and Sediments of the Densely Populated Western Bengal Basin, India. Sci. Total Environ. 2020, 717, 137187. [Google Scholar] [CrossRef]
- ENVIS Centre on Hygiene, Sanitation, Sewage Treatment Systems and Technology, Ministry of Environment & Forest, Govt. of India. Available online: http://sulabhenvis.nic.in (accessed on 23 November 2020).
- Dutta, V.; Dubey, D.; Kumar, S. Cleaning the River Ganga: Impact of lockdown on water quality and future implications on river rejuvenation strategies. Sci. Total Environ. 2020, 743, 140756. [Google Scholar] [CrossRef]
- Häder, D.-P.; Banaszak, A.T.; Villafañe, V.E.; Narvarte, M.A.; González, R.A.; Helbling, E.W. Anthropogenic Pollution of Aquatic Ecosystems: Emerging Problems with Global Implications. Sci. Total Environ. 2020, 713, 136586. [Google Scholar] [CrossRef] [PubMed]
- Duttagupta, S.; Mukherjee, A.; Routh, J.; Devi, L.G.; Bhattacharya, A.; Bhattacharya, J. Role of Aquifer Media in Determining the Fate of Polycyclic Aromatic Hydrocarbons in the Natural Water and Sediments along the Lower Ganges River Basin. J. Environ. Sci. Health Part A 2020, 55, 354–373. [Google Scholar] [CrossRef] [PubMed]


| Parameter | During Lockdown (Average) |
|---|---|
| Faecal Coliform Most Probable Number (MPN/100 mL) | 5000 |
| Biochemical oxygen demand (BOD) | 1.6 |
| Chemical oxygen demand (COD) (mg/L) | 14.34 |
| pH | 8.34 |
| Total dissolved solids (TDS) (mg/L) | 212.4 |
| Sulphate (mg/L) | No Data |
| Phosphate (mg/L) | No Data |
| Nitrate (mg/L) | No Data |
| Parameter | During Lockdown (Average) |
|---|---|
| Faecal Coliform (MPON/100 mL) | 180,000 |
| BOD | 2.2 |
| COD (mg/L) | 8.25 |
| pH | 8.14 |
| TDS (mg/L) | 302.2 |
| Sulphate (mg/L) | 29.61 |
| Phosphate (mg/L) | 0.15 |
| Nitrate (mg/L) | 0.42 |
| Dependent Variable: FC ** | |
|---|---|
| Independent Variable | Fixed Effect |
| BOD | −0.02 |
| (−3.5) * | |
| COD | −0.003 |
| (−2.02) * | |
| pH | −0.05 |
| (−1.35) | |
| Sulphate | −0.03 |
| −2.32 | |
| Sulphate in Garden Reach | 0.05 |
| 3.41 | |
| Constant | −4.018 |
| (−20.32) * | |
| No. observation | 24 |
| r2 | 0.84 |
Publisher’s Note: MDPI stays neutral with regard to jurisdictional claims in published maps and institutional affiliations. |
© 2021 by the authors. Licensee MDPI, Basel, Switzerland. This article is an open access article distributed under the terms and conditions of the Creative Commons Attribution (CC BY) license (http://creativecommons.org/licenses/by/4.0/).
Share and Cite
Duttagupta, S.; Bhanja, S.N.; Dutta, A.; Sarkar, S.; Chakraborty, M.; Ghosh, A.; Mondal, D.; Mukherjee, A. Impact of Covid-19 Lockdown on Availability of Drinking Water in the Arsenic-Affected Ganges River Basin. Int. J. Environ. Res. Public Health 2021, 18, 2832. https://0-doi-org.brum.beds.ac.uk/10.3390/ijerph18062832
Duttagupta S, Bhanja SN, Dutta A, Sarkar S, Chakraborty M, Ghosh A, Mondal D, Mukherjee A. Impact of Covid-19 Lockdown on Availability of Drinking Water in the Arsenic-Affected Ganges River Basin. International Journal of Environmental Research and Public Health. 2021; 18(6):2832. https://0-doi-org.brum.beds.ac.uk/10.3390/ijerph18062832
Chicago/Turabian StyleDuttagupta, Srimanti, Soumendra N. Bhanja, Avishek Dutta, Soumyajit Sarkar, Madhumita Chakraborty, Ashok Ghosh, Debapriya Mondal, and Abhijit Mukherjee. 2021. "Impact of Covid-19 Lockdown on Availability of Drinking Water in the Arsenic-Affected Ganges River Basin" International Journal of Environmental Research and Public Health 18, no. 6: 2832. https://0-doi-org.brum.beds.ac.uk/10.3390/ijerph18062832