
Glycaemic Variability and Risk Factors of Pregnant Women with and without Gestational Diabetes Mellitus Measured by Continuous Glucose Monitoring

 ,
, 
 ,
,
Abstract
:1. Introduction
2. Materials and Methods
The Investigated CGM Parameters
- (1)
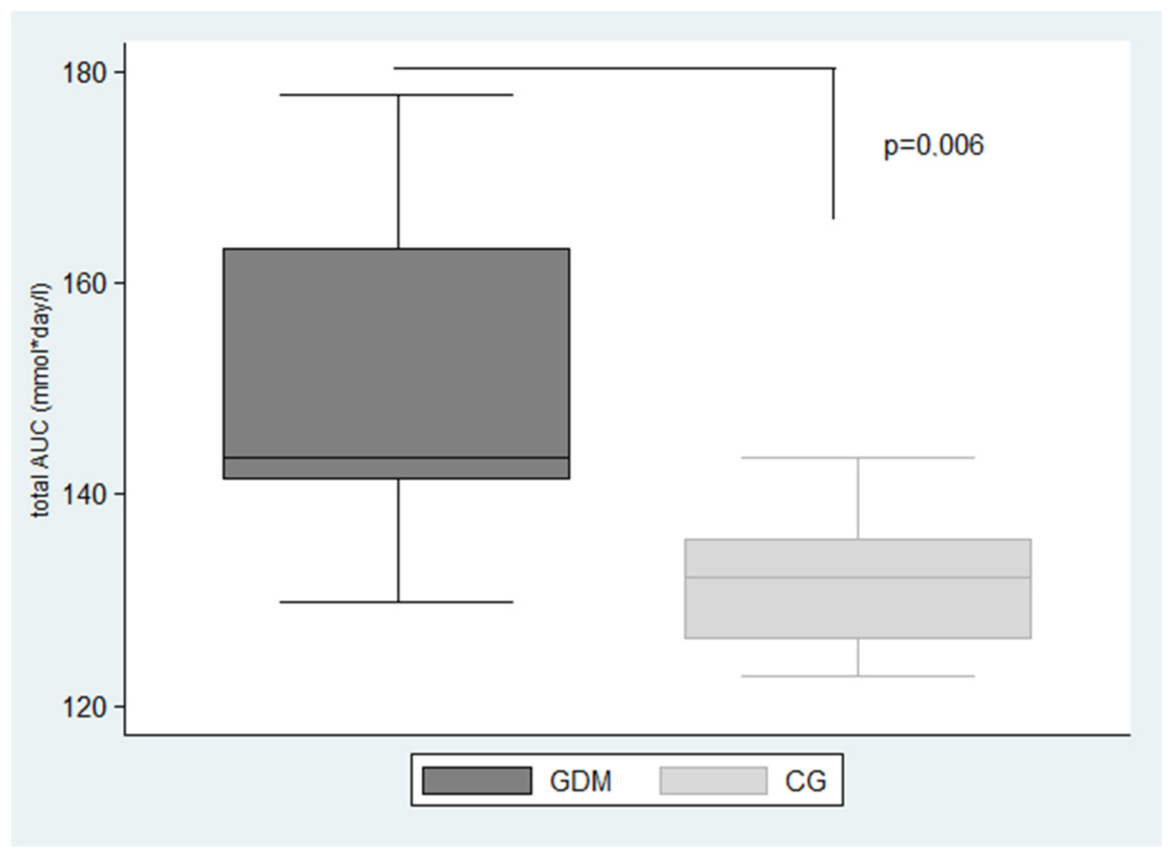
- The area under the interstitial glucose concentration curve (AUC) for the entire day (total AUC) in mmol·day/L, calculated by the expression Total AUC =
- (2)
- The hypoglycaemic area under the interstitial glucose concentration curve below 3.5 mmol/L normalized for a 24-h period (AUCbelow3.5) and hyperglycaemic area under the interstitial glucose concentration curve above 7.8 mmol/L normalized for a 24-h period (AUCabove7.8) in mmol·day/L.
- (3)
- The 7-day mean blood glucose levels and glucose standard deviation representing the most common CGM parameters of glucose compensation.
- (4)
- J-index, which is an alternative parameter of glucose control evaluation designed to stress the importance of the mean level of glycaemia and the GV [17]. The J-index equation is as follows:J-index = 0.001 × (mean + SD)2
- (5)
- The coefficient of variation (%CV) which is defined as the ratio of the SD to the mean glucose [18] and calculated by the formula:
- (6)
- %TIR, %TAR, %TBR. The target values of %TIR, %TAR and %TBR for GDM in pregnancy as determined by the international consensus are presented in Table 1.
3. Results
- (1)
- GDM: (GDM, n = 11) gestational week 29.1 ± 2.34, age 30.6 ± 4.76 years, HbA1c: 5.52 ± 0.34%, pre-pregnancy body mass index (BMI) 28.2 ± 3.13 kg/m2
- (2)
- CG: (CG, n = 9), gestational week 29.33 ± 3.0, age 29.6 ± 2.56 years, HbA1c: 5.25 ± 0.2%, pre-pregnancy BMI (kg/m2) 26.5 ± 3.42 kg/m2
4. Discussion
4.1. CGM/HbA1c in Pregnancy
4.2. CGM/SMBG in Pregnancy
4.3. Family History of Diabetes
4.4. Pre-Pregnancy BMI
4.5. Maternal Weight Gain
4.6. Maternal Age
5. Conclusions
Author Contributions
Funding
Institutional Review Board Statement
Informed Consent Statement
Data Availability Statement
Conflicts of Interest
References
- Kropff, J.; Bruttomesso, D. Accuracy Of Two Continuous Glucose Monitoring Systems: A Head-to-Head Comparison under Clinical Research Centre and Daily Life Conditions. Diabetes Obes. Metab. 2015, 17, 343–349. [Google Scholar] [CrossRef] [PubMed]
- Rodbard, D. Continuous Glucose Monitoring: A Review of Successes, Challenges, and Opportunities. Diabetes Technol. Ther. 2016, 18 (Suppl 2), S3–S13. [Google Scholar] [CrossRef] [PubMed] [Green Version]
- Yu, Q.; Aris, I.M.; Tan, K.H.; Li, L.J. Application and Utility of Continuous Glucose Monitoring in Pregnancy: A Systematic Review. Front. Endocrinol. (Lausanne) 2019, 10, 697. [Google Scholar] [CrossRef]
- Kautzky-Willer, A.; Harreiter, J.; Winhofer-Stockl, Y.; Bancher-Todesca, D.; Berger, A.; Repa, A.; Lechleitner, M.; Weitgasser, R. Gestational Diabetes Mellitus (Update 2019). Wien. Klin. Wochenschr. 2019, 131, 91–102. [Google Scholar] [CrossRef] [PubMed] [Green Version]
- Sawada, M.; Masuyama, H.; Hayata, K.; Kamada, Y.; Nakamura, K.; Hiramatsu, Y. Pregnancy Complications And Glucose Intolerance In Women With Polycystic Ovary Syndrome. Endocr. J. 2015, 62, 1017–1023. [Google Scholar] [CrossRef]
- Yu, H.F.; Chen, H.S.; Rao, D.P.; Gong, J. Association Between Polycystic Ovary Syndrome and the Risk of Pregnancy Complications: A Prisma-Compliant Systematic Review and Meta-Analysis. Medicine 2016, 95, E4863. [Google Scholar] [CrossRef]
- Gatti, M. Feasibility of Freestyle Libre Flash Glucose Monitoring System in Pregnant Woman Affected by Type 1 Diabetes. Acta Diabetol. 2019, 56, 481–483. [Google Scholar] [CrossRef]
- Tyndall, V.; Stimson, R.H.; Zammitt, N.N.; Ritchie, S.A.; Mcknight, J.A.; Dover, A.R.; Gibb, F.W. Marked Improvement in Hba1c Following Commencement of Flash Glucose Monitoring in People with Type 1 Diabetes. Diabetologia 2019, 62, 1349–1356. [Google Scholar] [CrossRef] [Green Version]
- Vlachova, Z.; Bytoft, B.; Knorr, S.; Clausen, T.D.; Jensen, R.B.; Mathiesen, E.R.; Hojlund, K.; Ovesen, P.; Beck-Nielsen, H.; Gravholt, C.H.; et al. Increased metabolic risk in adolescent offspring of mothers with type 1 diabetes: The Epicom Study. Diabetologia 2015, 58, 1454–1463. [Google Scholar] [CrossRef] [Green Version]
- Miao, M.; Dai, M.; Zhang, Y.; Sun, F.; Guo, X.; Sun, G. Influence of maternal overweight, obesity and gestational weight gain on the perinatal outcomes in women with gestational diabetes mellitus. Sci. Rep. 2017, 7, 305. [Google Scholar] [CrossRef] [PubMed]
- Law, G.R.; Ellison, G.T.; Secher, A.L.; Damm, P.; Mathiesen, E.R.; Temple, R.; Murphy, H.R.; Scott, E.M. Analysis of continuous glucose monitoring in pregnant women with diabetes: Distinct Temporal patterns of glucose associated with large-for-gestational-age infants. Diabetes Care 2015, 38, 1319–1325. [Google Scholar] [CrossRef] [Green Version]
- Danne, T.; Nimri, R.; Battelino, T.; Bergenstal, R.M.; Close, K.L.; Devries, J.H.; Garg, S.; Heinemann, L.; Hirsch, I.; Amiel, S.A.; et al. International Consensus On Use Of Continuous Glucose Monitoring. Diabetes Care 2017, 40, 1631–1640. [Google Scholar] [CrossRef] [PubMed] [Green Version]
- Kramer, G.; Michalak, L. Association between flash glucose monitoring and metabolic control as well as treatment satisfaction in outpatients with diabetes type 1. Exp. Clin. Endocrinol. Diabetes 2019, 127, 124. [Google Scholar] [CrossRef]
- Battelino, T.; Danne, T. Clinical Targets for Continuous Monitoring Data Interpretation: Recommendations from the international consensus on time in range. Diabetes Care 2019, 42, 1593–1603. [Google Scholar] [CrossRef] [Green Version]
- Diagnostika Diabetes Mellitus. Forum. Diab. 2018, 7, 15–17.
- Mastrototaro, J.J. The Minimed Continuous Glucose Monitoring System. Diabetes Technol. Ther. 2000, 2 (Suppl. 1), S13–S18. [Google Scholar] [CrossRef] [PubMed]
- Wojcicki, J.M. “J”-Index. A New proposition of the assessment of current glucose control in diabetic patients. Horm. Metab. Res. 1995, 27, 41–42. [Google Scholar] [CrossRef] [PubMed]
- Panyakat, W.S.; Phatihattakorn, C.; Sriwijitkamol, A.; Sunsaneevithayakul, P.; Phaophan, A.; Phichitkanka, A. Correlation between third trimester glycemic variability in non-insulin-dependent gestational diabetes mellitus and adverse pregnancy and fetal outcomes. J. Diabetes Sci. Technol. 2018, 12, 622–629. [Google Scholar] [CrossRef] [Green Version]
- Rayis, D.A.; Ahmed, A.B.A.; Sharif, M.E.; Elsouli, A.; Adam, I. Reliability of glycosylated hemoglobin in the diagnosis of gestational diabetes mellitus. J. Clin. Lab. Anal. 2020, 34, E23435. [Google Scholar] [CrossRef]
- Kwon, S.S.; Kwon, J.Y.; Park, Y.W.; Kim, Y.H.; Lim, J.B. Hba1c for diagnosis and prognosis of gestational diabetes mellitus. Diabetes Res. Clin. Pract. 2015, 110, 38–43. [Google Scholar] [CrossRef]
- Dubey, D.; Kunwar, S. Mid-Trimester Glycosylated Hemoglobin Levels (Hba1c) and its correlation with oral glucose tolerance test (World Health Organization 1999). J. Obstet. Gynaecol. Res. 2019, 45, 817–823. [Google Scholar] [CrossRef]
- Ryu, A.J.; Moon, H.J. The usefulness of the glycosylated hemoglobin level for the diagnosis of gestational diabetes mellitus in the korean population. Diabetes Metab. J. 2015, 39, 507–511. [Google Scholar] [CrossRef] [PubMed] [Green Version]
- Yu, W.; Wu, N.; Li, L.; Ouyang, H.; Qian, M.; Shen, H. A review of research progress on glycemic variability and gestational diabetes. Diabetes Metab. Syndr. Obes. 2020, 13, 2729–2741. [Google Scholar] [CrossRef]
- Vigersky, R.A.; Shin, J.; Jiang, B.; Siegmund, T.; Mcmahon, C.; Thomas, A. The Comprehensive Glucose Pentagon: A Glucose-Centric Composite Metric for Assessing Glycemic Control in Persons with Diabetes. J. Diabetes Sci. Technol. 2018, 12, 114–123. [Google Scholar] [CrossRef]
- Zaharieva, D.P.; Teng, J.H.; Ong, M.L.; Lee, M.H.; Paldus, B.; Jackson, L.; Houlihan, C.; Shub, A.; Tipnis, S.; Cohen, O.; et al. Continuous Glucose Monitoring Versus Self-Monitoring of blood glucose to assess glycemia in gestational diabetes. Diabetes Technol. Ther. 2020, 22, 822–827. [Google Scholar] [CrossRef] [PubMed]
- Irving, R.R.; Mills, J.L.; Choo-Kang, E.G.; Morrison, E.Y.; Kulkarni, S.; Wright-Pascoe, R.; Mclaughlin, W. The Burden of Gestational Diabetes Mellitus in Jamaican Women with a Family History of Autosomal Dominant Type 2 Diabetes. Rev. Panam. Salud Publica 2008, 23, 85–91. [Google Scholar] [CrossRef] [PubMed] [Green Version]
- Barros, G.M.; Figueiredo, L.D.S.; Souza, P.A.; Souza, B.; Ferreira, H.C.; Cavalcanti, A.C.D. Risk Factors For Constant Glycemic Variability In Pregnant Women: A Case-Control Study. Rev. Bras. Enferm. 2020, 73 (Suppl. 5), E20180983. [Google Scholar] [CrossRef] [PubMed]
- Heerman, W.J.; Bian, A.; Shintani, A.; Barkin, S.L. Interaction Between Maternal Prepregnancy Body Mass Index And Gestational Weight Gain Shapes Infant Growth. Acad. Pediatrics 2014, 14, 463–470. [Google Scholar] [CrossRef] [Green Version]
- Ranheim, T.; Haugen, F. Adiponectin is reduced in gestational diabetes mellitus in normal weight women. Acta Obstet. Gynecol. Scand. 2004, 83, 341–347. [Google Scholar] [CrossRef] [PubMed]
- Saisho, Y.; Miyakoshi, K.; Ikenoue, S.; Kasuga, Y.; Matsumoto, T.; Minegishi, K.; Yoshimura, Y.; Itoh, H. Marked Decline In Beta Cell Function During Pregnancy Leads To The Development Of Glucose Intolerance In Japanese Women. Endocr. J. 2013, 60, 533–539. [Google Scholar] [CrossRef] [Green Version]
- Cyganek, K.; Hebda-Szydlo, A.; Skupien, J.; Katra, B.; Janas, I.; Borodako, A.; Kaim, I.; Klupa, T.; Reron, A.; Malecki, M.T. Glycemic control and pregnancy outcomes in women with type 2 diabetes from Poland. The impact of pregnancy planning and a comparison with Type 1 Diabetes Subjects. Endocrine 2011, 40, 243–249. [Google Scholar] [CrossRef] [PubMed]
- Persson, M.; Pasupathy, D.; Hanson, U.; Norman, M. Birth Size Distribution in 3,705 Infants Born to Mothers with Type 1 Diabetes: A Population-Based Study. Diabetes Care 2011, 34, 1145–1149. [Google Scholar] [CrossRef] [PubMed] [Green Version]
- Scifres, C.M.; Feghali, M.N.; Althouse, A.D.; Caritis, S.N.; Catov, J.M. Effect of Excess Gestational Weight Gain on Pregnancy Outcomes in Women with Type 1 Diabetes. Obstet. Gynecol. 2014, 123, 1295–1302. [Google Scholar] [CrossRef] [PubMed]
- Rajab, K.E.; Issa, A.A.; Hasan, Z.A.; Rajab, E.; Jaradat, A.A. Incidence of Gestational Diabetes Mellitus in Bahrain from 2002 to 2010. Int. J. Gynaecol. Obstet. Off. Organ. Int. Fed. Gynaecol. Obstet. 2012, 117, 74–77. [Google Scholar] [CrossRef]
- Somani, B.; Arora, M.; Bhatia, K.; Arora, D.; Banerjee, M. A Comparative Study of the Different Diagnostic Criteria of Gestational Diabetes Mellitus and its Incidence. Med. J. Armed Forces India 2012, 68, 6–11. [Google Scholar] [CrossRef] [Green Version]
- Hedderson, M.M.; Gunderson, E.P.; Ferrara, A. Gestational Weight Gain and Risk of Gestational Diabetes Mellitus. Obstet. Gynecol. 2010, 115, 597–604. [Google Scholar] [CrossRef] [Green Version]


| Diabetes Group | TIR | TAR | TBR |
|---|---|---|---|
| GDM | % of time in target range *: 3.5–7.8 mmol/L | <5% of time above target level 7.8 mmol/L | <4% of time below target level 3.5 mmol/L |
| <1% of time below target level 3.0 mmol/L |
| Baseline Characteristics (n = 20) | GDM (n = 11) | CG (n = 9) | p |
|---|---|---|---|
| Age (years) | 30.63 ± 4.76 | 29.56 ± 2.56 | 0.44 |
| Family history of diabetes (%) | 90.90 | 33.30 | 0.009 ** |
| Pre-pregnancy BMI (kg/m2) | 25.4 ± 3.6 | 23.3 ± 3.9 | 0.31 |
| Weight gain (kg) | 9.8 ± 3.37 | 9.12 ± 3.34 | 0.52 |
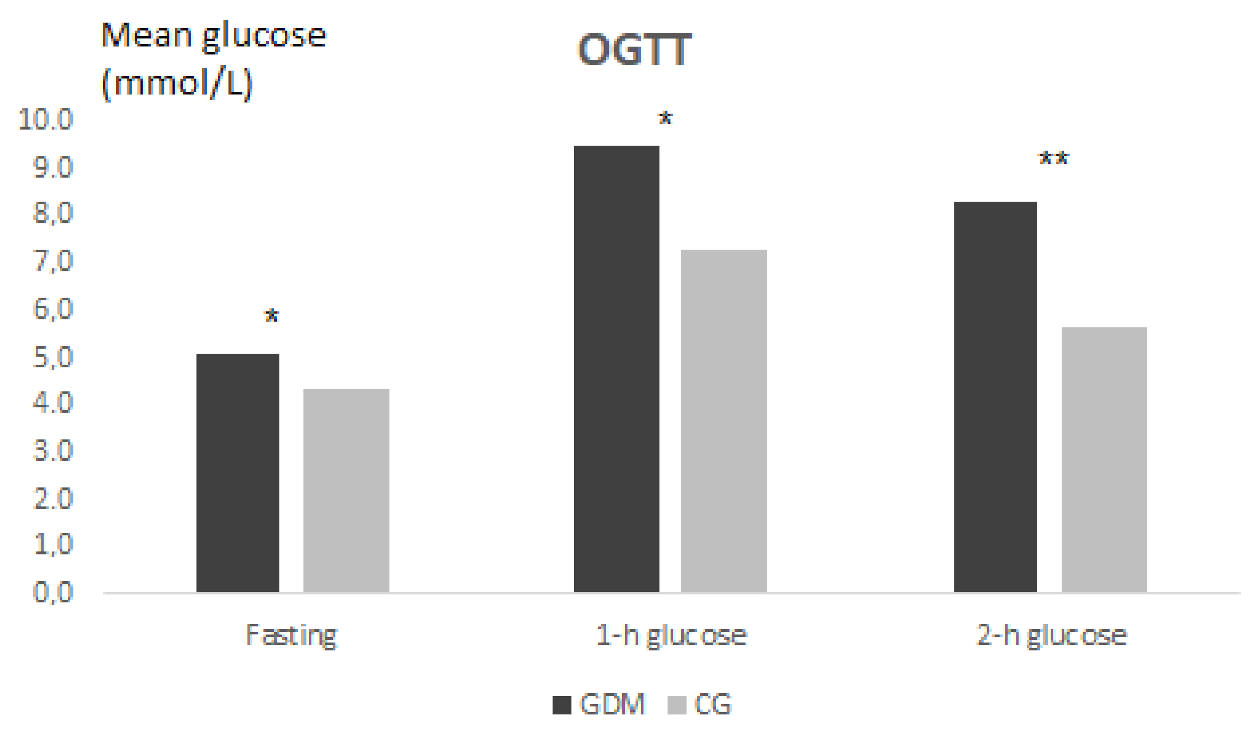
| FPG from OGTT (mmol/L) | 5.04 ± 0.69 | 4.32 ± 0.44 | 0.03 * |
| 1 h glucose (mmol/L) | 9.46 ± 1.74 | 7.27 ± 0.55 | 0.002 ** |
| 2 h glucose (mmol/L) | 8.25 ± 1.01 | 5.63 ± 0.56 | 0.0003 *** |
| C-peptide (ng/mL) | 1.47 ± 0.5 | 1.67 ± 0.8 | 0.97 |
| HbA1c NGSP ± SD NGSP (%) | 5.52 ± 0.34 | 5.25 ± 0.2 | 0.09 |
| CGM Indicators | GDM (n = 11) | CG (n = 9) | p |
|---|---|---|---|
| Gestational Age at CGM (week) | 29.1 ± 2.34 | 29.33 ± 3.0 | 0.62 |
| Mean glucose from sensor (mmol/L) | 5.66 ± 0.58 | 5.46 ± 0.64 | 0.40 |
| SD (mmol/L) | 1.11 ± 0.36 | 0.81 ± 0.23 | 0.56 |
| CV (%) | 19.7 ± 6.43 | 15.04 ± 4.51 | 0.84 |
| %TIR | 94.63 ± 5.85 | 98.17 ± 1.72 | 0.08 |
| %TAR | 5.36 ± 5.85 | 1.67 ± 1.75 | 0.07 |
| %TBR | 0 | 0.11 | 0.27 |
| J-index | 0.046 ± 0.01 | 0.039 ± 0.01 | 0.14 |
| Total AUC (mmol·day/L) ** | 149.41 ± 14.82 | 132.03 ± 6.93 | 0.0062 ** |
| AUCabove7.8 (mmol·day/L) | 0.079 ± 0.11 | 0.015 ± 0.035 | 0.10 |
| AUCbelow3.5 (mmol·day/L) | 0 | 0 | 0 |
| Risk Factor | GV | p |
|---|---|---|
| Family history of diabetes | Total AUC (mmol·day/L) FPG from OGTT (mmol/L) | 0.019 * 0.035 * |
| Pre-pregnancy BMI (kg/m2) | %TAR | 0.054 |
| Weight gain (kg) | %CV | 0.030 * |
| Age (years) | %TIR %TAR AUC above 7.8 mmol/L (mmol·day/L) | 0.003 ** 0.003 ** 0.042 * 0.005 ** |
Publisher’s Note: MDPI stays neutral with regard to jurisdictional claims in published maps and institutional affiliations. |
© 2021 by the authors. Licensee MDPI, Basel, Switzerland. This article is an open access article distributed under the terms and conditions of the Creative Commons Attribution (CC BY) license (http://creativecommons.org/licenses/by/4.0/).
Share and Cite
Gáborová, M.; Doničová, V.; Bačová, I.; Pallayová, M.; Bona, M.; Peregrim, I.; Grešová, S.; Štimmelová, J.; Dzugasová, B.; Šalamonová Blichová, L.; et al. Glycaemic Variability and Risk Factors of Pregnant Women with and without Gestational Diabetes Mellitus Measured by Continuous Glucose Monitoring. Int. J. Environ. Res. Public Health 2021, 18, 3402. https://0-doi-org.brum.beds.ac.uk/10.3390/ijerph18073402
Gáborová M, Doničová V, Bačová I, Pallayová M, Bona M, Peregrim I, Grešová S, Štimmelová J, Dzugasová B, Šalamonová Blichová L, et al. Glycaemic Variability and Risk Factors of Pregnant Women with and without Gestational Diabetes Mellitus Measured by Continuous Glucose Monitoring. International Journal of Environmental Research and Public Health. 2021; 18(7):3402. https://0-doi-org.brum.beds.ac.uk/10.3390/ijerph18073402
Chicago/Turabian StyleGáborová, Martina, Viera Doničová, Ivana Bačová, Mária Pallayová, Martin Bona, Igor Peregrim, Soňa Grešová, Judita Štimmelová, Barbora Dzugasová, Lenka Šalamonová Blichová, and et al. 2021. "Glycaemic Variability and Risk Factors of Pregnant Women with and without Gestational Diabetes Mellitus Measured by Continuous Glucose Monitoring" International Journal of Environmental Research and Public Health 18, no. 7: 3402. https://0-doi-org.brum.beds.ac.uk/10.3390/ijerph18073402