
Subjective versus Objective Measure of Physical Activity: A Systematic Review and Meta-Analysis of the Convergent Validity of the Physical Activity Questionnaire for Children (PAQ-C)

 ,
,  ,
,  ,
, 
Abstract
:1. Introduction
2. Materials and Methods
2.1. Eligibility Criteria
2.2. Article Selection
2.3. Study Quality Assessment
2.4. Meta-Analyses
3. Results
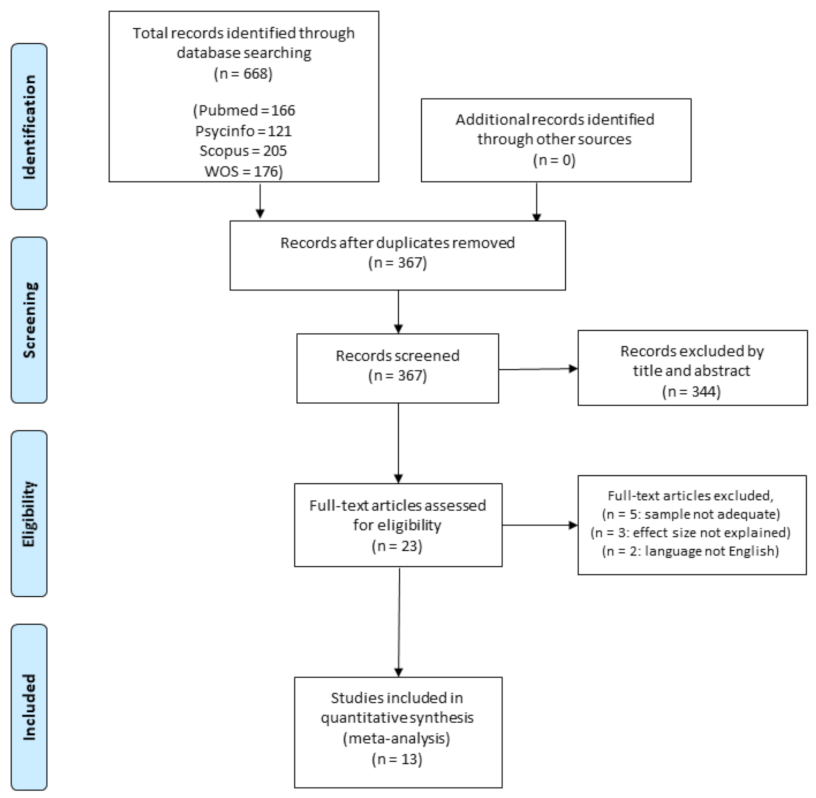
3.1. Studies Systematically Identified
3.2. Study Description
3.3. Study Quality
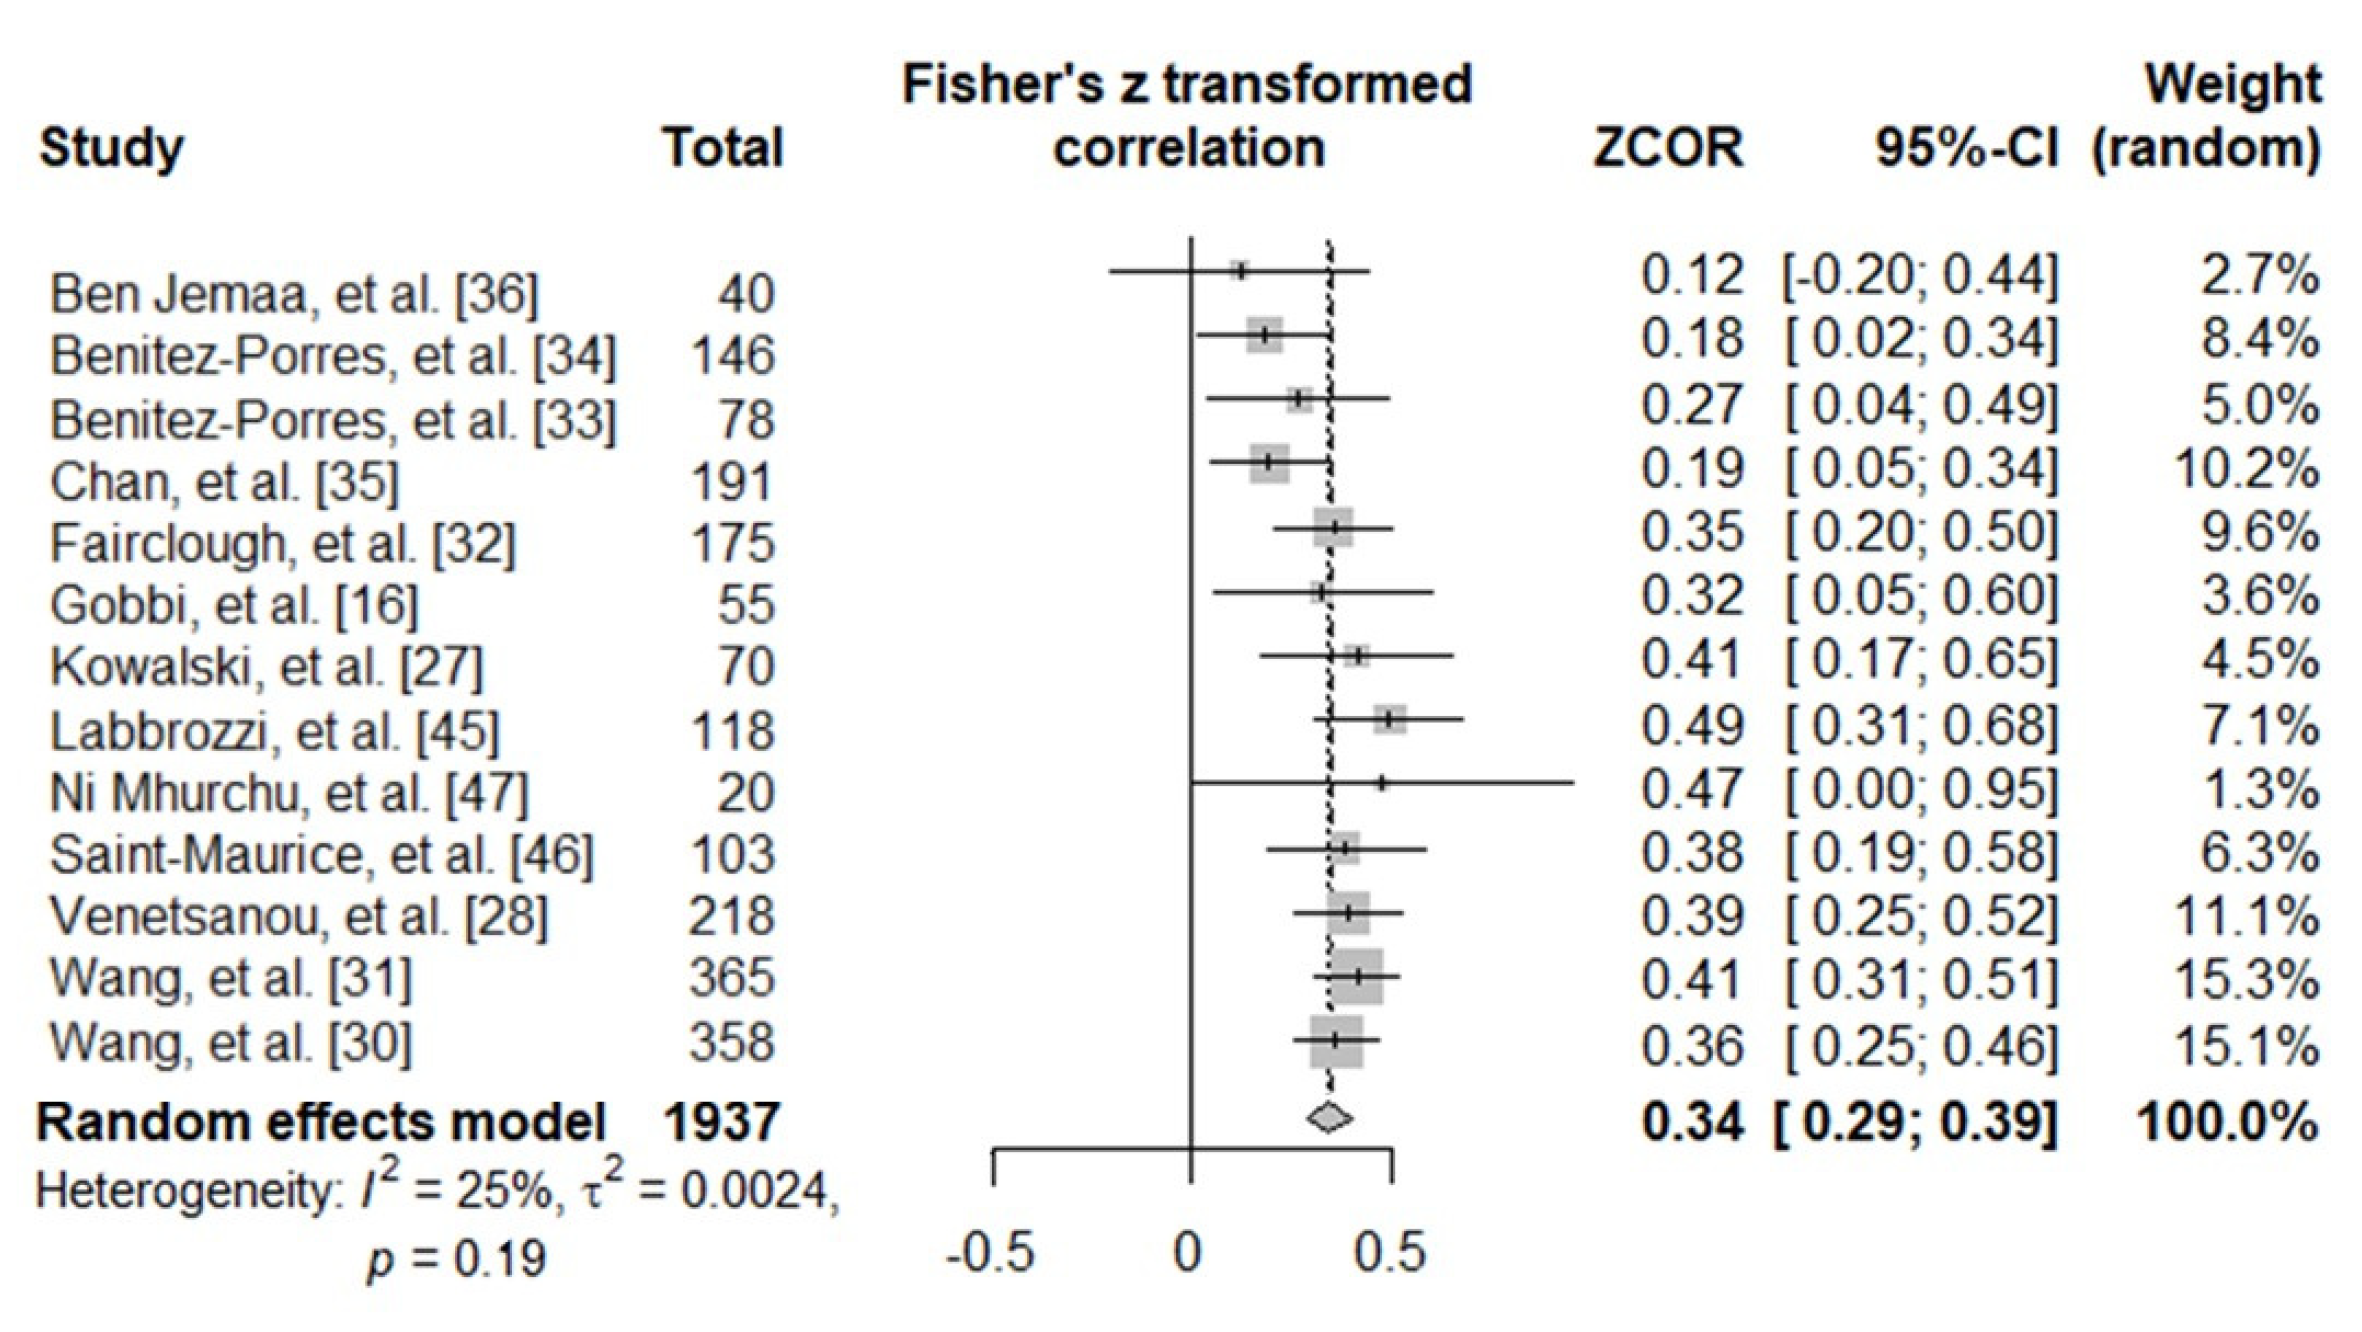
3.4. Meta-Analyses
4. Discussion
5. Conclusions
Author Contributions
Funding
Institutional Review Board Statement
Informed Consent Statement
Conflicts of Interest
References
- World Health Organization WHO. Guidelines on Physical Activity and Sedentary Behaviour: Web Annex Evidence Profiles. Available online: https://apps.who.int/iris/bitstream/handle/10665/336656/9789240015128-eng.pdf (accessed on 28 November 2020).
- Hong, I.; Coker-Bolt, P.; Anderson, K.R.; Lee, D.; Velozo, C.A. Relationship Between Physical Activity and Overweight and Obesity in Children: Findings from the 2012 National Health and Nutrition Examination Survey National Youth Fitness Survey. Am. J. Occup. Ther. 2016, 70, 70051800601. [Google Scholar] [CrossRef] [Green Version]
- Pedersen, B.K.; Saltin, B. Exercise as medicine—Evidence for prescribing exercise as therapy in 26 different chronic diseases. Scand. J. Med. Sci. Sports 2015, 25 (Suppl. S3), 1–72. [Google Scholar] [CrossRef] [Green Version]
- Rush, E.; Simmons, D. Physical Activity in Children: Prevention of Obesity and Type 2 Diabetes. Pediatr. Fitness 2014, 60, 113–121. [Google Scholar] [CrossRef]
- Sheikholeslami, S.; Ghanbarian, A.; Azizi, F. The Impact of Physical Activity on Non-Communicable Diseases: Findings from 20 Years of the Tehran Lipid and Glucose Study. Int. J. Endocrinol. Metab. 2018, 16 (Suppl. 4), e84740. [Google Scholar] [CrossRef] [Green Version]
- Rodriguez-Ayllon, M.; Cadenas-Sánchez, C.; Estévez-López, F.; Muñoz, N.E.; Mora-Gonzalez, J.; Migueles, J.H.; Molina-García, P.; Henriksson, H.; Mena-Molina, A.; Martínez-Vizcaíno, V.; et al. Role of Physical Activity and Sedentary Behavior in the Mental Health of Preschoolers, Children and Adolescents: A Systematic Review and Meta-Analysis. Sports Med. 2019, 49, 1383–1410. [Google Scholar] [CrossRef] [PubMed]
- Marker, A.M.; Steele, R.G.; Noser, A.E. Physical activity and health-related quality of life in children and adolescents: A systematic review and meta-analysis. Health Psychol. 2018, 37, 893–903. [Google Scholar] [CrossRef]
- Pälve, K.S.; Pahkala, K.; Magnussen, C.G.; Koivistoinen, T.; Juonala, M.; Kähönen, M.; Lehtimäki, T.; Rönnemaa, T.; Viikari, J.S.A.; Raitakari, O.T. Association of Physical Activity in Childhood and Early Adulthood with Carotid Artery Elasticity 21 Years Later: The Cardiovascular Risk in Young Finns Study. J. Am. Heart Assoc. 2014, 3, e000594. [Google Scholar] [CrossRef] [Green Version]
- Magnussen, C.G.; Koskinen, J.; Chen, W.; Thomson, R.; Schmidt, M.D.; Srinivasan, S.R.; Kivimäki, M.; Mattsson, N.; Kähönen, M.; Laitinen, T. Pediatric Metabolic Syndrome Predicts Adulthood Metabolic Syndrome, Subclinical Atherosclerosis and Type 2 Diabetes Mellitus but is no Better than Body Mass Index Alone: The Bogalusa Heart Study and the Cardiovascular Risk in Young Finns Study. Circulation 2010, 122, 1604–1611. [Google Scholar] [CrossRef] [PubMed]
- Steene-Johannessen, J.; Hansen, B.H.; Dalene, K.E.; Kolle, E.; Northstone, K.; Møller, N.C.; Grøntved, A.; Wedderkopp, N.; Kriemler, S.; Page, A.S.; et al. Variations in accelerometry measured physical activity and sedentary time across Europe—Harmonized analyses of 47,497 children and adolescents. Int. J. Behav. Nutr. Phys. Act. 2020, 17, 1–14. [Google Scholar] [CrossRef] [PubMed] [Green Version]
- World Health Organization WHO. Europe Publications-Physical Activity Strategy for the WHO European Region 2016–2025. Available online: https://www.euro.who.int/en/publications/abstracts/physical-activity-strategy-for-the-who-european-region-2016–2025 (accessed on 6 November 2020).
- World Health Organization Global Action Plan on Physical Activity 2018–2030: More Active People for a Healthier World. Available online: http://www.who.int/ncds/prevention/physical-activity/gappa/action-plan (accessed on 29 November 2020).
- Colley, R.C.; Garriguet, D.; Adamo, K.B.; Carson, V.; Janssen, I.; Timmons, B.W.; Tremblay, M.S. Physical activity and sedentary behavior during the early years in Canada: A cross-sectional study. Int. J. Behav. Nutr. Phys. Act. 2013, 10, 54. [Google Scholar] [CrossRef] [PubMed] [Green Version]
- Ding, D.; Mutrie, N.; Bauman, A.; Pratt, M.; Hallal, P.R.C.; Powell, K.E. Physical activity guidelines 2020: Comprehensive and inclusive recommendations to activate populations. Lancet 2020, 396, 1780–1782. [Google Scholar] [CrossRef]
- Prince, S.A.; Adamo, K.B.; Hamel, M.E.; Hardt, J.; Gorber, S.C.; Tremblay, M. A comparison of direct versus self-report measures for assessing physical activity in adults: A systematic review. Int. J. Behav. Nutr. Phys. Act. 2008, 5, 1–24. [Google Scholar] [CrossRef] [PubMed] [Green Version]
- Gobbi, E.; Elliot, C.; Varnier, M.; Carraro, A. Psychometric Properties of the Physical Activity Questionnaire for Older Children in Italy: Testing the Validity among a General and Clinical Pediatric Population. PLoS ONE 2016, 11, e0156354. [Google Scholar] [CrossRef]
- Skender, S.; Ose, J.; Chang-Claude, J.; Paskow, M.; Brühmann, B.; Siegel, E.M.; Steindorf, K.; Ulrich, C.M. Accelerometry and physical activity questionnaires—A systematic review. BMC Public Health 2016, 16, 1–10. [Google Scholar] [CrossRef] [PubMed] [Green Version]
- Chinapaw, M.J.; Mokkink, L.B.; Van Poppel, M.N.M.; Van Mechelen, W.; Terwee, C.B.; Chinapaw, M.J.M. Physical Activity Questionnaires for Youth. Sports Med. 2010, 40, 539–563. [Google Scholar] [CrossRef]
- Sabia, S.; Van Hees, V.T.; Shipley, M.J.; Trenell, M.I.; Hagger-Johnson, G.; Elbaz, A.; Kivimaki, M.; Singh-Manoux, A. Association Between Questionnaire and Accelerometer-Assessed Physical Activity: The Role of Sociodemographic Factors. Am. J. Epidemiol. 2014, 179, 781–790. [Google Scholar] [CrossRef] [PubMed]
- Janz, K.; Lutuchy, E.; Wenthe, P.; Levy, S. Measuring Activity in Children and Adolescents using Self-Report: PAQ-C and PAQ-A. Med. Sci. Sports Exerc. 2008, 40, 767–772. [Google Scholar] [CrossRef] [PubMed]
- Helmerhorst, H.J.F.; Brage, S.; Warren, J.; Besson, H.; Ekelund, U. A systematic review of reliability and objective criterion-related validity of physical activity questionnaires. Int. J. Behav. Nutr. Phys. Act. 2012, 9, 103. [Google Scholar] [CrossRef] [Green Version]
- Hidding, L.M.; Chinapaw, M.J.M.; Van Poppel, M.N.M.; Mokkink, L.B.; Altenburg, T.M. An Updated Systematic Review of Childhood Physical Activity Questionnaires. Sports Med. 2018, 48, 2797–2842. [Google Scholar] [CrossRef] [Green Version]
- Crocker, P.R.E.; Bailey, D.A.; Faulkner, R.A.; Kowalski, K.C.; McGrath, R. Measuring general levels of physical activity: Preliminary evidence for the Physical Activity Questionnaire for Older Children. Med. Sci. Sports Exerc. 1997, 29, 1344–1349. [Google Scholar] [CrossRef]
- Kowalski, K.; Crocker, P.; Donen, R.; Honours, B. The Physical Activity Questionnaire for Older Children (PAQ-C) and Adolescents (PAQ-A) Manual; College of Kinesiology, University of Saskatchewan: Saskatoon, SK, Canada, 2004. [Google Scholar]
- Thomas, E.L.; Upton, D. Psychometric properties of the physical activity questionnaire for older children (PAQ-C) in the UK. Psychol. Sport Exerc. 2014, 15, 280–287. [Google Scholar] [CrossRef]
- Voss, C.; Harris, K.C. Physical activity evaluation in children with congenital heart disease. Heart 2017, 103, 1408–1412. [Google Scholar] [CrossRef]
- Kowalski, K.C.; Crocker, P.R.; Faulkner, R.A. Validation of the Physical Activity Questionnaire for Older Children. Pediatr. Exerc. Sci. 1997, 9, 174–186. [Google Scholar] [CrossRef] [Green Version]
- Venetsanou, F.; Emmanouilidou, K.; Soutos, K.; Sotiriou, S.A.; Bastida, L.; Moya, A.; Kambas, A. Towards a Functional Approach to the Assessment of Daily Life Physical Activity in Children: Are the PAQ-C and Fitbit Flex-2 Technically Adequate? Int. J. Environ. Res. Public Health 2020, 17, 8503. [Google Scholar] [CrossRef] [PubMed]
- Bervoets, L.; Van Noten, C.; Van Roosbroeck, S.; Hansen, D.; Van Hoorenbeeck, K.; Verheyen, E.; Van Hal, G.; Vankerckhoven, V. Reliability and Validity of the Dutch Physical Activity Questionnaires for Children (PAQ-C) and Adolescents (PAQ-A). Arch. Public Health 2014, 72, 1–7. [Google Scholar] [CrossRef] [PubMed] [Green Version]
- Wang, J.J.; Baranowski, T.; Lau, W.P.; Chen, T.A.; Pitkethly, A.J. Validation of the Physical Activity Questionnaire for Older Children (PAQ-C) among Chinese Children. Biomed. Environ. Sci. 2016, 29, 177–186. [Google Scholar] [PubMed]
- Wang, J.-J.; Baranowski, T.; Lau, P.W.C.; Chen, T.-A.; Zhang, S.-G. Psychological Correlates of Self-Reported and Objectively Measured Physical Activity among Chinese Children—Psychological Correlates of PA. Int. J. Environ. Res. Public Health 2016, 13, 1006. [Google Scholar] [CrossRef] [PubMed] [Green Version]
- Fairclough, S.J.; Boddy, L.M.; Ridgers, N.D.; Stratton, G.; Cumming, S. Biological maturity and primary school children’s physical activity: Influence of different physical activity assessment instruments. Eur. J. Sport Sci. 2011, 11, 241–248. [Google Scholar] [CrossRef]
- Benítez-Porres, J.; López-Fernández, I.; Raya, J.F.; Carnero, S.Á.; Alvero-Cruz, J.R.; Carnero, E. Álvarez Reliability and Validity of the PAQ-C Questionnaire to Assess Physical Activity in Children. J. Sch. Health 2016, 86, 677–685. [Google Scholar] [CrossRef]
- Benítez-Porres, J.; Alvero-Cruz, J.R.; Sardinha, L.B.; López-Fernández, I.; Carnero, E.A. Cut-off Values for Classifying Active Children and Adolescents using the Physical Activity Questionnaire: PAQ-C and PAQ-A. Nutr. Hosp. 2016, 33, 1036–1044. [Google Scholar] [CrossRef]
- Chan, C.H.S.; Ha, A.S.C.; Ng, J.Y.Y.; Lubans, D.R. Associations between fundamental movement skill competence, physical activity and psycho-social determinants in Hong Kong Chinese children. J. Sports Sci. 2018, 37, 229–236. [Google Scholar] [CrossRef]
- Ben Jemaa, H.; Mankaï, A.; Mahjoub, F.; Kortobi, B.; Khlifi, S.; Draoui, J.; Minaoui, R.; Karmous, I.; Ben Hmad, H.; Ben Slama, F.; et al. Physical Activity Level Assessed by Accelerometer and PAQ-C in Tunisian Children. Ann. Nutr. Metab. 2018, 73, 234–240. [Google Scholar] [CrossRef]
- Kim, Y.; Park, I.; Kang, M. Convergent validity of the International Physical Activity Questionnaire (IPAQ): Meta-analysis. Public Health Nutr. 2012, 16, 440–452. [Google Scholar] [CrossRef] [Green Version]
- Adamo, K.B.; Prince, S.A.; Tricco, A.C.; Connor-Gorber, S.; Tremblay, M. A comparison of indirect versus direct measures for assessing physical activity in the pediatric population: A systematic review. Pediatr. Obes. 2009, 4, 2–27. [Google Scholar] [CrossRef] [PubMed]
- Vandenbroucke, J.P.; Von Elm, E.; Altman, D.G.; Gøtzsche, P.C.; Mulrow, C.D.; Pocock, S.J.; Poole, C.; Schlesselman, J.J.; Egger, M.; Initiative, F.T.S. Strengthening the Reporting of Observational Studies in Epidemiology (STROBE): Explanation and Elaboration. PLoS Med. 2007, 4, e297–e835. [Google Scholar] [CrossRef] [Green Version]
- Rupinski, M.T.; Dunlap, W.P. Approximating Pearson Product-Moment Correlations from Kendall’s Tau and Spearman’s Rho. Educ. Psychol. Meas. 1996, 56, 419–429. [Google Scholar] [CrossRef]
- Higgins, J.P.T.; Thompson, S.G.; Deeks, J.J.; Altman, D.G. Measuring inconsistency in meta-analyses. BMJ 2003, 327, 557–560. [Google Scholar] [CrossRef] [Green Version]
- Balduzzi, S.; Rücker, G.; Schwarzer, G. How to perform a meta-analysis with R: A practical tutorial. Évid. Based Ment. Health 2019, 22, 153–160. [Google Scholar] [CrossRef] [Green Version]
- Borenstein, M.; Hedges, L.V.; Higgins, J.P.T.; Rothstein, H.R. Introduction to Meta-Analysis; John Wiley & Sons: Hoboken, NJ, USA, 2009; p. 452. [Google Scholar]
- Cohen, J. A power primer. Tutor. Quant. Methods Psychol. 2007, 3, 79. [Google Scholar] [CrossRef] [Green Version]
- Labbrozzi, D.; Bucci, I.; Bortoli, L.; Bertollo, M.; Doria, C.; Robazza, C. Age-Related Differences in Actual and Perceived Levels of Physical Activity in Adolescent Girls. Percept. Mot. Ski. 2012, 114, 723–734. [Google Scholar] [CrossRef]
- Saint-Maurice, P.F.; Welk, G.J.; Beyler, N.K.; Bartee, R.T.A.; Heelan, K. Calibration of self-report tools for physical activity research: The Physical Activity Questionnaire (PAQ). BMC Public Health 2014, 14, 461. [Google Scholar] [CrossRef] [PubMed] [Green Version]
- Ni Mhurchu, C.; Maddison, R.; Jiang, Y.; Jull, A.; Prapavessis, H.; Rodgers, A. Couch potatoes to jumping beans: A pilot study of the effect of active video games on physical activity in children. Int. J. Behav. Nutr. Phys. Act. 2008, 5, 8. [Google Scholar] [CrossRef] [PubMed] [Green Version]
- Terwee, C.B.; Mokkink, L.B.; Van Poppel, M.N.; Chinapaw, M.J.; Van Mechelen, W.; De Vet, H.C. Qualitative Attributes and Measurement Properties of Physical Activity Questionnaires. Sports Med. 2010, 40, 525–537. [Google Scholar] [CrossRef] [PubMed]
- Lee, P.H.; Macfarlane, D.J.; Lam, T.H.; Stewart, S.M. Validity of the international physical activity questionnaire short form (IPAQ-SF): A systematic review. Int. J. Behav. Nutr. Phys. Act. 2011, 8, 115. [Google Scholar] [CrossRef] [PubMed] [Green Version]
- Evenson, K.R.; Catellier, D.J.; Gill, K.; Ondrak, K.S.; McMurray, R.G. Calibration of two objective measures of physical activity for children. J. Sports Sci. 2008, 26, 1557–1565. [Google Scholar] [CrossRef]
- Aibar, A.E.; Bois, J.; Zaragoza, J.; Generelo, E.A.; Julián, J.; Paillard, T. Do epoch lengths affect adolescent’s compliance with physical activity guidelines? J. Sports Med. Phys. Fit. 2014, 54, 326–334. [Google Scholar]
- Banda, J.A.; Haydel, K.F.; Davila, T.; Desai, M.; Bryson, S.; Haskell, W.L.; Matheson, D.; Robinson, T.N. Effects of Varying Epoch Lengths, Wear Time Algorithms, and Activity Cut-Points on Estimates of Child Sedentary Behavior and Physical Activity from Accelerometer Data. PLoS ONE 2016, 11, e0150534. [Google Scholar] [CrossRef] [Green Version]
- Trost, S.G.; Loprinzi, P.D.; Moore, R.; Pfeiffer, K.A. Comparison of Accelerometer Cut Points for Predicting Activity Intensity in Youth. Med. Sci. Sports Exerc. 2011, 43, 1360–1368. [Google Scholar] [CrossRef]
- Troiano, R.P.; McClain, J.J.; Brychta, R.J.; Chen, K.Y. Evolution of accelerometer methods for physical activity research. Br. J. Sports Med. 2014, 48, 1019–1023. [Google Scholar] [CrossRef] [Green Version]
- Rosenberger, M.E.; Haskell, W.L.; Albinali, F.; Mota, S.; Nawyn, J.; Intille, S. Estimating Activity and Sedentary Behavior from an Accelerometer on the Hip or Wrist. Med. Sci. Sports Exerc. 2013, 45, 964–975. [Google Scholar] [CrossRef] [Green Version]
- García-Prieto, J.C.; Martinez-Vizcaino, V.; García-Hermoso, A.; Sánchez-López, M.; Arias-Palencia, N.; Fonseca, J.F.O.; Mora-Rodriguez, R. Energy Expenditure in Playground Games in Primary School Children Measured by Accelerometer and Heart Rate Monitors. Int. J. Sport Nutr. Exerc. Metab. 2017, 27, 467–474. [Google Scholar] [CrossRef] [PubMed]
- Terrier, P.; Aminian, K.; Schutz, Y. Can accelerometry accurately predict the energy cost of uphill/downhill walking? Ergonomics 2001, 44, 48–62. [Google Scholar] [CrossRef] [PubMed]
- Ayabe, M.; Kumahara, H.; Morimura, K.; Tanaka, H. Epoch length and the physical activity bout analysis: An accelerometry research issue. BMC Res. Notes 2013, 6, 20. [Google Scholar] [CrossRef] [PubMed] [Green Version]
- Crocker, P.R.; Eklund, R.C.; Kowalski, K.C. Children’s physical activity and physical self-perceptions. J. Sports Sci. 2000, 18, 383–394. [Google Scholar] [CrossRef]


| Study Information | Study Population | Accelerometer Information | Outcomes | ||||||||||||
|---|---|---|---|---|---|---|---|---|---|---|---|---|---|---|---|
| Authors | Location | Years | Sample Size | Mean Age (Range) | Gender (% Girls) | Model (Axis) | Placement | N Days (Weekend) | Epoch Length (s) | Outcomes | Cut-Point PA Intensity Level (Non-Wearing Definition) | h/Day | PAQ-C (Points) | MVPA (min/Day) | r |
| Ben Jemaa et al. [36] | Tunisia | 2018 | 40 | 9.34 ± 0.94 (8–11) | 47.5% | ActiGraph GT3X + (triaxial) | hip | 4 (1) | 15 | ST, LPA, MPA VPA, MVPA | Evenson et al. (≥60 min) | ≥6 | 2.55 ± 0.67 | 59.77 ± 22.01 | 0.119 |
| Benitez-Porres et al. [34] | Spain | 2016 | 146 | 10.8 ± 1.3 (9–12) | 43.1% | ActiGraph GT3X (triaxial) | hip | 7 (1) | 1 | MVPA step/day | Evenson et al. (≥60 min) | ≥10 (week) ≥8 (WE) | 3.09 ± 0.64 | 62.80 ± 13.90 | 0.170 ¥ |
| Benitez-Porres et al. [33] | Spain | 2016 | 78 | 10.98 ± 1.17 (9–12) | 46.1% | ActiGraph GT3X (triaxial) | hip | 7 (1) | 1 | MVPA | Evenson et al. (≥60 min) | ≥10 (week) ≥8 (WE) | 3.24 ± 0.64 | 63.22 ± 14.40 | 0.248 ¥ |
| Chan et al. [35] | China | 2018 | 191 | 9.9 ± 1.0 (8–11) | 59,7% | ActiGraph GT3X + (triaxial) | hip | 7 (1) | 15 | MVPA | Evenson et al. (≥20 min) | ≥6 | 2.67 ± 0.70 | 40.86 ± 14.07 | 0.190 |
| Fairclough et al. [32] | England | 2011 | 175 | 10.6 ± 0.3 (10–11) | 55.4% | ActiGraph GT1M (uniaxial) | hip | 5 (1) | 5 | MPA, VPA, MVPA, counts/min | Ekelund et al. (≥20 min) | ≥6 (week) ≥6 (WE) | 3.39 ± 0.13 (M) 3.00 ± 0.11 (F) | 66.30 ± 3.70 (M) 54.10 ± 3.20 (F) | 0.338 φ |
| Gobbi et al. [16] | Italy | 2016 | 55 | 9.5 ± 0.4 (9–10) | 50.9% | ActiGraph GT3X + (triaxial) | hip | 7 (n.r.) | 15 | MVPA | Evenson et al. (≥60 min) | ≥9 | 2.79 ± 0.52 | n.r. | 0.300 ¥ |
| Kowalski et al. [27] | Canada | 1997 | 70 | 11.30 ± 1.39 (9–13) | n.r. | Caltrac (uniaxial) | hip | 7 (1) | n.r. | MVPAMVPA > 10min | n.r.(n.r.) | n.r. | 3.32 ± 0.68 | n.r. | 0.390 |
| Labbrozzi et al. [45] | Italy | 2012 | 118 | n.r. (11–13) | 100% | COSMED Lifecorder (uniaxial) | hip | n.r. | 4 | LPA, MPA, VPA | Kumahara et al. (n.r.) | n.r. | n.r. | n.r. | 0.456 φ |
| Ni Mhurchu et al. [47] | New Zealand | 2008 | 20 | 12 ± 1.5 (10–14) | 40% | ActiGraph 7164 (uniaxial) | hip | 4 (2) | n.r. | PA counts, LPA, MPA, VPA | Freedson et al. (≥20 min) | ≥8 | 1.8 ± 0.6 | n.r. | 0.440 φ |
| Saint-Maurice et al. [46] | USA | 2014 | 103 | 10.8 ± 2.0 (8–13) | 52.4% | ActiGraph GT1M (uniaxial) | hip | 7 (1) | 30 | MVPA | Freedson et al. (≥90 min) | ≥9 | 3.1 ± 0.7 | n.r. | 0.350 |
| Venetsanou et al. [28] | Greece | 2020 | 218 | 10.99 ± 1.52 (9–13) | 56.9% | ActiGraph GT3X + (triaxial) | hip | 7 (1) | 5 | MVPA, steps/day | Evenson et al. (n.r) | n.r. | 2.70 ± 0.55 (M) φ 2.51 ± 0.53 (F) | 42.46 ± 12.46 (M) φ 31.70 ± 9.21 (F) | 0.354 ¥ |
| 2.78 ± 0.37 (M) 2.35 ± 0.47 (F) | 40.33 ± 11.95 (M) 33.31 ± 8.41 (F) | ||||||||||||||
| Wang et al. [31] | China | 2016 | 365 | 10.2 ± 1.1 (8–13) | 45.2% | ActiGraph GT3X (triaxial) | hip | 7 (1) | 5 | MVPA | Evenson et al. (≥20 min) | ≥8 | 2.70 ± 0.70 | 43.10 ± 12.74 | 0.390 |
| Wang et al. [30] | China | 2016 | 358 | 10.5 ± 1.1 (9–12) | 45.8% | ActiGraph GT3X (triaxial) | hip | 7 (1) | 5 | MPA, VPA, MVPA | Evenson et al. (≥20 min) | ≥8 | 2.60 ± 0.68 | 43.00 ± 13.72 | 0.330 ¥ |
| 1# | 2# | 3# | 4# | 5# | 6# | 7# | 8# | 9# | 10# | 11# | 12# | 13# | 14# | 15# | 16# | 17# | 18# | 19# | Score/19 | |
|---|---|---|---|---|---|---|---|---|---|---|---|---|---|---|---|---|---|---|---|---|
| Ben Jemaa et al. [36] | 1 | 1 | 1 | 1 | 1 | 0 | 1 | 1 | 0 | 1 | 1 | 0 | 1 | 1 | 0 | 1 | 1 | 1 | 0 | 14 |
| Benitez-Porres et al. [34] | 1 | 1 | 1 | 1 | 1 | 0 | 1 | 1 | 0 | 1 | 1 | 1 | 1 | 1 | 0 | 1 | 1 | 1 | 0 | 15 |
| Benitez-Porres et al. [33] | 1 | 1 | 1 | 1 | 1 | 0 | 1 | 1 | 1 | 1 | 1 | 1 | 1 | 1 | 1 | 1 | 1 | 1 | 0 | 17 |
| Chan et al. [35] | 1 | 1 | 1 | 1 | 1 | 1 | 0 | 1 | 0 | 1 | 1 | 1 | 1 | 1 | 0 | 1 | 1 | 1 | 1 | 16 |
| Fairclough et al. [32] | 1 | 1 | 1 | 1 | 0 | 1 | 1 | 1 | 0 | 1 | 1 | 1 | 1 | 1 | 0 | 1 | 1 | 1 | 1 | 16 |
| Gobbi et al. [16] | 1 | 1 | 1 | 1 | 0 | 0 | 1 | 1 | 0 | 1 | 1 | 1 | 1 | 1 | 0 | 1 | 0 | 1 | 1 | 15 |
| Kowalski et al. [27] | 1 | 1 | 1 | 1 | 1 | 0 | 0 | 0 | 0 | 0 | 0 | 1 | 1 | 1 | 0 | 1 | 1 | 1 | 1 | 12 |
| Labbrozzi et al. [45] | 1 | 1 | 1 | 1 | 1 | 1 | 1 | 1 | 0 | 1 | 1 | 0 | 1 | 1 | 0 | 1 | 1 | 1 | 1 | 16 |
| Ni Mhurchu et al. [47] | 1 | 1 | 1 | 1 | 1 | 1 | 1 | 0 | 0 | 1 | 1 | 1 | 1 | 1 | 1 | 1 | 0 | 0 | 0 | 14 |
| Saint-Maurice et al. [46] | 1 | 1 | 1 | 1 | 0 | 0 | 1 | 1 | 0 | 1 | 1 | 0 | 1 | 1 | 0 | 1 | 1 | 1 | 1 | 14 |
| Venetsanou et al. [28] | 1 | 1 | 1 | 1 | 1 | 1 | 1 | 1 | 0 | 1 | 1 | 1 | 1 | 1 | 0 | 1 | 0 | 1 | 1 | 16 |
| Wang et al. [31] | 1 | 1 | 1 | 1 | 1 | 0 | 1 | 1 | 0 | 1 | 1 | 1 | 1 | 1 | 0 | 1 | 1 | 1 | 1 | 16 |
| Wang et al. [30] | 1 | 1 | 1 | 1 | 0 | 1 | 1 | 1 | 0 | 1 | 1 | 1 | 1 | 1 | 0 | 1 | 1 | 1 | 1 | 16 |
Publisher’s Note: MDPI stays neutral with regard to jurisdictional claims in published maps and institutional affiliations. |
© 2021 by the authors. Licensee MDPI, Basel, Switzerland. This article is an open access article distributed under the terms and conditions of the Creative Commons Attribution (CC BY) license (http://creativecommons.org/licenses/by/4.0/).
Share and Cite
Marasso, D.; Lupo, C.; Collura, S.; Rainoldi, A.; Brustio, P.R. Subjective versus Objective Measure of Physical Activity: A Systematic Review and Meta-Analysis of the Convergent Validity of the Physical Activity Questionnaire for Children (PAQ-C). Int. J. Environ. Res. Public Health 2021, 18, 3413. https://0-doi-org.brum.beds.ac.uk/10.3390/ijerph18073413
Marasso D, Lupo C, Collura S, Rainoldi A, Brustio PR. Subjective versus Objective Measure of Physical Activity: A Systematic Review and Meta-Analysis of the Convergent Validity of the Physical Activity Questionnaire for Children (PAQ-C). International Journal of Environmental Research and Public Health. 2021; 18(7):3413. https://0-doi-org.brum.beds.ac.uk/10.3390/ijerph18073413
Chicago/Turabian StyleMarasso, Danilo, Corrado Lupo, Simone Collura, Alberto Rainoldi, and Paolo Riccardo Brustio. 2021. "Subjective versus Objective Measure of Physical Activity: A Systematic Review and Meta-Analysis of the Convergent Validity of the Physical Activity Questionnaire for Children (PAQ-C)" International Journal of Environmental Research and Public Health 18, no. 7: 3413. https://0-doi-org.brum.beds.ac.uk/10.3390/ijerph18073413