
Normative Data of Objectively Measured Physical Activity and Sedentary Time in Community—Dwelling Older Japanese


Abstract
:1. Introduction
2. Subjects and Methods
2.1. Study Subjects
2.2. Physical Activity and Sedentary Behavior Measures
2.3. Other Measures
2.4. Statistical Analyses
3. Results
3.1. Population
3.2. PA and ST
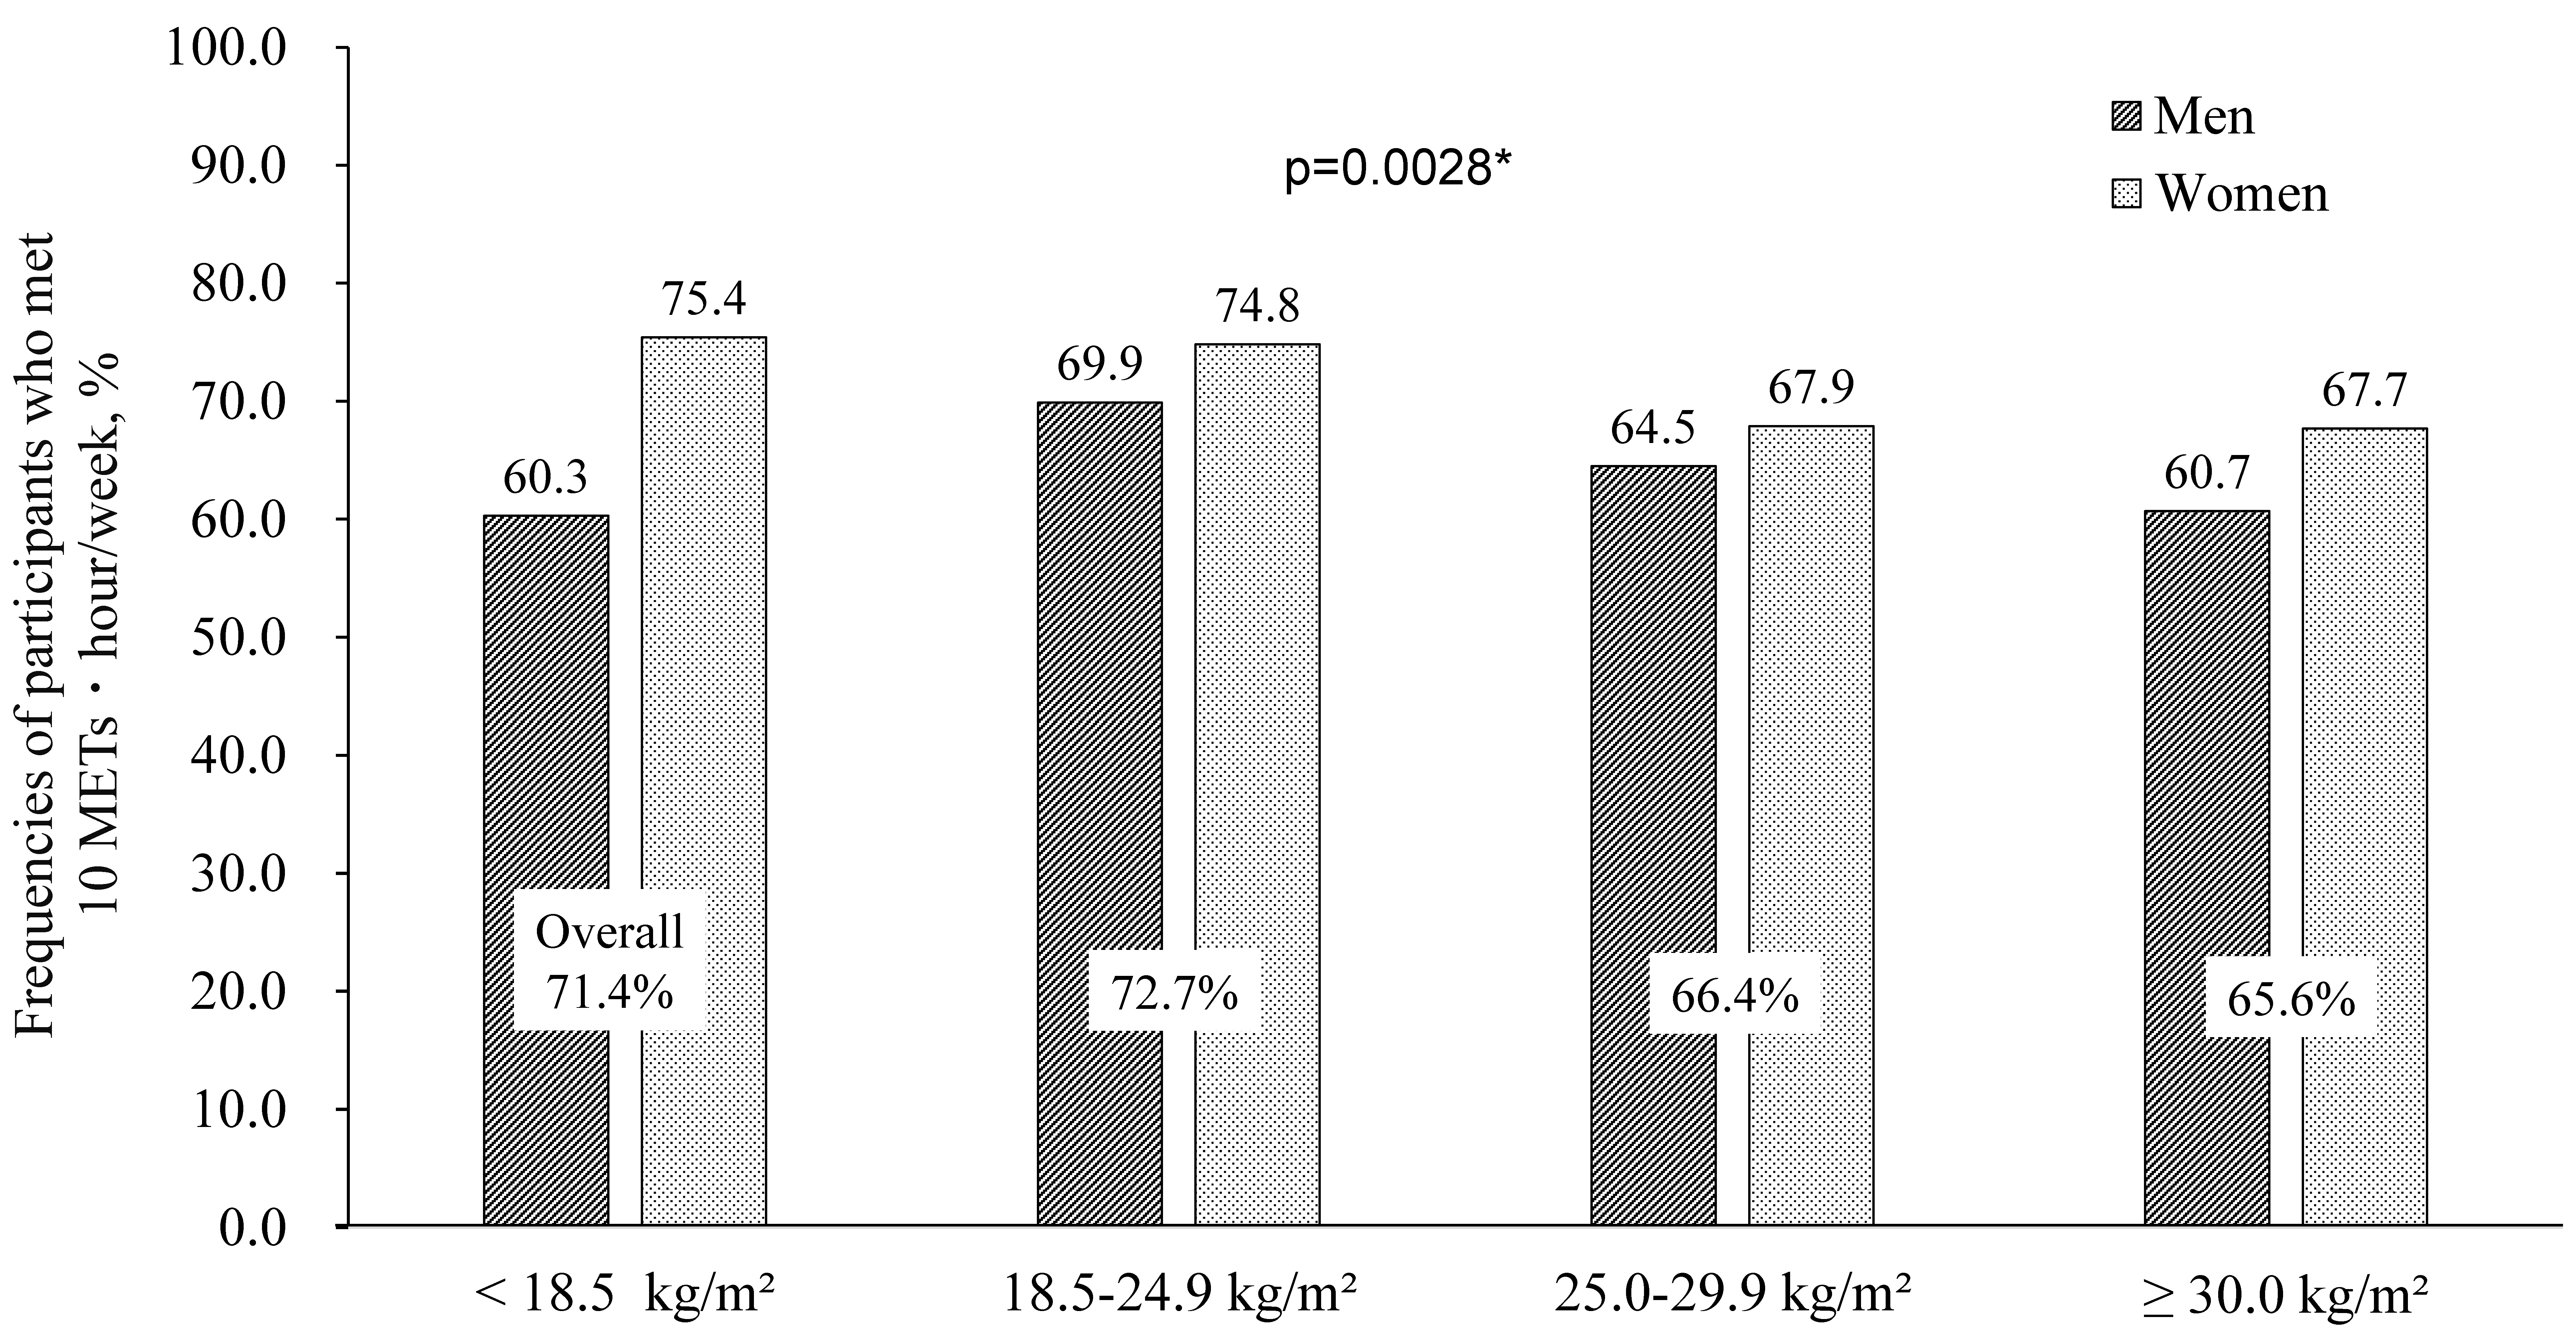
3.3. PA Guideline Adherence
3.4. Associations
4. Discussion
4.1. PA and ST
4.2. PA Guideline Adherence
4.3. Study Strengths and Limitations
5. Conclusions
Author Contributions
Funding
Institutional Review Board Statement
Informed Consent Statement
Data Availability Statement
Acknowledgments
Conflicts of Interest
References
- Caspersen, C.J.; Powell, K.E.; Christenson, G.M. Physical activity, exercise, and physical fitness. Definitions and distinctions for Health-related research. Public Health Rep. 1985, 100, 126–131. [Google Scholar]
- Nelson, M.E.; Rejeski, W.J.; Blair, S.N.; Duncan, P.W.; Judge, J.O.; King, A.C.; Macera, C.A.; Castaneda-Sceppa, C. Physical activity and public health in older adults: Recommendation from the American College of Sports Medicine and the American Heart Association. Med. Sci. Sports Exerc. 2007, 39, 1435–1945. [Google Scholar] [CrossRef] [Green Version]
- Morgan, G.S.; Gallacherb, J.; Bayerc, A.; Fishd, M.; Ebrahime, S.; Ben-Shlomoa, Y. Physical activity in middle-age and dementia in later life: Findings from a prospective cohort of men in Caerphilly, South Wales and a meta-analysis. J. Alzheimers Dis. 2012, 31, 569–580. [Google Scholar] [CrossRef] [Green Version]
- Paterson, D.H.; Warburton, D.E.R. Review Physical activity and functional limitations in older adults: A systematic review related to Canada’s physical activity guidelines. Int. J. Behav. Nutr. Phys. Act. 2010, 7, 38. [Google Scholar] [CrossRef] [Green Version]
- Keysor, J.J. Does late-life physical activity or exercise prevent or minimize disablement: A critical review of the scientific evidence. Am. J. Prev. Med. 2003, 25, 129–136. [Google Scholar] [CrossRef]
- Japanese Physical Activity Guidelines for Health 2013. Available online: https://www.mhlw.go.jp/stf/houdou/2r9852000002xple-att/2r9852000002xpqt.pdf (accessed on 3 April 2020). (In Japanese).
- Gregg, E.W.; Cauley, J.A.; Seeley, D.G.; Ensrud, K.E.; Bauer, D.C. Physical activity and osteoporotic fracture risk in older women, study of osteoporotic fractures research group. Ann. Intern. Med. 1998, 129, 81–88. [Google Scholar] [CrossRef]
- Heesch, K.C.; Miller, Y.D.; Brown, W.J. Relationship between physical activity and stiff or painful joints in mid-aged women and older women: A 3-year prospective study. Arthritis. Res. Ther. 2007, 9, R34. [Google Scholar] [CrossRef] [PubMed] [Green Version]
- Ravaglia, G.; Forti, P.; Lucicesare, A.; Pisacane, N.; Rietti, E.; Bianchin, M.; Dalmonte, E. Physical activity and dementia risk in the elderly: Findings from a prospective Italian study. Neurology 2008, 70, 1786–1794. [Google Scholar] [CrossRef] [PubMed]
- Smith, T.L.; Masaki, K.H.; Fong, K.; Abbott, R.D.; Ross, G.W.; Petrovitch, H.; Blanchette, P.L.; White, L.R. Effect of walking distance on 8-year incident depressive symptoms in elderly men with and without chronic disease: The Honolulu-Asia Aging Study. J. Am. Geriatr. Soc. 2010, 58, 1447–1452. [Google Scholar] [CrossRef] [PubMed]
- Chen, T.; Narazaki, K.; Honda, T.; Chen, S.; Haeuchi, Y.; Nofuji, Y.Y.; Matsuo, E.; Kumagai, S. Tri-Axial Accelerometer-Determined Daily Physical Activity and Sedentary Behavior of Suburban Community-Dwelling Older Japanese Adults. J. Sports Sci. Med. 2015, 14, 507–514. [Google Scholar] [PubMed]
- Chen, T.; Kishimoto, H.; Honda, T.; Hata, J.; Yoshida, D.; Mukai, N.; Shibata, M.; Ninomiya, T.; Kumagai, S. Patterns and Levels of Sedentary Behavior and Physical Activity in a General Japanese Population: The Hisayama Study. J. Epidemiol. 2018, 28, 260–265. [Google Scholar] [CrossRef] [PubMed] [Green Version]
- Amagasa, S.; Fukushima, N.; Kikuchi, H.; Takamiya, T.; Oka, K.; Inoue, S. Light and sporadic physical activity overlooked by current guidelines makes older women more active than older men. Int. J. Behav. Nutr. Phys. Act. 2019, 14, 59. [Google Scholar] [CrossRef] [PubMed] [Green Version]
- Saito, T.; Sakita, M.; Kumagai, S. Combination risk to chronic low back pain of physical activity and sedentary behaviour. JPFSM 2015, 64, 435–442. [Google Scholar]
- Chen, S.; Chen, T.; Kishimoto, H.; Yatsugi, H.; Kumagai, S. Associations of objectively measured patterns of sedentary behavior and physical activity with frailty status screened by the FRAIL scale in Japanese community dwelling older adults. J. Sports Sci. Med. 2020, 19, 166–174. [Google Scholar]
- Ohkawara, K.; Oshima, Y.; Hikihara, Y.; Ishikawa-Takata, K.; Tabata, I.; Tanaka, S. Real-time estimation of daily physical activity intensity by a triaxial accelerometer and a gravity-removal classification algorithm. Br. J. Nutr. 2011, 105, 1681–1691. [Google Scholar] [CrossRef] [PubMed]
- Oshima, Y.; Kawaguchi, K.; Tanaka, S.; Ohkawara, K.; Hikihara, Y.; Ishikawa-Takata, K.; Tabata, I. Classifying household and locomotive activities using a triaxial accelerometer. Gait Posture 2010, 31, 370–374. [Google Scholar] [CrossRef]
- Honda, T.; Chen, S.; Kishimoto, H.; Narazaki, K.; Kumagai, S. Identifying associations between sedentary time and cardio-metabolic risk factors in working adults using objective and subjective measures: A cross-sectional analysis. BMC Public Health 2014, 14, 1307. [Google Scholar] [CrossRef] [PubMed] [Green Version]
- Chen, T.; Narazaki, K.; Haeuchi, Y.; Chen, S.; Honda, T.; Kumagai, S. Associations of sedentary time and breaks in sedentary time with disability in instrumental activities of daily living in community-dwelling older adults. J. Phys. Act. Health. 2016, 13, 303–309. [Google Scholar] [CrossRef]
- Trost, S.G.; McIver, K.L.; Pate, R.R. Conducting accelerometer-based activity assessments in field-based research. Med. Sci. Sports Exerc. 2005, 37, S531–S543. [Google Scholar] [CrossRef]
- Healthy Japan 21, 2nd ed. Available online: https://www.mhlw.go.jp/bunya/kenkou/dl/kenkounippon21_02.pdf (accessed on 3 April 2020). (In Japanese).
- Park, H.; Park, S.; Shephard, R.J.; Aoyagi, Y. Yearlong physical activity and sarcopenia in older adults: The Nakanojo Study. Eur. J. Appl. Physiol. 2010, 109, 953–961. [Google Scholar] [CrossRef]
- Berkemeyer, K.; Wijndaele, K.; White, T.; Cooper, A.J.M.; Luben, R.; Westgate, K.; Griffin, S.J.; Khaw, K.T.; Wareham, N.J.; Brage, S. The descriptive epidemiology of accelerometer-measured physical activity in older adults. Int. J. Behav. Nutr. Phys. Act. 2016, 13, 2. [Google Scholar] [CrossRef] [PubMed] [Green Version]
- Tucker, J.M.; Welk, G.J.; Beyler, N.K. Physical Activity in U.S. Adults Compliance with the Physical Activity Guidelines for Americans. Am. J. Prev. Med. 2011, 40, 454–461. [Google Scholar] [CrossRef] [PubMed]
- American College of Sports Medicine. American College of Sports Medicine Position Stand. Exercise and Physical Activity for Older Adults. Med. Sci. Sports Exerc. 2009, 41, 1510–1530. [Google Scholar] [CrossRef]
- Wang, J.; Lin, W.; Chang, L. The relationships between retirement, social capital, and self-perceived health. Gerontologist 2010, 50, 346–347. [Google Scholar]
- Yonemoto, K.; Honda, T.; Kishimoto, H.; Yoshida, D.; Hata, J.; Mukai, N.; Shibata, M.; Hirakawa, Y.; Ninomiya, T.; Kumagai, S. Longitudinal changes of physical activity and sedentary time in the middle-aged and older Japanese population: The Hisayama Study. JPAH 2019, 16, 165–171. [Google Scholar] [CrossRef] [PubMed]
- Awick, E.A.; Ehlers, D.K.; Aguiñaga, S.; Daugherty, A.M.; Kramer, A.F.; McAuley, E. Effects of a randomized exercise trial on physical activity, psychological distress and quality of life in older adults. Gen. Hosp. Psychiatry 2017, 49, 44–50. [Google Scholar] [CrossRef] [PubMed]
- Nagayoshi, S.; Oshima, Y.; Ando, T.; Aoyama, T.; Nakae, S.; Usui, C.; Kumagai, S.; Tanaka, S. Validity of estimating physical activity intensity using a triaxial accelerometer in healthy adults and older adults. BMJ Open Sport Exer. Med 2019, 5, e000592. [Google Scholar] [CrossRef] [PubMed]


| Overall (n = 1671) | Age Categories, yrs | ||||||
|---|---|---|---|---|---|---|---|
| 65–69 (n = 625) | 70–74 (n = 526) | 75–79 (n = 323) | 80–84 (n = 137) | ≥85 (n = 60) | p for Trend | ||
| Steps: | |||||||
| Mean (SD) | 5701 (3398) | 6542 (3681) | 5701 (2990) | 5250 (3127) | 4041 (2965) | 3156 (2963) | |
| Median | 5186 | 5943 | 5454 | 4672 | 3295 | 2519 | |
| AWT, min/day: | |||||||
| Mean (SD) | 811.8 (94.2) | 818.3 (98.5) | 809.4 (87.3) | 807.7 (92.0) | 809.6 (101.7) | 793.7 (98.6) | |
| Median | 802.8 | 814.4 | 800.4 | 798.1 | 802.7 | 778.0 | |
| MVPA, min/day: | |||||||
| Mean (SD) | 46.1 (34.0) | 55.1 (36.4) | 47.2 (31.3) | 39.8 (31.5) | 26.8 (25.2) | 21.5 (23.3) | <0.0001 |
| Median | 39.6 | 48.8 | 40.6 | 32.3 | 18.0 | 13.9 | |
| decile p10 | 9.5 | 15.9 | 12.9 | 6.5 | 4.4 | 2.0 | |
| decile p20 | 16.9 | 25.7 | 19.4 | 13.1 | 7.3 | 3.3 | |
| decile p30 | 24.3 | 34.6 | 25.1 | 19.8 | 9.7 | 7.2 | |
| decile p40 | 32.5 | 41.6 | 34.4 | 26.2 | 13.5 | 10.9 | |
| decile p60 | 48.1 | 57.7 | 49.4 | 39.5 | 25.9 | 16.5 | |
| decile p70 | 57.9 | 66.4 | 59.7 | 50.3 | 35.8 | 25.9 | |
| decile p80 | 70.3 | 78.6 | 74.1 | 59.5 | 43.8 | 36.8 | |
| decile p90 | 90.0 | 97.8 | 90.3 | 83.6 | 59.2 | 45.0 | |
| LPA, min/day: | <0.0001 | ||||||
| Mean (SD) | 286.4 (87.8) | 298.6 (87.7) | 285.8 (86.5) | 281.4 (81.2) | 267.6 (96.3) | 235.1 (88.0) | |
| Median | 283.6 | 294.6 | 285.7 | 279.5 | 257.4 | 233.1 | |
| decile p10 | 175.3 | 188.7 | 177.3 | 181.4 | 154.0 | 126.6 | |
| decile p20 | 210.5 | 224.5 | 210.5 | 205.3 | 182.3 | 150.9 | |
| decile p30 | 236.5 | 248.8 | 237.9 | 230.8 | 215.2 | 172.9 | |
| decile p40 | 260.6 | 273.4 | 266.4 | 253.8 | 233.6 | 200.5 | |
| decile p60 | 306.3 | 314.3 | 307.3 | 300.9 | 277.1 | 262.9 | |
| decile p70 | 330.4 | 341.2 | 329.6 | 323.1 | 301.7 | 282.5 | |
| decile p80 | 359.3 | 367.2 | 360.9 | 354.4 | 347.1 | 326.7 | |
| decile p90 | 398.8 | 414.8 | 393.6 | 386.0 | 414.8 | 342.7 | |
| ST, min/day: | |||||||
| Mean (SD) | 479.3 (122.5) | 464.5 (125.4) | 476.5 (120.2) | 486.5 (109.2) | 515.2 (128.3) | 537.0 (132.4) | <0.0001 |
| Median | 478.0 | 469.6 | 471.0 | 484.4 | 513.8 | 538.9 | |
| decile p10 | 321.4 | 301.5 | 323.3 | 346.4 | 371.3 | 369.7 | |
| decile p20 | 379.4 | 357.2 | 378.8 | 396.4 | 432.6 | 421.5 | |
| decile p30 | 419.4 | 404.0 | 417.0 | 433.3 | 472.3 | 469.4 | |
| decile p40 | 450.3 | 435.9 | 449.2 | 459.6 | 491.3 | 497.2 | |
| decile p60 | 509.9 | 499.6 | 501.7 | 513.7 | 541.1 | 578.3 | |
| decile p70 | 540.3 | 530.1 | 535.0 | 542.8 | 573.0 | 613.9 | |
| decile p80 | 575.4 | 563.0 | 570.1 | 577.7 | 603.4 | 644.5 | |
| decile p90 | 621.1 | 599.5 | 621.3 | 617.2 | 639.7 | 712.2 | |
| Overall (n = 2327) | Age categories, yrs | ||||||
|---|---|---|---|---|---|---|---|
| 65–69 (n = 813) | 70–74 (n = 713) | 75–79 (n = 483) | 80–84 (n = 229) | ≥85 (n = 89) | p for Trend | ||
| Steps: | |||||||
| Mean (SD) | 5037 (2786) | 6104 (2901) | 5331 (2498) | 4230 (2323) | 3184 (2179) | 2105 (1627) | |
| Median | 4596 | 5539 | 5020 | 3885 | 2820 | 1696 | |
| AWT, min/day: | |||||||
| Mean (SD) | 849.9 (97.1) | 864.9 (91.6) | 851.3 (92.4) | 839.0 (105.1) | 829.6 (100.9) | 813.6 (103.7) | |
| Median | 845.8 | 861.7 | 851.7 | 830.5 | 819.3 | 809.2 | |
| MVPA, min/day: | |||||||
| Mean (SD) | 50.4 (35.7) | 65.5 (38.6) | 52.3 (32.3) | 39.6 (29.1) | 26.5 (22.2) | 18.5 (17.3) | <0.0001 |
| Median | 43.2 | 57.4 | 45.9 | 33.0 | 19.9 | 13.0 | |
| decile p10 | 11.3 | 24.1 | 18.9 | 8.0 | 4.0 | 2.9 | |
| decile p20 | 20.3 | 33.5 | 26.4 | 14.0 | 7.8 | 3.8 | |
| decile p30 | 28.6 | 41.1 | 33.1 | 19.9 | 12.3 | 7.3 | |
| decile p40 | 35.8 | 49.4 | 39.1 | 26.6 | 16.0 | 9.3 | |
| decile p60 | 51.8 | 65.9 | 53.0 | 40.9 | 26.5 | 17.2 | |
| decile p70 | 61.0 | 79.7 | 61.0 | 49.8 | 33.7 | 22.4 | |
| decile p80 | 76.9 | 96.0 | 75.8 | 60.9 | 41.3 | 32.0 | |
| decile p90 | 99.2 | 114.3 | 95.7 | 82.6 | 55.0 | 44.7 | |
| LPA, min/day: | |||||||
| Mean (SD) | 374.4 (85.7) | 391.4 (80.9) | 380.1 (81.0) | 364.5 (87.2) | 343.8 (88.6) | 306.5 (89.4) | <0.0001 |
| Median | 373.1 | 390.6 | 377.3 | 361.3 | 345.8 | 300.0 | |
| decile p10 | 266.1 | 287.8 | 280.8 | 255.3 | 235.1 | 186.7 | |
| decile p20 | 300.1 | 323.9 | 315.5 | 285.8 | 260.0 | 238.5 | |
| decile p30 | 329.6 | 349.9 | 334.9 | 319.6 | 293.6 | 266.7 | |
| decile p40 | 352.0 | 371.3 | 358.3 | 339.6 | 316.8 | 271.3 | |
| decile p60 | 395.0 | 411.0 | 402.0 | 382.4 | 367.3 | 325.9 | |
| decile p70 | 419.6 | 434.5 | 422.7 | 407.9 | 385.0 | 340.5 | |
| decile p80 | 448.1 | 459.6 | 449.8 | 442.5 | 411.9 | 386.6 | |
| decile p90 | 486.6 | 498.5 | 481.1 | 484.3 | 470.4 | 446.5 | |
| ST, min/day: | |||||||
| Mean (SD) | 425.1 (112.3) | 408.0 (107.4) | 418.9 (102.1) | 435.0 (122.4) | 459.3 (119.5) | 488.6 (112.9) | <0.0001 |
| Median | 417.9 | 405.4 | 409.4 | 424.2 | 450.1 | 487.3 | |
| decile p10 | 289.4 | 279.5 | 293.9 | 291.0 | 309.1 | 337.3 | |
| decile p20 | 333.4 | 314.4 | 337.0 | 338.8 | 364.6 | 399.8 | |
| decile p30 | 364.6 | 350.0 | 361.0 | 378.1 | 401.7 | 437.3 | |
| decile p40 | 392.1 | 376.8 | 385.0 | 400.3 | 429.0 | 473.4 | |
| decile p60 | 444.4 | 430.8 | 437.3 | 448.8 | 485.6 | 520.0 | |
| decile p70 | 476.6 | 456.8 | 467.4 | 483.0 | 511.4 | 540.7 | |
| decile p80 | 513.1 | 493.4 | 506.4 | 526.4 | 547.0 | 582.9 | |
| decile p90 | 565.4 | 544.4 | 550.3 | 572.5 | 611.8 | 605.9 | |
| Overall (n = 1671) | BMI categories, kg/m2 | |||||
|---|---|---|---|---|---|---|
| <18.5 (n = 73) | 18.5–24.9 (n = 1187) | 25.0–29.9 (n = 383) | ≥30.0 (n = 28) | p for Trend | ||
| Steps | ||||||
| Mean (SD) | 5701 (3398) | 4976 (2995) | 5888 (3323) | 5324 (3697) | 4820 (2503) | |
| Median | 5186 | 4699 | 5414 | 4692 | 4716 | |
| AWT, min/day: | ||||||
| Mean (SD) | 811.8 (94.2) | 810.8 (96.5) | 813.8 (94.2) | 807.0 (93.2) | 799.1 (105.0) | |
| Median | 802.8 | 807.7 | 803.4 | 799.6 | 773.4 | |
| MVPA, min/day: | ||||||
| Mean (SD) | 46.1 (34.0) | 36.1 (28.0) | 48.3 (34.3) | 42.1 (34.0) | 35.4 (22.6) | 0.06 |
| Median | 39.6 | 32.4 | 42.3 | 36.1 | 30.8 | |
| decile p10 | 9.5 | 6.5 | 10.0 | 9.0 | 7.0 | |
| decile p20 | 16.9 | 11.5 | 17.8 | 15.6 | 13.1 | |
| decile p30 | 24.3 | 14.8 | 25.7 | 22.1 | 17.5 | |
| decile p40 | 32.5 | 25.7 | 33.8 | 29.9 | 25.4 | |
| decile p60 | 48.1 | 38.5 | 51.6 | 41.8 | 43.4 | |
| decile p70 | 57.9 | 43.0 | 61.4 | 50.1 | 51.2 | |
| decile p80 | 70.3 | 49.4 | 74.1 | 61.4 | 57.0 | |
| decilep90 | 90.0 | 86.4 | 92.4 | 80.0 | 61.5 | |
| LPA, min/day: | ||||||
| Mean (SD) | 286.4 (87.8) | 294.2 (104.1) | 291.4 (86.0) | 272.4 (88.2) | 247.0 (85.5) | <0.0001 |
| Median | 283.6 | 282.2 | 289.3 | 269.6 | 234.2 | |
| decile p10 | 175.3 | 172.5 | 181.4 | 162.6 | 114.8 | |
| decile p20 | 210.5 | 228.8 | 215.2 | 198.3 | 177.6 | |
| decile p30 | 236.5 | 242.3 | 243.2 | 223.5 | 210.0 | |
| decile p40 | 260.6 | 254.4 | 267.0 | 247.3 | 215.8 | |
| decile p60 | 306.3 | 302.3 | 312.6 | 291.0 | 268.3 | |
| decile p70 | 330.4 | 343.0 | 334.7 | 309.8 | 285.0 | |
| decile p80 | 359.3 | 372.3 | 362.6 | 349.3 | 330.9 | |
| decile p90 | 398.8 | 445.5 | 403.0 | 383.8 | 378.4 | |
| ST, min/day: | ||||||
| Mean (SD) | 479.3 (122.5) | 480.4 (134.5) | 474.1 (121.6) | 492.5 (119.6) | 516.8 (148.0) | 0.0088 |
| Median | 478.0 | 488.6 | 473.3 | 493.6 | 493.2 | |
| decile p10 | 321.4 | 332.9 | 319.7 | 339.0 | 363.3 | |
| decile p20 | 379.4 | 376.8 | 371.8 | 404.3 | 391.0 | |
| decile p30 | 419.4 | 415.0 | 412.4 | 439.8 | 428.8 | |
| decile p40 | 450.3 | 452.5 | 445.4 | 470.6 | 449.1 | |
| decile p60 | 509.9 | 523.4 | 503.6 | 525.3 | 562.5 | |
| decile p70 | 540.3 | 547.6 | 535.4 | 550.5 | 586.5 | |
| decile p80 | 575.4 | 590.6 | 571.6 | 577.1 | 609.5 | |
| decile p90 | 621.1 | 621.3 | 621.8 | 615.6 | 654.3 | |
| Overall (n = 2327) | BMI Categories, kg/m2 | |||||
|---|---|---|---|---|---|---|
| <18.5 (n = 207) | 18.5–24.9 (n = 1547) | 25.0–29.9 (n = 505) | ≥30.0 (n = 68) | p for Trend | ||
| Steps | ||||||
| Mean (SD) | 5037 (2786) | 4964 (2867) | 5173 (2781) | 4736 (2759) | 4424 (2630) | |
| Median | 4596 | 4716 | 4774 | 4402 | 3861 | |
| AWT, min/day: | ||||||
| Mean (SD) | 849.9 (97.1) | 863.7 (97.4) | 848.1 (94.1) | 849.2 (104.8) | 854.9 (102.4) | |
| Median | 845.8 | 859.6 | 845.5 | 839.8 | 841.1 | |
| MVPA, min/day | ||||||
| Mean (SD) | 50.4 (35.7) | 51.6 (37.5) | 52.0 (35.5) | 46.4 (36.0) | 40.9 (28.9) | 0.0009 |
| Median | 43.2 | 44.9 | 45.0 | 38.8 | 35.7 | |
| decile p10 | 11.3 | 10.9 | 13.2 | 8.3 | 8.4 | |
| decile p20 | 20.3 | 20.8 | 21.7 | 17.1 | 14.6 | |
| decile p30 | 28.6 | 29.8 | 30.3 | 24.1 | 23.0 | |
| decile p40 | 35.8 | 36.0 | 37.2 | 33.5 | 32.3 | |
| decile p60 | 51.8 | 53.9 | 53.8 | 46.6 | 39.0 | |
| decile p70 | 61.0 | 60.8 | 63.3 | 56.6 | 49.9 | |
| decile p80 | 76.9 | 75.0 | 80.0 | 68.3 | 59.7 | |
| decilep90 | 99.2 | 100.6 | 101.0 | 93.1 | 84.2 | |
| LPA, min/day | ||||||
| Mean (SD) | 374.4 (85.7) | 396.3 (87.9) | 378.3 (84.4) | 357.3 (83.9) | 346.9 (94.8) | <0.0001 |
| Median | 373.1 | 395.8 | 377.1 | 354.4 | 340.2 | |
| decile p10 | 266.1 | 275.0 | 270.6 | 253.5 | 230.6 | |
| decile p20 | 300.1 | 327.0 | 307.8 | 284.0 | 266.9 | |
| decile p30 | 329.6 | 352.5 | 333.7 | 308.8 | 281.3 | |
| decile p40 | 352.0 | 371.3 | 356.3 | 333.6 | 311.5 | |
| decile p60 | 395.0 | 416.5 | 399.8 | 378.2 | 376.3 | |
| decile p70 | 419.6 | 444.6 | 423.4 | 396.6 | 389.8 | |
| decile p80 | 448.1 | 473.6 | 448.7 | 430.9 | 431.3 | |
| decilep90 | 486.6 | 509.0 | 487.6 | 468.3 | 466.4 | |
| ST, min/day | ||||||
| Mean (SD) | 425.1 (112.3) | 415.8 (104.6) | 417.8 (109.0) | 445.5 (120.0) | 467.1 (123.1) | <0.0001 |
| Median | 417.9 | 408.5 | 412.3 | 438.3 | 463.3 | |
| decile p10 | 289.4 | 291.2 | 285.4 | 301.6 | 365.0 | |
| decile p20 | 333.4 | 329.3 | 328.4 | 348.1 | 409.9 | |
| decile p30 | 364.6 | 355.6 | 359.9 | 380.8 | 436.9 | |
| decile p40 | 392.1 | 382.3 | 386.0 | 405.2 | 463.3 | |
| decile p60 | 444.4 | 431.1 | 438.6 | 466.9 | 507.0 | |
| decile p70 | 476.6 | 456.1 | 468.0 | 498.9 | 539.9 | |
| decile p80 | 513.1 | 496.8 | 505.1 | 541.1 | 566.9 | |
| decilep90 | 565.4 | 558.9 | 554.1 | 590.9 | 630.6 | |
Publisher’s Note: MDPI stays neutral with regard to jurisdictional claims in published maps and institutional affiliations. |
© 2021 by the authors. Licensee MDPI, Basel, Switzerland. This article is an open access article distributed under the terms and conditions of the Creative Commons Attribution (CC BY) license (https://creativecommons.org/licenses/by/4.0/).
Share and Cite
Yatsugi, H.; Chen, T.; Chen, S.; Narazaki, K.; Nagayoshi, S.; Kumagai, S.; Kishimoto, H. Normative Data of Objectively Measured Physical Activity and Sedentary Time in Community—Dwelling Older Japanese. Int. J. Environ. Res. Public Health 2021, 18, 3577. https://0-doi-org.brum.beds.ac.uk/10.3390/ijerph18073577
Yatsugi H, Chen T, Chen S, Narazaki K, Nagayoshi S, Kumagai S, Kishimoto H. Normative Data of Objectively Measured Physical Activity and Sedentary Time in Community—Dwelling Older Japanese. International Journal of Environmental Research and Public Health. 2021; 18(7):3577. https://0-doi-org.brum.beds.ac.uk/10.3390/ijerph18073577
Chicago/Turabian StyleYatsugi, Harukaze, Tao Chen, Si Chen, Kenji Narazaki, Sho Nagayoshi, Shuzo Kumagai, and Hiro Kishimoto. 2021. "Normative Data of Objectively Measured Physical Activity and Sedentary Time in Community—Dwelling Older Japanese" International Journal of Environmental Research and Public Health 18, no. 7: 3577. https://0-doi-org.brum.beds.ac.uk/10.3390/ijerph18073577