
Predicting Active NBA Players Most Likely to Be Inducted into the Basketball Hall of Famers Using Artificial Neural Networks in Microsoft Excel: Development and Usability Study

 , and
, and
Abstract
:1. Introduction
1.1. To Know the HOF Probability(or Classification) of an Active NBA Player
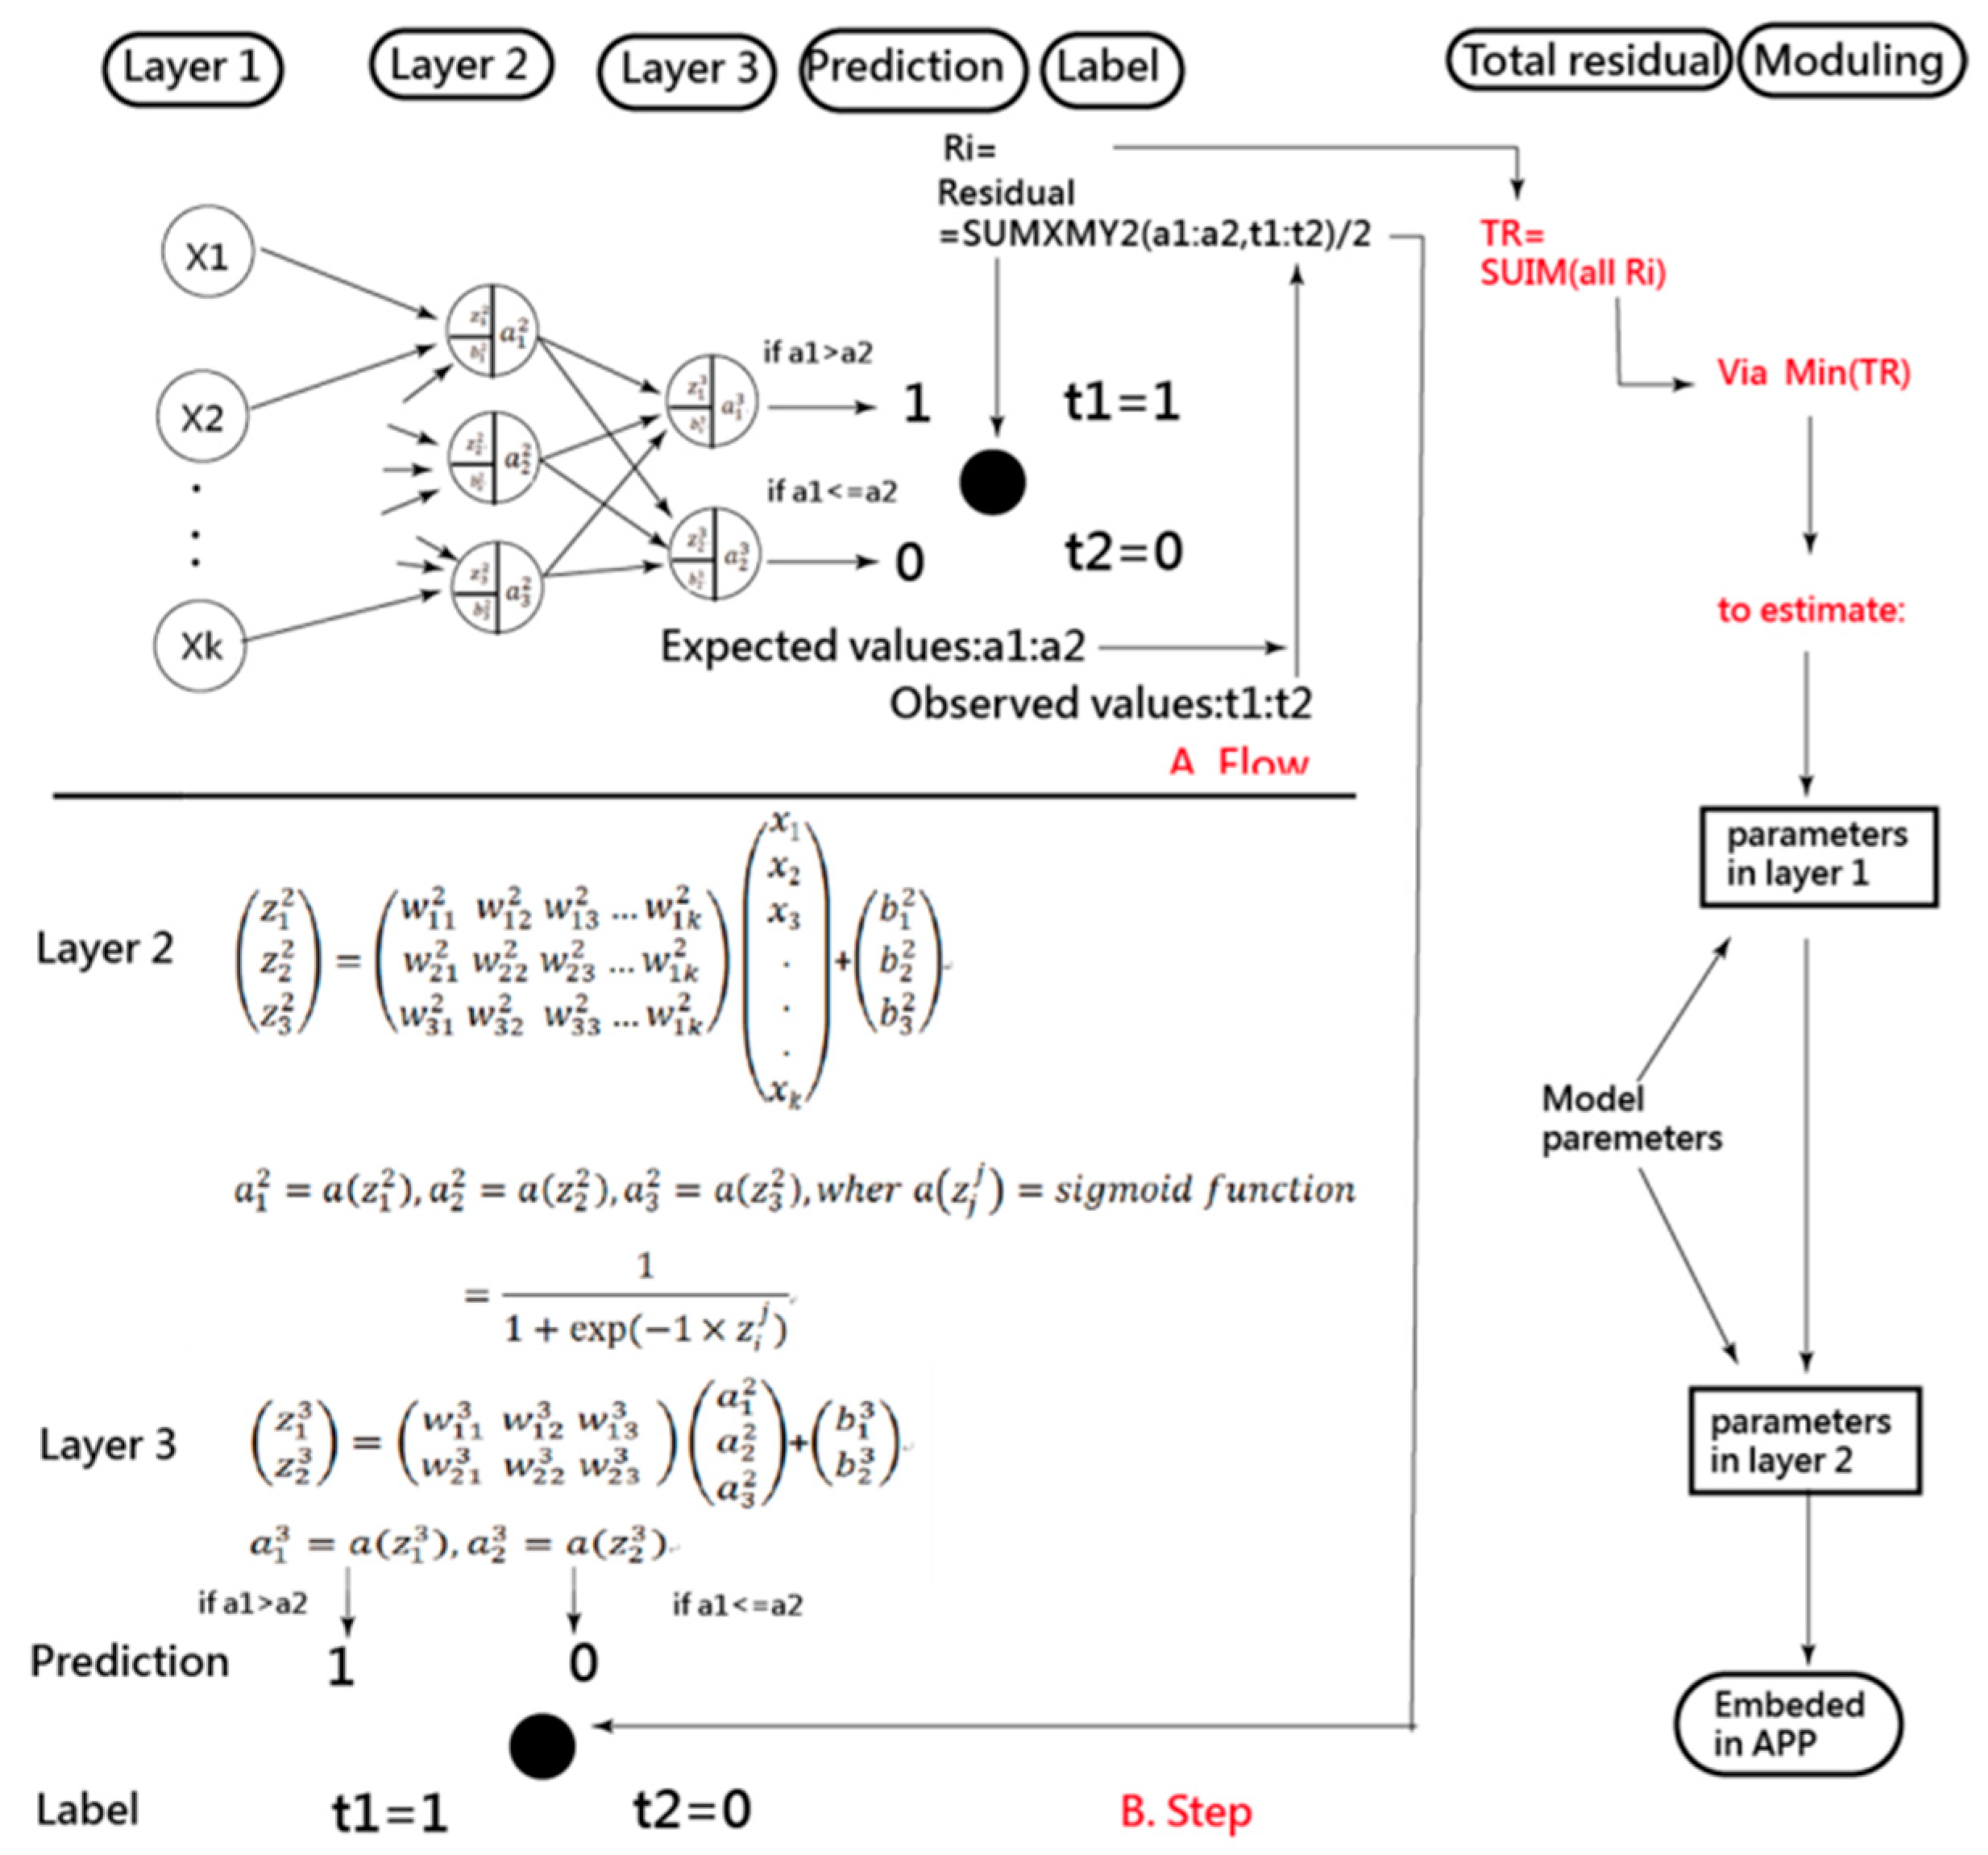
1.2. ANN and CNN Models Used for Classifying the HOF and Non-HOF
1.3. Online Classification Using Smartphones Is Required
1.4. Objectives
- Part 1:
- model building includes (1) determining the featured variables used for estimating model parameters and (2) comparing the model accuracies between the two ANN/CNN models.
- Part 2:
- predicting the HOF and developing a HOF app comprise (3) illustrating the most underrated and overrated HOF/Non-HOF players and (4) designing a HOF app.
- Part 3:
- interpreting the resulting HOF/Non-HOF consist of (5) interpreting the reason for HOF or Non-HOF and (6) clustering the active NBA players in characteristics (e.g., features toward stats, accolades, or others).
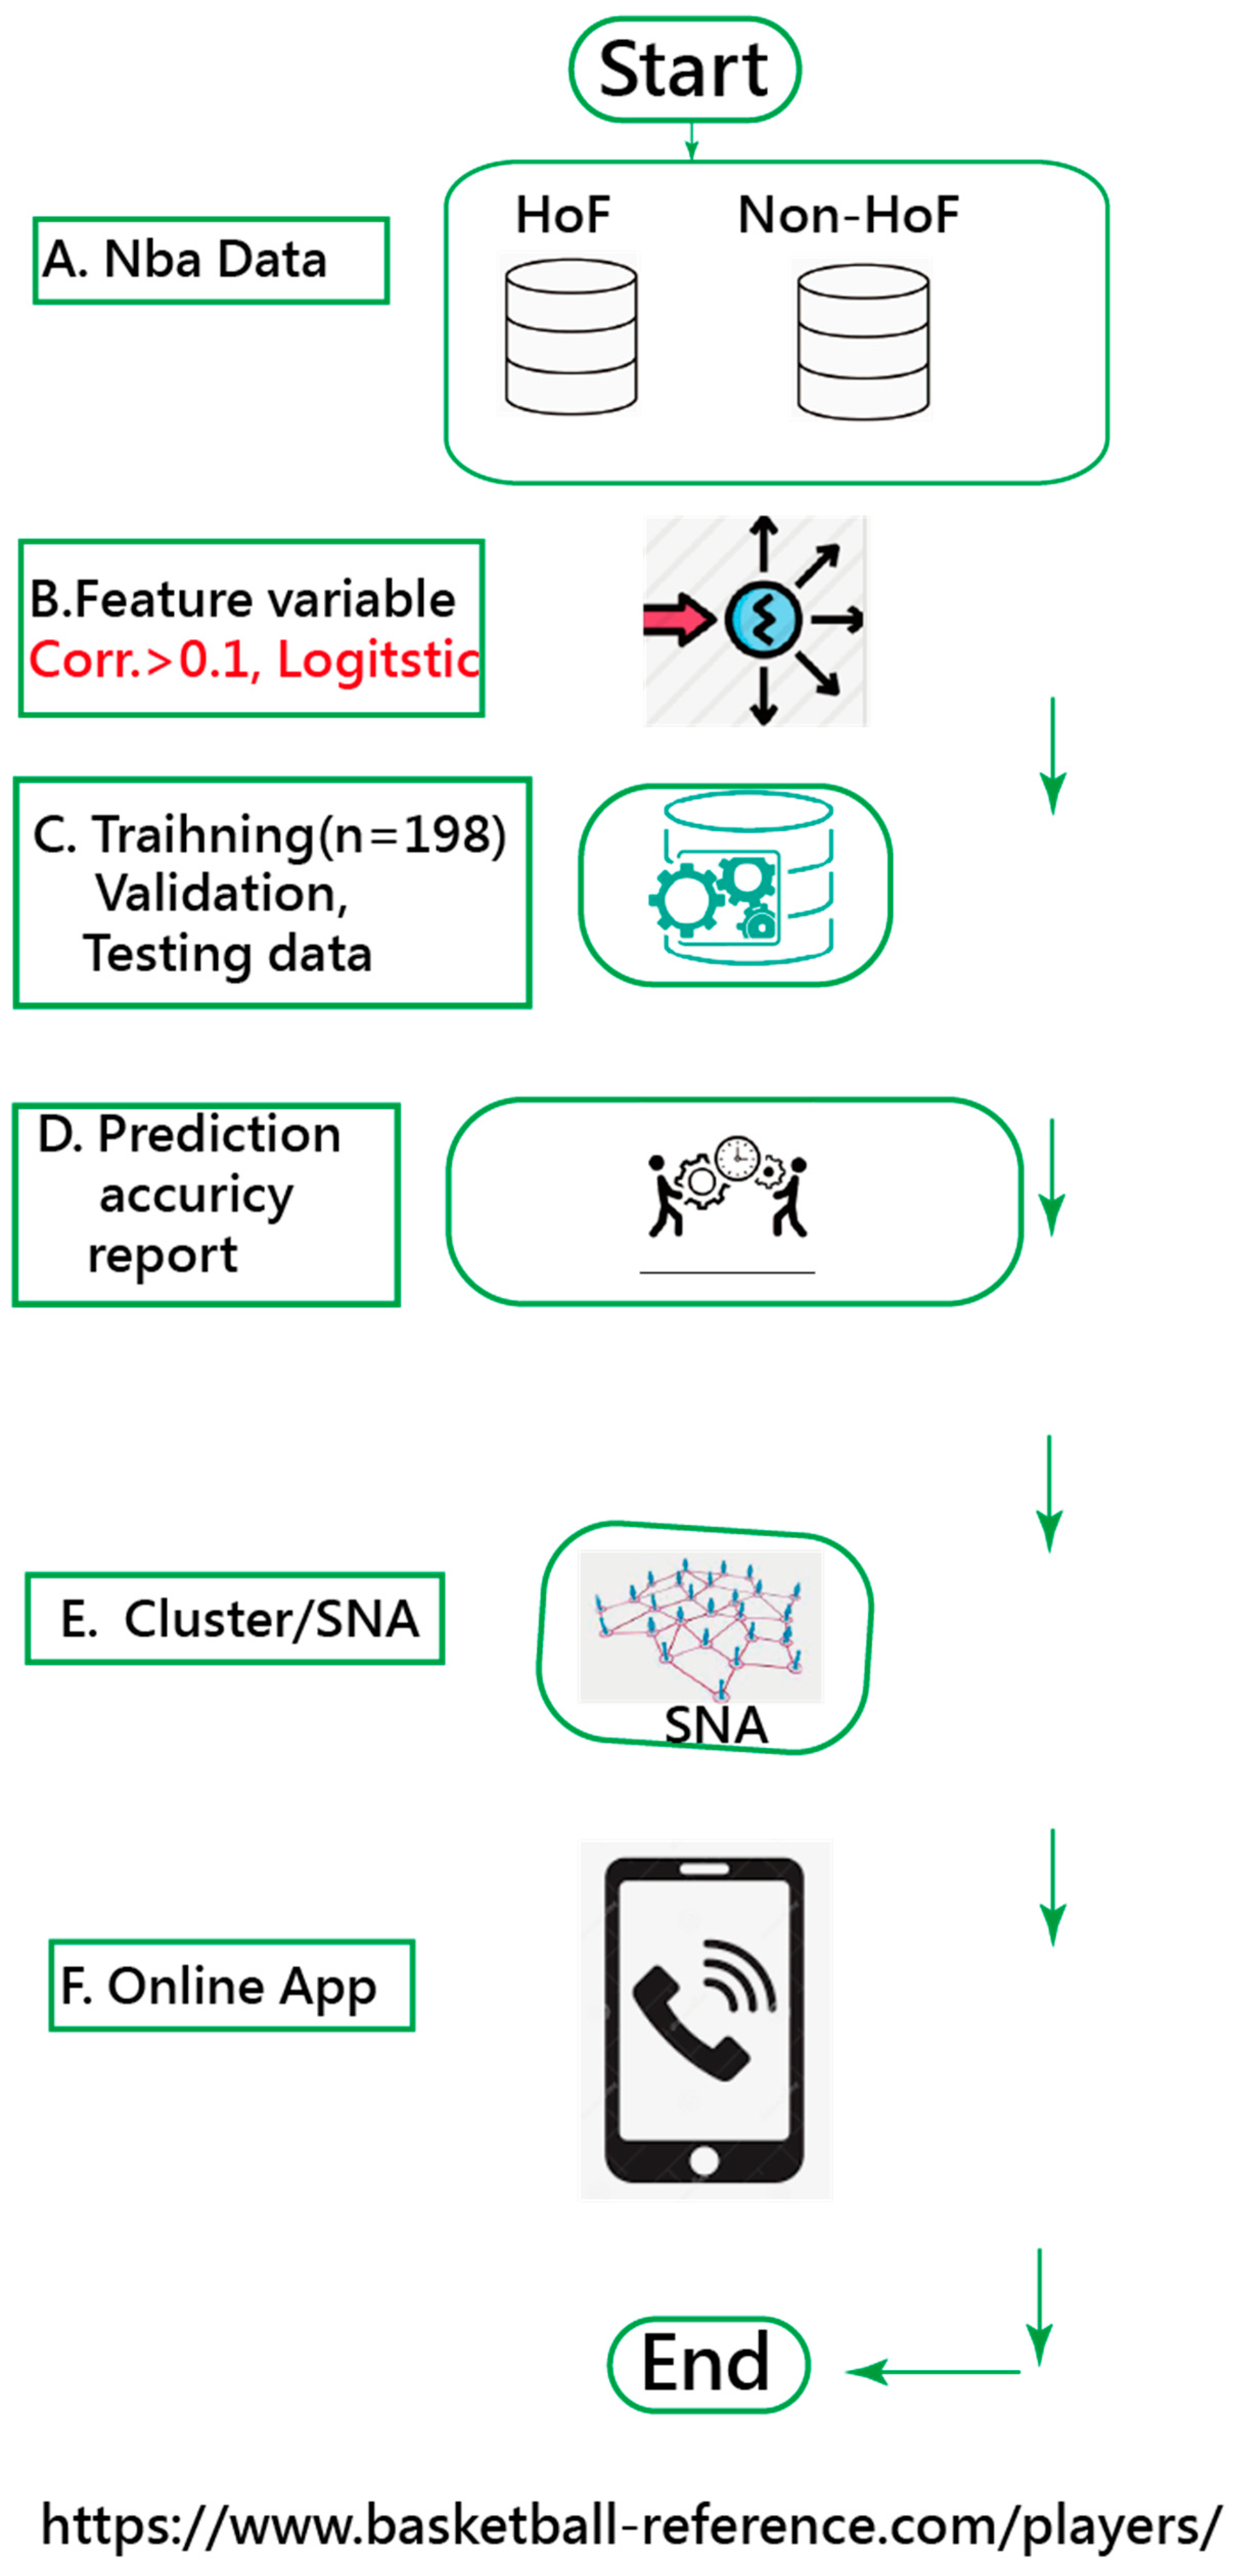
2. Materials and Methods
2.1. Data Source
2.2. Concept in Model Building and Parameter Estimation
2.2.1. Featured Variables Extracted from the NBA Stats and Accolades
2.2.2. Model Building and Parameter Estimation
2.2.3. Comparion of Model Accuracy between the two ANN/CNN Models
2.3. Tasks in Achieving the Study Goals
2.3.1. Model Buiding and Model Comparison
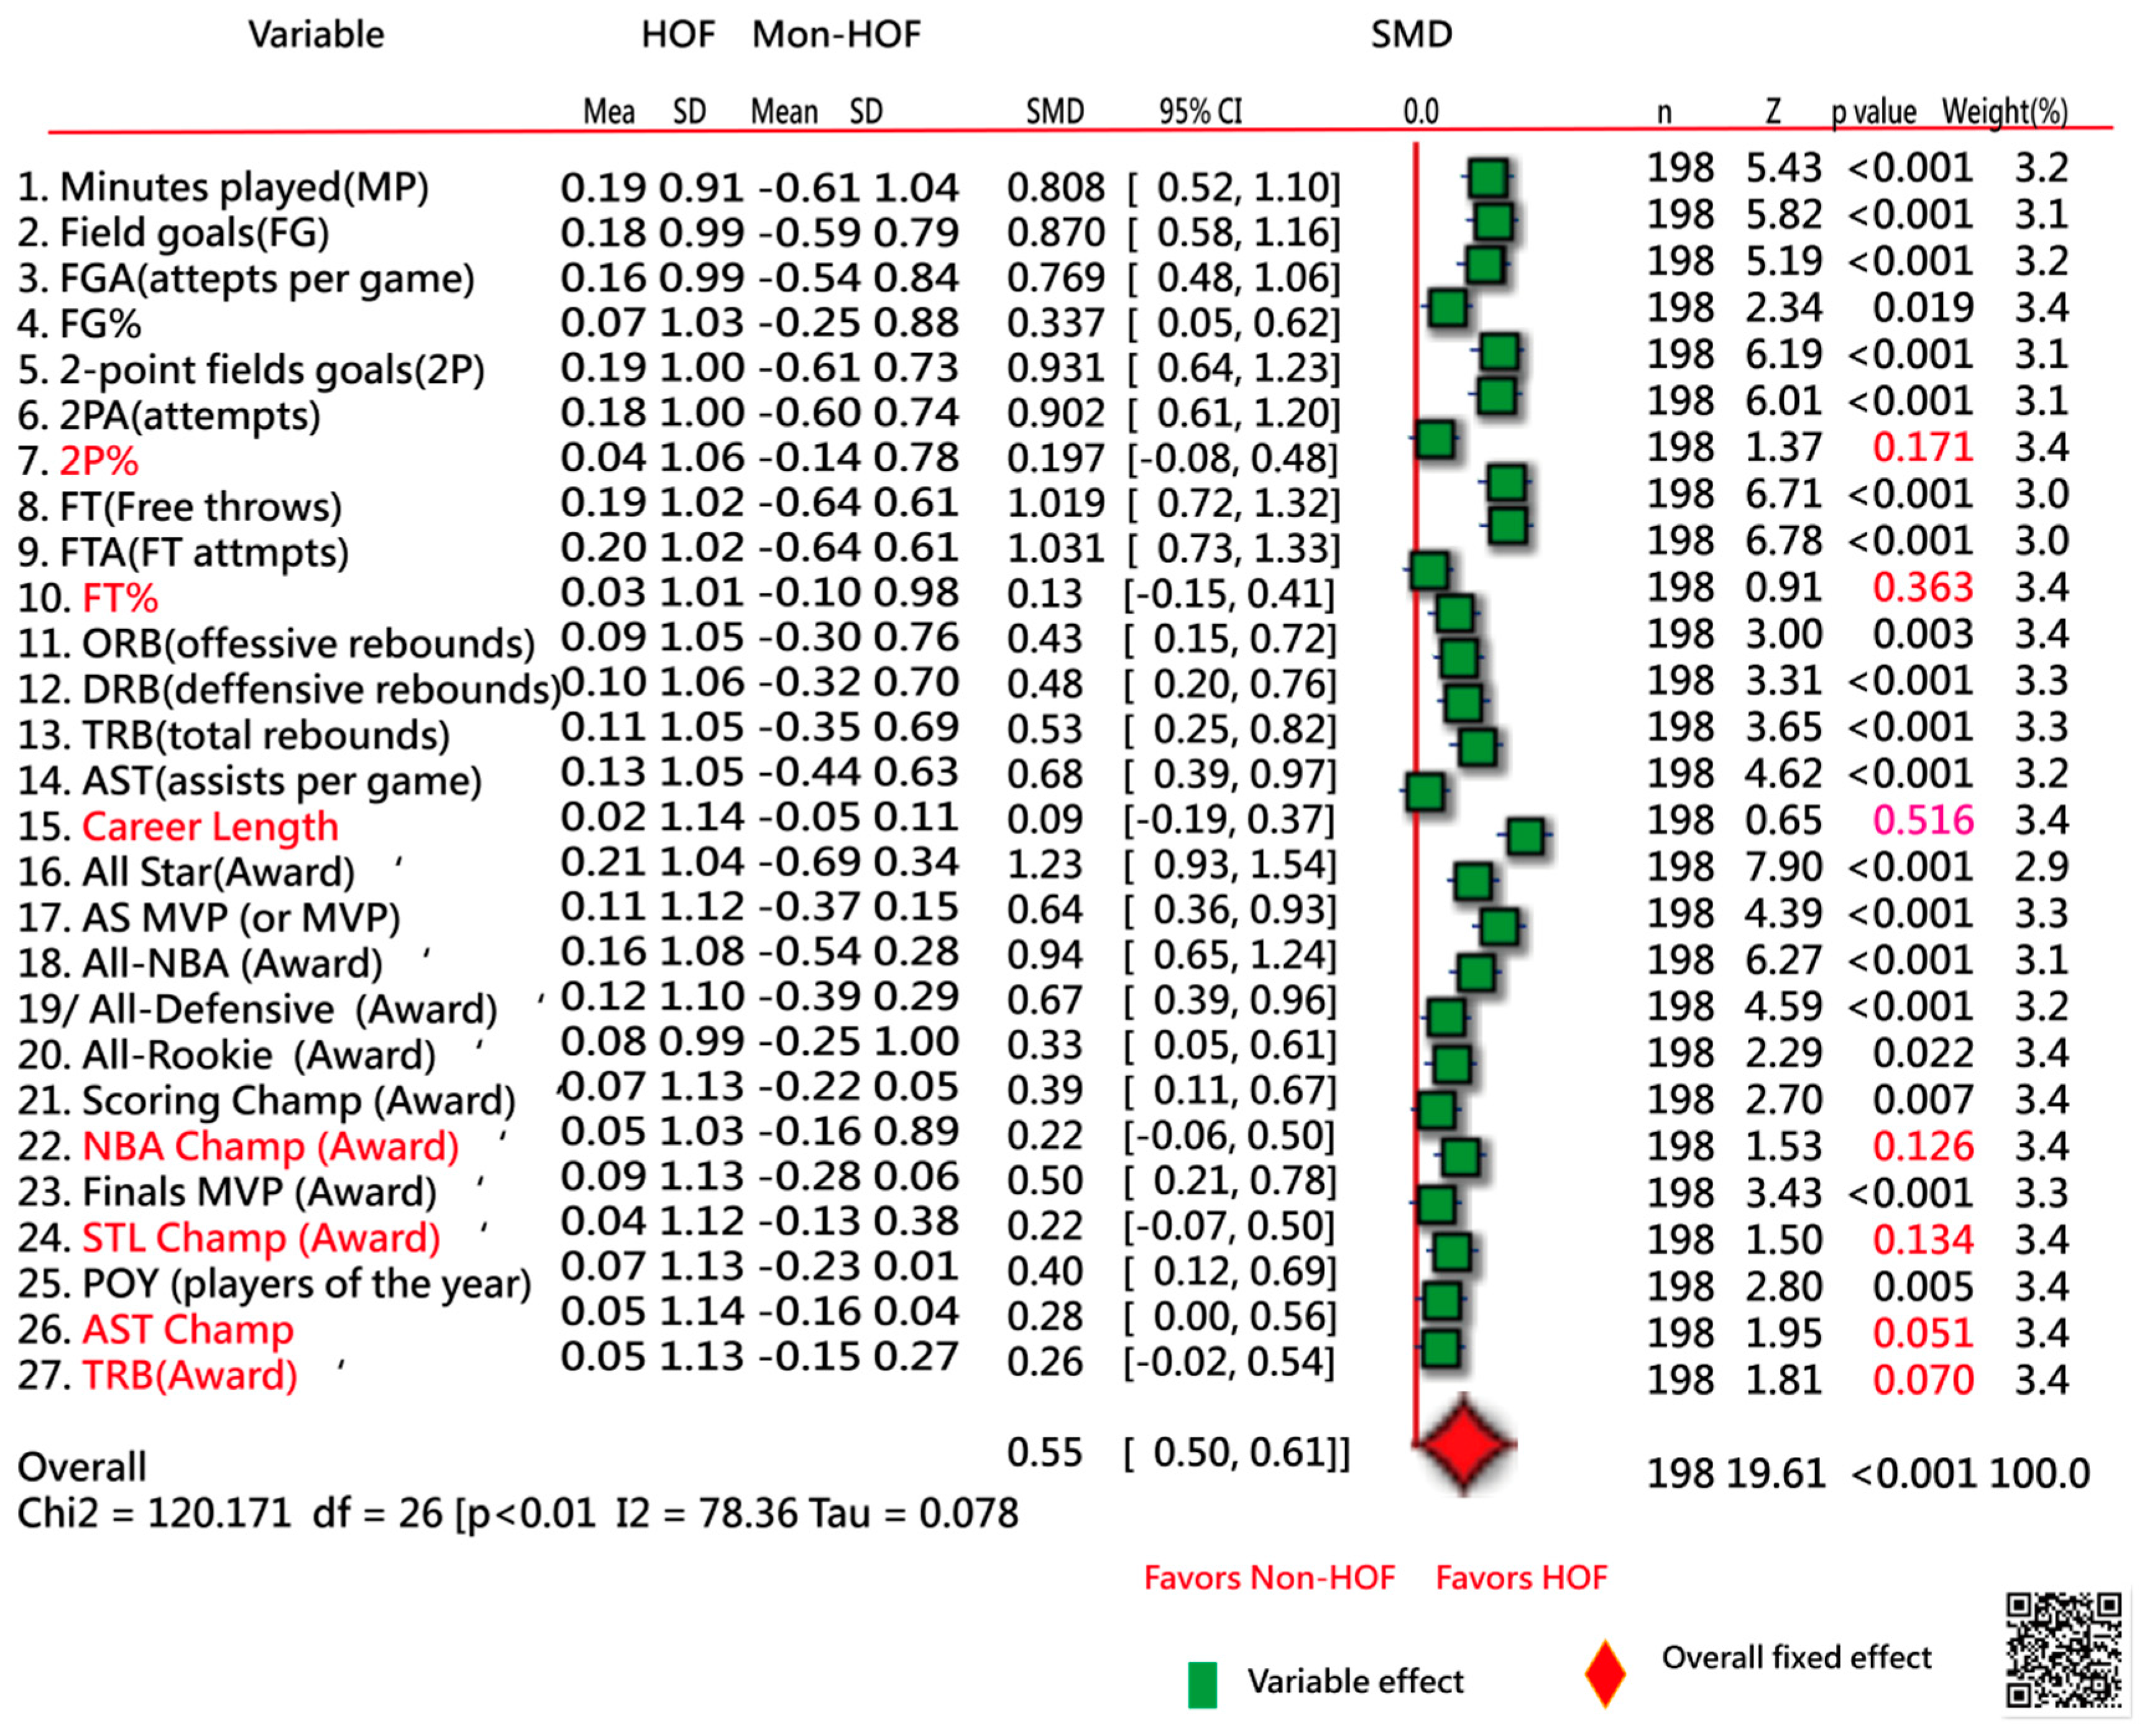
- Task 1:
- Selection of Featured Variables
- Task 2:
- Comparison of Accuracies between the Two ANN and CNN Models
- (1)
- True positive (TP) = the number of predicted NIQJ to the true NIQJ,
- (2)
- True negative (TN) = the number of predicted Non-NIQJ to the true Non-NIQJ,
- (3)
- False-positive (FP) = the number of Non-NIQJ minuses TN,
- (4)
- False-negative (FN) = the number of NIQJ minuses TP,
- (5)
- SENS = Sensitivity = true positive rate (TPR) = TP ÷ (TP + FN),
- (6)
- SPEC = Specificity = true negative rate (TNR) = TN ÷ (TN + FP),
- (7)
- Precision = positive predictive value (PPV) = TP ÷ (TP + FP),
- (8)
- F1 score = 2 × PPV × TPR ÷ (PPV + TPR),
- (9)
- ACC = accuracy = (TP + TN) ÷ N,
- (10)
- N = TP + TN + FP + FN,
- (11)
- AUC = (1 − Specificity) × Sensitivity ÷ 2 + (Sensitivity + 1) × Specificity ÷ 2,
- (12)
- SE for AUC = √(AUC × (1-AUC) ÷ N),
- (13)
- 95%CI = AUC ± 1.96 × SE for AUC,
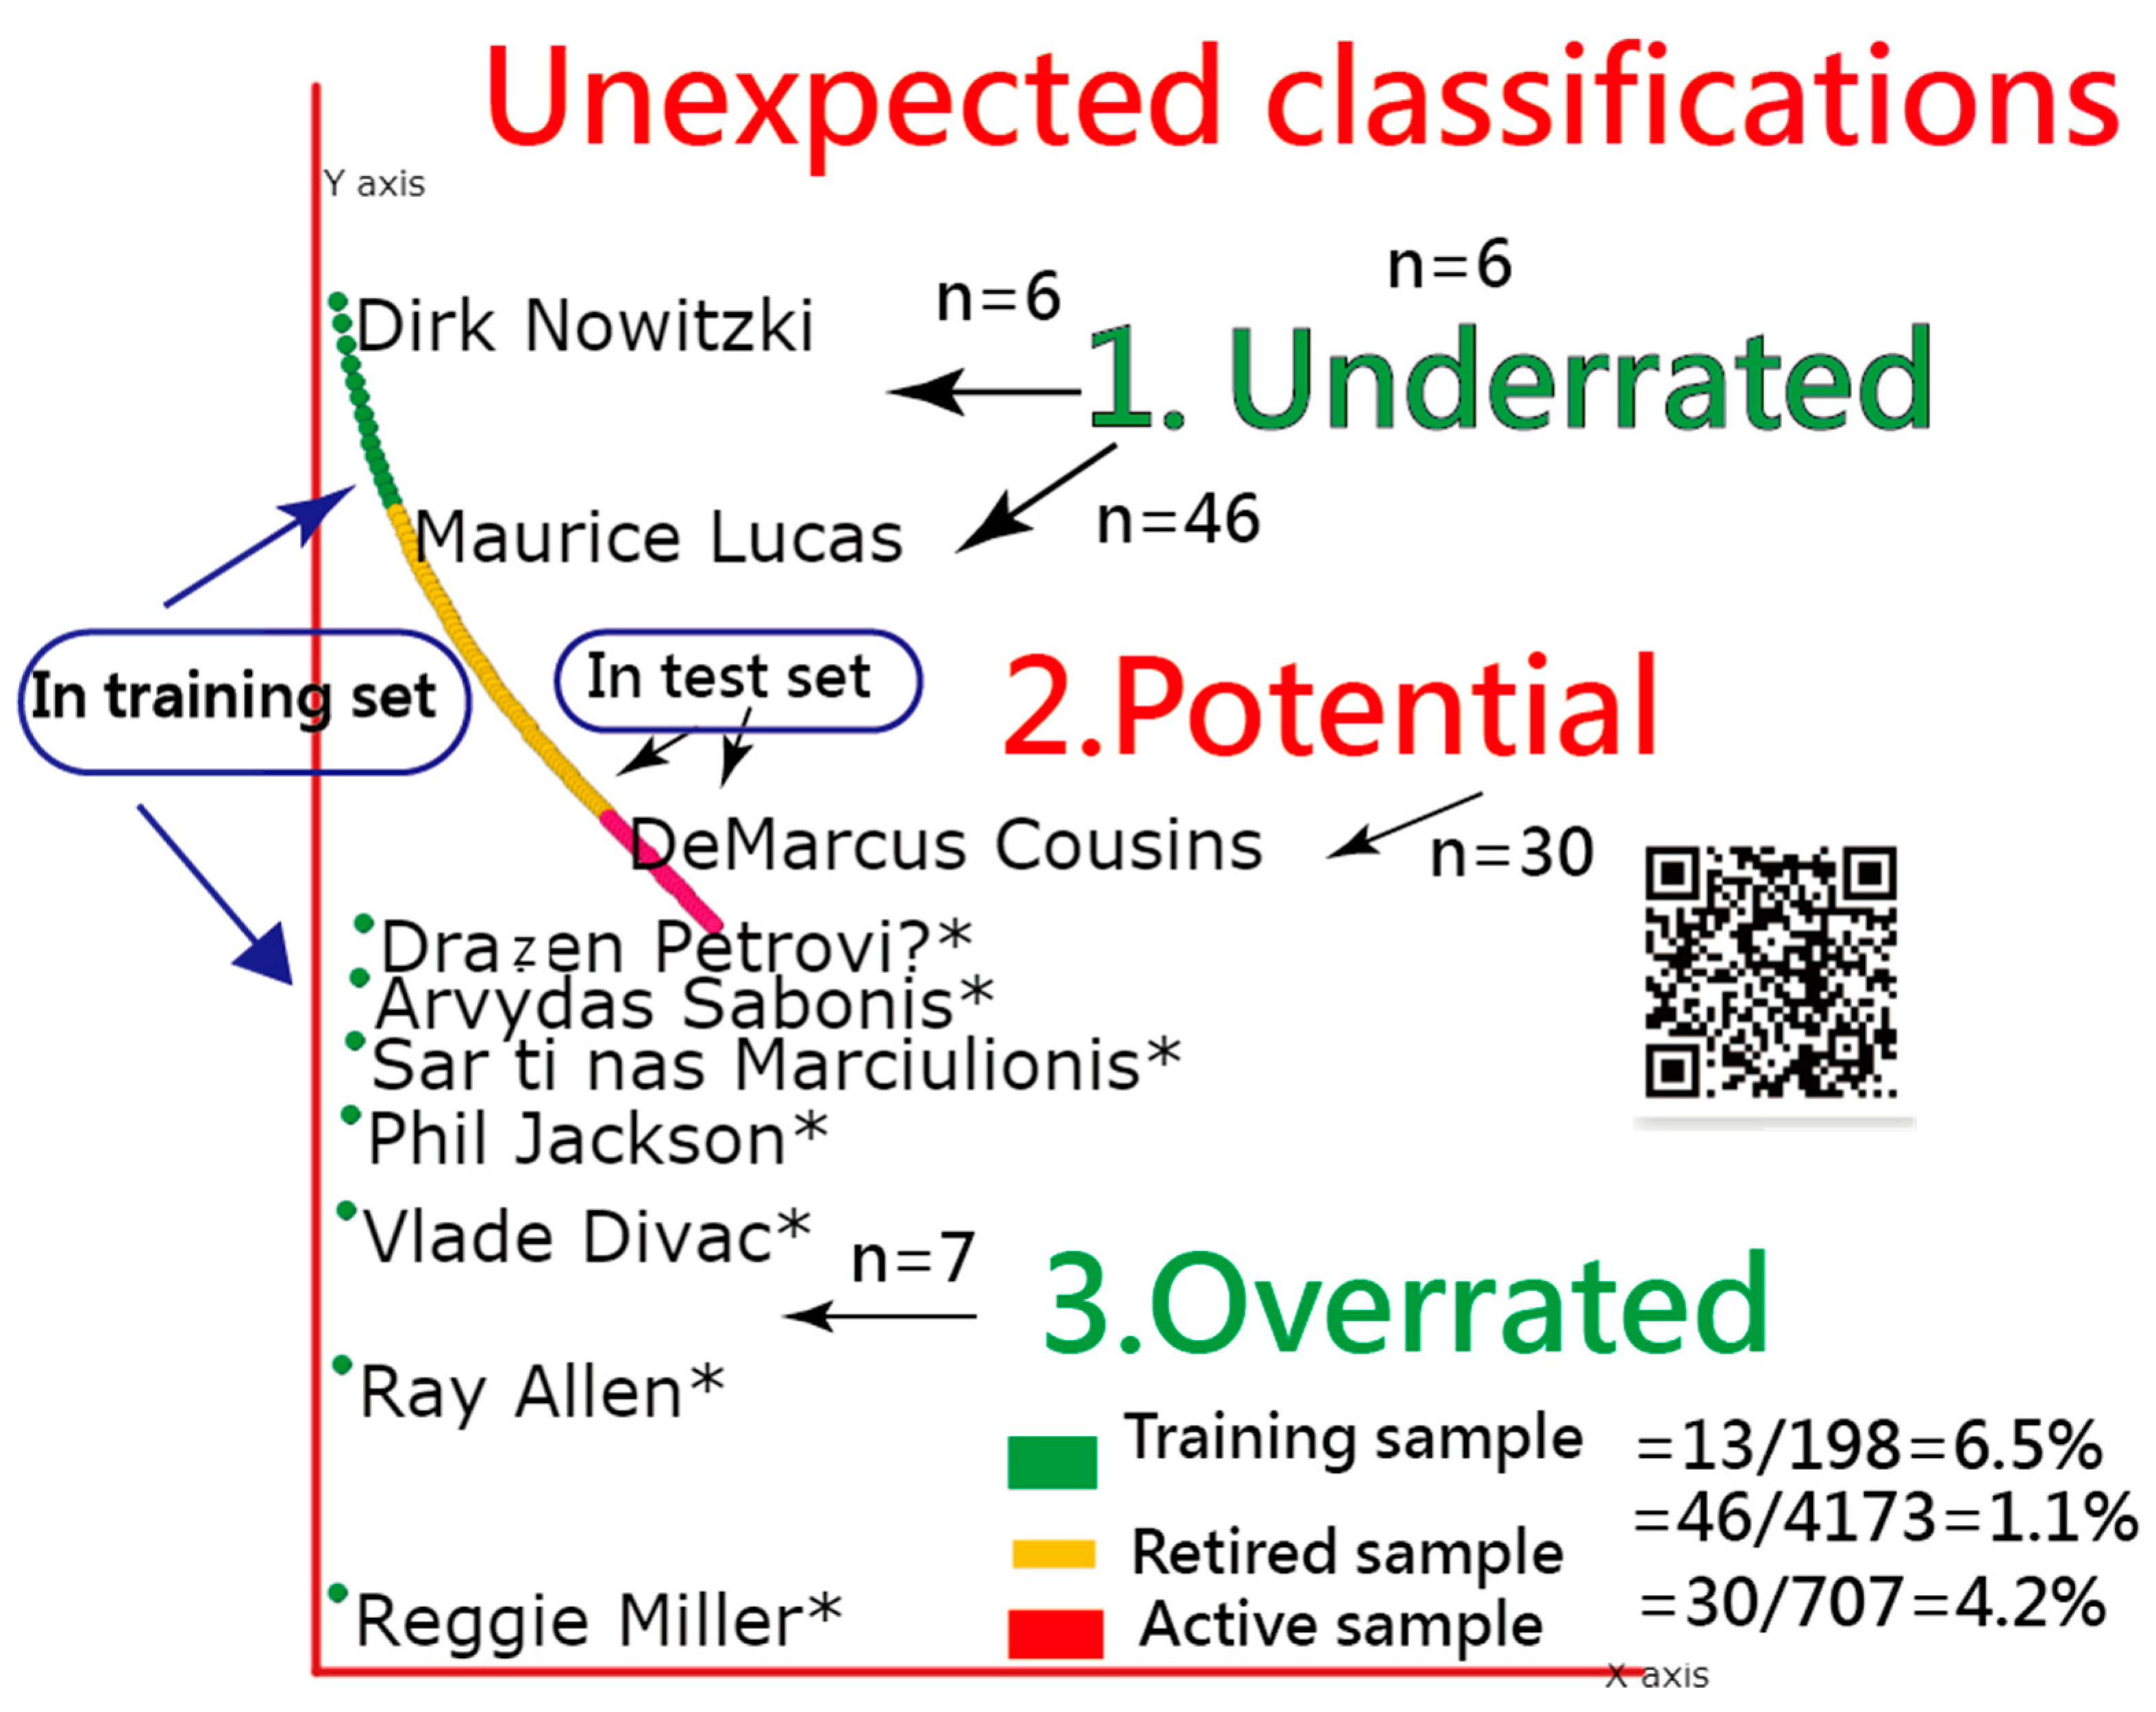
2.3.2. HOF Prediction and APP Development
- Task 3:
- Unexpected Classifications of HOF for NBA Players
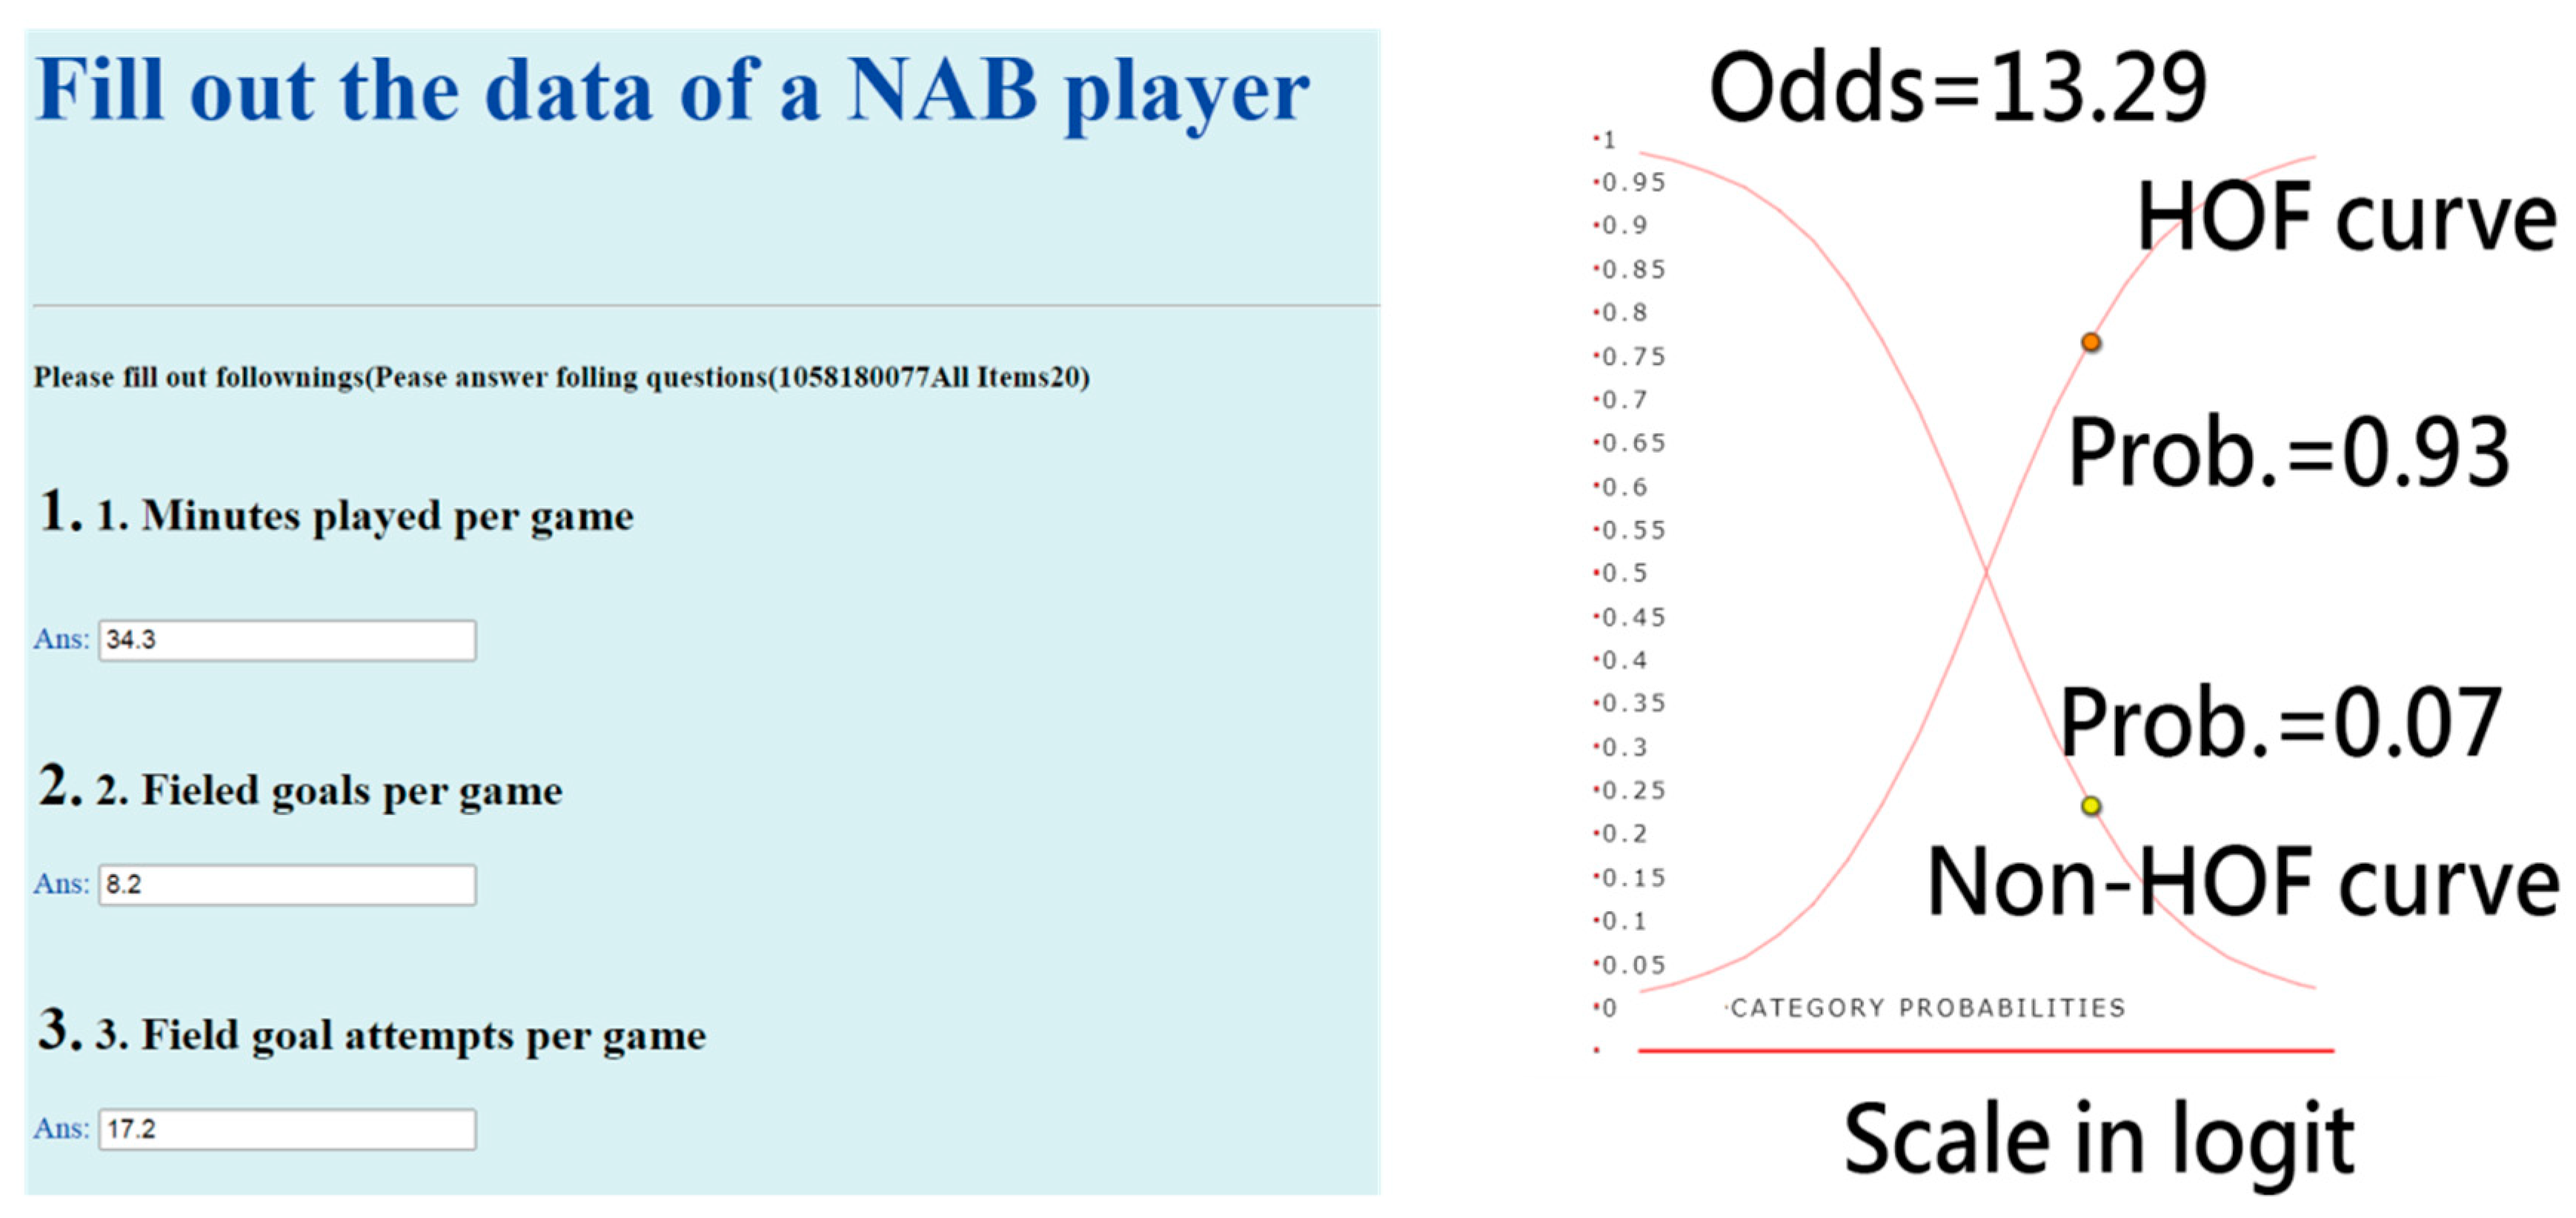
- Task 4:
- An App Developed for Predicting HOF
2.3.3. Data Interpretations and the Characteristics of Active NBA Players
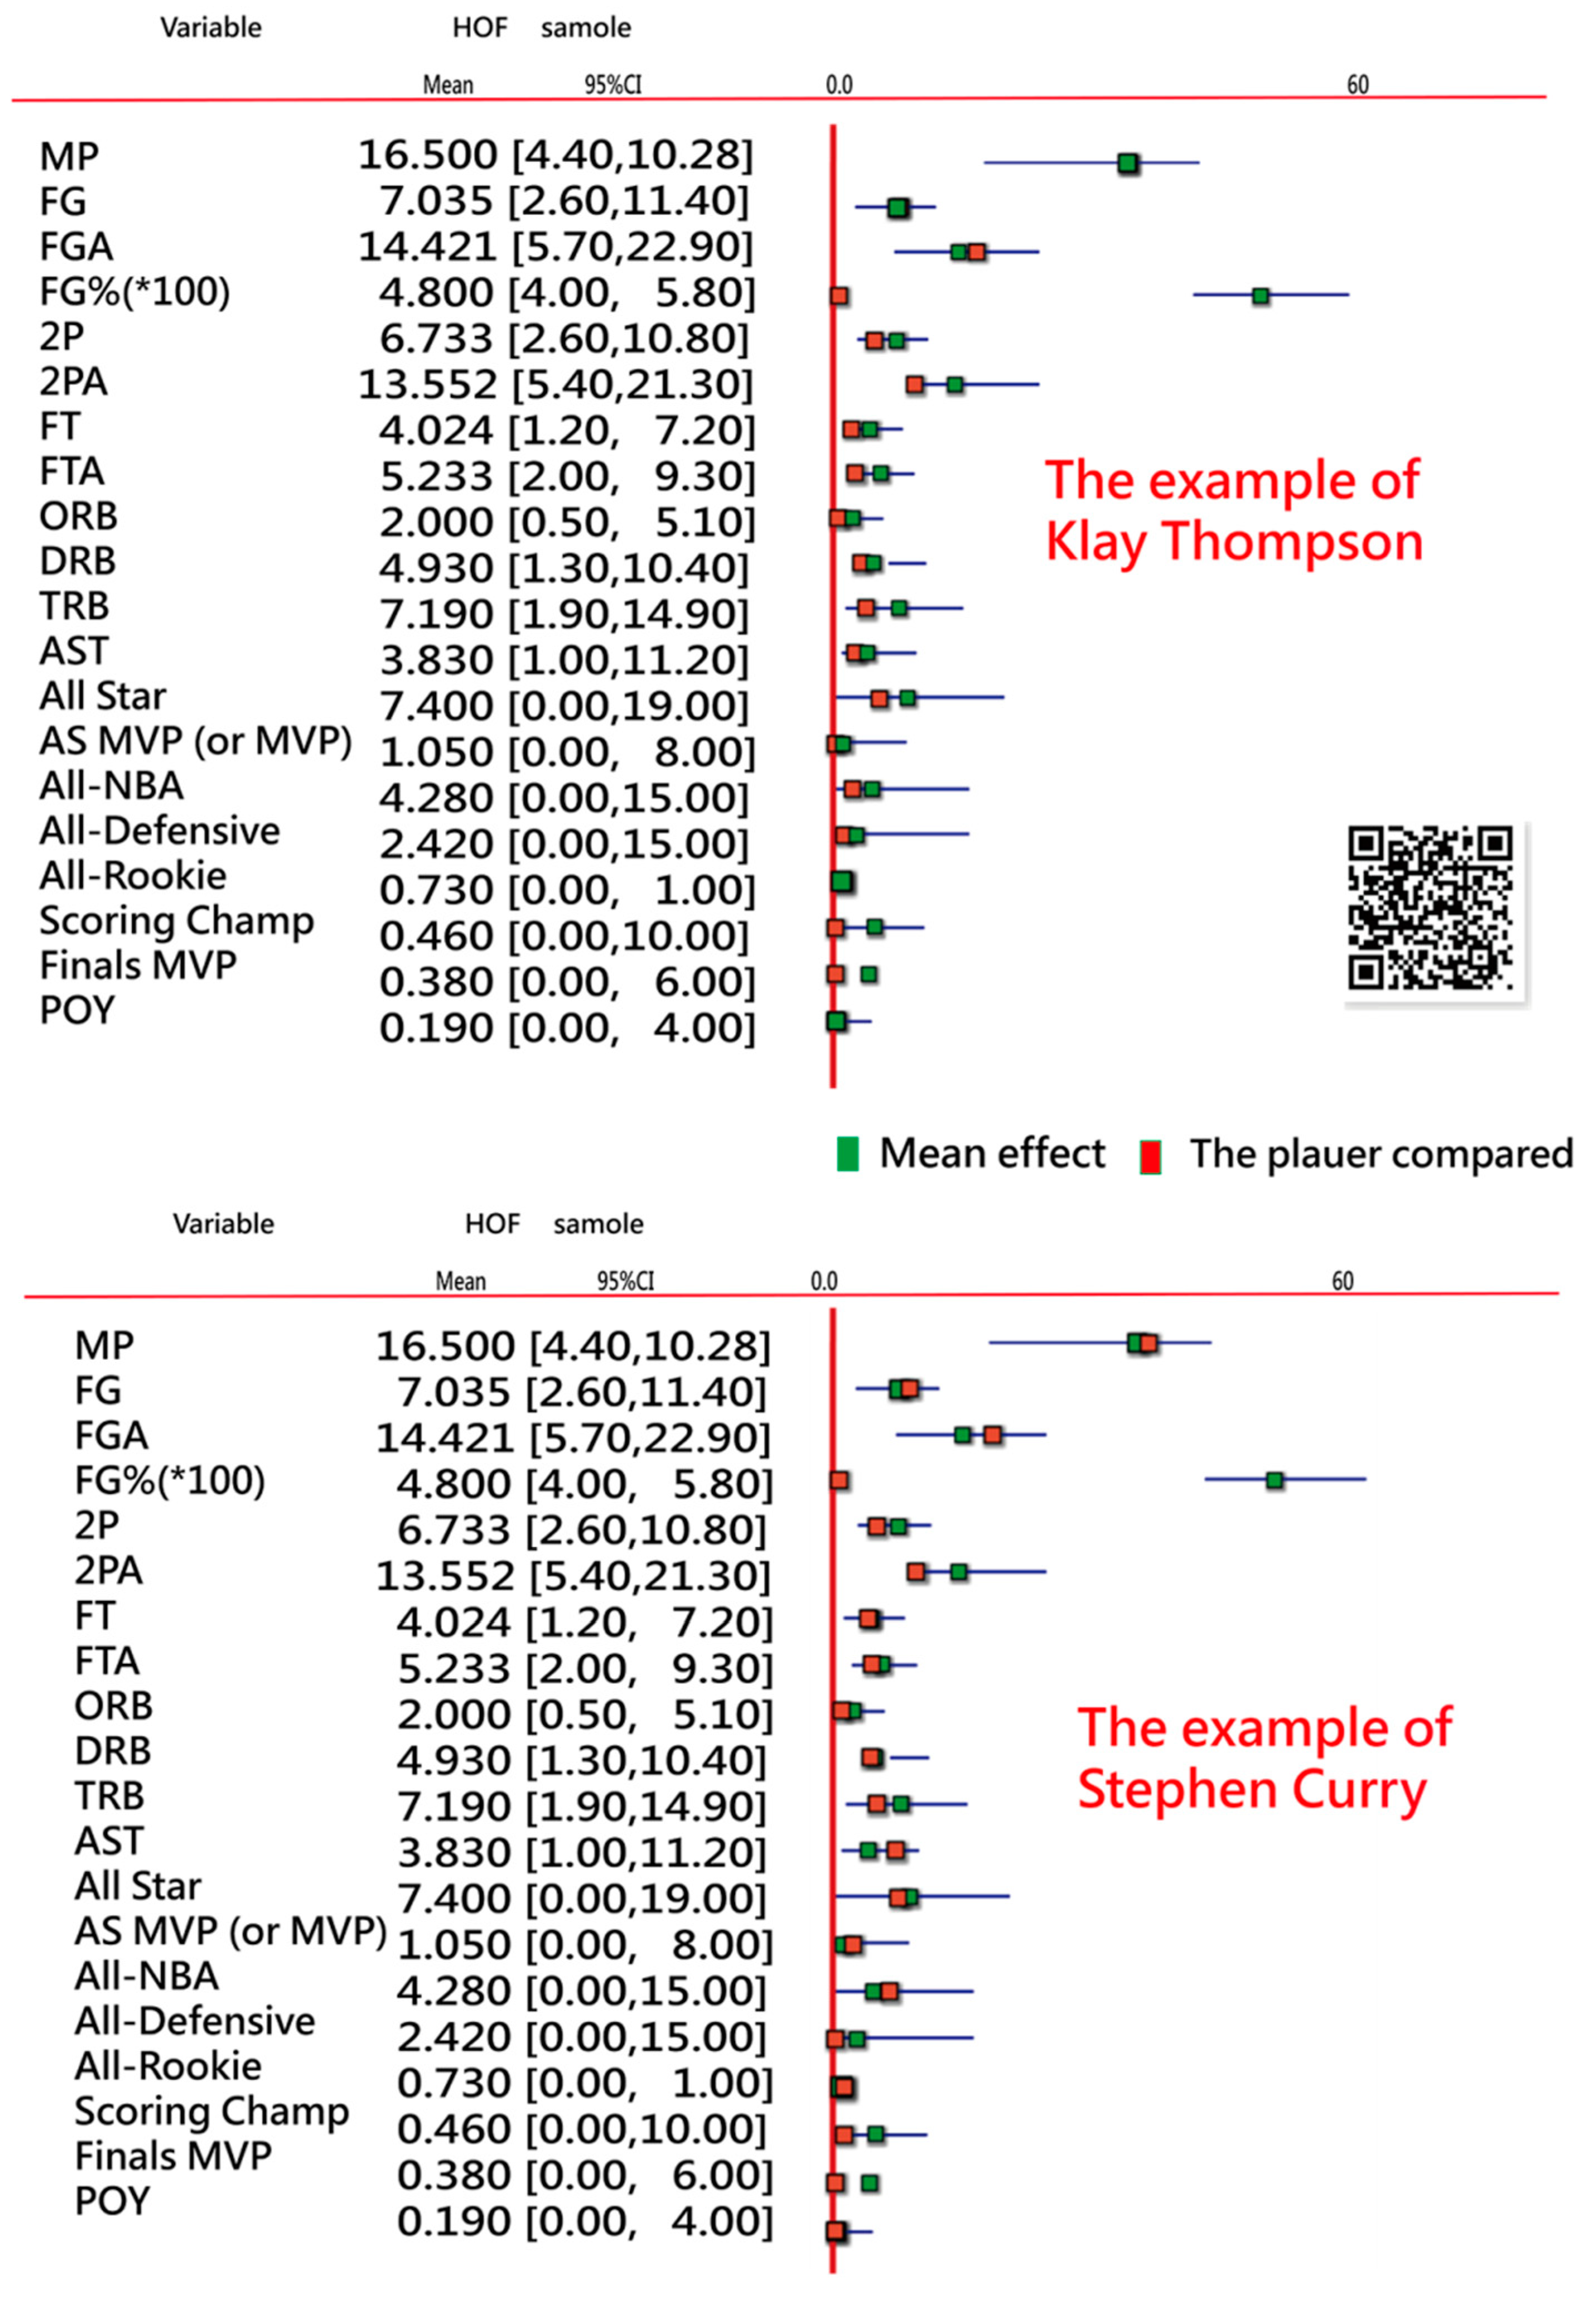
- Task 5:
- A Visual Display to Interpret the Reason for HOF or Non-HOF
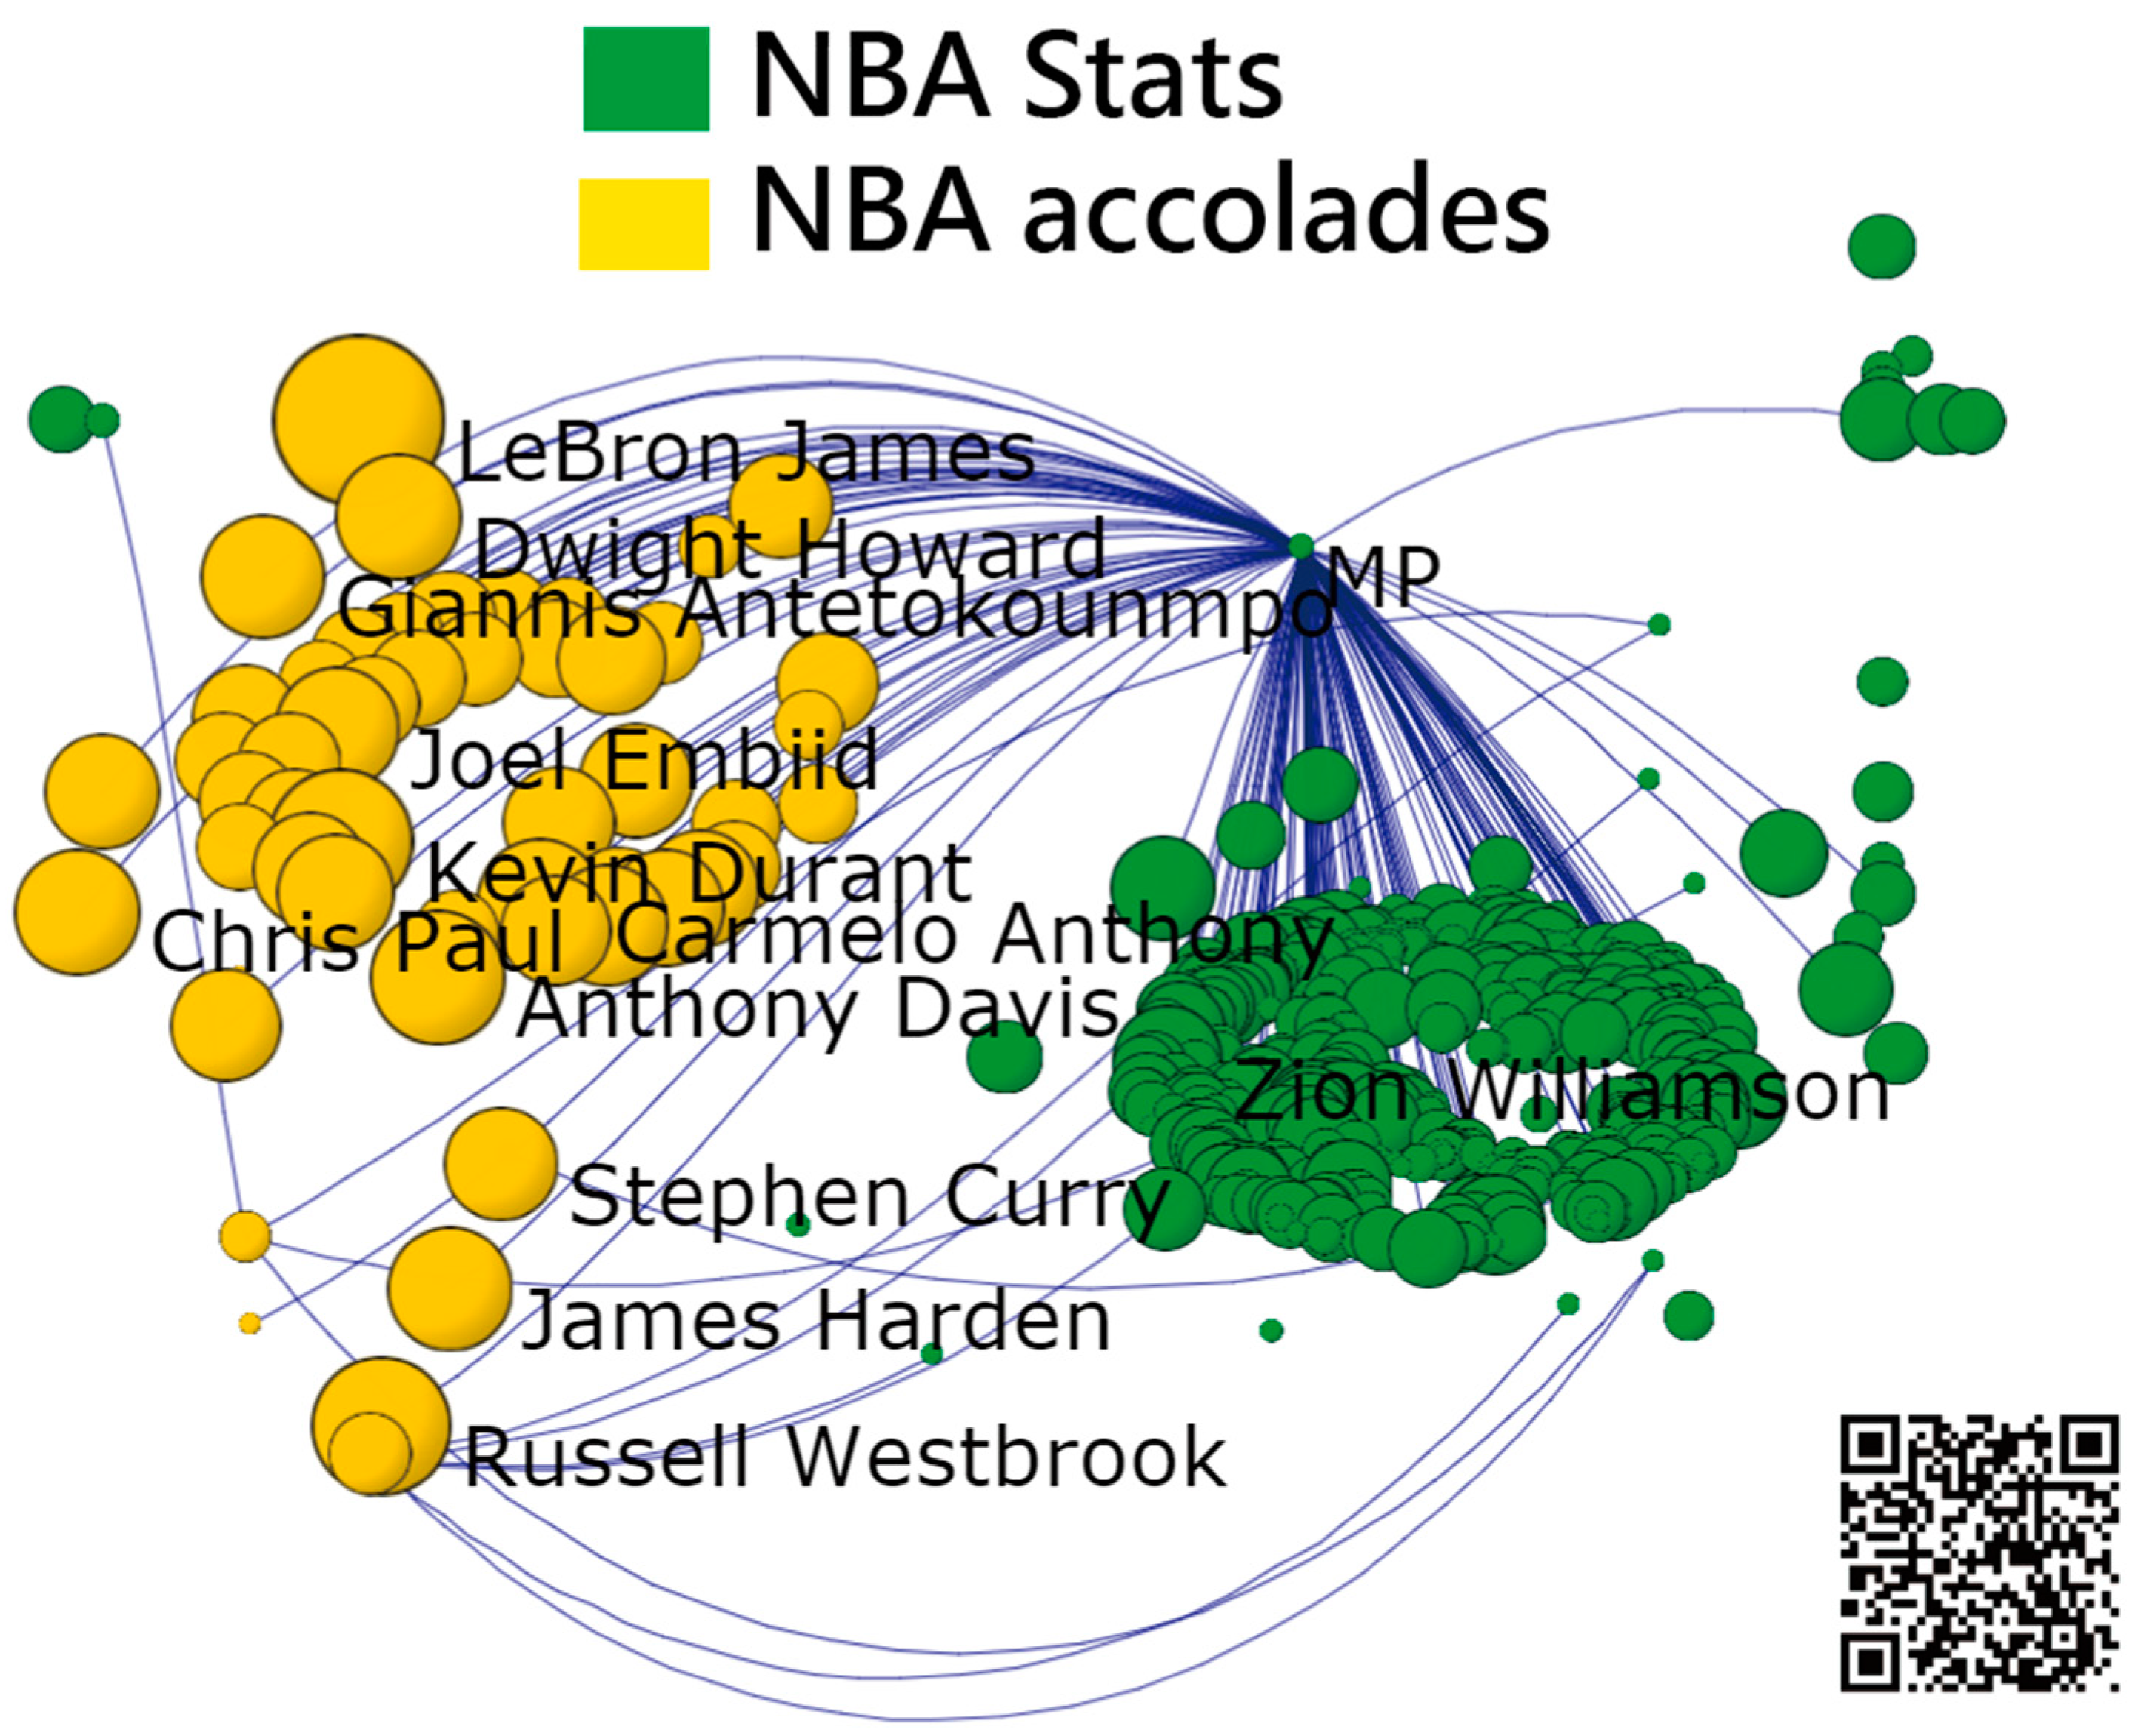
- Task 6:
- Using Social Network Analysis to Cluster the Active NBA players
2.4. Statistical Tools and Data Analysis
3. Results
3.1. Descriptive Statistics
3.2. Model Buiding and Model Comparison
3.2.1. Task 1: Selection of Featured Variables
3.2.2. Task 2: Comparison of Accuracies between the Two ANN and CNN Models
3.3. HOF Prediction and APP Development
3.3.1. Task 3: Unexpected Classifications of HOF in NBA Players
3.3.2. Task 4: An App Developed for Predicting HOF
3.4. Data Interpretations and the Characteristics of Active NBA Players
3.4.1. Task 5: A Visual Display to Interpret the Reason for HOF or Non-HOF
3.4.2. Task 6: Using Social Network Analysis to Classify Active NBA Players
3.5. Online Dashboards Shown on Google Maps
4. Discussion
4.1. What This Knowledge Adds to What We Already Knew
4.2. What This Study Contributes to Current Knowledge
4.3. Strengths of This Study
- The first peer-review study applied the ANN and the CNN to predict the active NBA players inducted into the HOF. The evidence shows the prediction accuracy (up to 7.14%) higher than the traditional linear regression models [17].
- The study was conducted under Microsoft Excel that is familiar to ordinary readers who can replicate the study on their own with MP4 video, ANN/CNN modules, and the original data are provided in Appendix A and Appendix B.
4.4. Implications of the Results and Suggested Actions
4.5. Limitations
5. Conclusions
Author Contributions
Funding
Institutional Review Board Statement
Informed Consent Statement
Data Availability Statement
Acknowledgments
Conflicts of Interest
Appendix A
Appendix B
References
- The Naismith Memorial Basketball Hall of Fame. Available online: https://en.wikipedia.org/wiki/Naismith_Memorial_Basketball_Hall_of_Fame (accessed on 10 March 2021).
- Benjamin, J. 10 Undeserving NBA Players in the Basketball Hall of Fame. Available online: https://bleacherreport.com/articles/815135-dennis-rodman-and-10-undeserving-nba-hall-of-famers (accessed on 10 March 2021).
- Naismith Memorial Basketball Hall of Fame. Naismith Memorial Basketball Hall of Fame Announces Modifications to its Enshrinement Process Beginning with the Class of 2018. Available online: http://www.hoophall.com/news/naismith-memorial-basketball-hall-of-fame-announces-modifications-to-its-enshrinement-process-beginning-with-the-class-of-2018/ (accessed on 10 March 2021).
- Lee, E.T. A Computer Program for Linear Logistic Regression Analysis. Comput Programs Biomed. 1974, 4, 80–92. [Google Scholar] [CrossRef] [PubMed]
- Chaabouni, R.; Kharitonov, E.; Dupoux, E.; Baroni, M. Communicating Artificial Neural Networks Develop Efficient Color-naming Systems. Proc. Natl. Acad. Sci. USA 2021, 118, e2016569118. [Google Scholar] [CrossRef] [PubMed]
- Holgate, K. NBA Hall of Fame Probability Analysis (Linear Regression in R). Available online: https://kyleholgate.com/nba-hall-of-fame-probability-analysis-linear-regression/ (accessed on 10 March 2021).
- Basketball-reference. Hall of Fame probability. Available online: https://www.basketball-reference.com/about/hof_prob.html (accessed on 10 March 2021).
- Zhang, Z.; Lim, G.; Falissard, L.; Morgand, C.; Roussel, S.; Imbaud, C.; Ghosn, W.; Bounebache, K.; Rey, G. A Deep Artificial Neural Network−Based Model for Prediction of Underlying Cause of Death from Death Certificates: Algorithm Development and Validation. JMIR Med. Inform. 2020, 8, e17125. [Google Scholar] [CrossRef]
- Frenkenfield, J. Artificial Neural Network (ANN). Available online: https://www.investopedia.com/terms/a/artificial-neural-networks-ann.asp (accessed on 10 October 2020).
- Normando, E.M.; Yap, T.E.; Maddison, J.; Miodragovic, S.; Bonetti, P.; Almonte, M.; Mohammad, N.G.; Ameen, S.; Crawley, L.; Ahmed, F.; et al. A CNN-aided method to predict glaucoma progression using DARC (Detection of Apoptosing Retinal Cells). Expert Rev. Mol. Diagn. 2020, 20, 737–748. [Google Scholar] [CrossRef]
- Ravi, D.; Wong, C.; Deligianni, F.; Berthelot, M.; Andreu-Perez, J.; Lo, B.; Yang, G.-Z. Deep Learning for Health Informatics. IEEE J. Biomed. Health Inform. 2017, 21, 4–21. [Google Scholar] [CrossRef] [Green Version]
- Ma, S.-C.; Chou, W.; Chien, T.-W.; Chow, J.C.; Yeh, Y.-T.; Chou, P.-H.; Lee, H.-F. An App for Detecting Bullying of Nurses Using Convolutional Neural Networks and Web-Based Computerized Adaptive Testing: Development and Usability Study. JMIR mHealth uHealth 2020, 8, e16747. [Google Scholar] [CrossRef]
- Lee, Y.-L.; Chou, W.; Chien, T.-W.; Chou, P.-H.; Yeh, Y.-T.; Lee, H.-F.; Jen, T.-H. An App Developed for Detecting Nurse Burnouts Using the Convolutional Neural Networks in Microsoft Excel: Population-Based Questionnaire Study. JMIR Med Inform. 2020, 8, e16528. [Google Scholar] [CrossRef] [PubMed]
- Yan, Y.-H.; Chien, T.-W.; Yeh, Y.-T.; Chou, W.; Hsing, S.-C. An App for Classifying Personal Mental Illness at Workplace Using Fit Statistics and Convolutional Neural Networks: Survey-Based Quantitative Study. JMIR mHealth uHealth 2020, 8, e17857. [Google Scholar] [CrossRef]
- Tobore, I.; Liew, M.S.; Yuhang, L.; Al-Handarish, Y.; Kandwal, A.; Nie, Z.; Wang, B. Deep Learning Intervention for Health Care Challenges: Some Biomedical Domain Considerations. JMIR mHealth uHealth 2019, 7, e11966. [Google Scholar] [CrossRef]
- Kwon, S.; Hong, J.; Choi, E.-K.; Lee, E.; Hostallero, D.E.; Kang, W.J.; Lee, B.; Jeong, E.-R.; Koo, B.-K.; Oh, S.; et al. Deep Learning Approaches to Detect Atrial Fibrillation Using Photoplethysmographic Signals: Algorithms Development Study. JMIR mHealth uHealth 2019, 7, e12770. [Google Scholar] [CrossRef] [Green Version]
- Sathyanarayana, A.; Joty, S.; Fernandez-Luque, L.; Ofli, F.; Srivastava, J.; Elmagarmid, A.; Arora, T.; Taheri, S. Sleep Quality Prediction from Wearable Data Using Deep Learning. JMIR mHealth uHealth 2016, 4, e125. [Google Scholar] [CrossRef]
- Mitchell, S.J.; Godoy, L.; Shabazz, K.; Horn, I.B. Internet and Mobile Technology Use Among Urban African American Parents: Survey Study of a Clinical Population. J. Med. Internet Res. 2014, 16, e9. [Google Scholar] [CrossRef] [PubMed]
- Basketball-Reference. The Stats and Accolades of Players in Their NBA Carrer. Available online: https://www.basketball-reference.com/players/ (accessed on 10 March 2021).
- Yan, Y.-H.; Chien, T.-W. The Use of Forest Plot to Identify Article Similarity and Differences in Characteristics between Journals Using Medical Subject Headings Terms. Medicine 2021, 100, e24610. [Google Scholar] [CrossRef] [PubMed]
- Wang, L.-Y.; Chien, T.-W.; Chou, W. Using the IPcase Index with Inflection Points and the Corresponding Case Numbers to Identify the Impact Hit by COVID-19 in China: An Observation Study. Int. J. Environ. Res. Public Health 2021, 18, 1994. [Google Scholar] [CrossRef]
- Zhao, Z.; Peng, H.; Lan, C.; Zheng, Y.; Fang, L.; Li, J. Imbalance Learning for the Prediction of N6-Methylation Sites in mRNAs. BMC Genom. 2018, 19, 1–10. [Google Scholar] [CrossRef]
- Lei, T.; Sun, H.; Kang, Y.; Zhu, F.; Liu, H.; Zhou, W.; Wang, Z.; Li, D.; Li, Y.; Hou, T. ADMET Evaluation in Drug Discovery. 18. Reliable Prediction of Chemical-Induced Urinary Tract Toxicity by Boosting Machine Learning Approaches. Mol. Pharm. 2017, 14, 3935–3953. [Google Scholar] [CrossRef] [PubMed]
- Li, L.; Xiong, Y.; Zhang, Z.-Y.; Guo, Q.; Xu, Q.; Liow, H.-H.; Zhang, Y.-H.; Wei, D.-Q. Improved Feature-based Prediction of SNPs in Human Cytochrome P450 Enzymes. Interdiscip. Sci. Comput. Life Sci. 2015, 7, 65–77. [Google Scholar] [CrossRef]
- Wang, X.; Jin, Y.; Zhang, Q. DeepPred-SubMito: A Novel Submitochondrial Localization Predictor Based on Multi-Channel Convolutional Neural Network and Dataset Balancing Treatment. Int. J. Mol. Sci. 2020, 21, 5710. [Google Scholar] [CrossRef] [PubMed]
- Wolins, L.; Wright, B.D.; Rasch, G. Probabilistic Models for some Intelligence and Attainment Tests. J. Am. Stat. Assoc. 1982, 77, 220. [Google Scholar] [CrossRef]
- Andrich, D. A Rating Formulation for Ordered Response Categories. Psychometrika 1978, 43, 561–573. [Google Scholar] [CrossRef]
- Yie, K.-Y.; Chien, T.-W.; Yeh, Y.-T.; Chou, W.; Su, S.-B. Using Social Network Analysis to Identify Spatiotemporal Spread Patterns of COVID-19 around the World: Online Dashboard Development. Int. J. Environ. Res. Public Health 2021, 18, 2461. [Google Scholar] [CrossRef] [PubMed]
- Soheili, F.; Shen, L.; Kan, W.-C.; Chou, W.; Chien, T.-W.; Yeh, Y.-T.; Chou, P.-H. The Most-Cited Authors Who Published Papers in JMIR mHealth and uHealth Using the Authorship-Weighted Scheme: Bibliometric Analysis. JMIR mHealth uHealth 2020, 8, e11567. [Google Scholar] [CrossRef]
- Chien, T.W. Figure 2 in This Study. Available online: http://www.healthup.org.tw/gps/NBAHOF2021.htm (accessed on 10 March 2021).
- Chien, T.W. 189 Training Sample Used in This Study. Available online: http://www.healthup.org.tw/html100/nbahof100sample.htm (accessed on 10 March 2021).
- Chien, T.W. 707 Active NBA Players in This Study. Available online: http://www.healthup.org.tw/html100/nbahof100.htm (accessed on 10 March 2021).
- Chien, T.W. Figure 3 in This Study. Available online: http://www.healthup.org.tw/gps/NBAHOFaberrant.htm (accessed on 10 March 2021).
- Chien, T.W. HOF Assessment with a Batch File. Available online: http://www.healthup.org.tw/irs/annnbahof2021.asp (accessed on 10 March 2021).
- Chien, T.W. HOF Assessment with Step-by-step Approach. Available online: http://www.healthup.org.tw/irs/irsin_e.asp?type1=97 (accessed on 10 March 2021).
- Chien, T.W. Figure 5 in This Study. Available online: http://www.healthup.org.tw/gps/nbahofcomparison2.asp (accessed on 10 March 2021).
- Chien, T.W. Figure 6 in This Study. Available online: http://www.healthup.org.tw/gps/nbahofpajek.htm (accessed on 10 March 2021).
- Swinton, E. Hall of Fame Tiers: Ranking Active NBA Players Most Likely to Be Inducted. Available online: https://www.si.com/nba/2020/04/14/nba-hall-of-fame-tiers (accessed on 10 March 2021).
- Bailey, A. How Many Current NBA Players Are Really Future Hall of Famers? Available online: https://bleacherreport.com/articles/2852036-how-many-current-nba-players-are-really-future-hall-of-famers (accessed on 10 March 2021).
- Sportingcharts. The Definition of Offensive Win Shares (OWS). Available online: https://www.sportingcharts.com/dictionary/nba/offensive-win-shares-ows.aspx (accessed on 10 March 2021).
- Levy, L. The Whiteboard: Ranking the NBA’s Active, Fringe Hall-of-Famers. Available online: https://fansided.com/2021/02/08/nba-ranking-active-fringe-hall-of-famers/ (accessed on 10 March 2021).
- Hoophall. Naismith Memorial Basketball Hall of Fame Announces 14 Finalists for Class of 2021. Available online: https://www.hoophall.com/news/naismith-memorial-basketball-hall-of-fame-announces-14-finalists-for-class-of-2021-election/ (accessed on 10 March 2021).
- NBCsports. Top 10 Active NBA Players Who are Already Hall of Fame Worthy. Available online: https://www.nbcsports.com/bayarea/warriors/top-10-active-nba-players-who-are-already-hall-fame-worthy (accessed on 10 March 2021).
- Rohrbach, B. The 10 Active NBA Players Who are Hall of Fame Locks and Everyone on the Bubble. Available online: https://sports.yahoo.com/the-10-active-nba-players-who-are-hall-of-fame-locks-and-everyone-on-the-bubble-194436975.html (accessed on 10 March 2021).
- Basketball-Reference. NBA & ABA Career Leaders and Records for Win Shares. Available online: https://www.basketball-reference.com/leaders/ws_career.html (accessed on 10 March 2021).
- Fromal, A. Understanding the NBA: Explaining Advanced Offensive Stats and Metrics. Available online: https://bleacherreport.com/articles/1039116-understanding-the-nba-explaining-advanced-offensive-stats-and-metrics (accessed on 10 March 2021).
- Mellors, B.O.L.; Spear, A.M.; Howle, C.R.; Curtis, K.; Macildowie, S.; Dehghani, H. Machine Learning Utilising Spectral Derivative Data Improves Cellular Health Classification through Hyperspectral Infra-red Spectroscopy. PLoS ONE 2020, 15, e0238647. [Google Scholar] [CrossRef]
- Singh, V.K.; Maurya, N.S.; Mani, A.; Yadav, R.S. Machine Learning Method Using Position-specific Mutation Based Classification Outperforms One Hot Coding for Disease Severity Prediction in Haemophilia ‘A’. Genomics 2020, 112, 5122–5128. [Google Scholar] [CrossRef]
- Mohammadi, R.; Jain, S.; Namin, A.T.; Heller, M.S.; Palacholla, R.; Kamarthi, S.; Wallace, B. Predicting Unplanned Readmissions Following a Hip or Knee Arthroplasty: Retrospective Observational Study. JMIR Med. Inform. 2020, 8, e19761. [Google Scholar] [CrossRef] [PubMed]
- Chien, T.-W.; Lin, W.-S.; De Beurs, D.; Bidmon, S. Improving Inpatient Surveys: Web-Based Computer Adaptive Testing Accessed via Mobile Phone QR Codes. JMIR Med. Inform. 2016, 4, e8. [Google Scholar] [CrossRef] [Green Version]
- Hulin, C.L.; Drasgow, F.; Parsons, C. Item Response Theory: Applications to Psychological Measurement; Dow & Jones Irwin: Homewood, IL, USA, 1983. [Google Scholar]


| Variable | Non-HOF | HOF | n | % |
|---|---|---|---|---|
| A: All downloaded data | 4728 | 152 | 4880 | 3.11 |
| Testing retired player | 4021 | 152 | 4173 | 3.64 |
| Training sample | 113 | 85 | 198 | 42.93 |
| * B: Shoots | ||||
| Left hand | 237 | 14 | 251 | 6 |
| Right hand | 3784 | 138 | 3922 | 94 |
| *C: Career length | ||||
| Mean | 4.7 | 12.2 | ||
| Standard deviation(SD) | 4.3 | 4.0 | ||
| * D: Body | ||||
| Height(cm) | 197.9 | 198.8 | ||
| Weight(kg) | 93.9 | 94.0 | ||
| * E: Award | ||||
| All star | 0.18 | 6.34 | ||
| All NBA MVP | 0.04 | 4.40 | ||
| All-Defensive | 0.05 | 1.59 | ||
| All-Rookie | 0.08 | 0.46 | ||
| Scoring Champ | 0.00 | 0.39 | ||
| NBA Champ | 0.15 | 1.57 | ||
| Finals MVP | 0.00 | 0.24 | ||
| BLK(blocks) | 0.01 | 0.09 | ||
| TRB(total rebounds) | 0.00 | 0.32 | ||
| Sixth Man | 0.00 | 0.01 | ||
| AST Champ | 0.00 | 0.32 | ||
| POY(play of the year) | 0.00 | 0.11 | ||
| STL Champ | 0.01 | 0.09 |
| Model | n | SENS | SPEC | Precision | F1 Score | ACC | AUC | 95%CI |
|---|---|---|---|---|---|---|---|---|
| ANN | ||||||||
| Training set | 198 | 0.92 | 0.95 | 0.93 | 0.92 | 0.93 | 0.93 | 0.90–0.97 |
| Testing retired | 3975 | 0.99 | 0.99 | |||||
| Testing active | 707 | 0.96 | 0.96 | |||||
| CNN | ||||||||
| Training set | 198 | 0.91 | 0.91 | 0.93 | 0.92 | 0.91 | 0.91 | 0.87–0.95 |
Publisher’s Note: MDPI stays neutral with regard to jurisdictional claims in published maps and institutional affiliations. |
© 2021 by the authors. Licensee MDPI, Basel, Switzerland. This article is an open access article distributed under the terms and conditions of the Creative Commons Attribution (CC BY) license (https://creativecommons.org/licenses/by/4.0/).
Share and Cite
Chou, P.-H.; Chien, T.-W.; Yang, T.-Y.; Yeh, Y.-T.; Chou, W.; Yeh, C.-H. Predicting Active NBA Players Most Likely to Be Inducted into the Basketball Hall of Famers Using Artificial Neural Networks in Microsoft Excel: Development and Usability Study. Int. J. Environ. Res. Public Health 2021, 18, 4256. https://0-doi-org.brum.beds.ac.uk/10.3390/ijerph18084256
Chou P-H, Chien T-W, Yang T-Y, Yeh Y-T, Chou W, Yeh C-H. Predicting Active NBA Players Most Likely to Be Inducted into the Basketball Hall of Famers Using Artificial Neural Networks in Microsoft Excel: Development and Usability Study. International Journal of Environmental Research and Public Health. 2021; 18(8):4256. https://0-doi-org.brum.beds.ac.uk/10.3390/ijerph18084256
Chicago/Turabian StyleChou, Po-Hsin, Tsair-Wei Chien, Ting-Ya Yang, Yu-Tsen Yeh, Willy Chou, and Chao-Hung Yeh. 2021. "Predicting Active NBA Players Most Likely to Be Inducted into the Basketball Hall of Famers Using Artificial Neural Networks in Microsoft Excel: Development and Usability Study" International Journal of Environmental Research and Public Health 18, no. 8: 4256. https://0-doi-org.brum.beds.ac.uk/10.3390/ijerph18084256