
Social Environment and Healthy Investment Behavior: Joint Influence of Culture and Institution on China

Abstract
:1. Introduction
2. Materials and Methods
2.1. Literature Review and Research Hypotheses
2.2. Sample Selection
2.3. Variable Definitions
2.4. The Model
3. Results
3.1. Descriptive Statistics
3.2. Main Empirical Results
3.3. Robustness Test Results
4. Discussion
5. Conclusions
Author Contributions
Funding
Institutional Review Board Statement
Informed Consent Statement
Data Availability Statement
Conflicts of Interest
References
- Wei, S.; Xie, Z.; Zhang, X. From “made in China” to “innovated in China”: Necessity, prospect, and challenges. J. Econ. Perspect. 2017, 31, 49–70. [Google Scholar] [CrossRef] [Green Version]
- Barrios, S.; Gorg, H.; Strobl, E. Foreign direct investment, competition and industrial development in the host country. Eur. Econ. Rev. 2005, 49, 1761–1784. [Google Scholar] [CrossRef] [Green Version]
- Hoti, S. An empirical evaluation of international capital flows for developing countries. Math. Comput. Simul. 2004, 64, 143–160. [Google Scholar] [CrossRef]
- Xu, S.; Li, Y.; Zhang, J.; Wang, Y.; Ma, X.; Liu, H.; Wang, H.; Tao, Y. Do foreign direct investment and environmental regulation improve green technology innovation? An empirical analysis based on panel data from Chinese manufacturing industry. Environ. Sci. Pollut. Res. 2021, 28, 55302–55314. [Google Scholar] [CrossRef] [PubMed]
- Loungani, P.; Stekler, H.; Tamirisa, N. Information rigidity in growth forecasts: Some cross-country evidence. Int. J. Forecast. 2013, 29, 605–621. [Google Scholar] [CrossRef]
- Liu, Q.; Wang, S.; Zhang, W.; Zhan, D.; Li, J. Does foreign direct investment affect environmental pollution in China’s cities? A spatial econometric perspective. Sci. Total Environ. 2018, 613–614, 521–529. [Google Scholar] [CrossRef] [PubMed]
- Dong, Y.; Shao, S.; Zhang, Y. Does FDI have energy-saving spillover effect in China? A perspective of energy-biased technical change. J. Clean. Prod. 2019, 234, 436–450. [Google Scholar] [CrossRef]
- Zhang, W.; Li, G.; Uddin, M.K.; Guo, S. Environmental regulation, foreign investment behavior, and carbon emissions for 30 provinces in China. J. Clean. Prod. 2020, 248, 119208. [Google Scholar] [CrossRef]
- Kim, Y.; Rhee, D. Do stringent environmental regulations attract foreign direct investment in developing countries? Evidence on the “race to the top” from cross-country panel data. Emerg. Mark. Financ. Trade 2019, 55, 2796–2808. [Google Scholar] [CrossRef]
- Yu, X.; Li, Y. Effect of environmental regulation policy tools on the quality of foreign direct investment: An empirical study of China. J. Clean. Prod. 2020, 270, 122346. [Google Scholar] [CrossRef]
- Blalock, G.; Simon, D.H. Do all firms benefit equally from downstream FDI? The moderating effect of local suppliers’ capabilities on productivity gains. J. Int. Bus. Stud. 2009, 40, 1095–1112. [Google Scholar] [CrossRef]
- Ayyagari, M.; Kosová, R. Does FDI facilitate domestic entry? Evidence from the Czech Republic. Rev. Int. Econ. 2010, 18, 14–29. [Google Scholar] [CrossRef]
- Yu, M. Processing trade, tariff reductions and firm productivity: Evidence from Chinese firms. Econ. J. 2015, 125, 943–988. [Google Scholar] [CrossRef]
- Anwar, S.; Sun, S. Heterogeneity and curvilinearity of FDI-related productivity spillovers in China’s manufacturing sector. Econ. Model. 2014, 41, 23–32. [Google Scholar] [CrossRef]
- Javorcik, B.S. Does foreign direct investment increase the productivity of domestic firms? In search of spillovers through backward linkages. Am. Econ. Rev. 2004, 94, 605–627. [Google Scholar] [CrossRef] [Green Version]
- Hofstede, G. The cultural relativity of organizational practices and theories. J. Int. Bus. Stud. 1983, 14, 75–89. [Google Scholar] [CrossRef] [Green Version]
- Doidge, C.; Karolyi, G.A.; Stulz, R.M. Why do countries matter so much for corporate governance? J. Financ. Econ. 2007, 86, 1–39. [Google Scholar] [CrossRef] [Green Version]
- Li, J.; Harrison, J.R. National culture and the composition and leadership structure of boards of directors. Corp. Gov. 2008, 16, 375–385. [Google Scholar] [CrossRef]
- Li, K.; Griffin, D.; Yue, H.; Zhao, L. How does culture influence corporate risk-taking? J. Corp. Financ. 2013, 23, 1–22. [Google Scholar] [CrossRef]
- Shao, L.; Kwok, C.; Guedhami, O. National culture and dividend policy. J. Int. Bus. Stud. 2010, 41, 1391–1414. [Google Scholar] [CrossRef]
- Peng, M.W. Institutional transitions and strategic choices. Acad. Manag. Rev. 2003, 28, 275–296. [Google Scholar] [CrossRef] [Green Version]
- Zhang, J.; Zhou, C.; Ebbers, H. Completion of Chinese overseas acquisitions: Institutional perspectives and evidence. Int. Bus. Rev. 2011, 20, 226–238. [Google Scholar] [CrossRef]
- Banalieva, E.R.; Dhanaraj, C. Home-region orientation in international expansion strategies. J. Int. Bus. Stud. 2013, 44, 89–116. [Google Scholar] [CrossRef]
- Hofstede, G. Motivation, leadership, and organization: Do American theories apply abroad? Organ. Dyn. 1980, 9, 42–63. [Google Scholar] [CrossRef]
- Shenkar, O. Cultural distance revisited: Towards a more rigorous conceptualization and measurement of cultural differences. J. Int. Bus. Stud. 2001, 32, 519–535. [Google Scholar] [CrossRef]
- Putting Qualitative International Business Research in Context(s). Available online: https://0-link-springer-com.brum.beds.ac.uk/article/10.1057/s41267-021-00478-3 (accessed on 15 December 2021).
- Gokmenoglu, K.; Kirikkaleli, D.; Eren, B.M. Time and frequency domain causality testing: The causal linkage between FDI and economic risk for the case of Turkey. J. Int. Trade Econ. Dev. 2019, 28, 649–667. [Google Scholar] [CrossRef]
- Beugelsdijk, S.; Ambos, B.; Nell, P.C. Conceptualizing and measuring distance in international business research: Recurring questions and best practice guidelines. J. Int. Bus. Stud. 2018, 49, 1113–1137. [Google Scholar] [CrossRef]
- Castro, C.; Neira, E. Knowledge transfer: Analysis of three internet acquisition. Int. J. Hum. Resour. Manag. 2005, 16, 120–135. [Google Scholar] [CrossRef]
- Chakrabarti, R.; Gupta-Mukherjee, S.; Jayaraman, N. Mars–Venus marriages: Culture and cross-border M&A. J. Int. Bus. Stud. 2009, 40, 216–236. [Google Scholar]
- Scalera, V.G.; Mukherjee, D.; Piscitello, L. Ownership strategies in knowledge-intensive cross-border acquisitions: Comparing Chinese and Indian MNEs. Asia Pac. J. Manag. 2020, 37, 155–185. [Google Scholar] [CrossRef] [Green Version]
- Martin, X.; Salomon, R. Tacitness, learning, and international expansion: A study of foreign direct investment in a knowledge-intensive industry. Organ. Sci. 2003, 14, 297–311. [Google Scholar] [CrossRef]
- Teerikangas, S.; Very, P. The culture-performance relationship in M&A: From yes/no to how. Brit. J. Manage. 2006, 17, 31–48. [Google Scholar]
- Lu, J.W.; Beamish, P.W. International diversification and firm performance: The S-Curve hypothesis. Acad. Manage. J. 2004, 47, 598–609. [Google Scholar]
- Ramasamy, B.; Yeung, M.; Laforet, S. China’s outward foreign direct investment: Location choice and firm ownership. J. Int. Bus. Stud. 2012, 47, 17–25. [Google Scholar] [CrossRef]
- Sarala, R.M.; Vaara, E. Cultural differences, convergence, and crossvergence as explanations of knowledge transfer in international acquisitions. J. Int. Bus. Stud. 2010, 41, 1365–1390. [Google Scholar] [CrossRef]
- North, D.C. Institutions. J. Econ. Perspect. 1991, 5, 97–112. [Google Scholar] [CrossRef]
- Ahsan, F.M.; Fuad, M.; Sinha, A.K. Seeking strategic assets within cross-border acquisition waves: A study of Indian firms. J. Int. Manag. 2021, 27, 100875. [Google Scholar] [CrossRef]
- Husted, B.; Montiel, I.; Christmann, P. Effects of local legitimacy on certification decisions to global and national CSR standards by multinational subsidiaries and domestic firms. J. Int. Bus. Stud. 2016, 47, 382–397. [Google Scholar] [CrossRef]
- Maitland, E.; Sammartino, A. Managerial cognition and internationalization. J. Int. Bus. Stud. 2015, 46, 733–760. [Google Scholar] [CrossRef]
- Zaheer, S. Overcoming the liability of foreignness. Acad. Manage. J. 1995, 38, 341–363. [Google Scholar]
- Dikova, D.; Sahib, P.R.; van Witteloostuijn, A. Cross-border acquisition abandonment and completion: The effect of institutional differences and organizational learning in the international business service industry, 1981–2001. J. Int. Bus. Stud. 2010, 41, 223–245. [Google Scholar] [CrossRef]
- Niittymies, A.; Pajunen, K. Cognitive foundations of firm internationalization: A systematic review and agenda for future research. Int. Bus. Rev. 2020, 29, 101654. [Google Scholar] [CrossRef]
- Audretsch, D.; Belitski, M. Frank Knight, uncertainty and knowledge spillover entrepreneurship. J. Inst. Econ. 2021, 17, 1005–1031. [Google Scholar] [CrossRef]
- Lewis, Y.; Bozos, K. Mitigating post-acquisition risk: The interplay of cross-border uncertainties. J. World Bus. 2019, 54, 100996. [Google Scholar] [CrossRef]
- Muehlfeld, K.; Sahib, P.R.; Witteloostuijn, A.V. A contextual theory of organizational learning from failures and successes: A study of acquisition completion in the global newspaper industry, 1981–2008. Strateg. Manage. J. 2012, 33, 938–964. [Google Scholar] [CrossRef]
- Estrin, S.; Baghdasaryan, D.; Meyer, K.E. The impact of institutional and human resource distance on international entry strategies. J. Manage. Stud. 2009, 46, 1171–1196. [Google Scholar] [CrossRef] [Green Version]
- Asmussen, C.G.; Hashai, N.; Delios, A. The coevolution of international scope and technological knowledge in MNCs. J. World Bus. 2022, 57, 101285. [Google Scholar] [CrossRef]
- Meyer, K.; Peng, M. Theoretical foundations of emerging economy business research. J. Int. Bus. Stud. 2016, 47, 3–22. [Google Scholar] [CrossRef]
- Nippa, M.; Reuer, J.J. On the future of international joint venture research. J. Int. Bus. Stud. 2019, 50, 555–597. [Google Scholar] [CrossRef]
- Brouthers, K. A retrospective on: Institutional, cultural and transaction cost influences on entry mode choice and performance. J. Int. Bus. Stud. 2013, 44, 14–22. [Google Scholar] [CrossRef]
- Beugelsdijk, S.; Kostova, T.; Kunst, V.E.; Spadafora, E.; van Essen, M. Cultural distance and firm internationalization: A meta-analytical review and theoretical implications. J. Manag. 2018, 44, 89–130. [Google Scholar] [CrossRef] [Green Version]
- Kim, J.U.; Aguilera, R.V. Foreign location choice: Review and extensions. Int. J. Manag. Rev. 2016, 18, 133–159. [Google Scholar] [CrossRef]
- Huang, Z.; Zhu, H.; Brass, D.J. Cross-border acquisitions and the asymmetric effect of power distance value difference on long-term post-acquisition performance. Strateg. Manage. J. 2017, 38, 972–991. [Google Scholar] [CrossRef]
- Klier, H.; Schwens, C.; Zapkau, F.B.; Dikova, D. Which resources matter how and where? A meta-analysis on firms’ foreign establishment mode choice. J. Manage. Stud. 2017, 54, 304–339. [Google Scholar] [CrossRef]
- Grøgaard, B.; Rygh, A.; Benito, G.R.G. Bringing corporate governance into internalization theory: State ownership and foreign entry strategies. J. Int. Bus. Stud. 2019, 50, 1310–1337. [Google Scholar] [CrossRef]
- Kostova, T.; Nell, P.C.; Hoenen, A.K. Understanding agency problems in headquarters-subsidiary relationships in multinational corporations: A contextualized model. J. Manag. 2018, 44, 2611–2637. [Google Scholar] [CrossRef] [Green Version]
- Bendersky, C.; Hays, N.A. Status conflict in groups. Organ. Sci. 2012, 21, 323–340. [Google Scholar] [CrossRef] [Green Version]
- van Bunderen, L.; Greer, L.L.; van Knippenberg, D. When interteam conflict spirals into intrateam power struggles: The pivotal role of team power structures. Acad. Manage. J. 2018, 61, 1100–1130. [Google Scholar] [CrossRef] [Green Version]
- Smimou, K. Regional equity market conditions and cross-border mergers and acquisitions (M&A): Evidence from the BRIC, Eastern Europe, and Africa. Int. J. Emerg. Mark. 2015, 10, 535–559. [Google Scholar]
- Chao, M.C.; Kumar, V. The impact of institutional distance on the international diversity-performance relationship, J. World Bus. 2010, 45, 93–103. [Google Scholar] [CrossRef]
- Acemoglu, D.; Johnson, S. Unbundling institutions. J. Political Econ. 2005, 113, 949–995. [Google Scholar] [CrossRef] [Green Version]
- Sivakumar, K.; Nakata, C. The stampede toward Hofstede’s framework: Avoiding the sample design pit in cross-cultural research. J. Int. Bus. Stud. 2001, 32, 555–574. [Google Scholar] [CrossRef]
- Kirkman, B.L.; Lowe, K.B.; Gibson, C.B. A quarter century of culture’s consequences: A review of empirical research incorporating Hofstede’s cultural values framework. J. Int. Bus. Stud. 2006, 37, 285–320. [Google Scholar] [CrossRef]
- Chui, A.W.; Kwok, C.Y. National culture and life insurance consumption. J. Int. Bus. Stud. 2008, 39, 88–101. [Google Scholar] [CrossRef]
- Slangen, A.L.; Beugelsdijk, S. The impact of institutional hazards on foreign multinational activity: A contingency perspective. J. Int. Bus. Stud. 2010, 41, 980–995. [Google Scholar] [CrossRef]
- Pogrebnyakov, N.; Maitland, C.F. Institutional distance and the internationalization process: The case of mobile operators. J. Int. Manag. 2011, 17, 68–82. [Google Scholar] [CrossRef]
- Amighini, A. China and India in the international fragmentation of automobile production. China Econ. Rev. 2012, 23, 325–341. [Google Scholar] [CrossRef]
- Anderson, J.; van Wincoop, E. Gravity with gravitas: A solution to the border puzzle. Am. Econ. Rev. 2003, 93, 170–192. [Google Scholar] [CrossRef] [Green Version]
- Stulz, R.M.; Williamson, R. Culture, openness, and finance. J. Financ. Econ. 2003, 70, 313–349. [Google Scholar] [CrossRef] [Green Version]
- Ahern, K.R.; Daminelli, D.; Fracassi, C. Lost in translation? The effect of cultural values on mergers around the world. J. Financ. Econ. 2015, 117, 165–189. [Google Scholar] [CrossRef]
- Kogut, B.; Singh, H. The effect of national culture on the choice of entry mode. J. Int. Bus. Stud. 1988, 19, 411–432. [Google Scholar] [CrossRef]
- Bertrand, O.; Zuniga, P. R&D and M&A: Are cross-border M&A different? An investigation on OECD countries. Int. J. Ind. Organ. 2006, 24, 401–423. [Google Scholar]
- Brouthers, K.D.; Brouthers, L.E.; Werner, S. Real options, international entry mode choice and performance. J. Manage. Stud. 2008, 45, 936–960. [Google Scholar] [CrossRef]
- Brouthers, K.D.; Dikova, D. Acquisitions and real options: The greenfield alternative. J. Manage. Stud. 2010, 47, 1048–1071. [Google Scholar] [CrossRef]


| Variable | Definition | Source |
|---|---|---|
| TPI | The country’s investment in China divided by its total portfolio investment | The International Monetary Fund website (IMF) |
| PDI | Hofstede’s cultural index on power distance. | Hofstede (2001) |
| IDV | Hofstede’s cultural index on individualism. | Hofstede (2001) |
| UAI | Hofstede’s cultural index on uncertainty avoidance. | Hofstede (2001) |
| MAS | Hofstede’s cultural index on masculinity. | Hofstede (2001) |
| WGId | A composite index calculated based on corruption, government effectiveness, political stability, regulatory quality, rule of law and voice & accountability. | IMF |
| EFId | A composite index calculated based on business freedom, freer trade, fiscal freedom, monetary freedom, black market freedom and financial freedom, labor freedom, freedom corruption, government spending, property rights protection. | IMF |
| CGDP | China’s Gross Domestic Product value | The World Bank |
| GDP | Investing country’s Gross Domestic Product value | The World Bank |
| GDIST | The capital of the distance between the two countries | CEPII database |
| Comlang | If the two countries have a common official language, the value is 1, otherwise, it is 0 | CEPII database |
| Comrelig | If the two countries have a common religion, the value is 1, otherwise, it is 0 | CIA world Factbook |
| Comleg | If the two countries have a common legal system, the value is 1, otherwise, it is 0 | LLSV Law and finance |
| Contig | If the two countries have a common border, the value is 1, otherwise, it is 0 | CEPII database |
| INVES | The investor protection index | The World Bank |
| JUDI | Investor’s legal effectiveness index system | LLSV Law and finance |
| Variable | Mean | Median | Std |
|---|---|---|---|
| TPI | 0.018 | 0.00158 | 0.0478 |
| IDV | 44.33 | 37.50 | 24.58 |
| PDI | 56.47 | 62.00 | 22.53 |
| UAI | 63.83 | 68.50 | 25.28 |
| MAS | 49.44 | 51.00 | 19.70 |
| WGId | 0.635 | 0.76 | 0.93 |
| EFId | 66.87 | 68.05 | 11.26 |
| GDP | 1.4 × 10¹² | 3.8 × 10¹¹ | 2.99 × 10¹² |
| GDIST | 8678.09 | 7623.44 | 5005.00 |
| Comrelig | 0.69 | 1.00 | 0.464 |
| Comleg | 0.09 | 0.00 | 0.28 |
| Comlang | 0.09 | 0.00 | 0.28 |
| Contig | 0.09 | 0.00 | 0.28 |
| Inves | 6.45 | 6.50 | 1.17 |
| Judi | 7.66 | 8.00 | 2.21 |
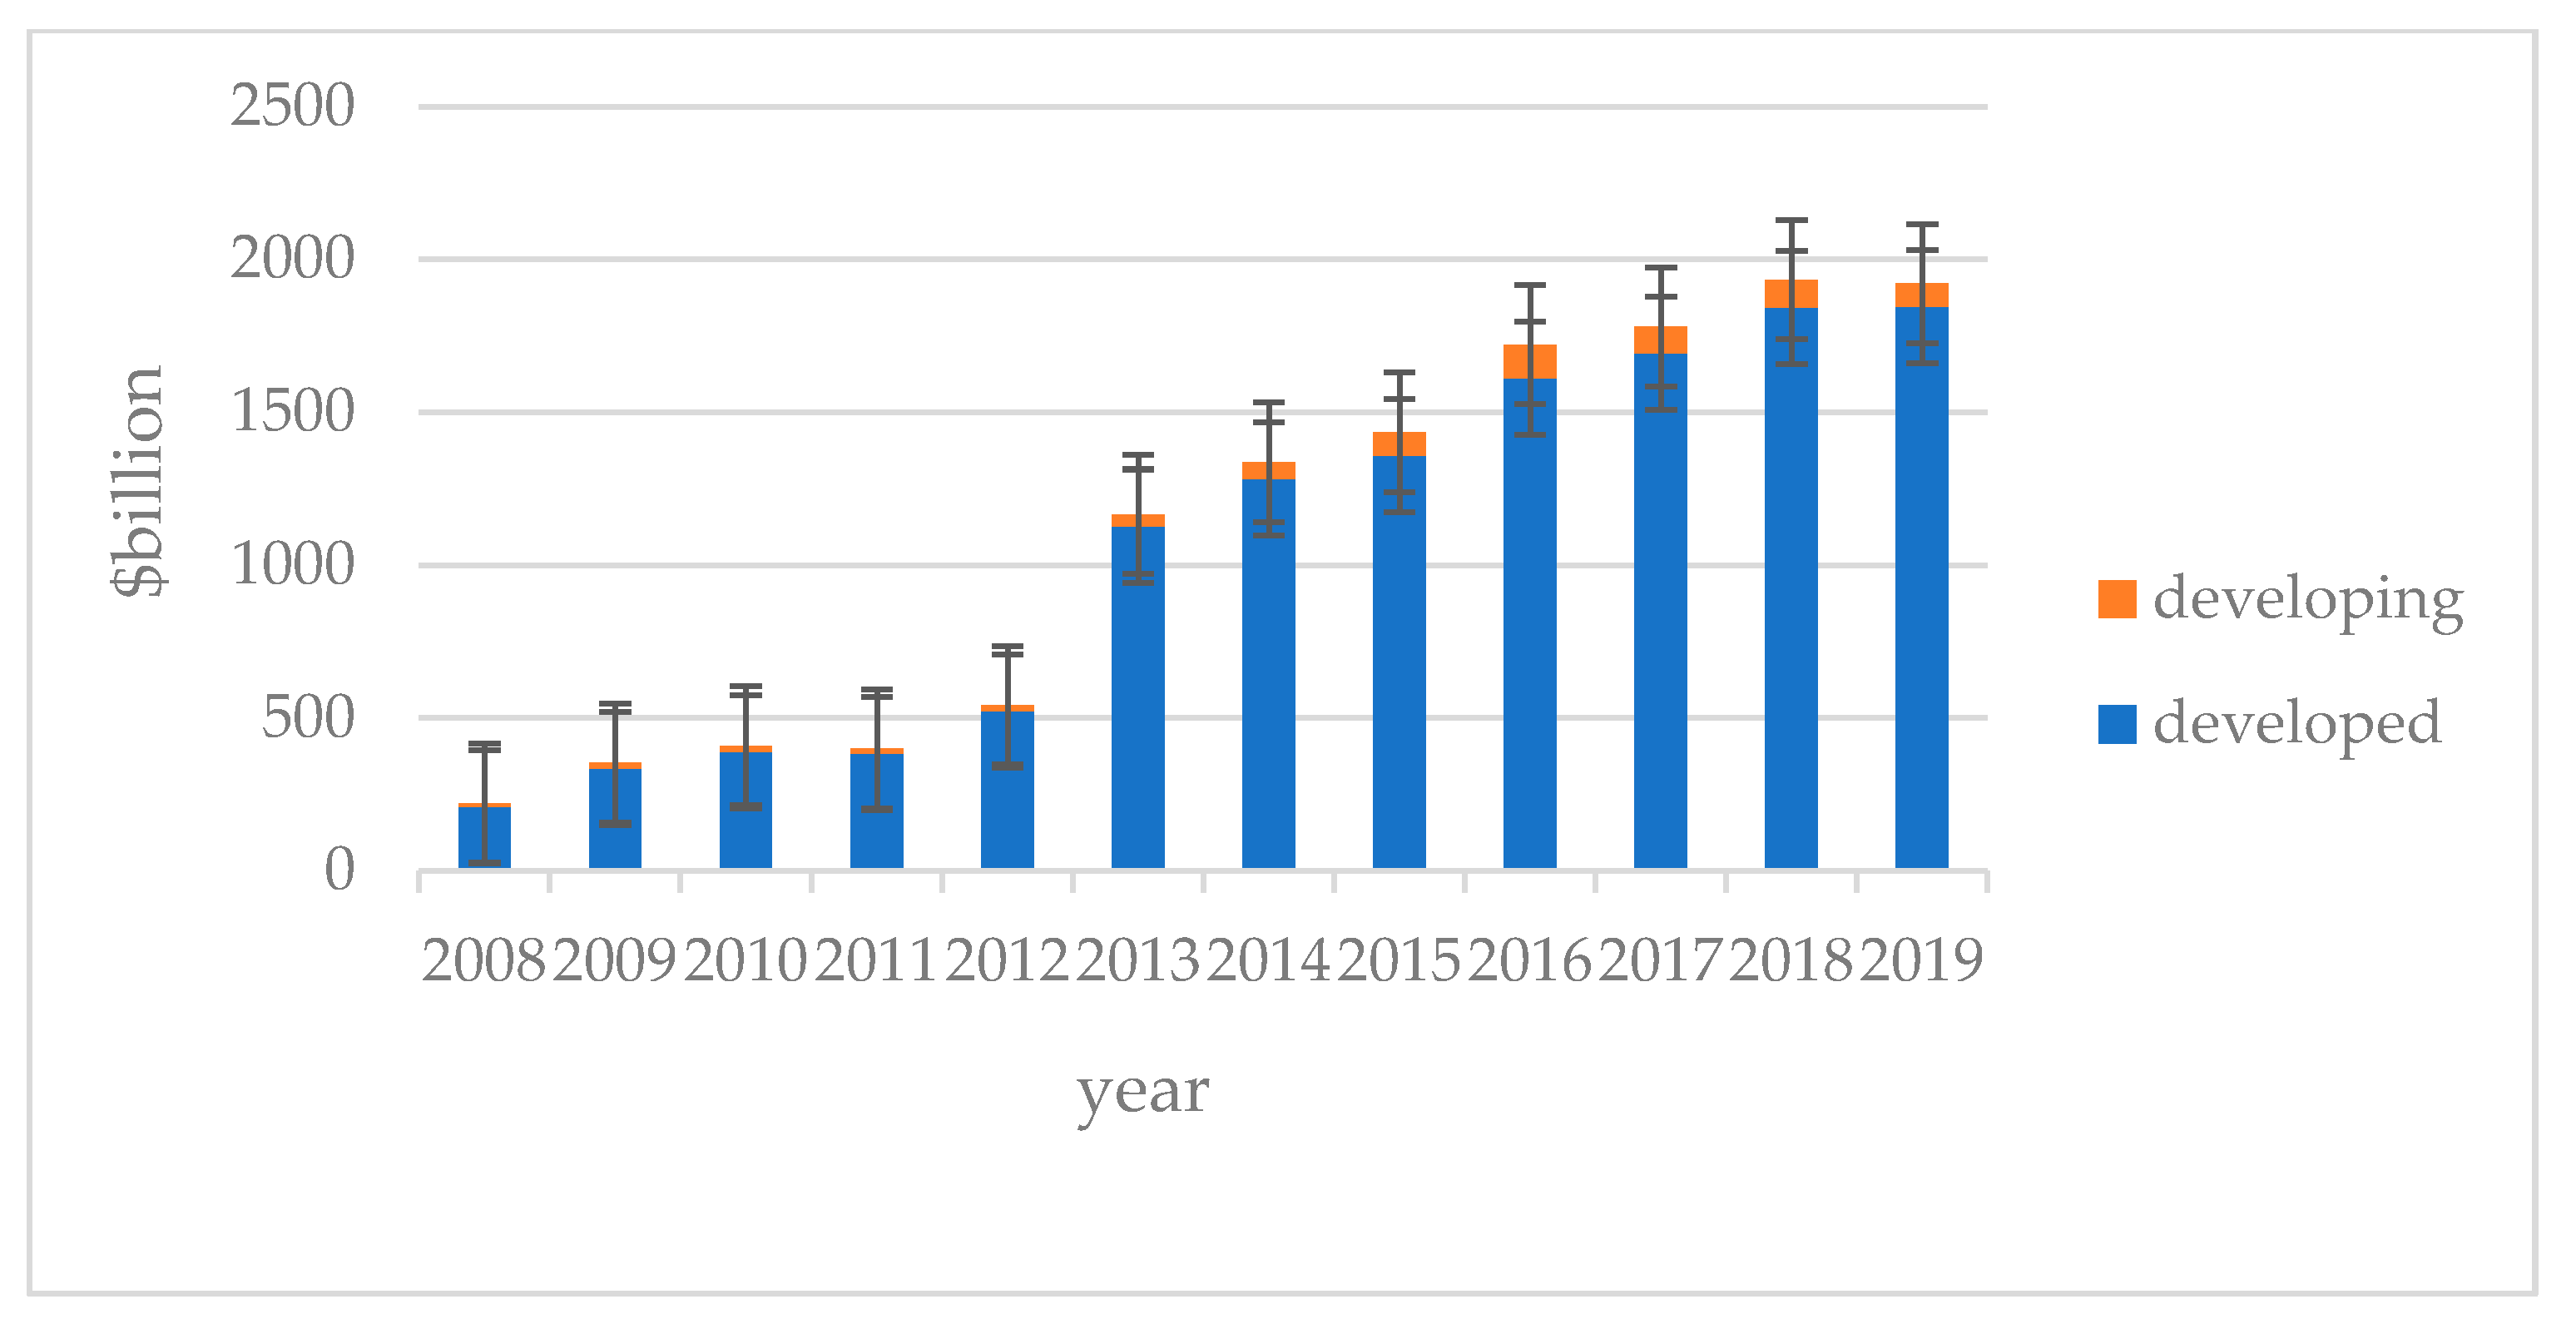
| Time | Total Investment | Developed | Developing |
|---|---|---|---|
| 2008 | 221.504 | 208.622 | 12.915 |
| 2009 | 353.085 | 334.225 | 18.904 |
| 2010 | 409.115 | 388.854 | 20.285 |
| 2011 | 399.529 | 382.726 | 16.825 |
| 2012 | 541.850 | 522.601 | 19.272 |
| 2013 | 1166.189 | 1127.661 | 38.575 |
| 2014 | 1336.321 | 1281.488 | 54.881 |
| 2015 | 1434.670 | 1357.707 | 77.010 |
| 2016 | 1720.085 | 1610.050 | 110.035 |
| 2017 | 1779.064 | 1692.241 | 86.823 |
| 2018 | 1933.381 | 1842.138 | 91.243 |
| 2019 | 1920.721 | 1845.599 | 75.122 |
| Variable | Model 1 | Model 2 | Model 3 (KS) | Model 3 (EU) |
|---|---|---|---|---|
| Ln(1+PDI) | −0.001 | |||
| Ln(1+IDV) | −0.007 ** | |||
| Ln(1+UAI) | −0.006 ** | |||
| Ln(1+MAS) | −0.001 | |||
| Ln(1+Cul) | 0.061 *** | 0.091 *** | ||
| Ln(1+WGId) | −0.011 | 0.042 * | 0.111 ** | |
| Ln(1+EFId) | 0.027 *** | 0.047 *** | 0.084 *** | |
| Ln(1+Cul) * Ln(1+WGId) | −0.002 | −0.105 | ||
| Ln(1+Cul) * Ln(1+EFId) | −0.092 *** | −0.147 *** | ||
| LnGDP | 0.003 * | 0.000 | 0.002 | 0.001 |
| LnCGDP | 0.014 ** | 0.010 | 0.010 ** | 0.010 ** |
| LnGIST | −0.019 *** | −0.028 *** | −0.021 *** | −0.021 *** |
| LnInves | −0.014 | −0.005 | 0.005 | |
| LnJudi | −0.020 * | −0.021 ** | −0.012 | |
| Contig | 0.018 *** | 0.030 *** | 0.020 *** | 0.010 *** |
| Comlang | 0.021 *** | −0.004 | −0.023 | |
| Comrelig | −0.004 * | −0.001 | 0.000 | |
| Comleg | 0.011 *** | 0.006 * | 0.006 ** | |
| Constant | −0.115 | −0.009 | −0.080 | −0.104 * |
| Year | Yes | Yes | Yes | Yes |
| N | 420 | 420 | 420 | 420 |
| Adjusted R2 | 0.377 | 0.319 | 0.283 | 0.238 |
| Variable | Greenfield Investment (KS) | Greenfield Investment (EU) | M&A (KS) | M&A (EU) |
|---|---|---|---|---|
| Ln(1+Cul) | 0.053 ** | 0.086 *** | 0.063 ** | 0.093 *** |
| Ln(1+WGId) | 0.038 * | 0.099 * | 0.043 * | 0.117 * |
| Ln(1+EFId) | 0.049 ** | 0.088 ** | 0.045 ** | 0.079 ** |
| Ln(1+Cul) * Ln(1+WGId) | −0.001 | −0.099 | −0.003 | −0.109 |
| Ln(1+Cul) * Ln(1+EFId) | −0.081 *** | −0.135 *** | −0.098 *** | −0.156 *** |
| LnGDP | 0.003 | 0.001 | 0.004 * | 0.001 |
| LnCGDP | 0.010 ** | 0.010 ** | 0.010 ** | 0.010 ** |
| LnGIST | −0.024 ** | −0.024 ** | −0.019 *** | −0.018 *** |
| LnInves | −0.002 | 0.002 | −0.001 | 0.001 |
| LnJudi | −0.017 ** | −0.009 | −0.019 ** | −0.010 |
| Contig | 0.022 *** | 0.013 *** | 0.018 *** | 0.009 *** |
| Comlang | −0.016 | −0.043 | −0.004 | −0.022 |
| Comrelig | −0.003 | 0.001 | −0.002 | 0.001 |
| Comleg | 0.013 * | 0.013 ** | 0.008 * | 0.008 ** |
| Constant | −0.081 | −0.094 * | −0.083 | −0.103 * |
| Year | Yes | Yes | Yes | Yes |
| N | 420 | 420 | 420 | 420 |
| Adjusted R2 | 0.272 | 0.229 | 0.276 | 0.231 |
Publisher’s Note: MDPI stays neutral with regard to jurisdictional claims in published maps and institutional affiliations. |
© 2022 by the authors. Licensee MDPI, Basel, Switzerland. This article is an open access article distributed under the terms and conditions of the Creative Commons Attribution (CC BY) license (https://creativecommons.org/licenses/by/4.0/).
Share and Cite
Li, D.; Shen, S. Social Environment and Healthy Investment Behavior: Joint Influence of Culture and Institution on China. Int. J. Environ. Res. Public Health 2022, 19, 607. https://0-doi-org.brum.beds.ac.uk/10.3390/ijerph19010607
Li D, Shen S. Social Environment and Healthy Investment Behavior: Joint Influence of Culture and Institution on China. International Journal of Environmental Research and Public Health. 2022; 19(1):607. https://0-doi-org.brum.beds.ac.uk/10.3390/ijerph19010607
Chicago/Turabian StyleLi, Dongao, and Songdong Shen. 2022. "Social Environment and Healthy Investment Behavior: Joint Influence of Culture and Institution on China" International Journal of Environmental Research and Public Health 19, no. 1: 607. https://0-doi-org.brum.beds.ac.uk/10.3390/ijerph19010607