
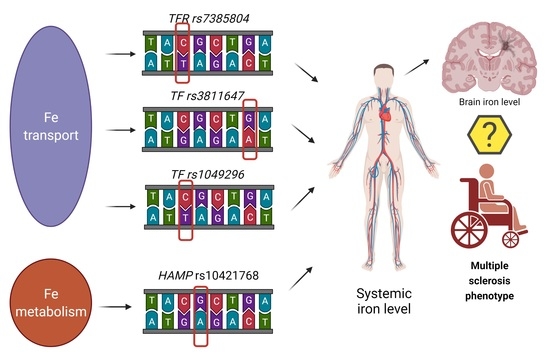
Hepcidin (rs10421768), Transferrin (rs3811647, rs1049296) and Transferrin Receptor 2 (rs7385804) Gene Polymorphism Might Be Associated with the Origin of Multiple Sclerosis

 , , , , , ,
Abstract
:
1. Introduction
1.1. Transport and Absorption of Iron in the Brain
1.2. Regulation of Iron Metabolism—The Role of Hepcidin
2. Materials and Methods
2.1. Study Group
- EDSS rating when patient was diagnosed with MS,
- the age of onset,
- the co-occurrence of other autoimmune disorders,
- the occurrence of autoimmune disorders in family history,
- the cases of MS among relatives,
- de novo diagnosis of MS,
- the presence of relapses,
- the number of affected systems,
- type of the disease,
- disease duration time.
2.2. Molecular Research Methodology
2.2.1. DNA Isolation
2.2.2. Identification of the Studied Polymorphisms
- 1 μL of genomic DNA,
- 5 μL of Taq Man Genotiping Master Mix (Life Technologies, Foster City, CA, USA),
- 3.75 μL PCR Grade Water (Life Technologies, Foster City, CA, USA),
- 0.25 μL TaqMan probe (Life Technologies, Foster City, CA, USA).
- Pre-incubation (1 cycle): 300 s—95 °C,
- 2-stage Amplification (50 cycles):
- 95 °C × 15 s
- 60 °C × 60 s.
2.3. Satistical Analysis
- Over dominant (heterozygous vs. homozygous recessive + homozygous dominant)
- Dominant (dominant homozygous vs. heterozygous + recessive homozygous
- Recessive (homozygous recessive vs. heterozygous + dominant homozygous)
- Codominant (recessive homozygous vs. heterozygous vs. dominant homozygous)
3. Results
3.1. Characteristics of the Study Group
- In 97.2% (n = 171) relapsing–remitting multiple sclerosis (RR),
- In 2.3% (n = 4) secondary progressive multiple sclerosis (SP),
- In 0.6% (n = 1) primary progressive multiple sclerosis (PP).
3.2. Genotyping
4. Discussion
5. Conclusions
Author Contributions
Funding
Institutional Review Board Statement
Informed Consent Statement
Data Availability Statement
Conflicts of Interest
References
- Weigel, K.J.; Lynch, S.G.; Levine, S.M. Iron Chelation and Multiple Sclerosis. ASN Neuro 2013, 6, AN20130037. [Google Scholar] [CrossRef] [PubMed] [Green Version]
- Bakshi, R.; Shaikh, Z.A.; Janardhan, V. MRI T2 shortening (‘black T2′) in multiple sclerosis: Frequency, Location, and Clinical Correlation. NeuroReport 2000, 11, 15–21. [Google Scholar] [CrossRef] [PubMed]
- Haider, L. Inflammation, Iron, Energy Failure, and Oxidative Stress in the Pathogenesis of Multiple Sclerosis. Oxidative Med. Cell. Longev. 2015, 2015, e725370. [Google Scholar] [CrossRef] [PubMed]
- Hametner, S.; Wimmer, I.; Haider, L.; Pfeifenbring, S.; Brück, W.; Lassmann, H. Iron and neurodegeneration in the multiple sclerosis brain. Ann. Neurol. 2013, 74, 848–861. [Google Scholar] [CrossRef]
- Aleksandra, C. Czynniki Genetyczne Stanowiące Podłoże Zaburzeń Gospodarki Żelaza u Pacjentów Ze Stwardnieniem Rozsianym. Bachelor’s Thesis, Pomeranian Medical University in Szczecin, Szczecin, Poland, 2019. [Google Scholar]
- Vela, D. Hepcidin, an emerging and important player in brain iron homeostasis. J. Transl. Med. 2018, 16, 25. [Google Scholar] [CrossRef] [PubMed] [Green Version]
- McCarthy, R.C.; Kosman, D.J. Mechanisms and regulation of iron trafficking across the capillary endothelial cells of the blood-brain barrier. Front. Mol. Neurosci. 2015, 8, 31. [Google Scholar] [CrossRef]
- Abbott, N.J.; Rönnbäck, L.; Hansson, E. Astrocyte–endothelial interactions at the blood–brain barrier. Nat. Rev. Neurosci. 2006, 7, 41–53. [Google Scholar] [CrossRef]
- Wierzbicka, D.; Gromadzka, G. Ceruloplasmin, hephaestin and zyklopen: The three multicopper oxidases important for human iron metabolism. Postȩpy Hig. Med. Doświadczalnej 2014, 68, 912–924. [Google Scholar] [CrossRef]
- Murakami, Y.; Saito, K.; Ito, H.; Hashimoto, Y. Transferrin isoforms in cerebrospinal fluid and their relation to neurological diseases. Proc. Jpn. Acad. Ser. B Phys. Biol. Sci. 2019, 95, 198–210. [Google Scholar] [CrossRef] [Green Version]
- Salazar, J.; Mena, N.; Hunot, S.; Prigent, A.; Alvarez-Fischer, D.; Arredondo, M.; Duyckaerts, C.; Sazdovitch, V.; Zhao, L.; Garrick, L.M.; et al. Divalent metal transporter 1 (DMT1) contributes to neurodegeneration in animal models of Parkinson’s disease. Proc. Natl. Acad. Sci. USA 2008, 105, 18578–18583. [Google Scholar] [CrossRef] [Green Version]
- Moos, T.; Nielsen, T.R.; Skjørringe, T.; Morgan, E.H. Iron trafficking inside the brain. J. Neurochem. 2007, 103, 1730–1740. [Google Scholar] [CrossRef] [PubMed]
- Gajowiak, A.; Styś, A.; Starzyński, R.R.; Staroń, R.; Lipiński, P. Misregulation of iron homeostasis in amyotrophic lateral sclerosis. Postȩpy Hig. Med. Doświadczalnej 2016, 70, 709–721. [Google Scholar] [CrossRef] [PubMed]
- Wang, T.; Xu, S.-F.; Fan, Y.-G.; Li, L.-B.; Guo, C. Iron Pathophysiology in Alzheimer’s Diseases. Adv. Exp. Med. Biol. 2019, 1173, 67–104. [Google Scholar] [CrossRef] [PubMed]
- Jiang, H.; Wang, J.; Rogers, J.; Xie, J. Brain Iron Metabolism Dysfunction in Parkinson’s Disease. Mol. Neurobiol. 2017, 54, 3078–3101. [Google Scholar] [CrossRef] [PubMed]
- Zatta, P.; Messori, L.; Mauri, P.; van Rensburg, S.J.; van Zyl, J.; Gabrielli, S.; Gabbiani, C. The C2 variant of human serum transferrin retains the iron binding properties of the native protein. Biochim. Biophys. Acta 2005, 1741, 264–270. [Google Scholar] [CrossRef]
- Kutalik, Z.; Benyamin, B.; Bergmann, S.; Mooser, V.; Waeber, G.; Montgomery, G.W.; Martin, N.G.; Madden, P.A.F.; Heath, A.C.; Beckmann, J.S.; et al. Genome-wide association study identifies two loci strongly affecting transferrin glycosylation. Hum. Mol. Genet. 2011, 20, 3710–3717. [Google Scholar] [CrossRef]
- de Tayrac, M.; Roth, M.-P.; Jouanolle, A.-M.; Coppin, H.; le Gac, G.; Piperno, A.; Férec, C.; Pelucchi, S.; Scotet, V.; Bardou-Jacquet, E.; et al. Genome-wide association study identifies TF as a significant modifier gene of iron metabolism in HFE hemochromatosis. J. Hepatol. 2015, 62, 664–672. [Google Scholar] [CrossRef]
- McLaren, C.E.; Garner, C.P.; Constantine, C.C.; McLachlan, S.; Vulpe, C.D.; Snively, B.M.; Gordeuk, V.R.; Nickerson, D.A.; Cook, J.D.; Leiendecker-Foster, C.; et al. Genome-Wide Association Study Identifies Genetic Loci Associated with Iron Deficiency. PLoS ONE 2011, 6, e17390. [Google Scholar] [CrossRef]
- Blanco-Rojo, R.; Bayele, H.K.; Srai, S.K.S.; Vaquero, M.P. Intronic SNP Rs3811647 of the Human Transferrin Gene Modulates Its Expression in Hepatoma Cells. Nutr. Hosp. 2012, 27, 2142–2145. [Google Scholar] [CrossRef]
- Pichler, I.; Minelli, C.; Sanna, S.; Tanaka, T.; Schwienbacher, C.; Naitza, S.; Porcu, E.; Pattaro, C.; Busonero, F.; Zanon, A.; et al. Identification of a common variant in the TFR2 gene implicated in the physiological regulation of serum iron levels. Hum. Mol. Genet. 2011, 20, 1232–1240. [Google Scholar] [CrossRef] [Green Version]
- Hentze, M.W.; Muckenthaler, M.U.; Galy, B.; Camaschella, C. Two to Tango: Regulation of Mammalian Iron Metabolism. Cell 2010, 142, 24–38. [Google Scholar] [CrossRef] [PubMed] [Green Version]
- Du, F.; Qian, Z.-M.; Luo, Q.; Yung, W.H.; Ke, Y. Hepcidin Suppresses Brain Iron Accumulation by Downregulating Iron Transport Proteins in Iron-Overloaded Rats. Mol. Neurobiol. 2015, 52, 101–114. [Google Scholar] [CrossRef] [PubMed]
- Frazer, D.M.; Wilkins, S.J.; Becker, E.M.; Vulpe, C.D.; Mckie, A.T.; Trinder, D.; Anderson, G.J. Hepcidin expression inversely correlates with the expression of duodenal iron transporters and iron absorption in rats. Gastroenterology 2002, 123, 835–844. [Google Scholar] [CrossRef] [PubMed]
- Du, F.; Qian, C.; Qian, Z.M.; Wu, X.-M.; Xie, H.; Yung, W.-H.; Ke, Y. Hepcidin directly inhibits transferrin receptor 1 expression in astrocytes via a cyclic AMP-protein kinase a pathway. Glia 2011, 59, 936–945. [Google Scholar] [CrossRef]
- Bruno, F.; Bonalumi, S.; Camaschella, C.; Ferrari, M.; Cremonesi, L. The -582A>G variant of the HAMP promoter is not associated with high serum ferritin levels in normal subjects. Haematologica 2010, 95, 849–850. [Google Scholar] [CrossRef] [Green Version]
- Parajes, S.; González-Quintela, A.; Campos, J.; Quinteiro, C.; Domínguez, F.; Loidi, L. Genetic study of the hepcidin gene (HAMP) promoter and functional analysis of the c.-582A > G variant. BMC Genet. 2010, 11, 110. [Google Scholar] [CrossRef] [Green Version]
- Liang, L.; Liu, H.; Yue, J.; Liu, L.-R.; Han, M.; Luo, L.-L.; Zhao, Y.-L.; Xiao, H. Association of Single-Nucleotide Polymorphism in the Hepcidin Promoter Gene with Susceptibility to Extrapulmonary Tuberculosis. Genet. Test. Mol. Biomark. 2017, 21, 351–356. [Google Scholar] [CrossRef]
- Ward, R.J.; Zucca, F.A.; Duyn, J.H.; Crichton, R.R.; Zecca, L. The role of iron in brain ageing and neurodegenerative disorders. Lancet Neurol. 2014, 13, 1045–1060. [Google Scholar] [CrossRef] [Green Version]
- Choi, I.-Y.; Lee, S.-P.; Denney, D.R.; Lynch, S.G. Lower levels of glutathione in the brains of secondary progressive multiple sclerosis patients measured by 1H magnetic resonance chemical shift imaging at 3 T. Mult. Scler. 2011, 17, 289–296. [Google Scholar] [CrossRef] [Green Version]
- Mahad, D.H.; Trapp, B.D.; Lassmann, H. Pathological mechanisms in progressive multiple sclerosis. Lancet Neurol. 2015, 14, 183–193. [Google Scholar] [CrossRef]
- Skonieczna-Żydecka, K.; Jamioł-Milc, D.; Borecki, K.; Stachowska, E.; Zabielska, P.; Kamińska, M.; Karakiewicz, B. The Prevalence of Insomnia and the Link between Iron Metabolism Genes Polymorphisms, TF rs1049296 C>T, TF rs3811647 G>A, TFR rs7385804 A>C, HAMP rs10421768 A>G and Sleep Disorders in Polish Individuals with ASD. Int. J. Environ. Res. Public Health 2020, 17, 400. [Google Scholar] [CrossRef] [PubMed] [Green Version]
- Andreani, M.; Radio, F.C.; Testi, M.; De Bernardo, C.; Troiano, M.; Majore, S.; Bertucci, P.; Polchi, P.; Rosati, R.; Grammatico, P. Association of hepcidin promoter c.-582 A>G variant and iron overload in thalassemia major. Haematologica 2009, 94, 1293–1296. [Google Scholar] [CrossRef] [PubMed] [Green Version]
- An, P.; Wu, Q.; Wang, H.; Guan, Y.; Mu, M.; Liao, Y.; Zhou, D.; Song, P.; Wang, C.; Meng, L.; et al. TMPRSS6, but not TF, TFR2 or BMP2 variants are associated with increased risk of iron-deficiency anemia. Hum. Mol. Genet. 2012, 21, 2124–2131. [Google Scholar] [CrossRef] [PubMed] [Green Version]
- Laura, S. Wpływ Hepcydyny Na Regulację Gospodarki Żelaza w Centralnym Układzie Nerwowym. Bachelor’s Thesis, Pomeranian Medical University in Szczecin, Szczecin, Poland, 2019. [Google Scholar]
- Bergsland, N.; Tavazzi, E.; Schweser, F.; Jakimovski, D.; Hagemeier, J.; Dwyer, M.G.; Zivadinov, R. Targeting Iron Dyshomeostasis for Treatment of Neurodegenerative Disorders. CNS Drugs 2019, 33, 1073–1086. [Google Scholar] [CrossRef] [PubMed]
- Qian, Z.-M.; He, X.; Liang, T.; Wu, K.-C.; Yan, Y.-C.; Lu, L.-N.; Yang, G.; Luo, Q.Q.; Yung, W.-H.; Ke, Y. Lipopolysaccharides Upregulate Hepcidin in Neuron via Microglia and the IL-6/STAT3 Signaling Pathway. Mol. Neurobiol. 2014, 50, 811–820. [Google Scholar] [CrossRef] [PubMed]
- Urrutia, P.; Aguirre, P.; Esparza, A.; Tapia, V.; Mena, N.P.; Arredondo, M.; González-Billault, C.; Núñez, M.T. Inflammation alters the expression of DMT1, FPN1 and hepcidin, and it causes iron accumulation in central nervous system cells. J. Neurochem. 2013, 126, 541–549. [Google Scholar] [CrossRef]
- Bartzokis, G.; Lu, P.H.; Tishler, T.A.; Peters, D.G.; Kosenko, A.; Barrall, K.A.; Finn, J.P.; Villablanca, P.; Laub, G.; Altshuler, L.L.; et al. Prevalent Iron Metabolism Gene Variants Associated with Increased Brain Ferritin Iron in Healthy Older Men. J. Alzheimer’s Dis. 2010, 20, 333–341. [Google Scholar] [CrossRef] [Green Version]
- Wang, Y.; Xu, S.; Liu, Z.; Lai, C.; Xie, Z.; Zhao, C.; Wei, Y.; Bi, J.Z. Meta-analysis on the association between the TF gene rs1049296 and AD. Can. J. Neurol. Sci. 2013, 40, 691–697. [Google Scholar] [CrossRef] [Green Version]
- Wallace, D.F.; Summerville, L.; Lusby, P.E.; Subramaniam, V.N. First phenotypic description of transferrin receptor 2 knockout mouse, and the role of hepcidin. Gut 2005, 54, 980–986. [Google Scholar] [CrossRef] [Green Version]
- Zarghamian, P.; Azarkeivan, A.; Arabkhazaeli, A.; Mardani, A.; Shahabi, M. Hepcidin gene polymorphisms and iron overload in β-thalassemia major patients refractory to iron chelating therapy. BMC Med. Genet. 2020, 21, 75. [Google Scholar] [CrossRef] [Green Version]
- Lee, N.J.; Ha, S.-K.; Sati, P.; Absinta, M.; Nair, G.; Luciano, N.J.; Leibovitch, E.C.; Yen, C.C.; Rouault, T.A.; Silva, A.C.; et al. Potential role of iron in repair of inflammatory demyelinating lesions. J. Clin. Investig. 2019, 129, 4365–4376. [Google Scholar] [CrossRef] [PubMed]
- Mehta, V.; Pei, W.; Yang, G.; Li, S.; Swamy, E.; Boster, A.; Schmalbrock, P.; Pitt, D. Iron Is a Sensitive Biomarker for Inflammation in Multiple Sclerosis Lesions. PLoS ONE 2013, 8, e57573. [Google Scholar] [CrossRef] [PubMed]

| Clinical Parameters | Sex | p | |||||||||||
|---|---|---|---|---|---|---|---|---|---|---|---|---|---|
| Females | Males | ||||||||||||
| n | Min | Max | M | Me | 25–75 P | n | Min | Max | M | Me | 25–75 P | ||
| EDSS 2019 (points) | 121 | 0.0 | 6.5 | 2.0 | 1.5 | 1.0–2.0 | 55 | 0.0 | 6.0 | 2.3 | 1.5 | 1.0–3.5 | 0.28 |
| EDSS at time of diagnosis (points) | 121 | 0.0 | 6.5 | 1.7 | 1.5 | 1.0–2.0 | 55 | 0.0 | 6.0 | 1.9 | 1.5 | 1.0–2.9 | 0.19 |
| Age at clinical onset (years) | 121 | 15.0 | 62.0 | 30.6 | 29.0 | 24.0–37.3 | 55 | 16.0 | 64.0 | 29.3 | 27.0 | 21.0–33.8 | 0.21 |
| Parameter | Sex | n (%) | X2 | p | ||
|---|---|---|---|---|---|---|
| Females | Males | |||||
| n | n | |||||
| Autoimmune diseases Presence | No | 109 | 55 | 164 (93.2%) | 5.8 | 0.016 |
| Yes | 12 | 0 | 12 (6.8%) | |||
| Overall | 121 (68.7%) | 55 (31.2%) | 176 (100%) | |||
| Family autoimmune diseases history | No | 89 | 39 | 128 (72.7%) | 0.1 | 0.716 |
| Yes | 32 | 16 | 48 (27.3%) | |||
| Overall | 128 (72.7%) | 48 (27.3%) | 176 (100%) | |||
| De novo MS phenotype | No | 43 | 24 | 67 (38.1%) | 1.0 | 0.306 |
| Yes | 78 | 31 | 109 (61.9%) | |||
| Overall | 121 (68.7%) | 55 (31.2%) | 176 (100%) | |||
| Primary projections | No | 76 | 36 | 112 (63.6%) | 0.1 | 0.736 |
| Yes | 45 | 19 | 64 (36.4%) | |||
| Overall | 121 (68.7%) | 55 (31.2%) | 176 (100%) | |||
| Family history of MS | No | 106 | 53 | 159 (90.3%) | 3.3 | 0.069 |
| Yes | 15 | 2 | 17 (9.7%) | |||
| Overall | 121 (68.7%) | 55 (31.2%) | 176 (100%) | |||
| Number of occupied systems | One | 51 | 22 | 73 (41.5%) | 0.1 | 0.932 |
| Two | 47 | 23 | 70 (39.8%) | |||
| Three | 23 | 10 | 33 (18.8%) | |||
| Overall | 121 (68.7%) | 55 (31.2%) | 176 (100%) | |||
| MS onset | SF | 51 | 22 | 73 (41.5%) | 0.1 | 0.789 |
| MF | 70 | 33 | 103 (58.5%) | |||
| Overall | 121 (68.7%) | 55 (31.2%) | 176 (100%) | |||
| MS disease course | PP | 0 | 1 | 1 (0.6%) | 2.3 | 0.320 |
| RR | 118 | 53 | 171 (97.2%) | |||
| SP | 3 | 1 | 4 (2.3%) | |||
| Overall | 121 (68.7%) | 55 (31.2%) | 00%) | |||
| MS in side-line | No | 110 | 55 | 165 (93.7%) | 5.3 | 0.021 |
| Yes | 11 | 0 | 11 (6.2%) | |||
| Overall | 121 (68.7%) | 55 (31.2%) | 176 (100%) | |||
| MS in straight line | No | 118 | 54 | 172 (97.7%) | 0.1 | 0.786 |
| Yes | 3 | 1 | 4 (2.3%) | |||
| Overall | 121 (68.7%) | 55 (31.2%) | 176 (100%) | |||
| SNP | Model of Inheritance | Genotype | n | % |
|---|---|---|---|---|
| HAMP rs10421768 | Codominant | AA | 101 | 57.4% |
| AG | 65 | 36.9% | ||
| GG | 10 | 5.7% | ||
| Dominant | AA | 101 | 57.4% | |
| AG + GG | 75 | 42.6% | ||
| Overdominant | AG | 65 | 36.9% | |
| GG + AA | 111 | 63.1% | ||
| Recessive | AG + AA | 166 | 94.3% | |
| GG | 10 | 5.7% | ||
| TF rs3811647 | Codominant | AA | 21 | 11.9% |
| AG | 98 | 55.7% | ||
| GG | 57 | 32.4% | ||
| Dominant | AG + AA | 119 | 67.6% | |
| GG | 57 | 32.4% | ||
| Overdominant | AA + GG | 78 | 44.3% | |
| AG | 98 | 55.7% | ||
| Recessive | AA | 21 | 11.9% | |
| AG + GG | 155 | 88.1% | ||
| TF rs1049269 | Codominant | CC | 138 | 78.4% |
| CT | 38 | 21.6% | ||
| TFR2 rs7385804 | Codominant | AA | 60 | 34.1% |
| AC | 88 | 50.0% | ||
| CC | 28 | 15.9% | ||
| Dominant | AA | 60 | 34.1% | |
| AC + CC | 116 | 65.9% | ||
| Overdominant | AA + CC | 88 | 50.0% | |
| AC | 88 | 50.0% | ||
| Recessive | AA + AC | 148 | 84.1% | |
| CC | 28 | 15.9% |
| HAMP rs10421768 | ||||||
|---|---|---|---|---|---|---|
| EDSS 2019 (Points) | ||||||
| Model of Inheritance | Genotype | n | 25–75 P | Me | Max | p |
| Codominant | AA | 101 | 1.0–2.5 | 1.5 | 6.5 | 0.397452 |
| AG | 65 | 1.5–2.3 | 1.5 | 6.5 | ||
| GG | 10 | 1.0–3.0 | 1.5 | 4.5 | ||
| Dominant | AA | 101 | 1.0–2.5 | 1.5 | 6.5 | 0.1836 |
| AG + GG | 75 | 1.5–3.0 | 1.5 | 6.5 | ||
| Overdominant | AG | 65 | 1.5–2.3 | 1.5 | 6.5 | 0.1906 |
| GG + AA | 111 | 1.0–2.9 | 1.5 | 6.5 | ||
| Recessive | GG | 10 | 1.0–3.0 | 1.5 | 4.5 | 0.9108 |
| AG + AA | 166 | 1.0–2.0 | 1.5 | 6.5 | ||
| EDSS at diagnosis (points) | ||||||
| Model of inheritance | Genotype | n | 25–75 P | Me | Max | p |
| Codominant | AA | 101 | 1.0–2.0 | 1.5 | 5.5 | 0.526175 |
| AG | 65 | 1.0–2.0 | 1.5 | 6.5 | ||
| GG | 10 | 1.0–3.0 | 1.5 | 4.0 | ||
| Dominant | AA | 101 | 1.0–2.0 | 1.5 | 5.5 | 0.2706 |
| AG + GG | 75 | 1.0–2.0 | 1.5 | 6.5 | ||
| Overdominant | AG | 65 | 1.0–2.0 | 1.5 | 6.5 | 0.3919 |
| GG + AA | 111 | 1.0–2.0 | 1.5 | 5.5 | ||
| Recessive | GG | 10 | 1.0–3.0 | 1.5 | 4.0 | 0.5697 |
| AG + AA | 166 | 1.0–2.0 | 1.5 | 6.5 | ||
| Age at clinical onset (years) | ||||||
| Model of inheritance | Genotype | n | 25–75 P | Me | Max | p |
| Codominant | AA | 101 | 23.0–35.3 | 30.0 | 64.0 | 0.848654 |
| AG | 65 | 22.0–36.0 | 28.0 | 62.0 | ||
| GG | 10 | 24.0–34.0 | 28.5 | 42.0 | ||
| Dominant | AA | 101 | 23.0–35.3 | 30.0 | 64.0 | 0.6448 |
| AG + GG | 75 | 25.0–31.0 | 28.0 | 62.0 | ||
| Overdominant | AG | 65 | 22.0–36.0 | 28.0 | 62.0 | 0.8002 |
| GG + AA | 111 | 23.3–35.0 | 29.0 | 64.0 | ||
| Recessive | GG | 10 | 24.0–34.0 | 28.5 | 42.0 | 0.6475 |
| AG + AA | 166 | 23.0–36.0 | 29.0 | 64.0 | ||
| TF rs3811647 | ||||||
|---|---|---|---|---|---|---|
| EDSS 2019 (Points) | ||||||
| Model of Inheritance | Genotype | n | 25–75 P | Me | Max | p |
| Codominant | AA | 21 | 1.0–2.3 | 1.5 | 6.5 | 0.899106 |
| AG | 98 | 1.0–3.0 | 1.5 | 6.0 | ||
| GG | 57 | 1.0–2.5 | 1.5 | 6.5 | ||
| Dominant | GG | 57 | 1.0–2.5 | 1.5 | 6.5 | 0.8106 |
| AG + AA | 119 | 1.0–3.0 | 1.5 | 6.5 | ||
| Overdominant | AG | 98 | 1.0–3.0 | 1.5 | 6.0 | 0.6639 |
| AA + GG | 78 | 1.0–2.5 | 1.5 | 6.5 | ||
| Recessive | AA | 21 | 1.0–2.3 | 1.5 | 6.5 | 0.7489 |
| AG + GG | 155 | 1.0–2.8 | 1.5 | 6.5 | ||
| EDSS at diagnosis (points) | ||||||
| Model of inheritance | Genotype | n | 25–75 P | Me | Max | p |
| Codominant | AA | 21 | 1.0–2.0 | 1.5 | 4.0 | 0.230191 |
| AG | 98 | 1.0–2.5 | 1.5 | 6.0 | ||
| GG | 57 | 1.0–2.0 | 1.5 | 6.5 | ||
| Dominant | GG | 57 | 1.0–2.0 | 1.5 | 6.5 | 0.0915 |
| AG + AA | 119 | 1.0–2.0 | 1.5 | 6.0 | ||
| Overdominant | AG | 98 | 1.0–2.5 | 1.5 | 6.0 | 0.1340 |
| AA + GG | 78 | 1.0–2.0 | 1.5 | 6.5 | ||
| Recessive | AA | 21 | 1.0–2.0 | 1.5 | 4.0 | 0.8892 |
| AG + GG | 155 | 1.0–2.0 | 1.5 | 6.5 | ||
| Age at clinical onset (years) | ||||||
| Model of inheritance | Genotype | n | 25–75 P | Me | Max | p |
| Codominant | AA | 21 | 24.8–38.5 | 29.0 | 62.0 | 0.297682 |
| AG | 98 | 24.0–37.0 | 29.0 | 60.0 | ||
| GG | 57 | 21.0–34.0 | 28.0 | 64.0 | ||
| Dominant | GG | 57 | 21.0- 34.0 | 28.0 | 64.0 | 0.1568 |
| AG + AA | 119 | 24.0–37.8 | 29.0 | 62.0 | ||
| Overdominant | AG | 98 | 24.0–37.0 | 29.0 | 60.0 | 0.4902 |
| AA + GG | 78 | 22.0–34.0 | 29.0 | 64.0 | ||
| Recessive | AA | 21 | 24.8–38.5 | 29.0 | 62.0 | 0.3239 |
| AG + GG | 155 | 23.0–34.8 | 29.0 | 64.0 | ||
| TFR2 rs7385804 | ||||||
|---|---|---|---|---|---|---|
| EDSS 2019 (Points) | ||||||
| Model of Inheritance | Genotype | n | 25–75 P | Me | Max | p |
| Codominant | AA | 60 | 1.0–3.3 | 1.5 | 6.5 | 0.602484 |
| AC | 88 | 1.0–3.0 | 1.5 | 6.5 | ||
| CC | 28 | 1.0–2.0 | 1.5 | 4.5 | ||
| Dominant | AA | 60 | 1.0–3.3 | 1.5 | 6.5 | 0.4650 |
| AC + CC | 116 | 1.0–2.3 | 1.5 | 6.5 | ||
| Overdominant | AC | 88 | 1.0–3.0 | 1.5 | 6.5 | 0.9647 |
| AA + CC | 88 | 1.0–2.5 | 1.5 | 6.5 | ||
| Recessive | CC | 28 | 1.0–2.0 | 1.5 | 4.5 | 0.3754 |
| AA + AC | 148 | 1.0–3.0 | 1.5 | 6.5 | ||
| EDSS at diagnosis (points) | ||||||
| Model of inheritance | Genotype | n | 25–75 P | Me | Max | p |
| Codominant | AA | 60 | 1.0–2.0 | 1.5 | 6.0 | 0.802378 |
| AC | 88 | 1.0–2.0 | 1.5 | 6.5 | ||
| CC | 28 | 1.0–2.0 | 1.5 | 4.0 | ||
| Dominant | AA | 60 | 1.0–2.0 | 1.5 | 6.0 | 0.6100 |
| AC + CC | 116 | 1.0–2.0 | 1.5 | 6.5 | ||
| Overdominant | AC | 88 | 1.0–2.0 | 1.5 | 6.5 | 0.9427 |
| AA + CC | 88 | 1.0–2.0 | 1.5 | 6.0 | ||
| Recessive | CC | 28 | 1.0–2.0 | 1.5 | 4.0 | 0.5736 |
| AA + AC | 148 | 1.0–2.0 | 1.5 | 6.5 | ||
| Age at clinical onset (years) | ||||||
| Model of inheritance | Genotype | n | 25–75 P | Me | Max | p |
| Codominant | AA | 60 | 24.0–38.0 | 29.5 | 60.0 | 0.569396 |
| AC | 88 | 15.0–28.0 | 28.0 | 64.0 | ||
| CC | 28 | 15.0–28.0 | 28.0 | 62.0 | ||
| Dominant | AA | 60 | 24.0–38.0 | 29.5 | 60.0 | 0.3818 |
| AC + CC | 116 | 22.5–34.0 | 28.0 | 64.0 | ||
| Overdominant | AC | 88 | 22.0–34.0 | 28.0 | 64.0 | 0.2952 |
| AA + CC | 88 | 24.0–38.0 | 29.0 | 62.0 | ||
| Recessive | CC | 28 | 24.5–36.5 | 28.0 | 62.0 | 0.7661 |
| AA + AC | 148 | 23.0–35.5 | 29.0 | 64.0 | ||
| TF rs1049269 Codominant Model | |||||||
|---|---|---|---|---|---|---|---|
| Genotype | |||||||
| Clinical Parameters | CC | CT | p | ||||
| n | Me | 25–75 P | n | Me | 25–75 P | ||
| EDSS 2019 (points) | 138 | 1.5 | 1.0–3.0 | 38 | 1.5 | 1.0–2.0 | 0.1925 |
| EDSS at diagnosis (points) | 138 | 1.5 | 1.0–2.0 | 38 | 1.0 | 1.0–1.5 | 0.0236 |
| Age at clinical onset (years) | 138 | 29.0 | 23.0–38.0 | 38 | 29.0 | 25.0–34.0 | 0.6976 |
| HAMP rs10421768 (Models od Inheritance) | ||||||||||||||||||
|---|---|---|---|---|---|---|---|---|---|---|---|---|---|---|---|---|---|---|
| Clinical Parameters | Codominant | Dominant | Overdominant | Recessive | ||||||||||||||
| AA | AG | GG | X2 | p | AA | AA + GG | X2 | p | GG + AA | AG | X2 | p | GG | AG + AA | X2 | p | ||
| Autoimmune diseases | No | 95 | 59 | 10 | 1.5 | 0.4844 | 95 | 69 | 0.3 | 0.593 | 105 | 59 | 0.9 | 0.3326 | 10 | 154 | 0.8 | 0.3798 |
| Yes | 6 | 6 | 0 | 6 | 6 | 6 | 6 | 0 | 12 | |||||||||
| Family history of autoimmune diseases | No | 73 | 48 | 7 | 0.1 | 0.9566 | 73 | 55 | 0.0 | 0.8767 | 80 | 48 | 0.1 | 0.7992 | 7 | 121 | 0.0 | 0.8424 |
| Yes | 28 | 17 | 3 | 28 | 20 | 31 | 17 | 3 | 45 | |||||||||
| De novo phenotype | No | 39 | 24 | 4 | 0.1 | 0.9681 | 39 | 28 | 0.0 | 0.863 | 43 | 24 | 0.1 | 0.8113 | 4 | 63 | 0.0 | 0.8972 |
| Yes | 62 | 41 | 6 | 62 | 47 | 68 | 41 | 6 | 103 | |||||||||
| Relapses | No | 67 | 40 | 5 | 1.2 | 0.5365 | 67 | 45 | 0.7 | 0.3888 | 72 | 40 | 0.2 | 0.6589 | 5 | 107 | 0.8 | 0.3574 |
| Yes | 34 | 25 | 5 | 34 | 30 | 39 | 25 | 5 | 59 | |||||||||
| MS family history | No | 91 | 59 | 9 | 0.0 | 0.9892 | 91 | 68 | 0.0 | 0.9 | 100 | 59 | 0.0 | 0.8833 | 9 | 150 | 0.0 | 0.9701 |
| Yes | 10 | 6 | 1 | 10 | 7 | 11 | 6 | 1 | 16 | |||||||||
| Number of occupied systems | One | 37 | 31 | 5 | 4.2 | 0.3736 | 37 | 36 | 3.4 | 0.1795 | 42 | 31 | 3.5 | 0.1748 | 5 | 68 | 0.6 | 0.7339 |
| Two | 46 | 20 | 4 | 46 | 24 | 50 | 20 | 4 | 66 | |||||||||
| Three | 18 | 14 | 1 | 18 | 15 | 19 | 14 | 1 | 32 | |||||||||
| MS onset | SF | 37 | 31 | 5 | 2.3 | 0.3151 | 37 | 36 | 2.3 | 0.1312 | 42 | 31 | 1.6 | 0.2016 | 5 | 68 | 0.3 | 0.5743 |
| MF | 64 | 34 | 5 | 64 | 39 | 69 | 34 | 5 | 98 | |||||||||
| MS disease course | PP | 0 | 1 | 0 | 2.2 | ne | 0 | 1 | 1.5 | ne | 0 | 1 | 2.0 | ne | 0 | 1 | 0.3 | ne |
| RR | 99 | 62 | 10 | 99 | 72 | 109 | 62 | 10 | 161 | |||||||||
| SP | 2 | 2 | 0 | 2 | 2 | 2 | 2 | 0 | 4 | |||||||||
| MS history in side line | No | 94 | 61 | 10 | 0.7 | 0.6881 | 94 | 71 | 0.2 | 0.666 | 104 | 61 | 0.0 | 0.9679 | 10 | 155 | 0.7 | 0.4018 |
| Yes | 7 | 4 | 0 | 7 | 4 | 7 | 4 | 0 | 11 | |||||||||
| MS history in straight line | No | 98 | 65 | 9 | 4.4 | ne | 98 | 74 | 0.5 | ne | 107 | 65 | 2.4 | ne | 9 | 163 | 2.8 | ne |
| Yes | 3 | 0 | 1 | 3 | 1 | 4 | 0 | 1 | 3 | |||||||||
| TF rs3811647 (Models od Inheritance) | ||||||||||||||||||
|---|---|---|---|---|---|---|---|---|---|---|---|---|---|---|---|---|---|---|
| Clinical Parameters | Codominant | Dominant | Overdominant | Recessive | ||||||||||||||
| AA | AG | GG | X2 | p | GG | AG + AA | X2 | p | AA + GG | AG | X2 | p | AA | AG + GG | X2 | p | ||
| Autoimmune diseases | No | 95 | 59 | 10 | 1.5 | 0.4844 | 53 | 111 | 0.0 | 0.9423 | 71 | 93 | 1.0 | 0.3127 | 18 | 146 | 2.1 | 0.1491 |
| Yes | 6 | 6 | 0 | 4 | 8 | 7 | 5 | 3 | 9 | |||||||||
| Family history of autoimmune diseases | No | 73 | 48 | 7 | 0.1 | 0.9566 | 43 | 85 | 0.3 | 0.5773 | 58 | 70 | 0.2 | 0.6655 | 15 | 113 | 0.0 | 0.8871 |
| Yes | 28 | 17 | 3 | 14 | 43 | 20 | 28 | 6 | 42 | |||||||||
| De novo phenotype | No | 39 | 24 | 4 | 0.1 | 0.9681 | 23 | 44 | 0.2 | 0.6669 | 28 | 39 | 0.3 | 0.5978 | 5 | 62 | 2.0 | 0.1527 |
| Yes | 62 | 41 | 6 | 34 | 75 | 50 | 59 | 16 | 93 | |||||||||
| Relapses | No | 67 | 40 | 5 | 1.2 | 0.5365 | 36 | 76 | 0.0 | 0.9274 | 45 | 67 | 2.1 | 0.1448 | 9 | 103 | 4.4 | 0.0354 |
| Yes | 34 | 25 | 5 | 21 | 43 | 33 | 31 | 12 | 50 | |||||||||
| MS family history | No | 91 | 59 | 9 | 0.0 | 0.9892 | 49 | 110 | 1.8 | 0.1750 | 69 | 90 | 0.6 | 0.4527 | 20 | 139 | 0.7 | 0.4195 |
| Yes | 10 | 6 | 1 | 8 | 9 | 9 | 8 | 1 | 16 | |||||||||
| Number of occupied systems | One | 37 | 31 | 5 | 4.2 | 0.3736 | 22 | 51 | 0.3 | 0.8618 | 29 | 44 | 1.6 | 0.4521 | 7 | 66 | 1.6 | 0.4521 |
| Two | 46 | 20 | 4 | 24 | 46 | 35 | 35 | 11 | 59 | |||||||||
| Three | 18 | 14 | 1 | 33 | 22 | 14 | 19 | 3 | 30 | |||||||||
| MS onset | SF | 37 | 31 | 5 | 2.3 | 0.3151 | 22 | 51 | 0.3 | 0.5924 | 29 | 44 | 1.1 | 0.3032 | 7 | 66 | 0.6 | 0.4209 |
| MF | 64 | 34 | 5 | 35 | 8 | 49 | 54 | 14 | 89 | |||||||||
| MS disease course | PP | 0 | 1 | 0 | 2.2 | ne | 0 | 1 | 0.6 | ne | 0 | 1 | 1.4 | ne | 0 | 1 | 0.7 | ne |
| RR | 99 | 62 | 10 | 56 | 115 | 77 | 94 | 21 | 150 | |||||||||
| SP | 2 | 2 | 0 | 1 | 3 | 1 | 3 | 0 | 4 | |||||||||
| MS history in side line | No | 94 | 61 | 10 | 0.7 | 0.6881 | 52 | 113 | 0.9 | 0.3401 | 72 | 93 | 0.5 | 0.4819 | 20 | 145 | 0.1 | 0.7647 |
| Yes | 7 | 4 | 0 | 5 | 6 | 6 | 5 | 1 | 10 | |||||||||
| MS history in straight line | No | 98 | 65 | 9 | 4.4 | ne | 55 | 117 | 0.6 | ne | 76 | 96 | 0.1 | ne | 21 | 151 | 0.6 | ne |
| Yes | 3 | 0 | 1 | 2 | 2 | 2 | 2 | 0 | 4 | |||||||||
| TFR2 rs7385804 (Models od Inheritance) | ||||||||||||||||||
|---|---|---|---|---|---|---|---|---|---|---|---|---|---|---|---|---|---|---|
| Clinical Parameters | Codominant | Dominant | Overdominant | Recessive | ||||||||||||||
| AA | AC | CC | X2 | p | AA | AC + CC | X2 | p | AA + CC | AC | X2 | p | AA + CC | CC | X2 | p | ||
| Autoimmune diseases | No | 54 | 84 | 26 | 1.7 | 0.4325 | 54 | 110 | 1.4 | 0.2298 | 80 | 84 | 1.4 | 0.2329 | 138 | 10 | 0.0 | 0.9409 |
| Yes | 6 | 4 | 2 | 6 | 6 | 8 | 4 | 10 | 2 | |||||||||
| Family history of autoimmune diseases | No | 47 | 62 | 19 | 1.5 | 0.4689 | 47 | 81 | 1.4 | 0.2311 | 66 | 62 | 0.5 | 0.4996 | 109 | 19 | 0.4 | 0.5292 |
| Yes | 13 | 26 | 9 | 13 | 48 | 22 | 26 | 39 | 9 | |||||||||
| De novo phenotype | No | 23 | 35 | 9 | 0.5 | 0.7683 | 23 | 44 | 0.0 | 0.9586 | 32 | 35 | 0.2 | 0.6424 | 58 | 9 | 0.5 | 0.4826 |
| Yes | 37 | 53 | 19 | 37 | 72 | 56 | 53 | 90 | 19 | |||||||||
| Relapses | No | 35 | 59 | 18 | 1.2 | 0.5554 | 35 | 25 | 1.1 | 0.2943 | 53 | 59 | 0.9 | 0.3485 | 94 | 18 | 0.0 | 0.9381 |
| Yes | 25 | 29 | 10 | 77 | 39 | 35 | 29 | 54 | 10 | |||||||||
| MS family history | No | 56 | 77 | 26 | 1.6 | 0.4420 | 56 | 103 | 0.9 | 0.3352 | 82 | 77 | 1.6 | 0.2033 | 133 | 26 | 0.2 | 0.6240 |
| Yes | 4 | 11 | 2 | 4 | 13 | 6 | 11 | 15 | 2 | |||||||||
| Number of occupied systems | One | 23 | 38 | 12 | 5.5 | 0.2367 | 23 | 50 | 1.3 | 0.5262 | 35 | 38 | 4.7 | 0.0952 | 61 | 12 | 2.8 | 0.2492 |
| Two | 23 | 39 | 8 | 23 | 47 | 31 | 39 | 62 | 8 | |||||||||
| Three | 14 | 8 | 8 | 14 | 19 | 22 | 11 | 25 | 8 | |||||||||
| MS onset | SF | 23 | 38 | 12 | 0.4 | 0.8304 | 23 | 37 | 0.4 | 0.5438 | 35 | 38 | 0.2 | 0.6472 | 61 | 12 | 0.0 | 0.8720 |
| MF | 37 | 50 | 16 | 50 | 66 | 53 | 50 | 87 | 16 | |||||||||
| MS disease course | PP | 1 | 0 | 0 | 2.9 | ne | 1 | 0 | 2.4 | ne | 1 | 0 | 1.0 | ne | 1 | 0 | 1.0 | ne |
| RR | 57 | 86 | 28 | 57 | 114 | 85 | 86 | 143 | 28 | |||||||||
| SP | 2 | 2 | 0 | 2 | 2 | 2 | 2 | 4 | 0 | |||||||||
| MS history in side line | No | 57 | 82 | 26 | 0.2 | 0.8840 | 57 | 108 | 0.2 | 0.6232 | 83 | 82 | 0.1 | 0.7562 | 139 | 26 | 0.0 | 0.8319 |
| Yes | 3 | 6 | 2 | 3 | 8 | 5 | 6 | 9 | 2 | |||||||||
| MS history in straight line | No | 60 | 84 | 28 | 4.1 | ne | 60 | 112 | 2.1 | ne | 88 | 84 | 4.1 | ne | 144 | 28 | 0.8 | ne |
| Yes | 0 | 4 | 0 | 0 | 4 | 0 | 4 | 4 | 0 | |||||||||
| TF rs1049269 (Models od Inheritance) | |||||
|---|---|---|---|---|---|
| Clinical Parameters | Codominant | ||||
| CC | CT | X2 | p | ||
| Autoimmune diseases | No | 128 | 36 | 0.2 | 0.6685 |
| Yes | 10 | 2 | |||
| Family history of autoimmune diseases | No | 101 | 27 | 0.1 | 0.7941 |
| Yes | 37 | 11 | |||
| De novo phenotype | No | 54 | 13 | 0.3 | 0.5813 |
| Yes | 84 | 25 | |||
| Relapses | No | 87 | 25 | 0.1 | 0.7560 |
| Yes | 51 | 13 | |||
| MS family history | No | 124 | 35 | 0.2 | 0.6784 |
| Yes | 14 | 3 | |||
| Number of occupied systems | One | 62 | 11 | 3.2 | 0.1973 |
| Two | 51 | 19 | |||
| Three | 25 | 8 | |||
| MS onset | SF | 62 | 11 | 3.1 | 0.0775 |
| MF | 76 | 27 | |||
| MS disease course | PP | 1 | 0 | 1.4 | 0.4924 |
| RR | 133 | 38 | |||
| SP | 4 | 0 | |||
| MS history in side line | No | 129 | 36 | 0.1 | 0.7772 |
| Yes | 9 | 2 | |||
| MS history in straight line | No | 135 | 37 | 0.0 | 0.8673 |
| Yes | 3 | 1 | |||
Publisher’s Note: MDPI stays neutral with regard to jurisdictional claims in published maps and institutional affiliations. |
© 2022 by the authors. Licensee MDPI, Basel, Switzerland. This article is an open access article distributed under the terms and conditions of the Creative Commons Attribution (CC BY) license (https://creativecommons.org/licenses/by/4.0/).
Share and Cite
Stachowska, L.; Koziarska, D.; Karakiewicz, B.; Kotwas, A.; Knyszyńska, A.; Folwarski, M.; Dec, K.; Stachowska, E.; Hawryłkowicz, V.; Kulaszyńska, M.; et al. Hepcidin (rs10421768), Transferrin (rs3811647, rs1049296) and Transferrin Receptor 2 (rs7385804) Gene Polymorphism Might Be Associated with the Origin of Multiple Sclerosis. Int. J. Environ. Res. Public Health 2022, 19, 6875. https://0-doi-org.brum.beds.ac.uk/10.3390/ijerph19116875
Stachowska L, Koziarska D, Karakiewicz B, Kotwas A, Knyszyńska A, Folwarski M, Dec K, Stachowska E, Hawryłkowicz V, Kulaszyńska M, et al. Hepcidin (rs10421768), Transferrin (rs3811647, rs1049296) and Transferrin Receptor 2 (rs7385804) Gene Polymorphism Might Be Associated with the Origin of Multiple Sclerosis. International Journal of Environmental Research and Public Health. 2022; 19(11):6875. https://0-doi-org.brum.beds.ac.uk/10.3390/ijerph19116875
Chicago/Turabian StyleStachowska, Laura, Dorota Koziarska, Beata Karakiewicz, Artur Kotwas, Anna Knyszyńska, Marcin Folwarski, Karolina Dec, Ewa Stachowska, Viktoria Hawryłkowicz, Monika Kulaszyńska, and et al. 2022. "Hepcidin (rs10421768), Transferrin (rs3811647, rs1049296) and Transferrin Receptor 2 (rs7385804) Gene Polymorphism Might Be Associated with the Origin of Multiple Sclerosis" International Journal of Environmental Research and Public Health 19, no. 11: 6875. https://0-doi-org.brum.beds.ac.uk/10.3390/ijerph19116875