
Association of Short-Term Changes in Menstrual Frequency, Medication Use, Weight and Exercise on Bone Mineral Density in College-Aged Women

 and
and
Abstract
:1. Introduction
2. Materials and Methods
2.1. Design and Study Population
2.2. Survey
2.3. DXA Scan
2.4. Statistical Analysis
3. Results
3.1. Subject Characteristics
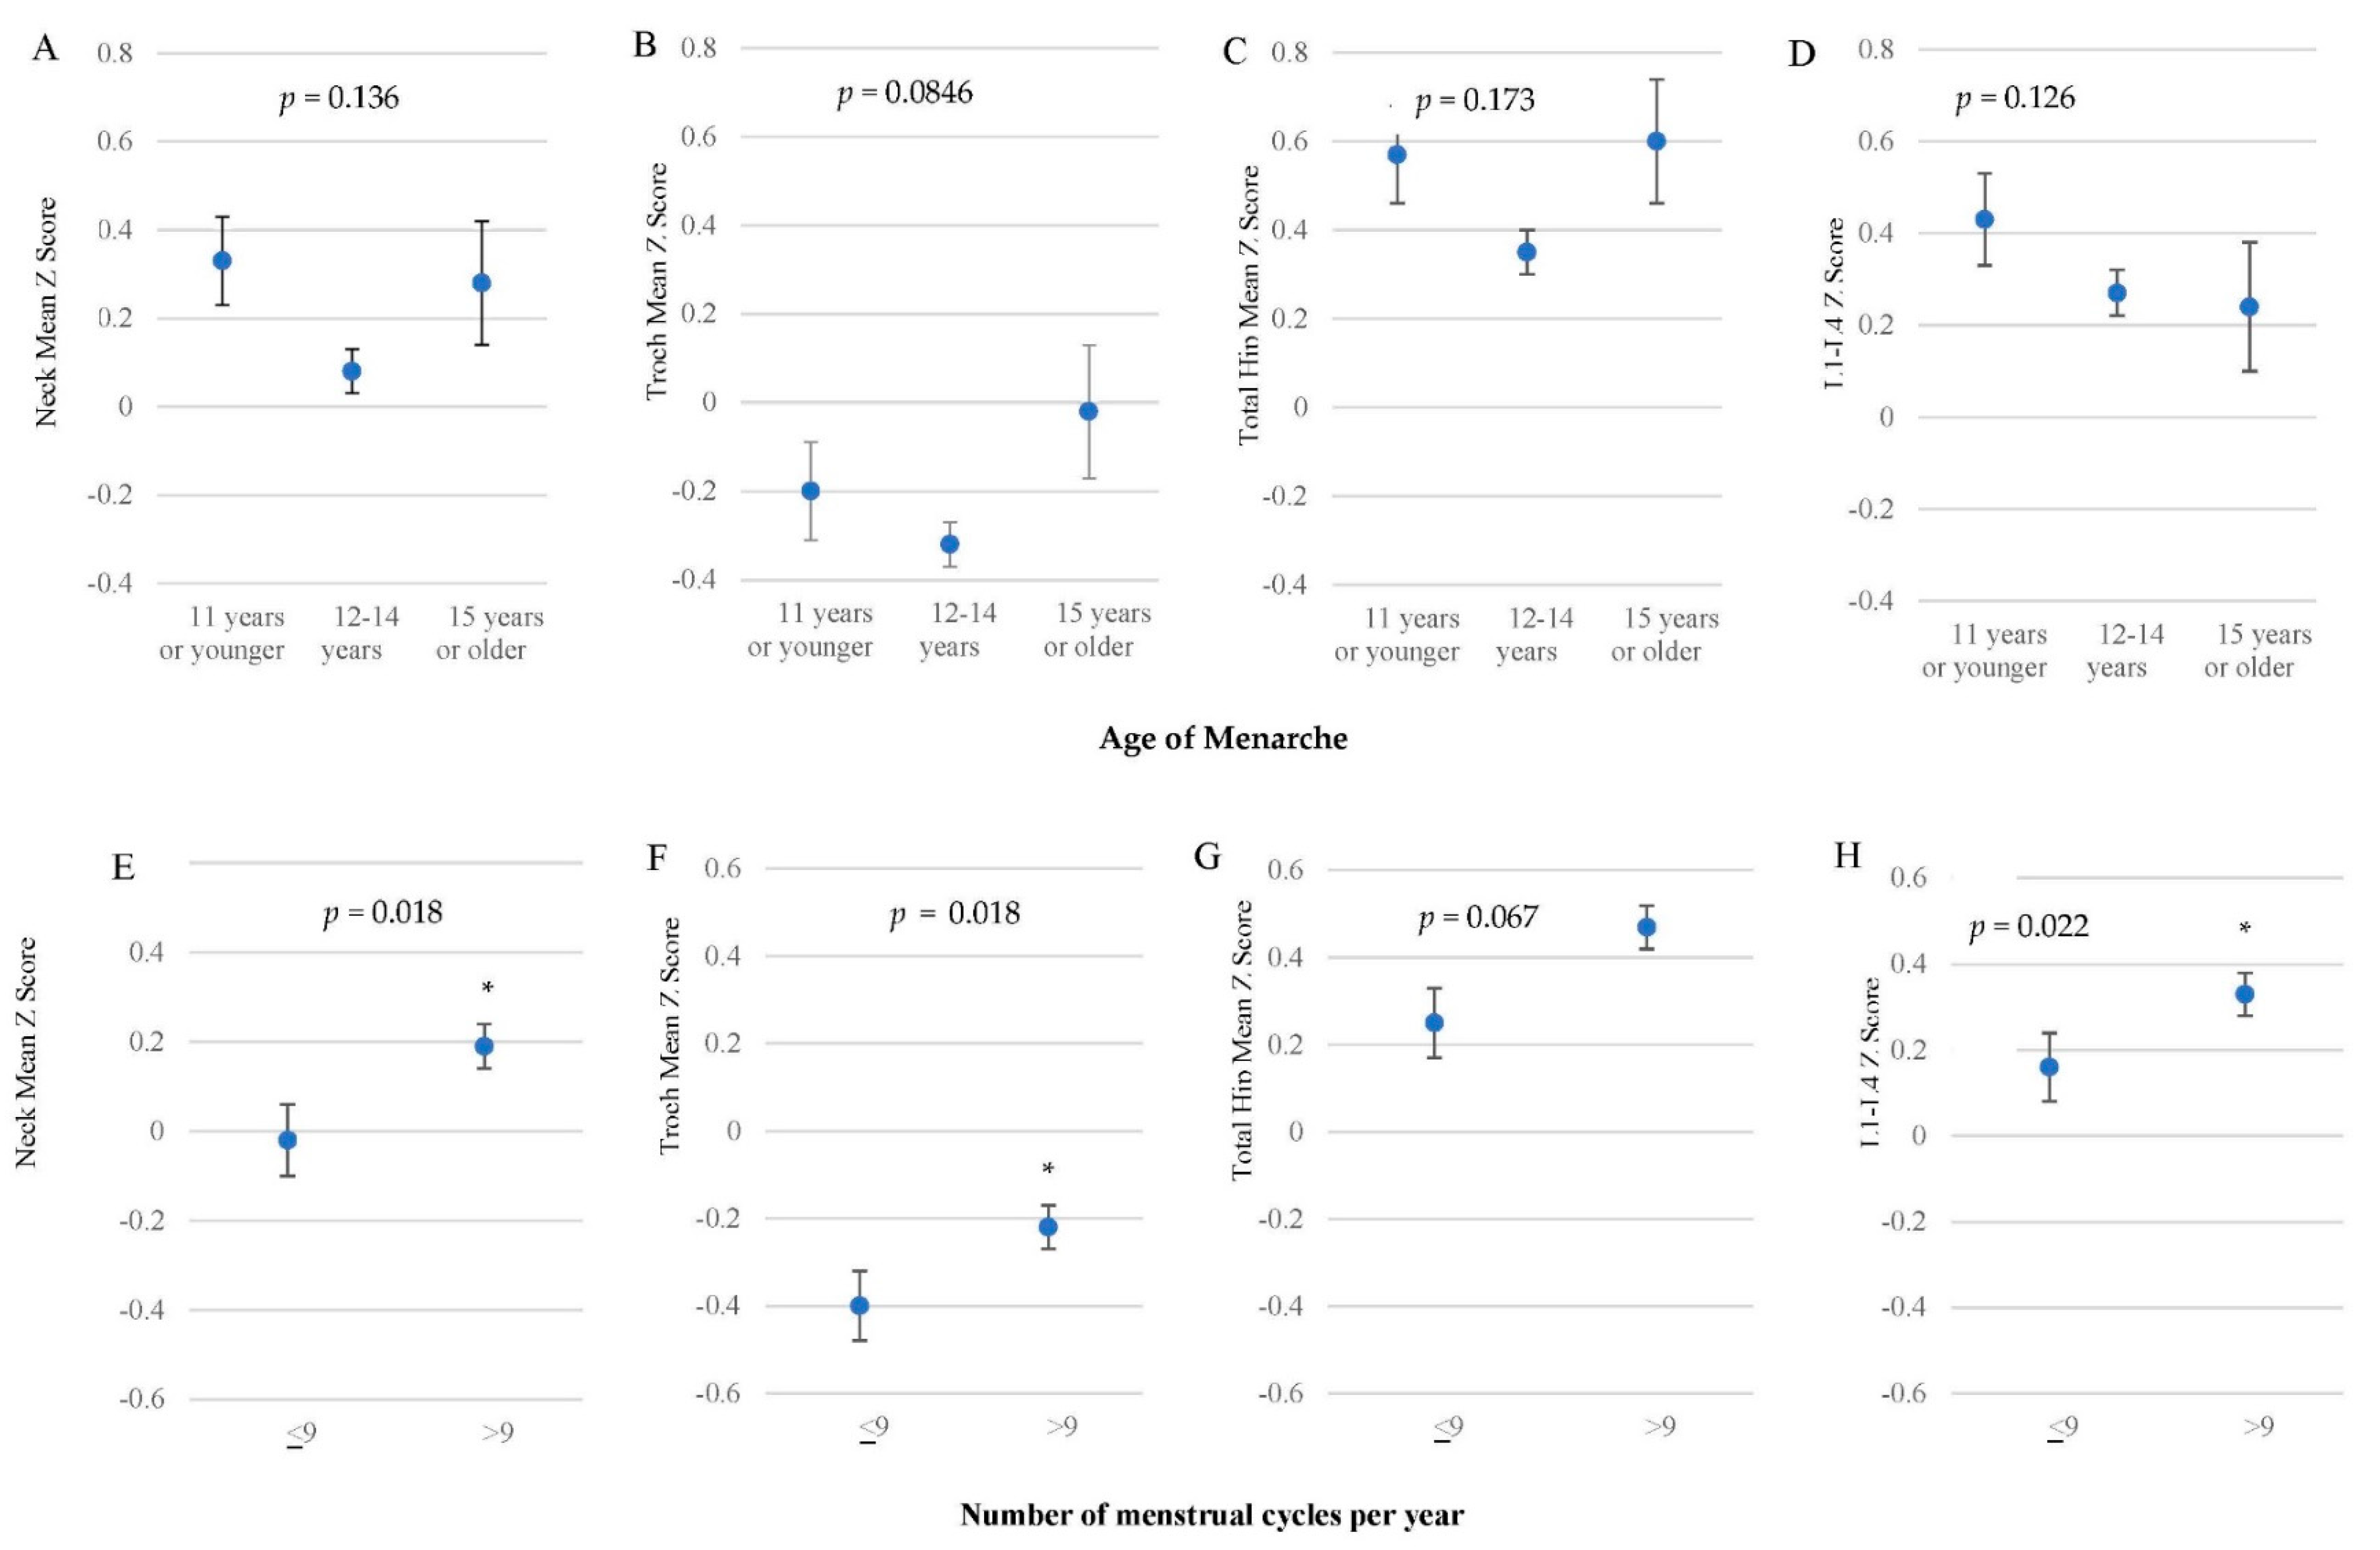
3.2. Menstruation
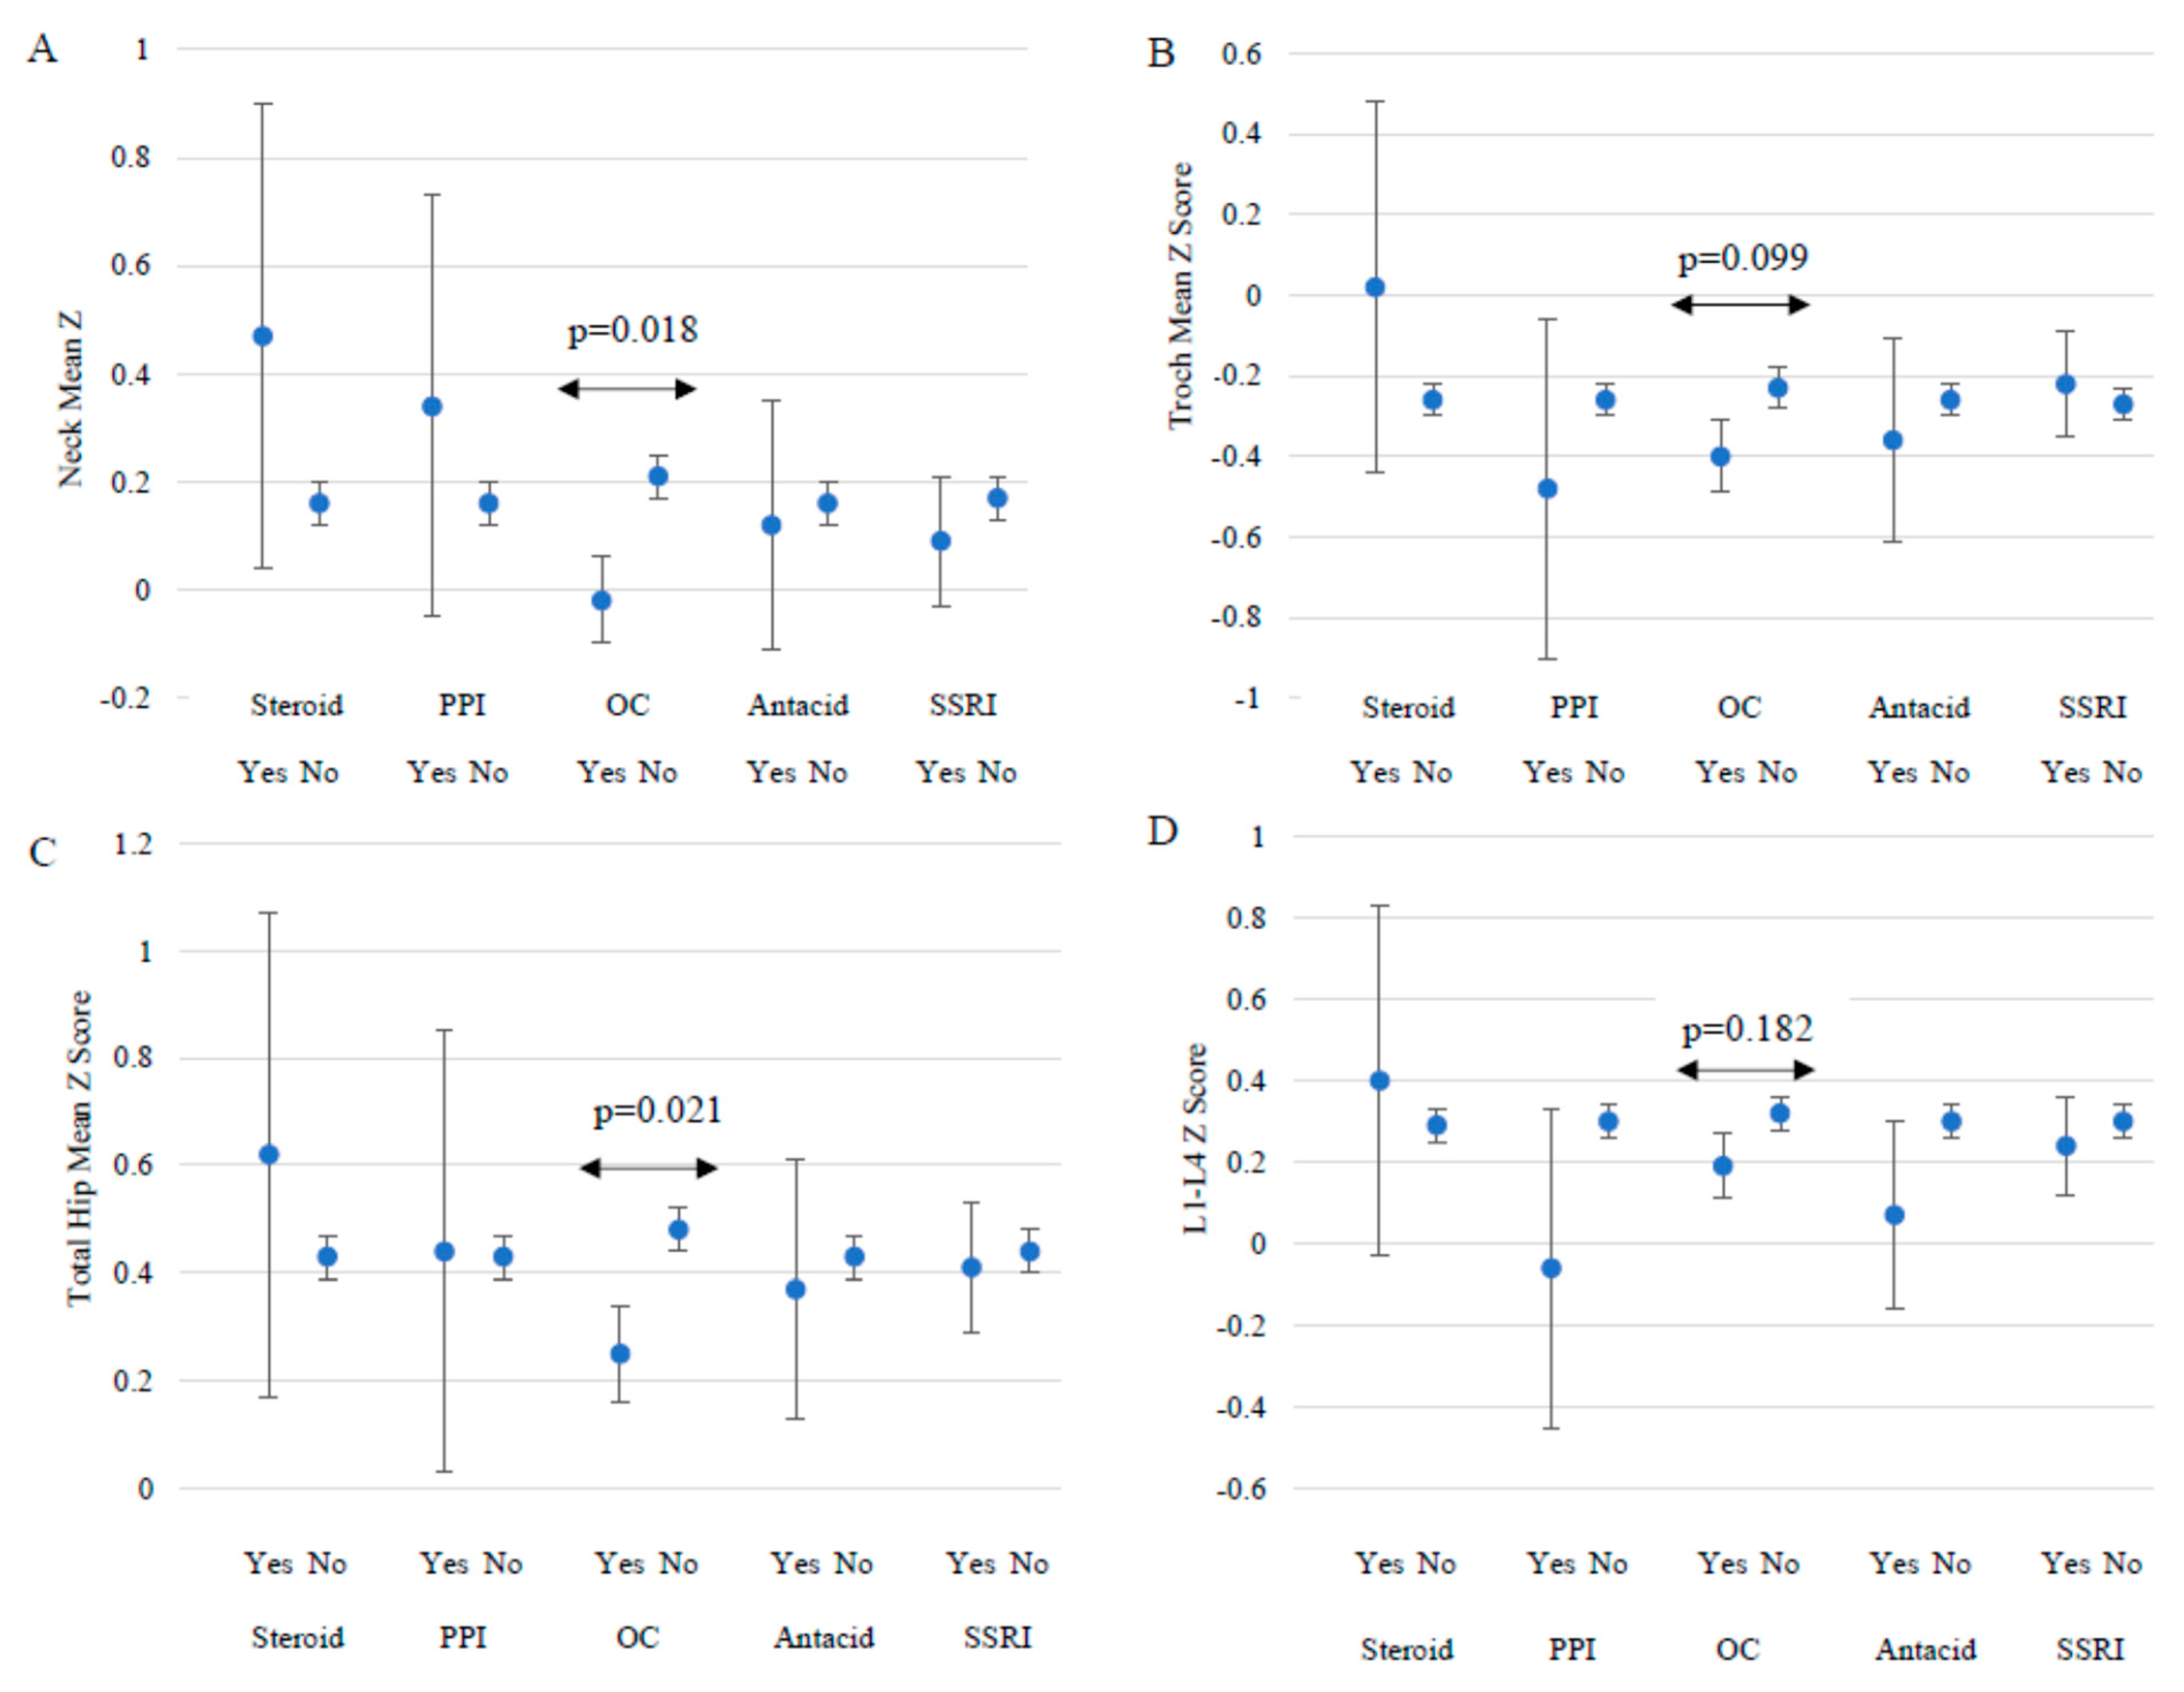
3.3. Medications
3.4. Weight Change and Dieting
3.5. Physical Activity (PA)
3.6. Body Composition
4. Discussion
5. Conclusions
Author Contributions
Funding
Institutional Review Board Statement
Informed Consent Statement
Data Availability Statement
Acknowledgments
Conflicts of Interest
References
- Weaver, C.M.; Gordon, C.M.; Janz, K.F.; Kalkwarf, H.; Lappe, J.M.; Lewis, R.; O’Karma, M.; Wallace, T.C.; Zemel, B. The National Osteoporosis Foundation’s position statement on peak bone mass development and lifestyle factors: A systematic review and implementation recommendations. Osteoporos. Int. 2016, 27, 1281–1386. [Google Scholar] [CrossRef]
- Cosman, F.; de Beur, S.J.; LeBoff, M.; Lewiecki, E.; Tanner, B.; Randall, S.; Lindsay, R. Clinician’s guide to prevention and treatment of osteoporosis. Osteoporos. Int. 2014, 25, 2359–2381. [Google Scholar] [CrossRef] [PubMed]
- NIH Consensus Development Panel on Osteoporosis Prevention, Diagnosis, and Therapy. Osteoporosis prevention, diagnosis, and therapy. J. Am. Med. Assoc. 2001, 285, 785–795. [Google Scholar] [CrossRef] [PubMed]
- Han, C.-S.; Kim, H.-K.; Kim, S. Effects of Adolescents’ Lifestyle Habits and Body Composition on Bone Mineral Density. Int. J. Environ. Res. Public Health 2021, 18, 6170. [Google Scholar] [CrossRef] [PubMed]
- Clarke, J.; Peyre, H.; Alison, M.; Bargiacchi, A.; Stordeur, C.; Boizeau, P.; Mamou, G.; Crépon, S.G.; Alberti, C.; Léger, J. Abnormal bone mineral density and content in girls with early-onset anorexia nervosa. J. Eat. Disord. 2021, 9, 9. [Google Scholar] [CrossRef] [PubMed]
- Chevalley, T.; Bonjour, J.-P.; Ferrari, S.; Rizzoli, R. Influence of age at menarche on forearm bone microstructure in healthy young women. J. Clin. Endocrinol. Metab. 2008, 93, 2594–2601. [Google Scholar] [CrossRef]
- Nattiv, A.; Loucks, A.B.; Manore, M.M.; Sanborn, C.F.; Sundgot-Borgen, J.; Warren, M.P. American College of Sports Medicine position stand. The female athlete triad. Med. Sci. Sports Exerc. 2007, 39, 1867–1882. [Google Scholar]
- Nichols, J.F.; Rauh, M.J.; Barrack, M.T.; Barkai, H.-S. Bone mineral density in female high school athletes: Interactions of menstrual function and type of mechanical loading. Bone 2007, 41, 371–377. [Google Scholar] [CrossRef]
- De Souza, M.J.; Williams, N.I. Physiological aspects and clinical sequelae of energy deficiency and hypoestrogenism in exercising women. Hum. Reprod. Update 2004, 10, 433–448. [Google Scholar] [CrossRef]
- Hergenroeder, A.C.; De Souza, M.J.; Anding, R.H. The Female Athlete Triad: Energy Deficiency, Physiologic Consequences, and Treatment. Adolesc. Med. State Art Rev. 2015, 26, 116–142. [Google Scholar]
- Thralls, K.J.; Nichols, J.F.; Barrack, M.T.; Kern, M.; Rauh, M.J. Body Mass-Related Predictors of the Female Athlete Triad among Adolescent Athletes. Int. J. Sport Nutr. Exerc. Metab. 2016, 26, 17–25. [Google Scholar] [CrossRef] [PubMed]
- Deng, K.-L.; Yang, W.-Y.; Hou, J.-L.; Li, H.; Feng, H.; Xiao, S.-M. Association between Body Composition and Bone Mineral Density in Children and Adolescents: A Systematic Review and Meta-Analysis. Int. J. Environ. Res. Public Health 2021, 18, 12126. [Google Scholar] [CrossRef] [PubMed]
- Meyer, H.; Tverdal, A.; Selmer, R. Weight variability, weight change and the incidence of hip fracture: A prospective study of 39000 middle-aged norwegians. Osteoporos. Int. 1998, 8, 373–378. [Google Scholar] [CrossRef] [PubMed]
- Ensrud, K.E.; Ewing, S.K.; Stone, K.L.; Cauley, J.A.; Bowman, P.J.; Cummings, S.R.; Study of Osteoporotic Fractures Research Group. Intentional and unintentional weight loss increase bone loss and hip fracture risk in older women. J. Am. Geriatr. Soc. 2003, 51, 1740–1747. [Google Scholar] [CrossRef] [PubMed]
- Ihle, R.; Loucks, A.B. Dose-response relationships between energy availability and bone turnover in young exercising women. J. Bone Miner. Res. 2004, 19, 1231–1240. [Google Scholar] [CrossRef] [PubMed]
- Barrack, M.T.; Rauh, M.J.; Nichols, J.F. Cross-sectional evidence of suppressed bone mineral accrual among female adolescent runners. J. Bone Miner. Res. 2010, 25, 1850–1857. [Google Scholar] [CrossRef]
- Almstedt, H.C.; Cook, M.M.; Bramble, L.F.; Dabir, D.V.; LaBrie, J.W. Oral contraceptive use, bone mineral density, and bone turnover markers over 12 months in college-aged females. J. Bone Miner. Metab. 2020, 38, 544–554. [Google Scholar] [CrossRef]
- Goshtasebi, A.; Subotic Brajic, T.; Scholes, D.; Beres Lederer Goldberg, T.; Berenson, A.; Prior, J.C. Adolescent use of combined hormonal contraception and peak bone mineral density accrual: A meta-analysis of international prospective controlled studies. Clin. Endocrinol. 2019, 90, 517–524. [Google Scholar] [CrossRef]
- Brajic, T.S.; Berger, C.; Schlammerl, K.; Macdonald, H.; Kalyan, S.; Hanley, D.A.; Adachi, J.D.; Kovacs, C.S.; Prior, J.C.; CaMos Research Group. Combined hormonal contraceptives use and bone mineral density changes in adolescent and young women in a prospective population-based Canada-wide observational study. J. Musculoskelet Neuronal Interact. 2018, 18, 227–236. [Google Scholar]
- Beals, K.A.; Hill, A.K. The prevalence of disordered eating, menstrual dysfunction, and low bone mineral density among US collegiate athletes. Int. J. Sport Nutr. Exerc. Metab. 2006, 16, 1–23. [Google Scholar] [CrossRef]
- Cobb, K.L.; Bachrach, L.K.; Greendale, G.; Marcus, R.; Neer, R.M.; Nieves, J.; Sowers, M.F.; Brown, B.W., Jr.; Gopalakrishna, G.; Luetters, C. Disordered eating, menstrual irregularity, and bone mineral density in female runners. Med. Sci. Sports Exerc. 2003, 35, 711–719. [Google Scholar] [CrossRef] [PubMed]
- Nichols, J.F.; Rauh, M.J.; Lawson, M.J.; Ji, M.; Barkai, H.-S. Prevalence of the female athlete triad syndrome among high school athletes. Arch. Pediatr. Adolesc. Med. 2006, 160, 137–142. [Google Scholar] [CrossRef] [PubMed]
- Bellver, M.; Del Rio, L.; Jovell, E.; Drobnic, F.; Trilla, A. Bone mineral density and bone mineral content among female elite athletes. Bone 2019, 127, 393–400. [Google Scholar] [CrossRef] [PubMed]
- Mudd, L.M.; Fornetti, W.; Pivarnik, J.M. Bone mineral density in collegiate female athletes: Comparisons among sports. J. Athl. Train. 2007, 42, 403–408. [Google Scholar] [PubMed]
- Wu, F.J.; Sheu, S.Y.; Lin, H.C. Osteoporosis is associated with antiepileptic drugs: A population-based study. Epileptic Disord. 2014, 16, 333–342. [Google Scholar] [CrossRef]
- Leutscher, P.D.; Bagley, S.W. Health-related challenges in United States Peace Corps volunteers serving for two years in Madagascar. J. Travel Med. 2003, 10, 263–267. [Google Scholar] [CrossRef]
- Freire, A.N.; Brown, K.N.; Fleischer, S.H.; Eggett, D.L.; Creer, A.R.; Graf, M.I.; Dyckman, J.; Turley, J.M.; Fullmer, S. Prevalence of Female Athlete Triad Risk Factors among Female International Volunteers and College Age-Matched Controls. Int. J. Environ. Res. Public Health 2022, 19, 1223. [Google Scholar] [CrossRef]
- Moretto, M.; Silva, C.C.; Kurokawa, C.S.; Fortes, C.; Capela, R.C.; Teixeira, A.S.; Dalmas, J.C.; Goldberg, T. Bone mineral density in healthy female adolescents according to age, bone age and pubertal breast stage. Open Orthop. J. 2011, 5, 324–330. [Google Scholar]
- Puntila, E.; Kröger, H.; Lakka, T.; Honkanen, R.; Tuppurainen, M. Physical activity in adolescence and bone density in periand postmenopausal women: A population-based study. Bone 1997, 21, 363–367. [Google Scholar] [CrossRef]
- Bidoli, E.; Schinella, D.; Franceschi, S. Physical activity and bone mineral density in Italian middle-aged women. Eur. J. Epidemiol. 1998, 14, 153–157. [Google Scholar] [CrossRef]
- Ainsworth, B.E.; Haskell, W.L.; Leon, A.S.; Jacobs, D.R., Jr.; Montoye, H.J.; Sallis, J.F.; Paffenbarger, R.S., Jr. Compendium of physical activities: Classification of energy costs of human physical activities. Med. Sci. Sports Exerc. 1993, 25, 71–80. [Google Scholar] [CrossRef] [PubMed]
- Popat, V.B.; Prodanov, T.; Calis, K.A.; Nelson, L.M. The Menstrual Cycle. Ann. N. Y. Acad. Sci. 2008, 1135, 43–51. [Google Scholar] [CrossRef] [PubMed]
- Meczekalski, B.; Podfigurna-Stopa, A.; Genazzani, A.R. Hypoestrogenism in young women and its influence on bone mass density. Gynecol. Endocrinol. 2010, 26, 652–657. [Google Scholar] [CrossRef]
- Ravi, S.; Kujala, U.M.; Tammelin, T.H.; Hirvensalo, M.; Kovanen, V.; Valtonen, M.; Waller, B.; Aukee, P.; Sipilä, S.; Laakkonen, E.K. Adolescent sport participation and age at menarche in relation to midlife body composition, bone mineral density, fitness, and physical activity. J. Clin. Med. 2020, 9, 3797. [Google Scholar] [CrossRef] [PubMed]
- Chang, S.-R.; Chen, K.-H. Age at menarche of three-generation families in Taiwan. Ann. Hum. Biol. 2008, 35, 394–405. [Google Scholar] [CrossRef] [PubMed]
- Gavit, S.V.; Patel, L.S.; Dhamangaonkar, B.M. A study to evaluate the relation between the age at menarche and bone mineral density in pre-and post-menopausal women. Natl. J. Physiol. Pharm. Pharmacol. 2019, 9, 361–364. [Google Scholar] [CrossRef]
- Kandemir, N.; Slattery, M.; Ackerman, K.E.; Tulsiani, S.; Bose, A.; Singhal, V.; Baskaran, C.; Ebrahimi, S.; Goldstein, M.; Eddy, K. Bone parameters in anorexia nervosa and athletic amenorrhea: Comparison of two hypothalamic amenorrhea states. J. Clin. Endocrinol. Metab. 2018, 103, 2392–2402. [Google Scholar] [CrossRef]
- Solmi, M.; Veronese, N.; Correll, C.; Favaro, A.; Santonastaso, P.; Caregaro, L.; Vancampfort, D.; Luchini, C.; De Hert, M.; Stubbs, B. Bone mineral density, osteoporosis, and fractures among people with eating disorders: A systematic review and meta-analysis. Acta Psychiatr. Scand. 2016, 133, 341–351. [Google Scholar] [CrossRef]
- Nose-Ogura, S.; Yoshino, O.; Kanatani, M.; Dohi, M.; Tabei, K.; Harada, M.; Hiraike, O.; Kawahara, T.; Osuga, Y.; Fujii, T. Effect of transdermal estradiol therapy on bone mineral density of amenorrheic female athletes. Scand. J. Med. Sci. Sports 2020, 30, 1379–1386. [Google Scholar] [CrossRef]
- Ackerman, K.E.; Sokoloff, N.C.; Maffazioli, G.D.N.; Clarke, H.; Lee, H.; Misra, M. Fractures in relation to menstrual status and bone parameters in young athletes. Med. Sci. Sports Exerc. 2015, 47, 1577. [Google Scholar] [CrossRef]
- Maïmoun, L.; Renard, E.; Lefebvre, P.; Bertet, H.; Philibert, P.; Sénèque, M.; Picot, M.-C.; Dupuy, A.-M.; Gaspari, L.; Bouallègue, F.B. Oral contraceptives partially protect from bone loss in young women with anorexia nervosa. Fertil. Steril. 2019, 111, 1020–1029.e2. [Google Scholar] [CrossRef] [PubMed]
- Merki-Feld, G.S.; Bitzer, J. Contraception in adolescents with anorexia nervosa. Is there evidence for a negative impact of combined hormonal contraceptives on bone mineral density and the course of the disease? Eur. J. Contracept. Reprod. Health Care 2020, 25, 213–220. [Google Scholar] [CrossRef] [PubMed]
- Wu, M.; Hunt, W.R.; Putman, M.S.; Tangpricha, V. Oral ethinyl estradiol treatment in women with cystic fibrosis is associated with lower bone mineral density. J. Clin. Transl. Endocrinol. 2020, 20, 100223. [Google Scholar] [CrossRef] [PubMed]
- Kim, Y.-S.; Han, J.-J.; Lee, J.; Choi, H.S.; Kim, J.H.; Lee, T. The correlation between bone mineral density/trabecular bone score and body mass index, height, and weight. Osteoporos. Sarcopen. 2017, 3, 98–103. [Google Scholar] [CrossRef] [PubMed]
- Chau, K.; Atkinson, S.A.; Taylor, V.H. Are selective serotonin reuptake inhibitors a secondary cause of low bone density? J. Osteoporos. 2012, 2012, 323061. [Google Scholar] [CrossRef]
- Soltani, S.; Hunter, G.; Kazemi, A.; Shab-Bidar, S. The effects of weight loss approaches on bone mineral density in adults: A systematic review and meta-analysis of randomized controlled trials. Osteoporos. Int. 2016, 27, 2655–2671. [Google Scholar] [CrossRef]
- Mazess, R.B.; Barden, H.S.; Drinka, P.J.; Bauwens, S.F.; Orwoll, E.S.; Bell, N.H. Influence of age and body weight on spine and femur bone mineral density in US white men. J. Bone Miner. Res. 1990, 5, 645–652. [Google Scholar] [CrossRef]
- Nagata, J.M.; Carlson, J.L.; Golden, N.H.; Murray, S.B.; Long, J.; Leonard, M.B.; Peebles, R. Associations between exercise, bone mineral density, and body composition in adolescents with anorexia nervosa. Eat. Weight Disord. 2019, 24, 939–945. [Google Scholar] [CrossRef]
- Liang, M.; Braun, W.; Bassin, S.; Dutto, D.; Pontello, A.; Wong, N.; Spalding, T.; Arnaud, S. Effect of high-impact aerobics and strength training on BMD in young women aged 20–35 years. Int. J. Sports Med. 2011, 32, 100–108. [Google Scholar] [CrossRef]
- Fullmer, S. Lumbar Spine and Total Hip Bone Mineral Density Are Not Related to Current Aerobic Activity in Healthy College-Age Women. Doctoral Disseratation, Brigham Young University, Provo, UT, USA, 2004. [Google Scholar]
- Burrows, M.; Nevill, A.M.; Bird, S.; Simpson, D. Physiological factors associated with low bone mineral density in female endurance runners. Br. J. Sports Med. 2003, 37, 67–71. [Google Scholar] [CrossRef]
- Kim, J.; Kwon, H.; Heo, B.-K.; Joh, H.-K.; Lee, C.M.; Hwang, S.-S.; Park, D.; Park, J.-H. The association between fat mass, lean mass and bone mineral density in premenopausal women in Korea: A cross-sectional study. Korean J. Fam. Med. 2018, 39, 74–84. [Google Scholar] [CrossRef] [PubMed]
- Bierhals, I.O.; dos Santos Vaz, J.; Bielemann, R.M.; de Mola, C.L.; Barros, F.C.; Gonçalves, H.; Wehrmeister, F.C.; Assunção, M.C.F. Associations between body mass index, body composition and bone density in young adults: Findings from a southern Brazilian cohort. BMC Musculoskelet. Disord. 2019, 20, 322. [Google Scholar] [CrossRef] [PubMed]
- Pomeroy, E.; Macintosh, A.; Wells, J.C.; Cole, T.J.; Stock, J.T. Relationship between body mass, lean mass, fat mass, and limb bone cross-sectional geometry: Implications for estimating body mass and physique from the skeleton. Am. J. Phys. Anthropol. 2018, 166, 56–69. [Google Scholar] [CrossRef] [PubMed]
- Marchand, G.B.; Carreau, A.-M.; Weisnagel, S.J.; Bergeron, J.; Labrie, F.; Lemieux, S.; Tchernof, A. Increased body fat mass explains the positive association between circulating estradiol and insulin resistance in postmenopausal women. Am. J. Physiol.-Endocrinol. Metab. 2018, 314, E448–E456. [Google Scholar] [CrossRef] [PubMed]


| Mean ± SD | Range | |
|---|---|---|
| Age | 23.3 ± 1.3 | 21.1–27.2 |
| Current Height (cm) | 166.3 ± 7.1 | 147.3–193.0 |
| Current Weight (kg) | 65.5 ± 13.5 | 42.7–136.4 |
| Current BMI (kg/m2) | 23.7 ± 4.5 | 15.8–45.6 |
| Measurement site | Mean ± SD | Range |
| L1–L4 BMD (g/cm2) | 1.22 ± 0.13 | 0.92–1.71 |
| L1–L4 Z-Score | 0.29 ± 0.96 | −1.88–4.16 |
| Neck Mean BMD (g/cm2) | 1.07 ± 0.14 | 0.75–2.02 |
| Neck Mean Z-Score | 0.16 ± 0.96 | −1.97–3.26 |
| Troch Mean BMD (g/cm2) | 0.83 ± 0.12 | 0.53–1.37 |
| Troch Mean Z-Score | −0.26 ± 1.02 | −2.86–4.52 |
| Total Hip BMD (g/cm2) | 1.22 ± 0.10 | 0.75–1.48 |
| Total Hip Mean Z-Score | 0.43 ± 0.99 | −2.02–3.45 |
| Weight Loss Methods | N (%) | Neck Z-Score | p-Value | Troch Z-Score | p-Value | Total Hip Z-Score | p-Value | L1-L4 Z-Score | p-Value |
|---|---|---|---|---|---|---|---|---|---|
| LSM ± SE * | LSM ± SE | LSM ± SE | LSM ± SE | ||||||
| Liquid diet supplements | |||||||||
| Yes | 20 (3.2) | 0.36 ± 0.21 | 0.3563 | −0.11 ± 0.23 | 0.4816 | 0.62 ± 0.22 | 0.3838 | 0.38 ± 0.21 | 0.6529 |
| No | 612 (96.8) | 0.16 ± 0.04 | −0.27 ± 0.04 | 0.43 ± 0.04 | 0.28 ± 0.04 | ||||
| Very low calorie-diet | |||||||||
| (<1000 kcal) | |||||||||
| Yes | 80 (12.8) | −0.04 ± 0.11 | 0.0417 | −0.50 ± 0.11 | 0.0249 | 0.15 ± 0.11 | 0.0073 | −0.03 ± 0.11 | 0.001 ** |
| No | 552 (87.2) | 0.19 ± 0.04 | −0.23 ± 0.04 | 0.47 ± 0.04 | 0.33 ± 0.04 | ||||
| Fasting | |||||||||
| (for nonreligious reasons) | |||||||||
| Yes | 32 (5.1) | 0.22 ± 0.17 | 0.6922 | −0.19 ± 0.18 | 0.6888 | 0.46 ± 0.18 | 0.8734 | 0.15 ± 0.17 | 0.4101 |
| No | 600 (94.9) | 0.16 ± 0.04 | −0.27 ± 0.04 | 0.43 ± 0.04 | 0.29 ± 0.04 | ||||
| High protein/low | |||||||||
| carbohydrate diet | |||||||||
| Yes | 46 (7.3) | 0.16 ± 0.14 | 0.998 | −0.25 ± 0.15 | 0.9273 | 0.40 ± 0.15 | 0.8501 | 0.35 ± 0.14 | 0.6485 |
| No | 586 (92.7) | 0.16 ± 0.04 | −0.26 ± 0.04 | 0.43 ± 0.04 | 0.28 ± 0.04 | ||||
| Additional exercise | |||||||||
| beyond regular training | |||||||||
| Yes | 79 (12.6) | 0.07 ± 0.11 | 0.3671 | −0.24 ± 0.12 | 0 .7974 | 0.35 ± 0.11 | 0.4184 | 0.09 ± 0.11 | 0.0497 |
| No | 553 (87.4) | 0.17 ± 0.04 | −0.27 ± 0.04 | 0.44 ± 0.04 | 0.31 ± 0.04 | ||||
| Diet pills or fat | |||||||||
| burning supplements | |||||||||
| Yes | 15 (2.4) | 0.29 ± 0.25 | 0.5988 | 0.18 ± 0.26 | 0.0861 | 0.71 ± 0.25 | 0.27 | 0.28 ± 0.24 | 0.9797 |
| No | 617 (97.6) | 0.16 ± 0.04 | −0.27 ± 0.04 | 0.42 ± 0.04 | 0.29 ± 0.04 | ||||
| Self-induced vomiting | |||||||||
| Yes | 15 (2.4) | −0.14 ± 0.25 | 0.2129 | −0.67 ± 0.26 | 0.1191 | 0.08 ± 0.26 | 0.1627 | 0.03 ± 0.25 | 0.295 |
| No | 617 (97.6) | 0.17 ± 0.04 | −0.25 ± 0.04 | 0.44 ± 0.04 | 0.29 ± 0.04 | ||||
| Laxative use | |||||||||
| Yes | 12 (1.9) | −0.12 ± 0.28 | 0.3021 | −0.41 ± 0.30 | 0.617 | 0.12 ± 0.29 | 0.2699 | 0.01 ± 0.28 | 0.32 |
| No | 620 (98.1) | 0.17 ± 0.04 | −0.26 ± 0.04 | 0.44 ± 0.04 | 0.29 ± 0.04 | ||||
| Other | |||||||||
| Yes | 44 (7.0) | 0.06 ± 0.14 | 0.4789 | −0.44 ± 0.15 | 0.2322 | 0.33 ± 0.15 | 0.4812 | 0.20 ± 0.14 | 0.5172 |
| No | 588 (93.0) | 0.17 ± 0.04 | −0.25 ± 0.04 | 0.44 ± 0.04 | 0.29 ± 0.04 | ||||
| None of the above | |||||||||
| Yes | 283 (45.2) | 0.14 ± 0.06 | 0.5273 | −0.24 ± 0.06 | 0.564 | 0.45 ± 0.06 | 0.7441 | 0.38 ± 0.06 | 0.0281 |
| No | 349 (54.8) | 0.18 ± 0.05 | −0.28 ± 0.05 | 0.42 ± 0.05 | 0.21 ± 0.05 |
| Physical Activity Changes | n (%) | Neck Z-Score | p-Value | Troch Z-Score | p-Value | Total Hip Z-Score | p-Value | L1-L4 Z-Score | p-Value |
|---|---|---|---|---|---|---|---|---|---|
| LSM ± SE * | LSM ± SE * | LSM ± SE * | |||||||
| Exercised more | 202 (39.4) | 0.06 ± 0.07 xy | 0.0003 | −0.39 ± 0.07 xy | 0.0003 | 0.33 ± 0.07 xy | 0.0005 | 0.23 ± 0.07 | 0.0165 |
| Exercised less | 213 (41.5) | 0.33 ± 0.06 x | −0.05 ± 0.07 x | 0.61 ± 0.07 x | 0.46 ± 0.07 | ||||
| No Change | 92 (17.9) | −0.15 ± 0.10 y | −0.52 ± 0.10 y | 0.13 ± 0.10 y | 0.08 ± 0.10 | ||||
| Don’t know | 6 (1.2) | 0.15 ± 0.41 xy | −0.13 ± 0.44 xy | 0.45 ± 0.43 xy | −0.19 ± 0.43 |
| Neck Z-Score | Troch Z-Sscore | Total Hip Z-Score | L1-L4 Z-Score | ||||||
|---|---|---|---|---|---|---|---|---|---|
| MET Hours Category (Hours/Week) | Mean ± SD | R | p-Value | R | p-Value | R | p-Value | R | p-Value |
| Total MET Hours | 90.7 ± 76.6 | 0.056 | 0.2218 | 0.057 | 0.2088 | 0.051 | 0.2587 | 0.004 | 0.9326 |
| Moderate Activity (3–5.9 MET equivalents) | 11.3 ± 9.3 | 0.021 | 0.6369 | −0.005 | 0.9056 | 0.004 | 0.9363 | 0.033 | 0.457 |
| Vigorous Activity (6–10.9 MET equivalents) | 3.4 ± 4.1 | 0.095 | 0.0335 | 0.117 | 0.008 * | 0.098 | 0.028 | 0.068 | 0.1271 |
| Very Vigorous Activity (11–14.9 MET equivalents) | 1.0 ± 2.1 | 0.074 | 0.0966 | 0.121 | 0.007 * | 0.108 | 0.016 | 0.071 | 0.1118 |
| Extremely Vigorous Activity (15–18 MET equivalents) | 0.3 ± 1.1 | 0.010 | 0.8217 | 0.039 | 0.3856 | 0.032 | 0.4712 | 0.024 | 0.5823 |
| Body Composition (kg) | |||||||||
| Total Bone Mass | 2.4 ± 0.3 | 0.644 | <0.0001 ** | 0.657 | <0.0001 ** | 0.543 | <0.0001 ** | 0.469 | <0.0001 ** |
| Total Fat Mass | 20.9 ± 8.6 | 0.215 | <0.0001 ** | 0.273 | 0.0001 ** | 0.225 | <0.0001 ** | 0.098 | 0.027 |
| Total Lean Mass | 40.9 ± 5.2 | 0.437 | <0.0001 ** | 0.468 | <0.0001 ** | 0.413 | <0.0001 ** | 0.134 | 0.002 ** |
| Total Fat Free Mass | 43.4 ± 5.4 | 0.615 | 0.025 | 0.485 | <0.0001 ** | 0.423 | <0.0001 ** | 0.153 | 0.008 |
| Total Mass | 64.3 ± 12.1 | 0.366 | <0.0001 ** | 0.361 | <0.0001 ** | 0.582 | 0.037 | 0.011 | 0.8459 |
| VAT | 0.2 ± 0.3 | 0.197 | 0.006 | 0.168 | 0.003 | 0.201 | <0.0001 ** | 0.067 | 0.1318 |
Publisher’s Note: MDPI stays neutral with regard to jurisdictional claims in published maps and institutional affiliations. |
© 2022 by the authors. Licensee MDPI, Basel, Switzerland. This article is an open access article distributed under the terms and conditions of the Creative Commons Attribution (CC BY) license (https://creativecommons.org/licenses/by/4.0/).
Share and Cite
Fleischer, S.H.; Freire, A.K.; Brown, K.; Creer, A.; Eggett, D.L.; Fullmer, S. Association of Short-Term Changes in Menstrual Frequency, Medication Use, Weight and Exercise on Bone Mineral Density in College-Aged Women. Int. J. Environ. Res. Public Health 2022, 19, 10363. https://0-doi-org.brum.beds.ac.uk/10.3390/ijerph191610363
Fleischer SH, Freire AK, Brown K, Creer A, Eggett DL, Fullmer S. Association of Short-Term Changes in Menstrual Frequency, Medication Use, Weight and Exercise on Bone Mineral Density in College-Aged Women. International Journal of Environmental Research and Public Health. 2022; 19(16):10363. https://0-doi-org.brum.beds.ac.uk/10.3390/ijerph191610363
Chicago/Turabian StyleFleischer, Stacie H., Annalisa K. Freire, Katie Brown, Andrew Creer, Dennis L. Eggett, and Susan Fullmer. 2022. "Association of Short-Term Changes in Menstrual Frequency, Medication Use, Weight and Exercise on Bone Mineral Density in College-Aged Women" International Journal of Environmental Research and Public Health 19, no. 16: 10363. https://0-doi-org.brum.beds.ac.uk/10.3390/ijerph191610363