
Airborne Sound Power Levels and Spectra of Noise Sources in Port Areas
 ,
,  , ,
, ,  and
and
Abstract
:1. Introduction
2. Available Source Characterization Guidelines for Noise Mapping of Port Areas
- Road:
- Internal traffic;
- Port-related external traffic;
- External traffic not generated by the port.
- Railways:
- Internal traffic;
- Port-related external traffic;
- External traffic not generated by the port.
- Ships:
- Sailing at a reduced speed approaching the quay;
- Moored in stationary conditions;
- Mooring operations;
- Moored during loading/unloading operations (without auxiliary machinery).
- Port and industrial:
- Fixed sources;
- Mobile sources;
- Area sources.
3. Collection of Noise Emission Data of Major Port Sources
- The outcomes of the REPORT project [16] for transtainer, reach stacker, reefer and gantry cranes;
- The paper “Container Terminals and Noise” for container ships, straddle carriers and tractors [19];
- The report “Technical noise investigations at Hamburg City cruise terminals” of the INTERREG Green Cruise Port for moored cruise ships, reefers and forklifts [20];
- The outcomes of the NEPTUNES project for ships and other sources [21];
- The paper “Noise emission Ro-Ro terminals” for Ro-Ro moored ships [22];
- The paper “Airborne noise emissions from ships: Experimental characterization of the source and propagation over land” for container ships [23];
- The paper “Evaluation and control of cruise ships noise in urban areas” for cruise ships [24];
- The report “Noise from ships in ports” for moored ships and reefers [25];
- The report of the Lloyd’s Register regarding how the noise emissions of a moored ship have to be modelled [26];
- The paper “Pass-by Characterization of Noise Emitted by Different Categories of Seagoing Ships in Ports” [29];
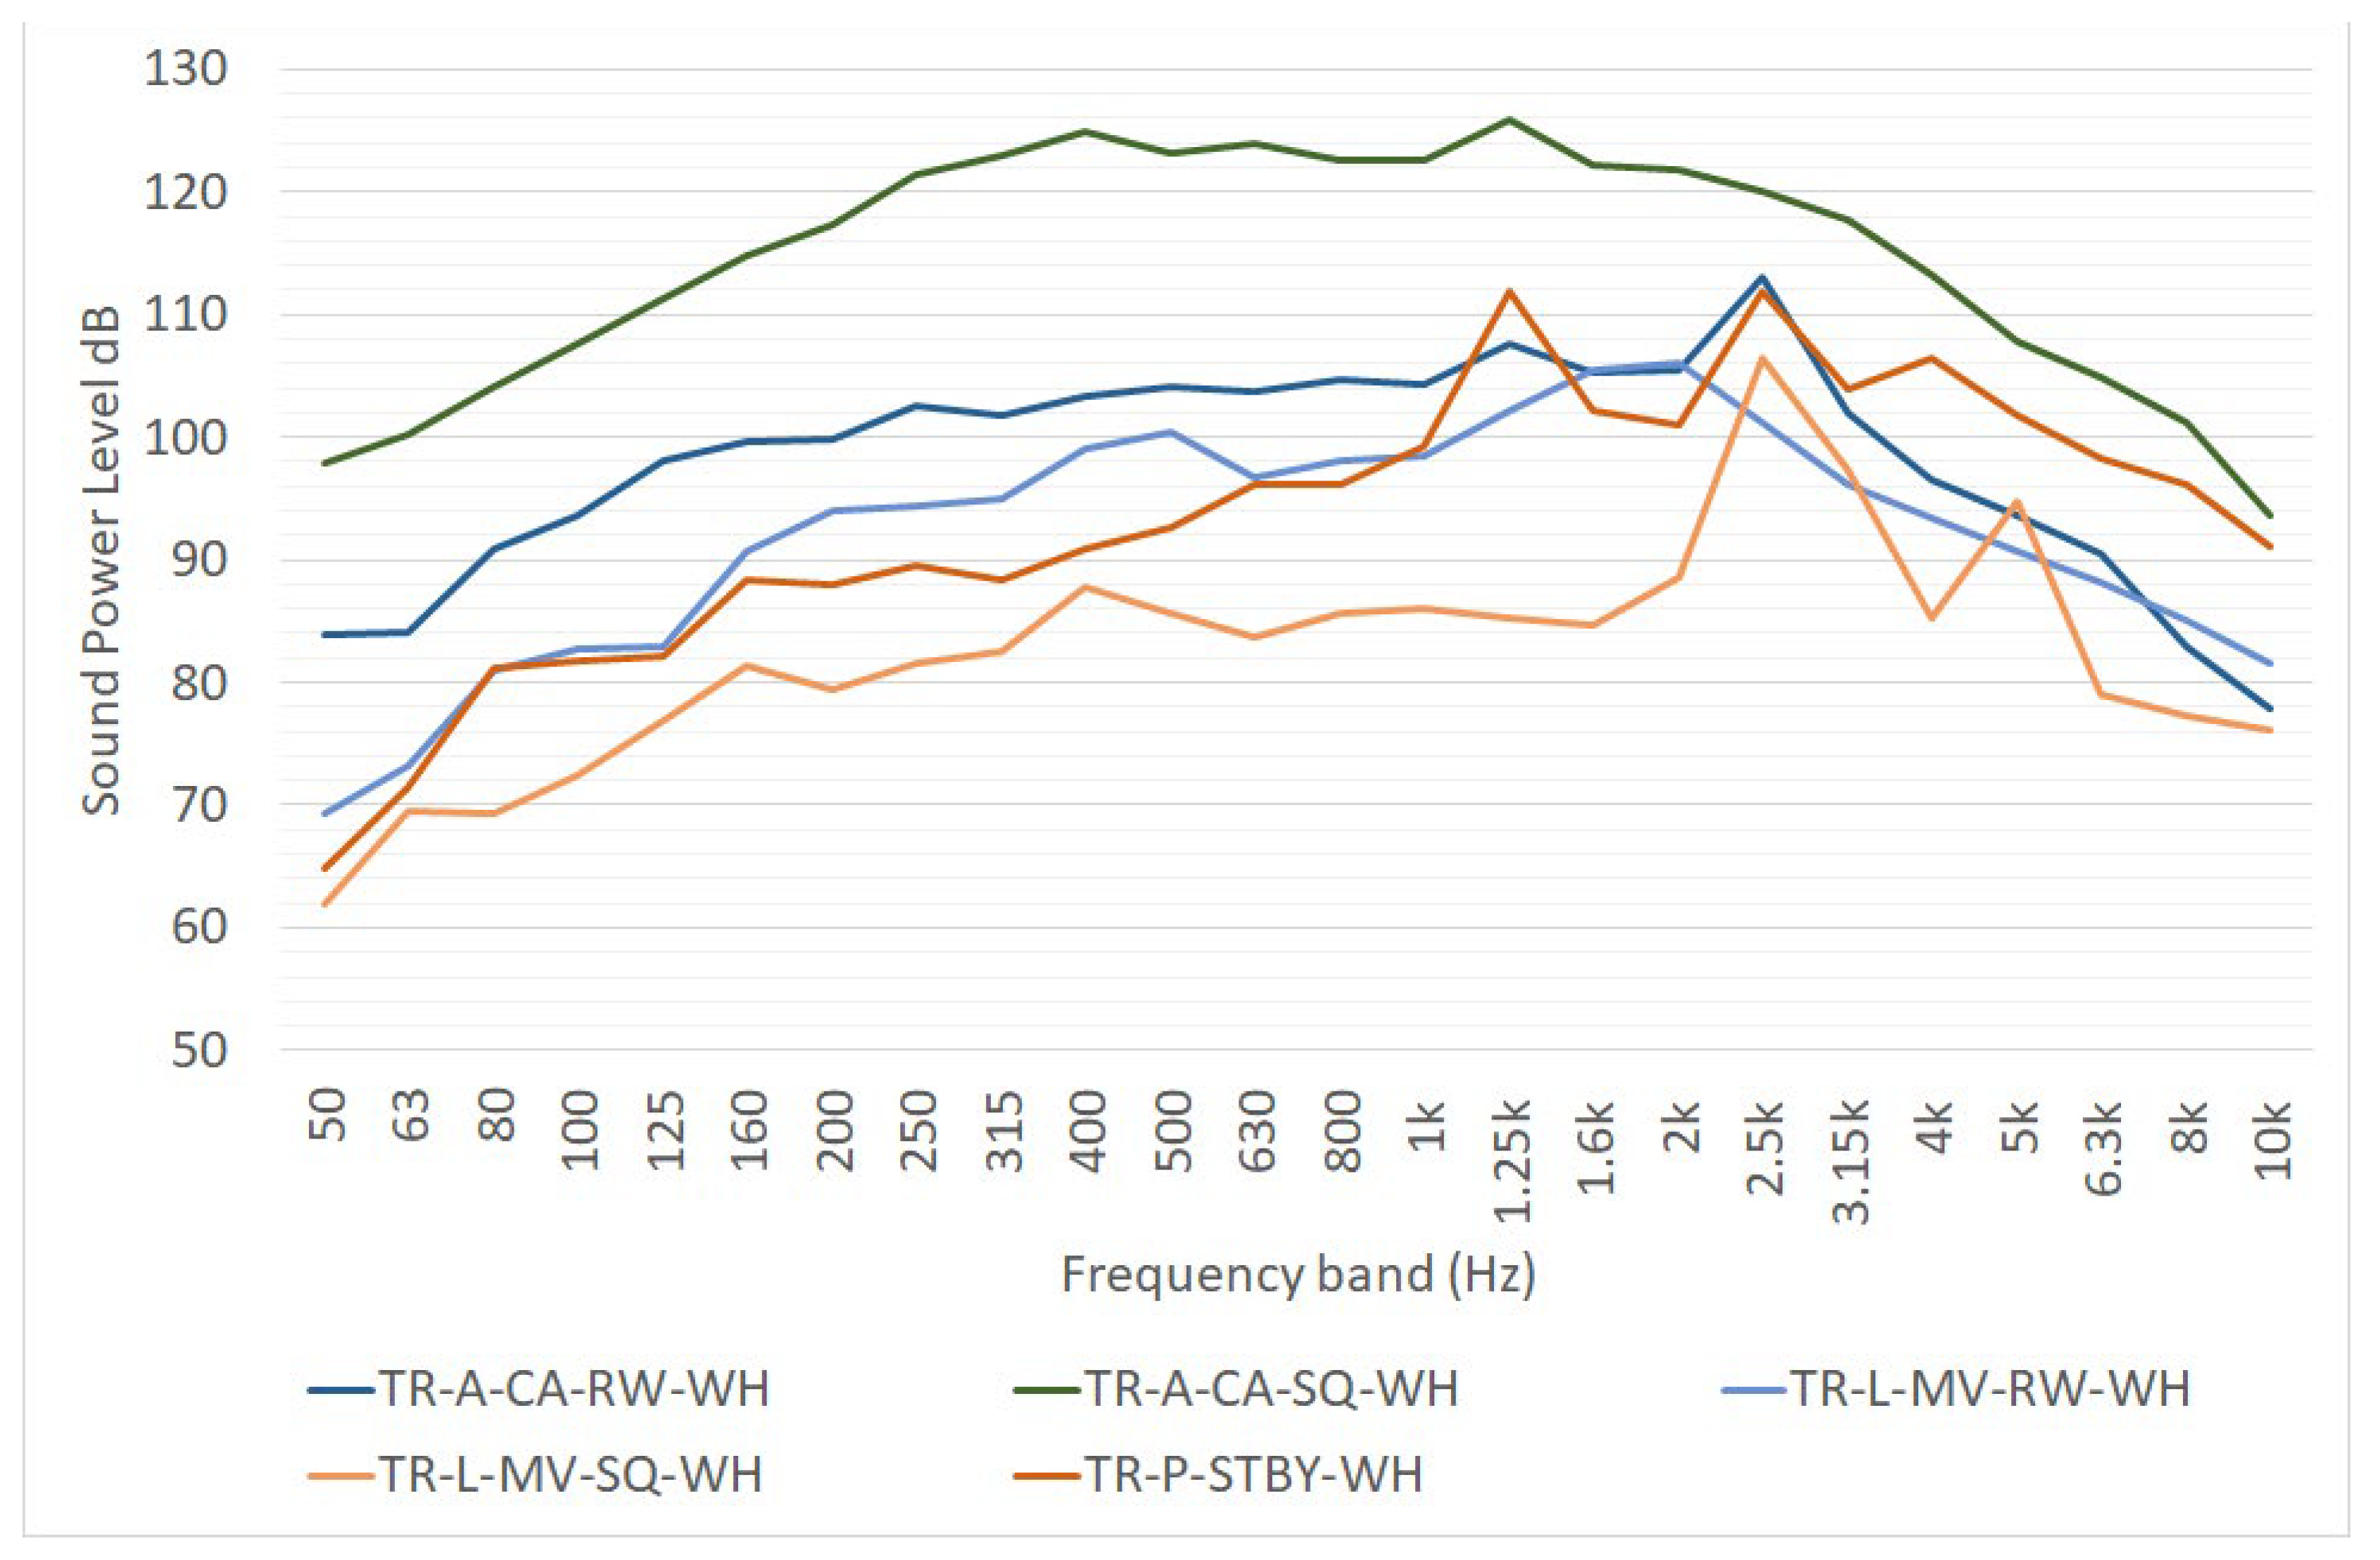
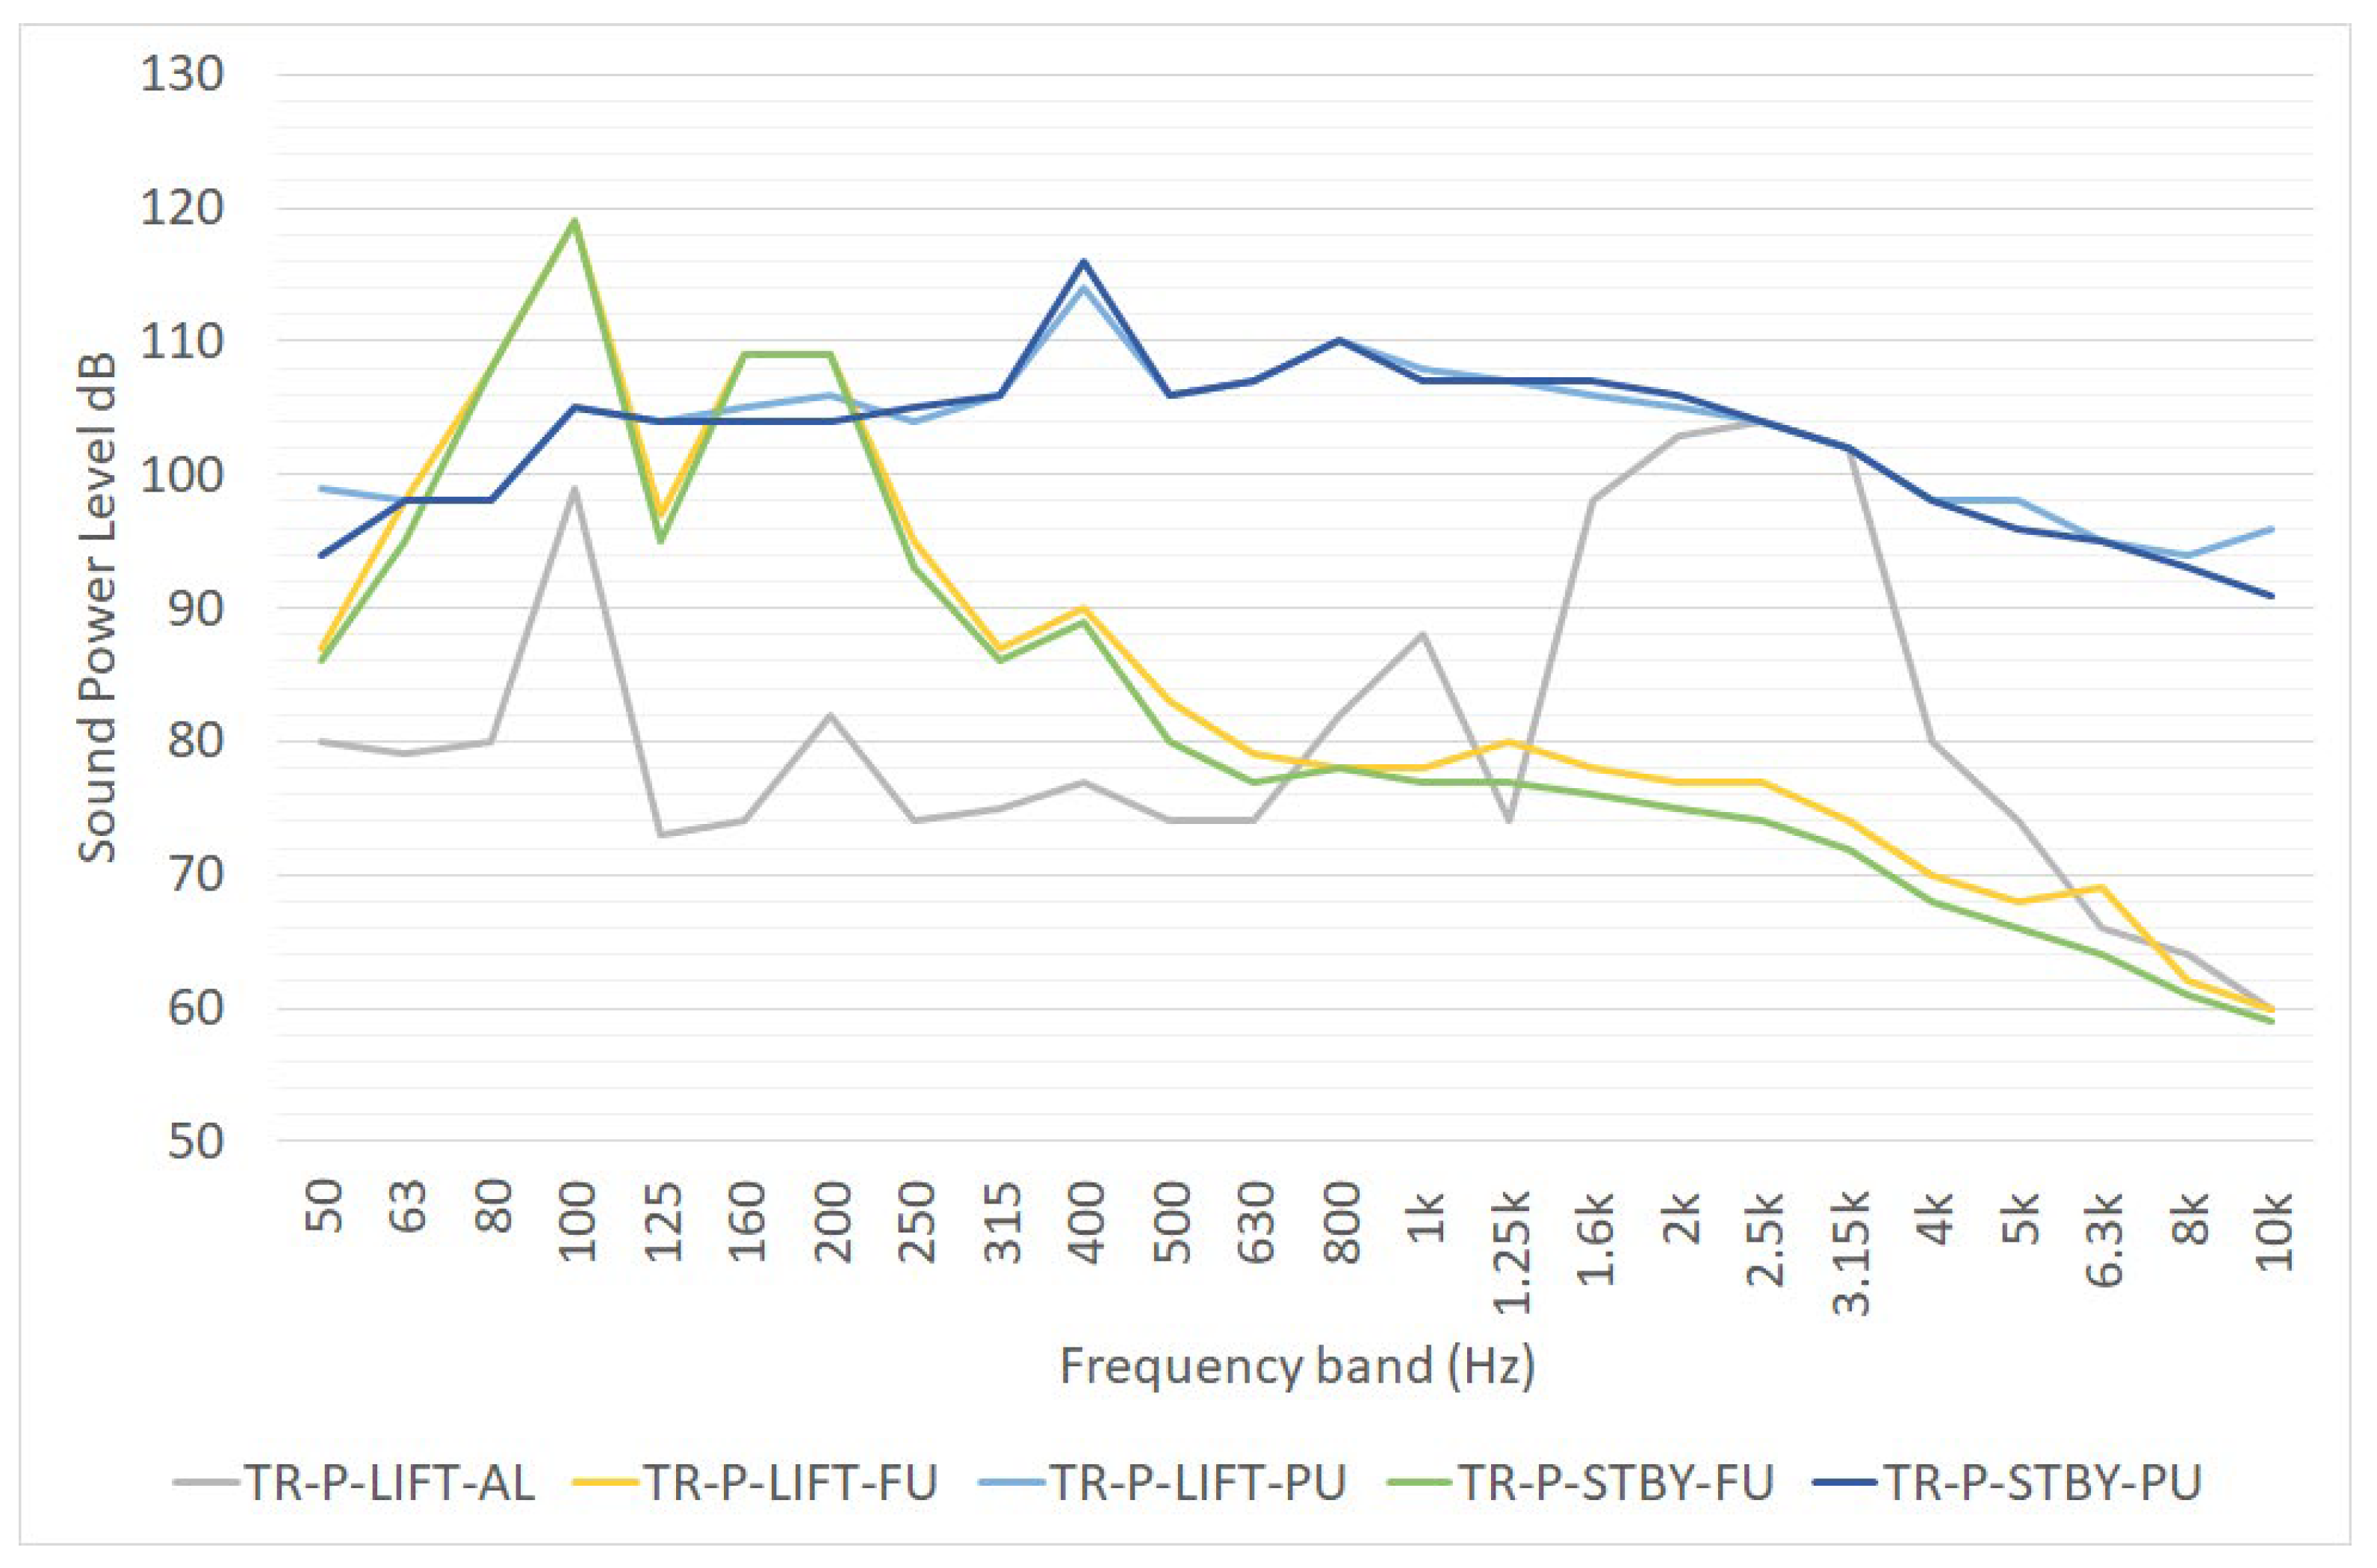
3.1. Transtainer
- TR-A-CA-RW-WH considering an equivalent area source, device performing a complete activity, measurement focused on the railway side;
- TR-A-CA-SQ-WH, same as the previous item, but focused on the square side;
- TR-L-MV-RW-WH considering a linear noise source representing the movement of the transtainer on the rail, measurement focused on the railway side;
- TR-L-MV-SQ-WH considering a linear noise source representing the movement of the transtainer on the rail, measurement focused on the square side;
- TR-P-STBY-WH considering a point noise source representing the transtainer on standby. The point noise source can be used to model the emission of the whole device.
- TR-P-LIFT-AL is the sound power level of a point noise source representing the noise emission of the alarm signal when the transtainer is performing an operation of lifting or picking up containers;
- TR-P-LIFT-FU is the sound power level of a point noise source representing the noise emission of the funnel when the transtainer is performing an operation of lifting or picking up containers;
- TR-P-LIFT-PU is the sound power level of a point noise source representing the noise emission of the power unit when the transtainer is performing an operation of lifting or picking up containers;
- TR-P-STBY-FU is the sound power level of a point noise source representing the noise emission of the funnel when the transtainer is on standby (idling);
- TR-P-STBY-PU is the sound power level of a point noise source representing the noise emission of the power unit when the transtainer is on standby (idling).
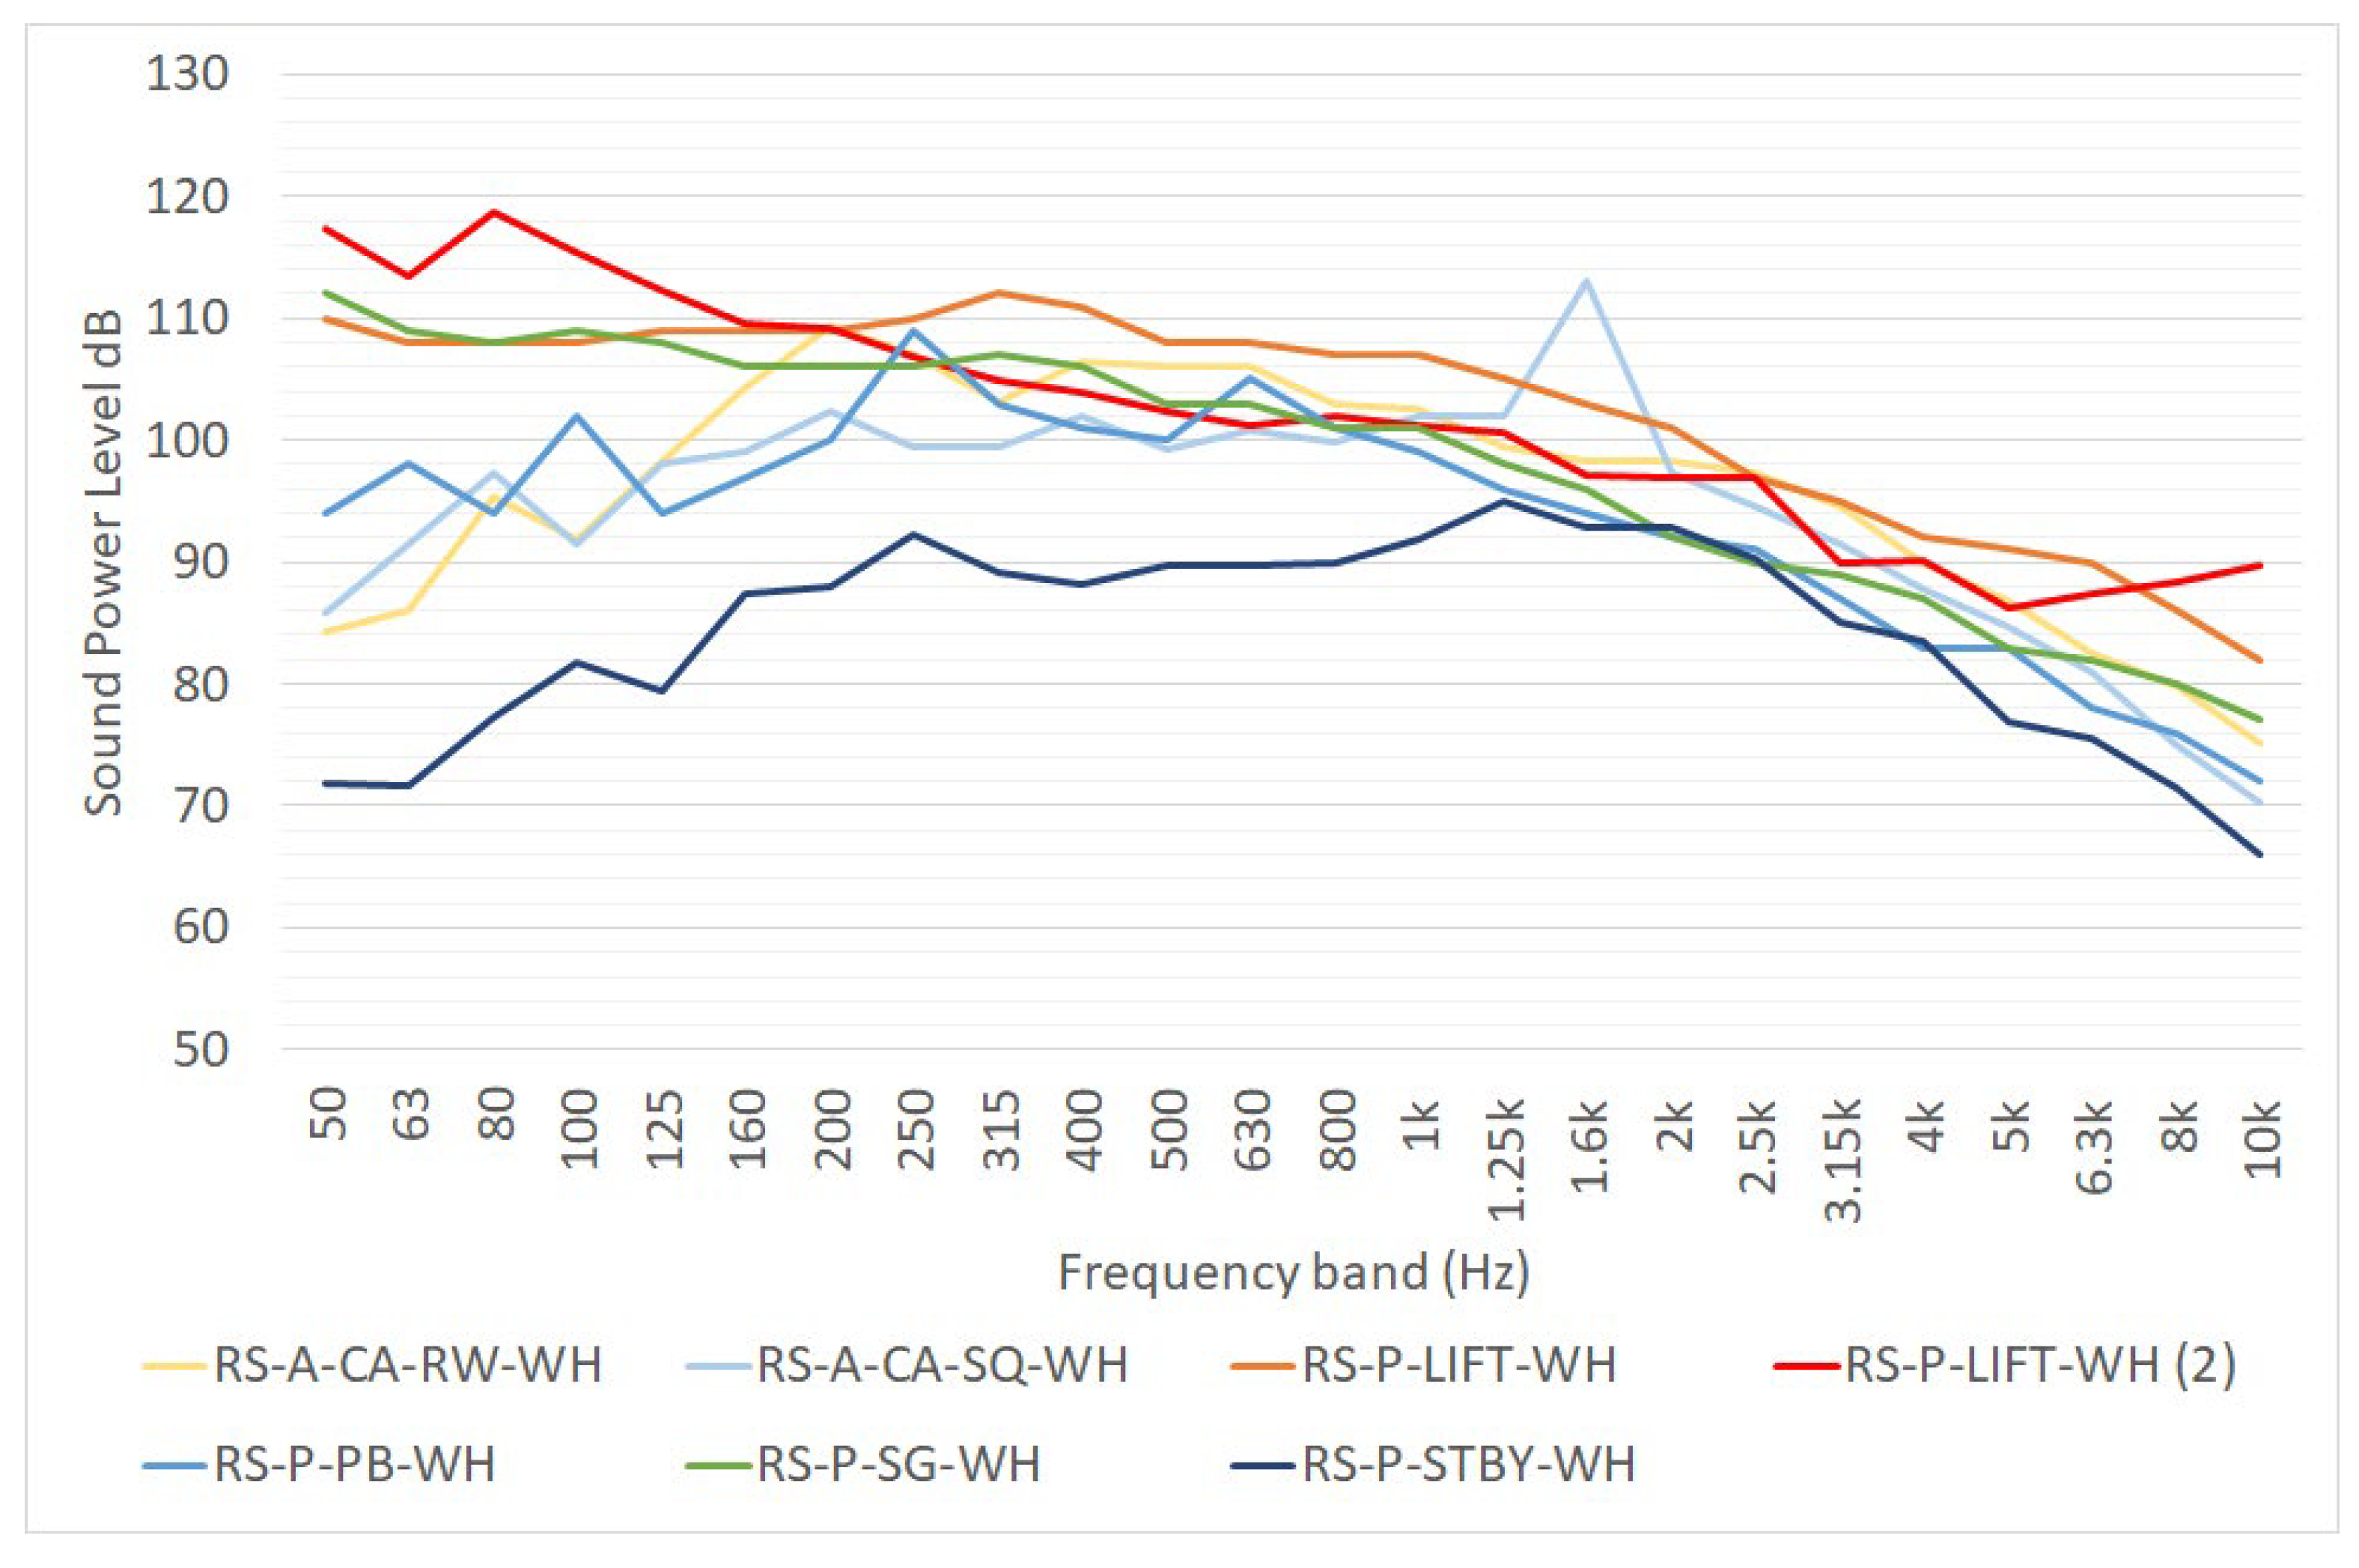
3.2. Reach Stacker
- RS-A-CA-RW-WH and RS-A-CA-SQ-WH are the sound power levels of two equivalent areal noise sources representing the noise emission of two different reach stackers performing a complete activity, as estimated in [16];
- RS-P-LIFT-WH and RS-P-LIFT-WH (2) are the sound power levels of point noise sources representing the noise emission of the reach stacker when it is performing an operation of lifting or picking up containers, respectively, estimated by [18,36]. The latter was derived from the global sound power level (Lw,sum), considering a pink noise source;
- RS-P-PB-WH is the sound power level of a point noise source representing the noise emission of the device pass-by [18];
- RS-P-SG-WH is the sound power level of a point noise source representing the noise emission of the device performing an operation of setting containers to the ground [18];
- RS-P-STBY-WH is the sound power level of a point noise source representing the noise emission of the device in standby mode (idling) [16];
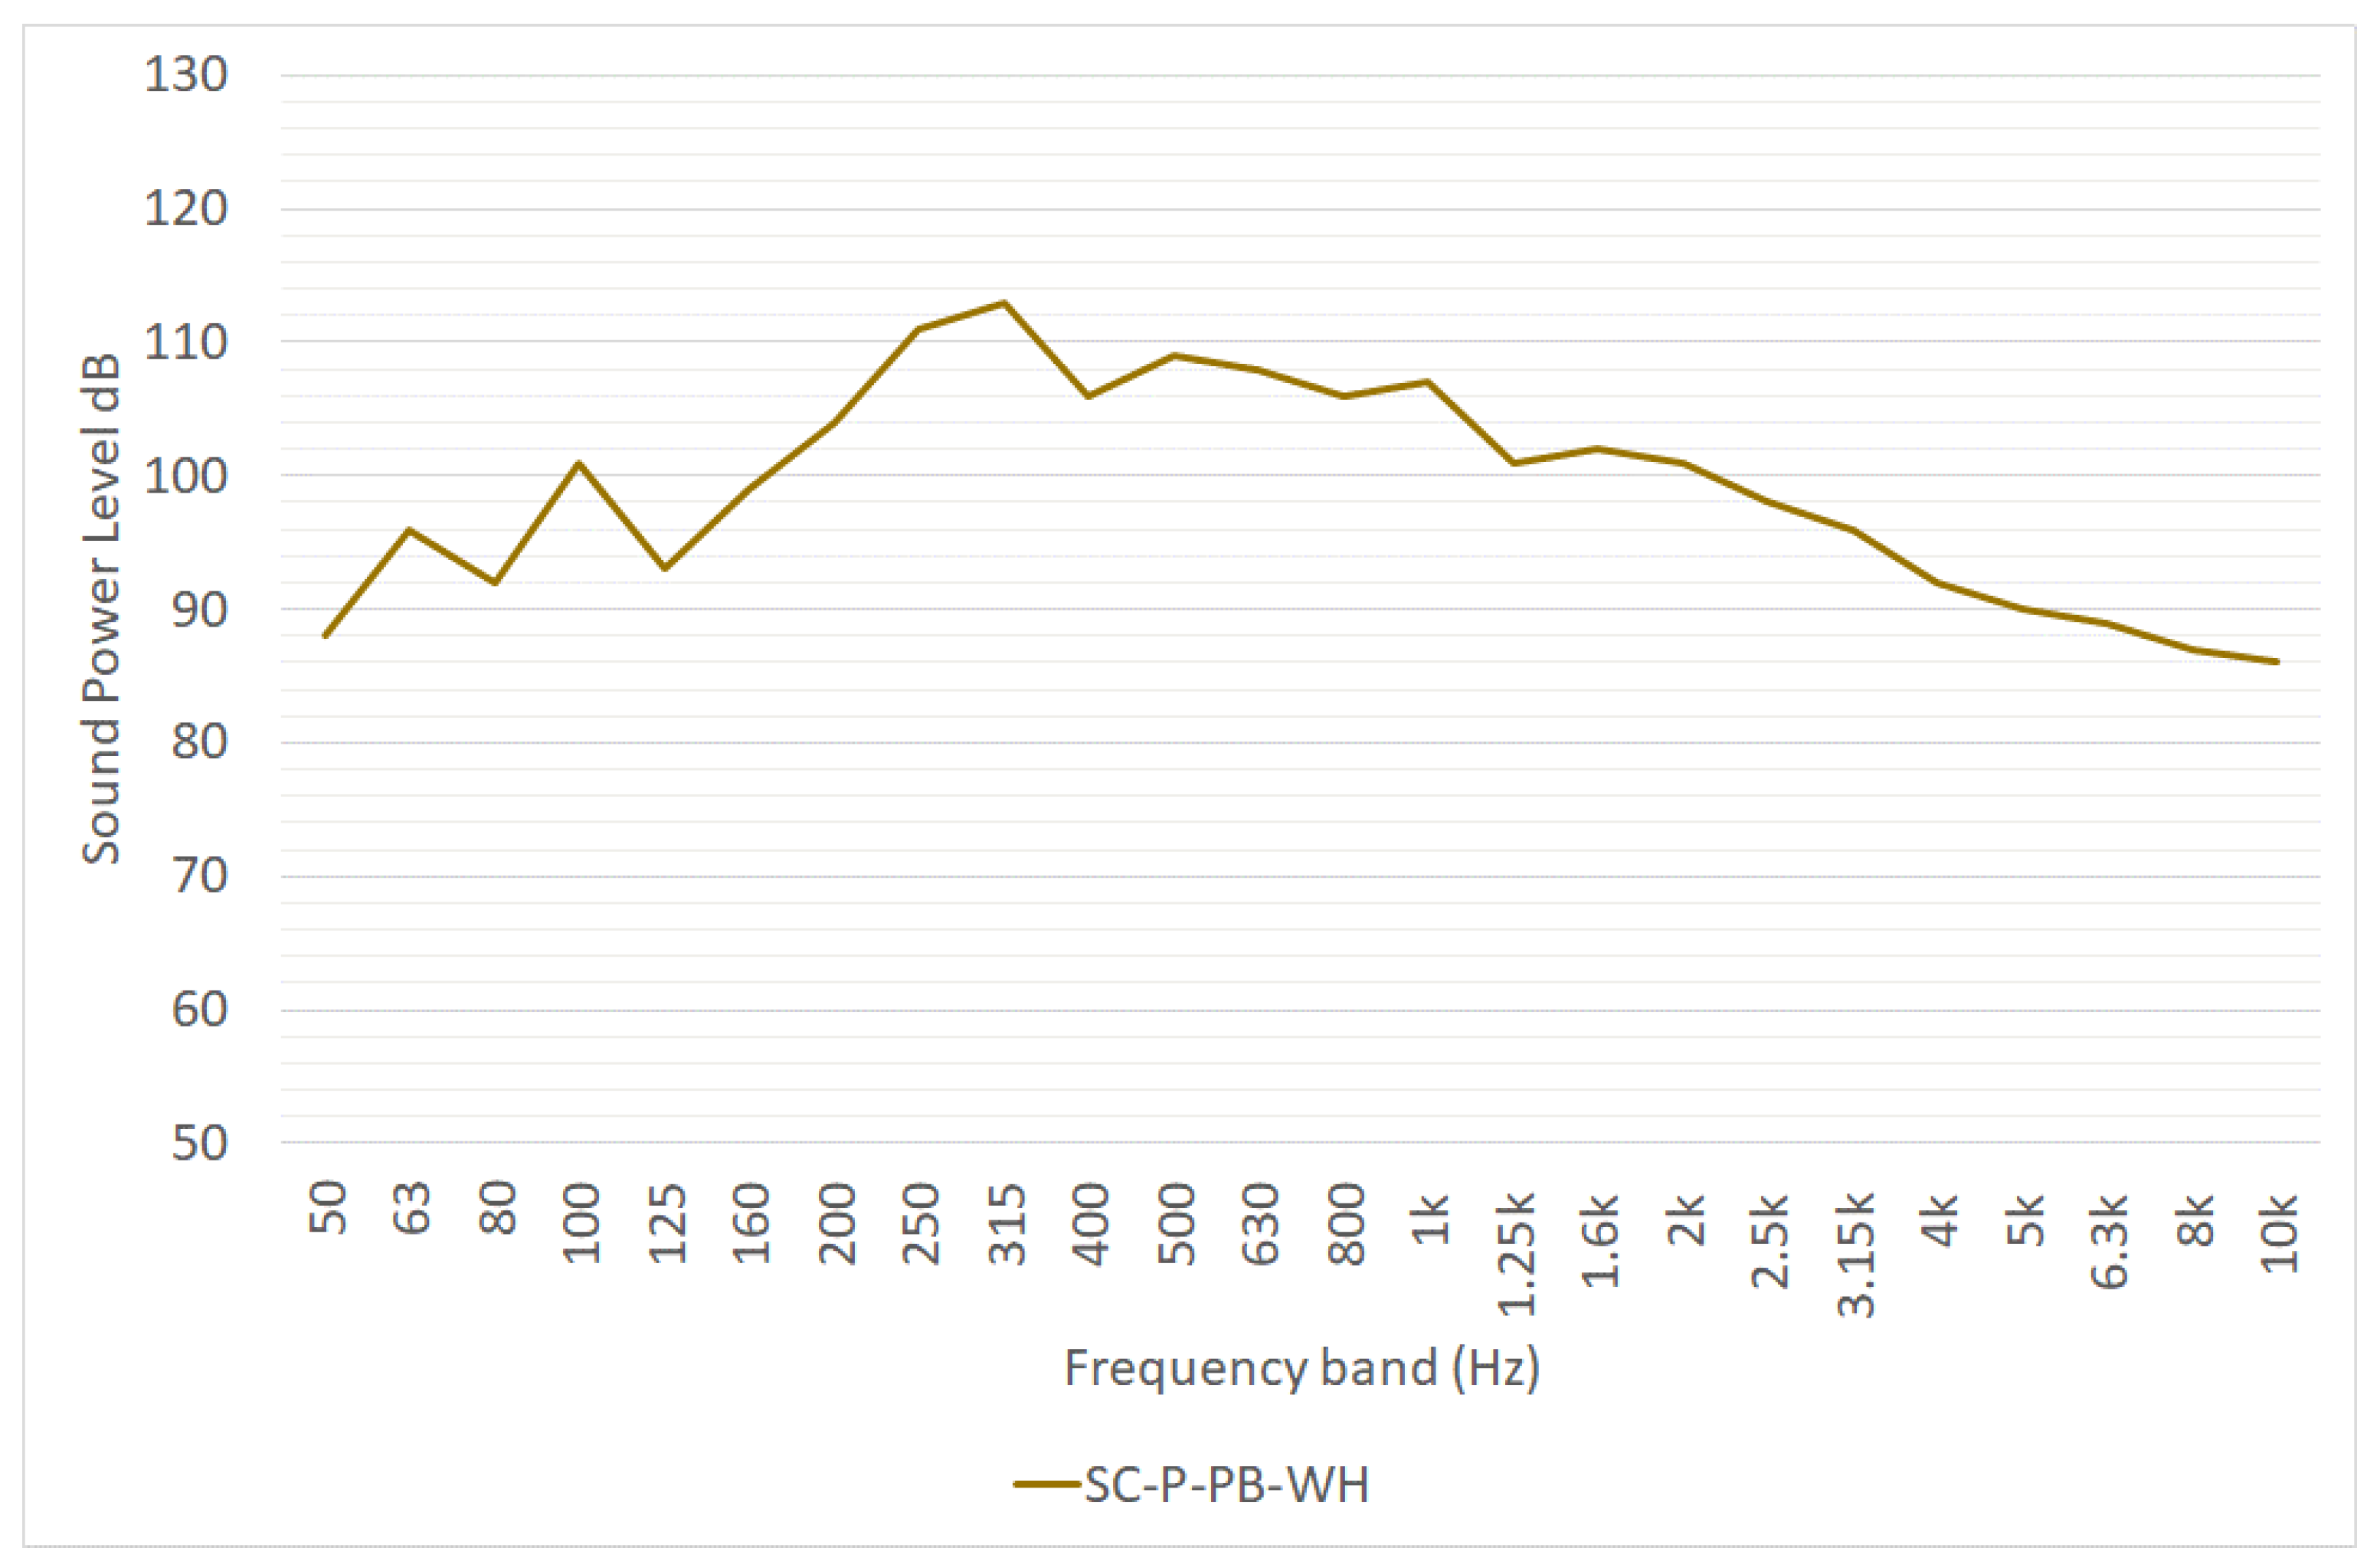
3.3. Straddle Carrier
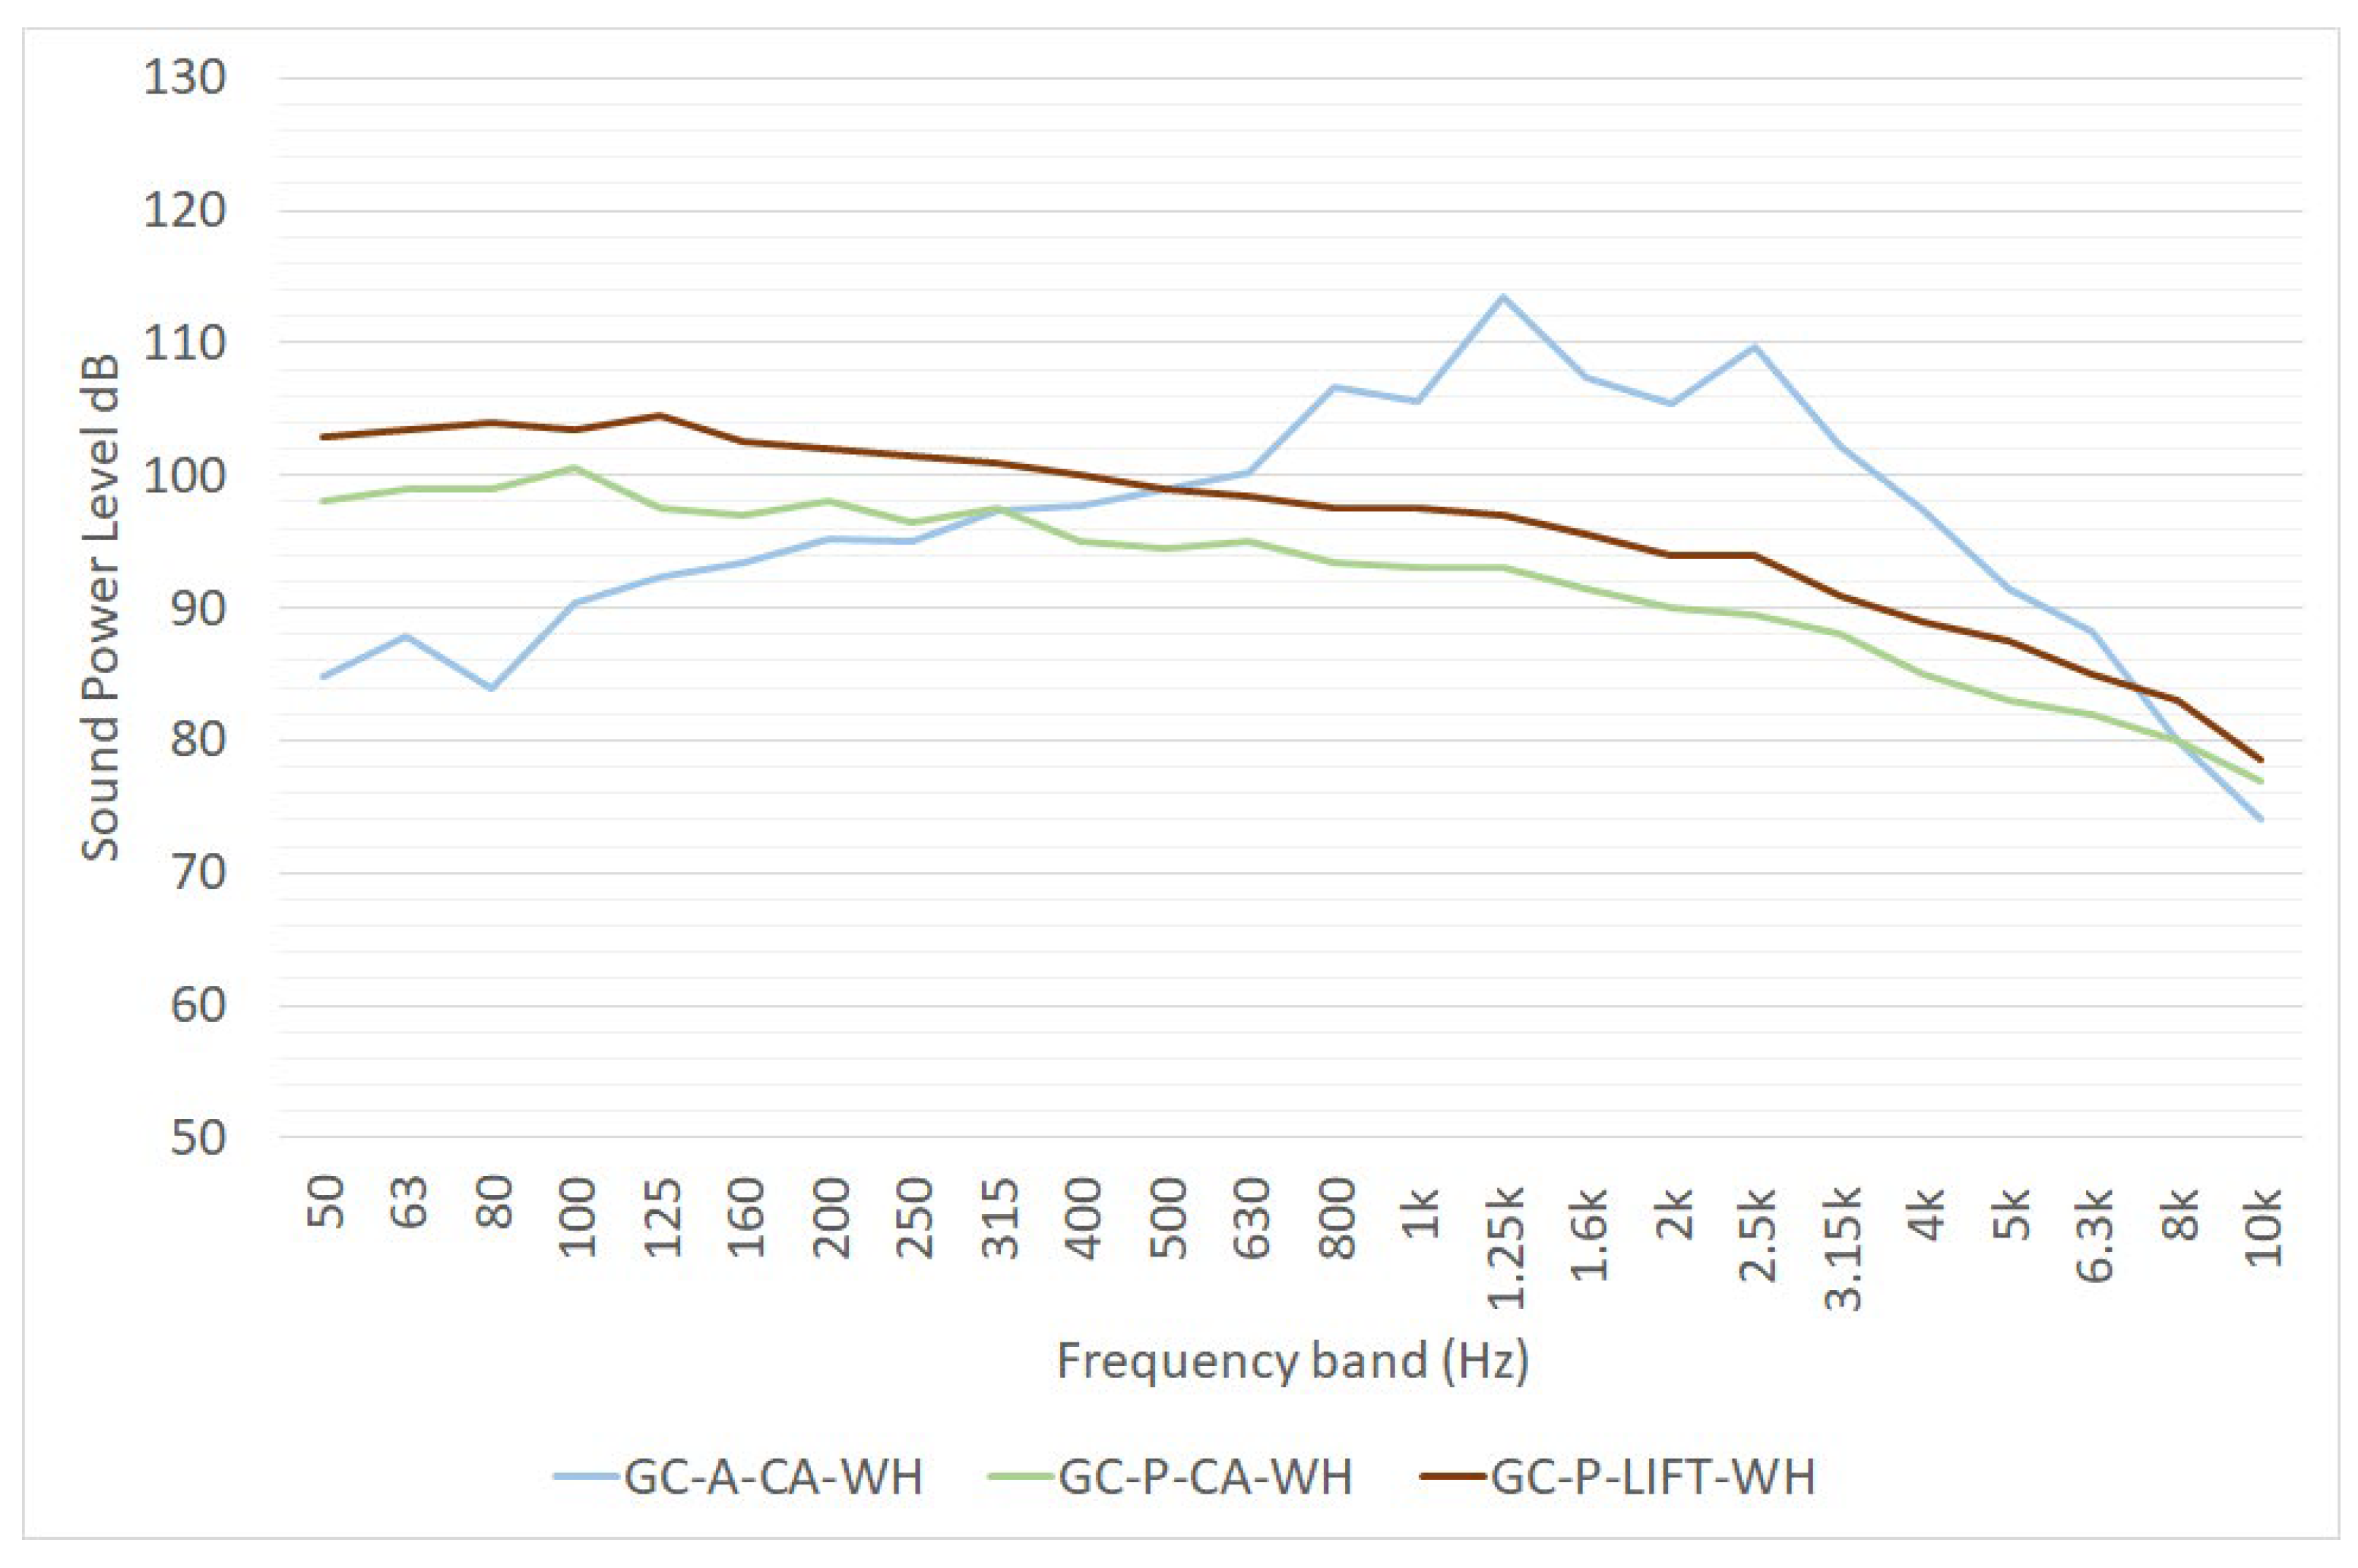
3.4. Gantry Cranes
- GC-A-CA-WH is the sound power level of two equivalent areal noise sources representing noise emission due to the complete activity of a gantry cranes, as estimated in [16];
3.5. Reefer
3.6. Moored Ships
- Container ships;
- Cruise ships;
- Tankers;
- Ro-Ro and Ro-Pax;
- Bulk Carriers;
- General cargo/ service ships.
- The funnel outlet(s) of the auxiliary engine(s), all ship types;
- The opening of the engine room ventilation inlet(s) and outlet(s), all ship types;
- The opening of the cargo hold ventilation and air conditioning inlet(s) and outlet(s), all ship types;
- The opening of the ventilation and air-conditioning of passenger rooms (cruise ship and Ro-Pax);
- Further relevant ventilation openings;
- Pumps on deck (tankers).
- LW* can be assumed to be 25–30 dB for radial ventilators and 25–35 dB for axial ventilators;
- qv is the volume flow in m3/h;
- Δpv is the fan total pressure difference in Pa.
- The container ship is modelled through a single point noise source. This approach may lead to relevant errors in the assessment of noise impacts, in particular for receivers located close to the docks;
- The author does not provide detailed information about how the noise measurements were carried out and processed.
- Funnels and other exhaust stacks;
- Ventilation air intakes and exhaust;
- External fans;
- Hull radiated noise (if relevant);
- Cranes, pumps and any other equipment in operation.
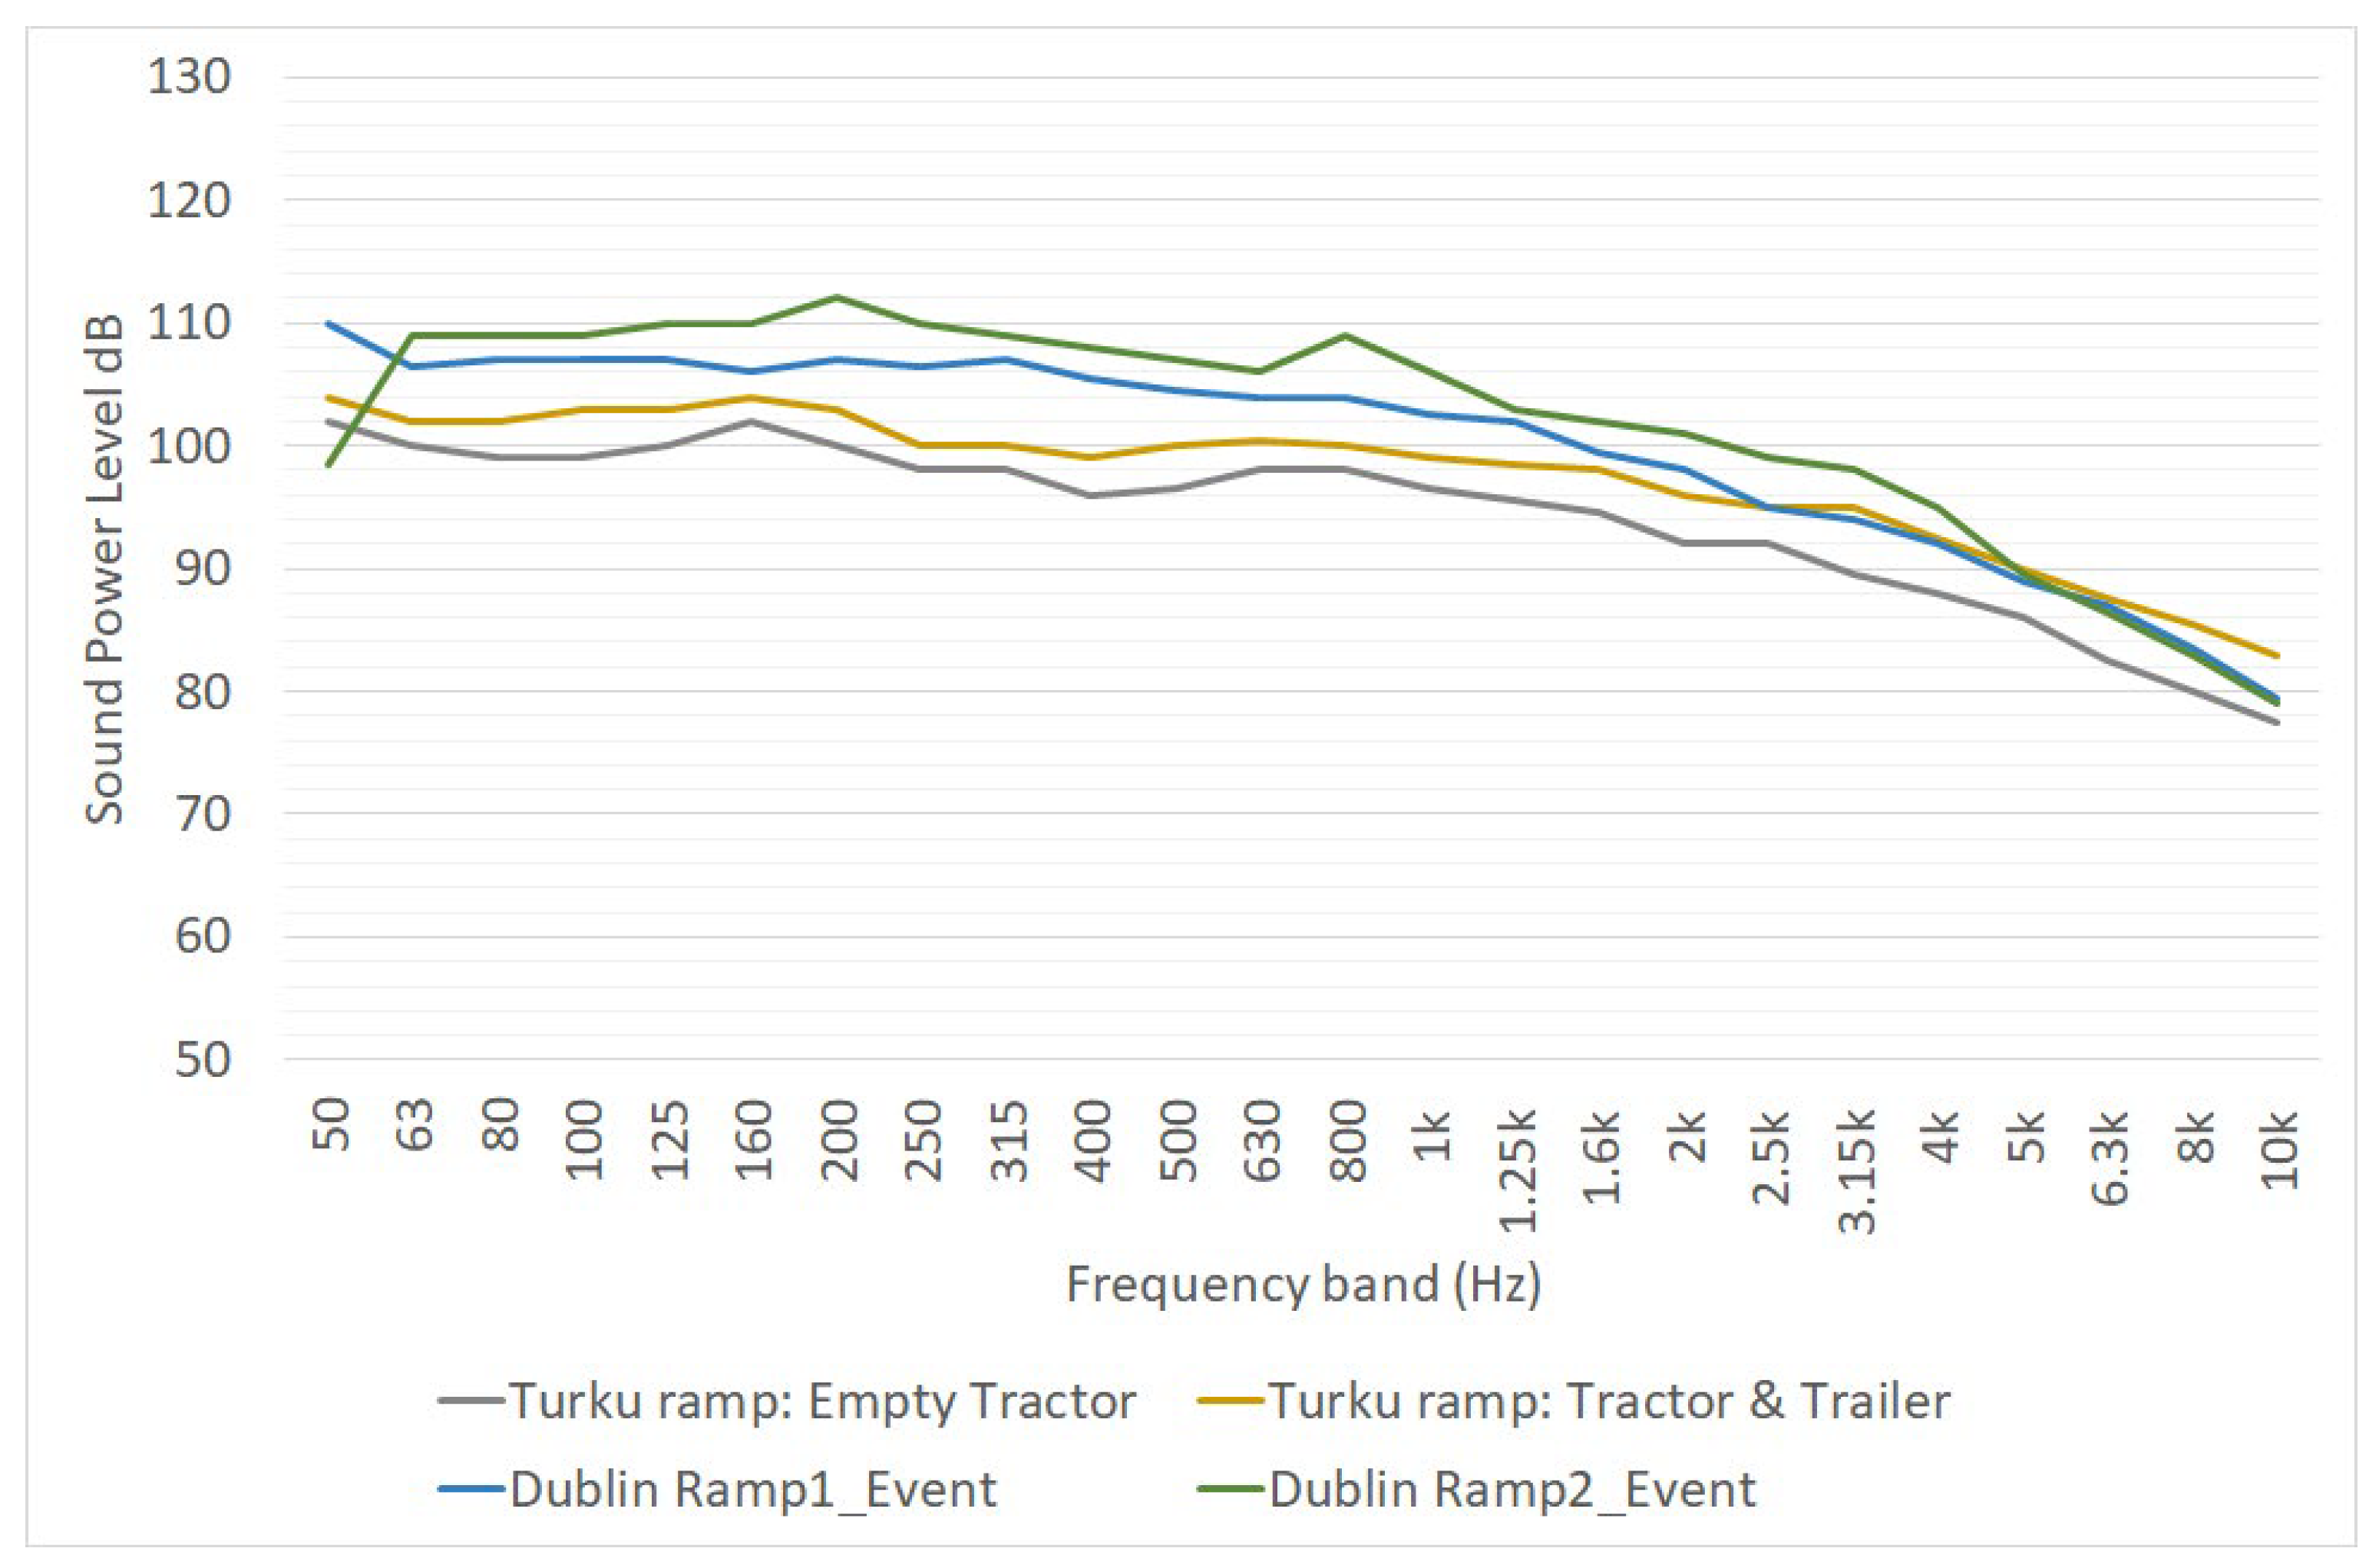
3.7. Ro-Ro and Ro-Pax Ramp
3.8. Forklifts
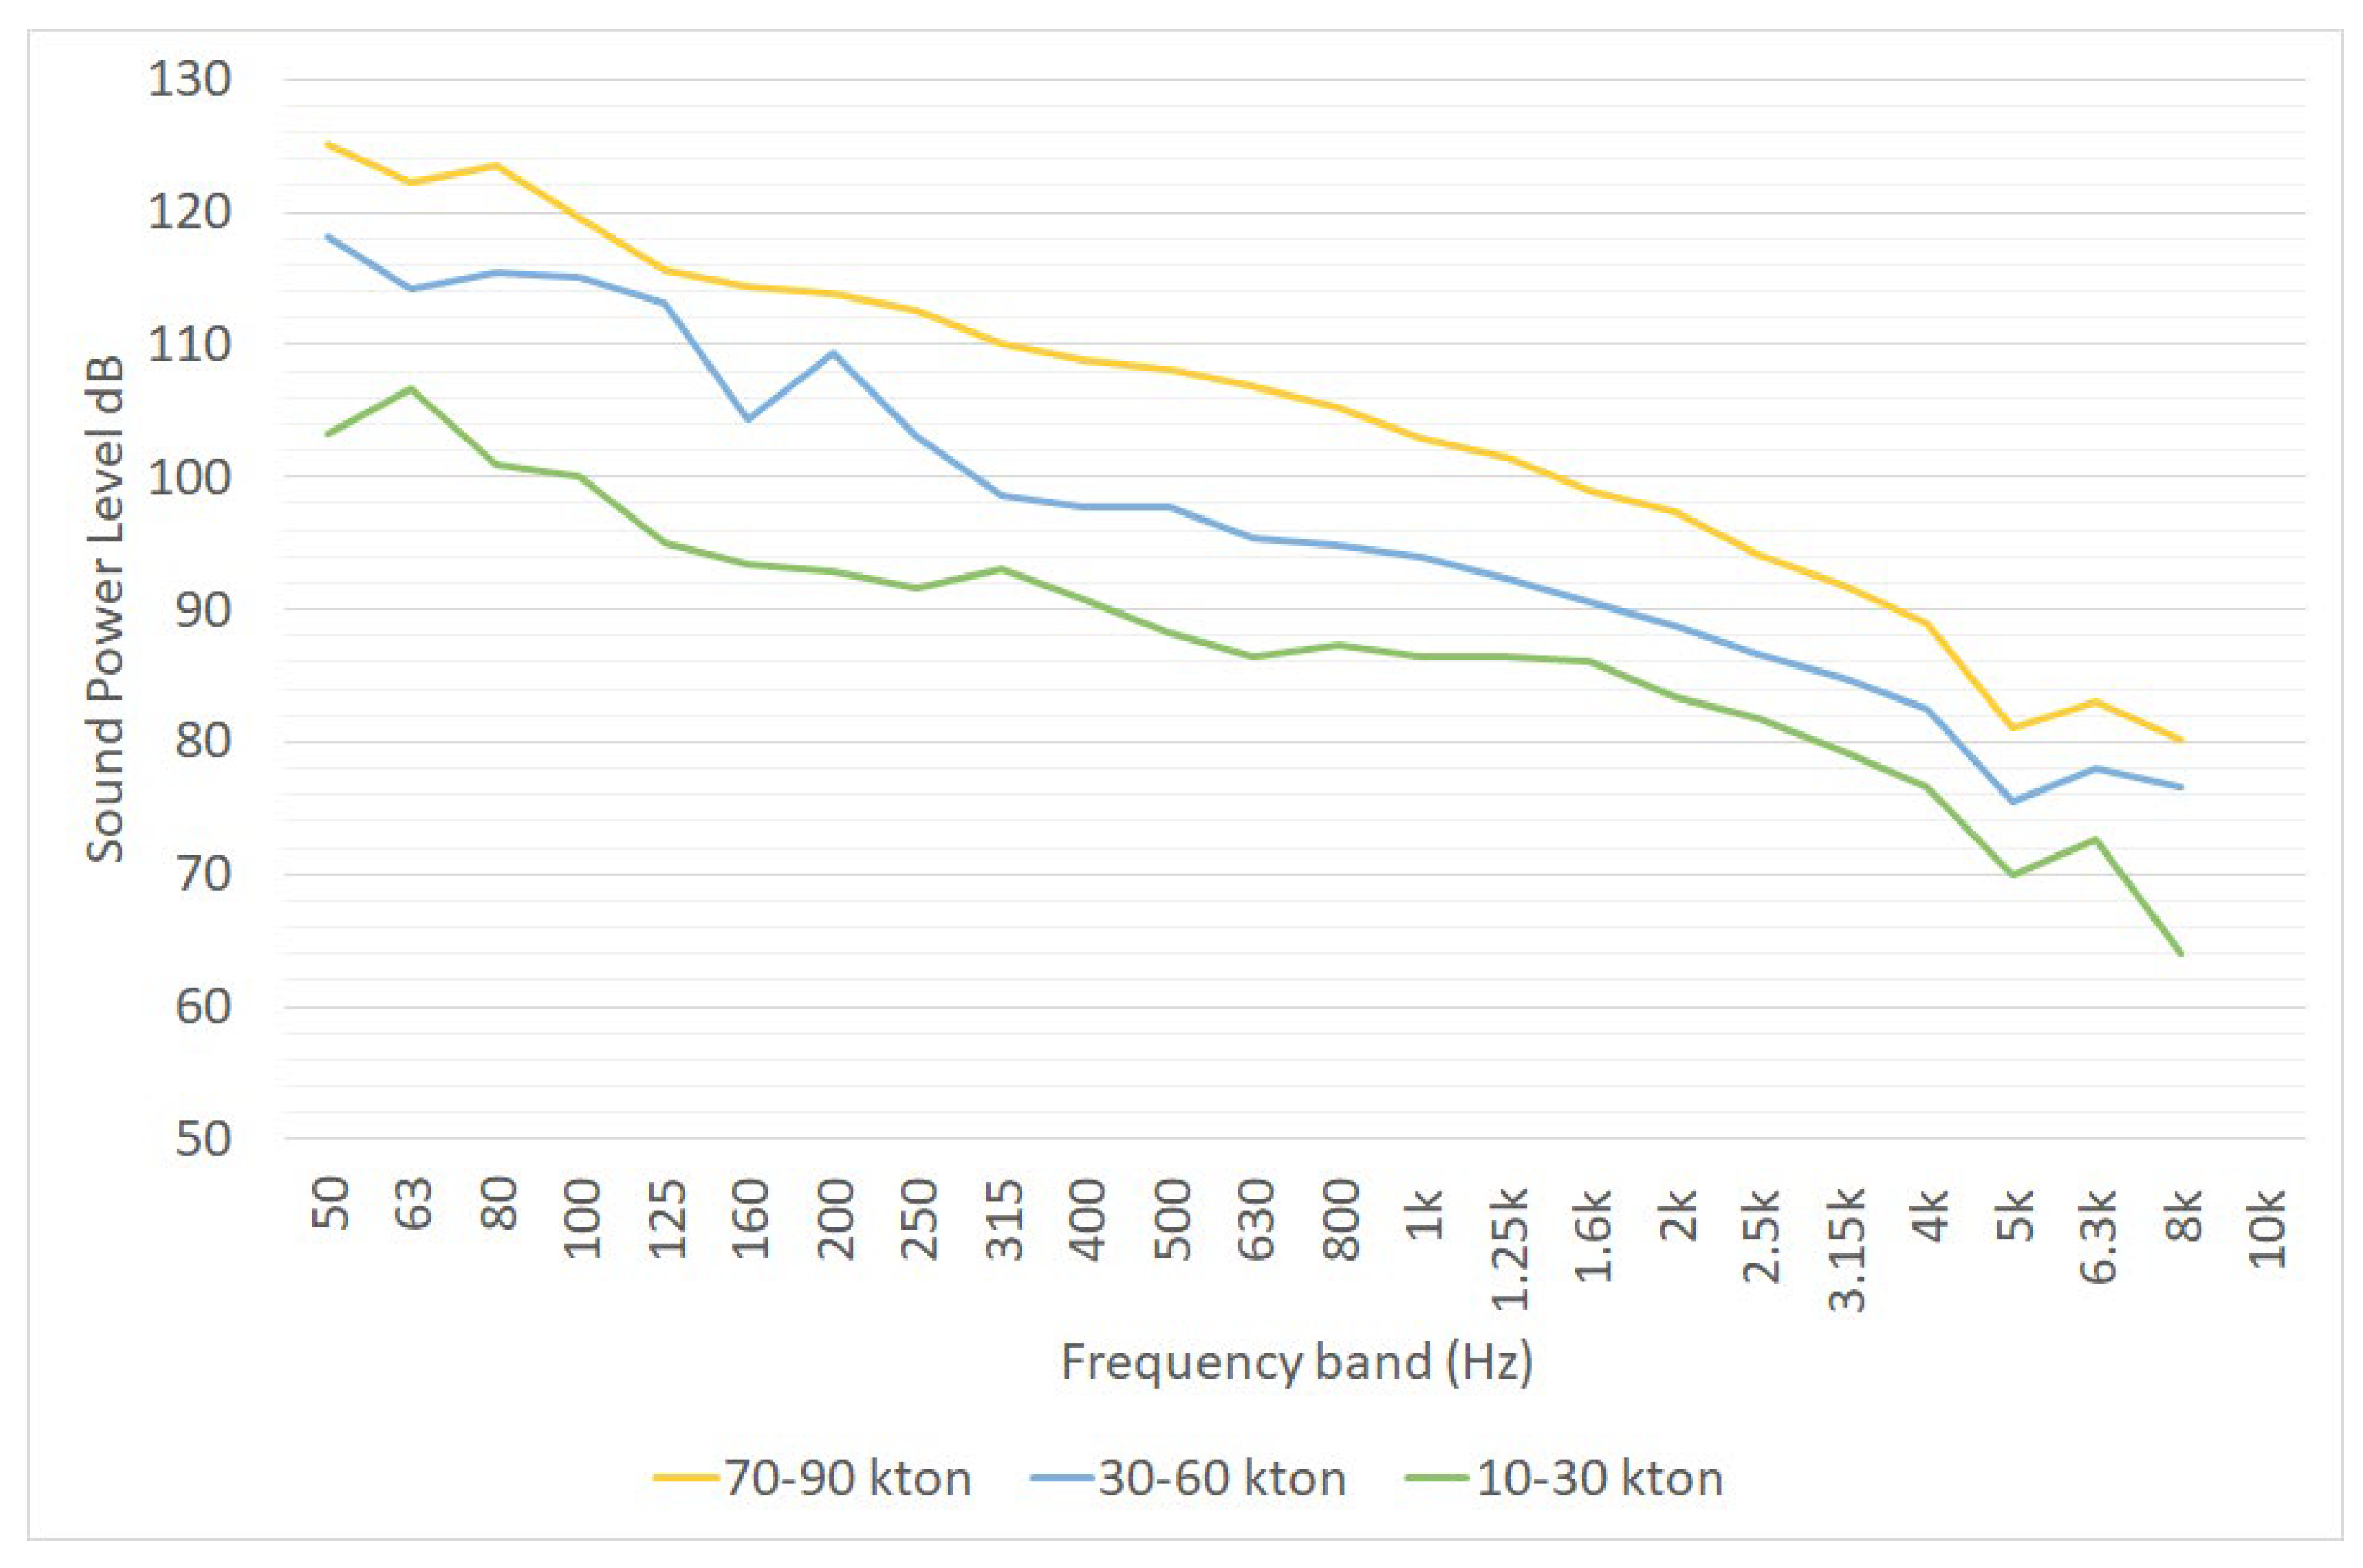
3.9. Seagoing Ships
3.10. Other Sources
4. Conclusions
Author Contributions
Funding
Data Availability Statement
Conflicts of Interest
Appendix A

| Reference | Port Noise Source | Measurement Carried out in Compliance with |
|---|---|---|
| REPORT Project [16] | Transtainer (Section 3.1) | NA |
| Reach stacker (Section 3.2) | NA | |
| Gantry cranes (Section 3.4) | NA | |
| Reefer (Section 3.5) | NA | |
| EFFORTS Project [17,18] | Transtainer (Section 3.1) | ISO 3744 * |
| Reach stacker (Section 3.2) | ISO 3744 * | |
| Straddle carrier (Section 3.3) | ISO 3744 * | |
| Gantry cranes (Section 3.4) | ISO 3744 * | |
| Reefer (Section 3.5) | ISO 3744 * | |
| Moored ship (Section 3.6) | ISO 3744 * | |
| Ro-Ro and Ro-Pax ramps (Section 3.7) | ISO 3744 * | |
| Witte, J. [19,22] | Straddle carrier (Section 3.3) | NA |
| Gantry cranes (Section 3.4) | NA | |
| Moored ships | NA | |
| Danish Ministry of the Environment [25] | Reefer (Section 3.5) | NA |
| Moored ships (Section 3.6) | NA | |
| GREEN CRUISE PORT [20] | Reefer (Section 3.5) | ISO 3746 |
| Engine of moored ships (Table 4 of Section 3.6) | ISO 9614-2 | |
| Ventilation of moored ships (Table 5 of Section 3.6) | NA ** | |
| Funnels of moored ships (Figure 8 of Section 3.6) | DIN 45 635-47:1985 | |
| Ventilation openings of moored ships (Figure 8 of Section 3.6) | ISO 3746 | |
| Diesel forklift (Section 3.7) | NA ** | |
| Electric forklift (Section 3.7) | NA | |
| NEPTUNES Project [21] | Reefer (Section 3.5) | NA |
| Moored ships (Section 3.6) | NA | |
| Tecnalia, [27] | Engine of Moored ships (Section 3.6) | ISO 3746 * |
| Ventilation of Moored ships (Section 3.6) | ISO 3746 * | |
| Di Bella and Remigi [24] | Moored ships (Section 3.6) | ISO 8297, ISO 3744 and ISO 3746 |
| Moro [40] | Moored ships (Section 3.6) | ISO 3744 |
| Di Bella et al. [48] | Seagoing ships (Section 3.9) | UNI 11143 |
| Fredianelli et al. [29] | Seagoing ships (Section 3.9) | BS EN ISO 2922:2000 + A1:2013 |
References
- Review of Maritime Transport. UNCTAD/RMT/2021. Available online: https://unctad.org/system/files/official-document/rmt2021_en_0.pdf (accessed on 3 August 2022).
- Container throughput at Ports Worldwide from 2012 to 2021 with a Forecast for 2022 through 2025. Available online: https://0-www-statista-com.brum.beds.ac.uk/statistics/913398/container-throughput-worldwide/ (accessed on 3 August 2022).
- 2021 Worldwide Cruise Line Market Share. Available online: https://cruisemarketwatch.com/market-share/ (accessed on 3 August 2022).
- Merk, O. The Competitiveness of Global Port-Cities: Synthesis Report. OECD Regional Development Working Papers 2013/13. Available online: https://www.oecd.org/regional/the-competitiveness-of-global-port-cities-9789264205277-en.htm#:~:text=Ports%20and%20cities%20are%20historically,localised%20in%20the%20port%2Dcity (accessed on 3 August 2022).
- Trozzi, C.; Vaccaro, R. Environmental Impact of Port Activities. In Maritime Engineering and Ports II; Brebbia, C.A., Olivella, J., Eds.; WIT Press: Cambridge, MA, USA, 2000. [Google Scholar]
- Badino, A.; Borelli, D.; Gaggero, T.; Rizzuto, E.; Schenone, C. Analysis of Airborne Noise Emitted from Ships. In Sustainable Maritime Transportation and Exploitation of Sea Resources; Rizzuto, E., Guedes Soares, C., Eds.; Taylor & Francis Group: Abingdon, UK, 2012. [Google Scholar]
- Fredianelli, L.; Bolognese, M.; Fidecaro, F.; Licitra, G. Classification of noise sources for port area noise mapping. Environments 2021, 8, 12. [Google Scholar] [CrossRef]
- Murphy, E.; King, E.A. An assessment of residential exposure to environmental noise at a shipping port. Environ. Int. 2014, 63, 207–215. [Google Scholar] [CrossRef] [PubMed]
- Badino, A.; Borelli, D.; Gaggero, T.; Rizzuto, E.; Schenone, C. Control of Airborne Noise Emissions from Ships. In Proceedings of the International Conference on Advances and Challenges in Marine Noise and Vibration 21 MARNAV 2012, Glasgow, Scotland, UK, 5–7 September 2012. [Google Scholar]
- World Health Organization. Environmental Noise Guidelines for the European Region. 2019. Available online: https://www.who.int/europe/publications/i/item/9789289053563 (accessed on 3 August 2022).
- Bernardini, M.; Fredianelli, L.; Fidecaro, F.; Gagliardi, P.; Nastasi, M.; Licitra, G. Noise assessment of small vessels for action planning in canal cities. Environments 2019, 6, 31. [Google Scholar] [CrossRef]
- NoMEPorts Project, Good Practice Guide on Port Area Noise Mapping and Management. 2008. Available online: https://www.ecoports.com/assets/files/common/publications/good_practice_guide.pdf (accessed on 3 August 2022).
- Fredianelli, L.; Gaggero, T.; Bolognese, M.; Borelli, D.; Fidecaro, F.; Schenone, C.; Licitra, G. Source characterization guidelines for noise mapping of port areas. Heliyon 2022, 8, e09021. [Google Scholar] [CrossRef]
- Kephalopoulos, S.; Paviotti, M.; Anfosso-Lédée, F. Common Noise Assessment Methods in Europe (CNOSSOS-EU); Publications Office of the European Union: Luxembourg, 2012. [Google Scholar] [CrossRef]
- IEC. IEC 61672-1:2013 Electroacoustics—Sound Level Meters—Part 1: Specifications; International Electrotechnical Commission: Geneva, Switzerland, 2013. [Google Scholar]
- REPORT Project. Available online: https://interreg-maritime.eu/web/report/checosarealizza (accessed on 3 August 2022).
- Hyrynen, J.; Maijala, V.; Melin, V. Noise Evaluation of Sound Sources Related to Port Activities. In Proceedings of the Euronoise 2009, Edinburgh, UK, 26–28 October 2009. [Google Scholar]
- EFFORT Project. Available online: http://efforts-project.tec-hh.net/index.html (accessed on 3 August 2022).
- Witte, J. Container Terminals and Noise. In Proceedings of the Internoise 2008, Shanghai, China, 26–29 October 2008. [Google Scholar]
- GREEN CRUISE PORT Project. Available online: http://www.greencruiseport.eu/Home.html (accessed on 3 August 2022).
- NEPTUNES Project. Available online: https://neptunes.pro/ (accessed on 3 August 2022).
- Witte, J. Noise Emission Ro-Ro Terminals. In Proceedings of the Euronoise 2009, Edinburgh, UK, 26–28 October 2009. [Google Scholar]
- Badino, A.; Borelli, D.; Gaggero, T.; Rizzuto, E.; Schenone, C. Airborne noise emissions from ships: Experimental characterization of the source and propagation over land. Appl. Acoust. 2016, 104, 158–171. [Google Scholar] [CrossRef]
- Di Bella, A.; Remigi, F. Evaluation and control of cruise ships noise in urban areas. In Proceedings of the ICSV20, Bangkok, Thailand, 7–11 July 2013. [Google Scholar]
- Noise from Ships in Ports: Possibilities for Noise Reduction, Environmental Project No. 1330. 2010. Available online: https://mst.dk/media/mst/66165/978-87-92668-35-6.pdf (accessed on 3 August 2022).
- Lloyd’s Register. Procedure for the Determination of Airborne Noise Emissions from Marine Vessels. 2019. Available online: https://www.lr.org/en/shipright-procedures/#accordion-additionaldesign&constructionprocedure(adp) (accessed on 3 August 2022).
- Tecnalia. Assessment of the Acoustic Benefit of the Power Supply to Ships Moored in Ports (Cold Ironing). Available online. 2018. (accessed on 3 August 2022).
- Santander, A.; Aspuru, I.; Fernandez, P. OPS Master Plan for Spanish Ports Project. Study of Potential Acoustic Benefits of On-shore Power Supply at Berth. In Proceedings of the Euronoise 2018, Crete, Greece, 27–31 May 2018. [Google Scholar]
- Fredianelli, L.; Nastasi, M.; Bernardini, M.; Fidecaro, F.; Licitra, G. Pass-by characterization of noise emitted by different categories of seagoing ships in ports. Sustainability 2020, 12, 1740. [Google Scholar] [CrossRef]
- FP7 SILENV Project. Available online: https://cordis.europa.eu/project/id/234182/it (accessed on 3 August 2022).
- Deliverable 5.2 of the SILENV Project. “Noise and Vibration label proposal”. 2012.
- Borelli, D.; Gaggero, T.; Rizzuto, E.; Schenone, C. Holistic control of ship noise emissions. Noise Mapp. 2016, 3. [Google Scholar] [CrossRef]
- Borelli, D.; Gaggero, T.; Rizzuto, E.; Schenone, C. Measurements of Airborne Noise Emitted by a Ship at Quay. In Proceedings of the ICSV22, Florence, Italy, 12–16 July 2015. [Google Scholar]
- Curcuruto, S.; Marsico, G.; Atzori, D.; Mazzocchi, E.; Betti, R. Environmental Impact of Noise Sources in Port Areas: A Case Study. In Proceedings of the ICSV22, Florence, Italy, 12–16 July 2015. [Google Scholar]
- Marsico, G. Infrastrutture di Trasporto Portuali: Metodologie e Procedure per la Valutazione e il Contenimento dell’Impatto Acustico Sull’Ambiente. Ph.D. Thesis, Università di Roma Sapienza, Dipartimento di Ingegneria Astronautica, Elettrica ed Energetica, Rome, Italy, 2007. (In Italian). [Google Scholar]
- Emission Data of Port Noise Sources in Source 01dB Software Database. Original data from DGMR-report W.92.03.59.C d.d.
- Stampe, O.B. Lyd i VVS-anlæg; Skarland Press AS: Rakkestad, Norway, 1998. [Google Scholar]
- ISO 3746:2010; Acoustics—Determination of Sound Power Levels and Sound Energy Levels of Noise Sources Using Sound Pressure—Survey Method Using an Enveloping Measurement Surface over a Reflecting Plane. ISO: Geneva, Switzerland, 2010.
- Draganchev, H.; Valchev, S.; Pirovsky, C. Experimental and Theoretical Research of Noise Emitted by Merchant Ships in Port. In Proceedings of the ICSV19, Vilnius, Lithuania, 8–12 July 2012. [Google Scholar]
- Moro, L. Setting of on-Board Noise Sources in Numerical Simulation of Airborne Outdoor Ship Noise. In Proceedings of the 9th Youth Symposium on Experimental Solid Mechanics, Trieste, Italy, 7–10 July 2010. [Google Scholar]
- SoundPLAN GmbH. Emission Data of Port Noise Sources in SoundPLAN Software Sersion 8.2. Available online: http://www.soundplan.eu/english (accessed on 3 August 2022).
- Umweltbundesamt. Forum Schall: Emissionsdatenkatalog 2016. Available online: https://www.oal.at/images/Forum_Schall/Arbeitsbehelfe/Emissionsdatenkatalog_2022.pdf (accessed on 3 August 2022).
- LAIRM CONSULT GmbH. Schalltechnische Untersuchung für das Geplante Cruise Center 3 in Hamburg-Steinwerder; Hamburg Port Authority: Hamburg, Germany, 2013. [Google Scholar]
- ISO 2922:2020; Acoustics—Measurement of Airborne Sound Emitted by Vessels on Inland Waterways and Harbours. ISO: Geneva, Switzerland, 2020.
- ISO 14509-1:2008; Small Craft—Airborne Sound Emitted by Powered Recreational Craft—Part 1: Pass-by Measurement Procedures. ISO: Geneva, Switzerland, 2008.
- Di Bella, A. Evaluation Methods of External Airborne Noise Emissions of Moored Cruise Ships: An Overview. In Proceedings of the 21st International Congress on Sound and Vibration 2014, ICSV 2014, Beijing, China, 13–17 July 2014; Volume 2, pp. 964–971. [Google Scholar]
- Fausti, P.; Santoni, A.; Martello, N.; Guerra, M.C.; Di Bella, A. Evaluation of Airborne Noise due to Navigation and Manoeuvring of Large Vessels. In Proceedings of the 24th International Congress on Sound and Vibration, ICSV 2017, London, UK, 23–27 July 2017. [Google Scholar]
- Di Bella, A.; Tombolato, A.; Cordeddu, S.; Zanotto, E.; Barbieri, M. In Situ Characterization and Noise Mapping of Ships Moored in the Port of Venice. In Proceedings of the European Conference on Noise Control 2008, Paris, France, 29 June–4 July 2008; pp. 1949–1953. [Google Scholar]
- Coppola, T.; Mocerino, L.; Rizzuto, E.; Viscardi, M.; Siano, D. Airborne Noise Prediction of a Ro/Ro-Pax Ferry in the Port of Naples. Technology and Science for the Ships of the Future. In Proceedings of the NAV 2018, Trieste, Italy, 20–22 June 2018. [Google Scholar]
- Nastasi, M.; Fredianelli, L.; Bernardini, M.; Teti, L.; Fidecaro, F.; Licitra, G. Parameters affecting noise emitted by ships moving in port areas. Sustainability 2020, 12, 8742. [Google Scholar] [CrossRef]
- Bavarian State Agency for the Environment. Parking Area Noise, 6th ed.; Bavarian State Ministry for the Environment: Munich, Germany, 2007. [Google Scholar]
- Bayer. Parkplatzlärmstudie, (Parking Lot Study), 6th ed.; Landesamt für Umwelt: Augsburg, Germany, 2007. (In German) [Google Scholar]


| Straddle Carrier Activity | LW (dB) | LW (dB(A)) |
|---|---|---|
| Pass-by [18] | 119 ± 2 | 115 ± 2 |
| Normal activity, power unit close to the ground [19] | / | 108 |
| Normal activity, power unit located at the top [19] | / | 104 |
| Source | Working Condition | LW (dB(A)) |
|---|---|---|
| NEPTUNES Project [21], mitigation of noise from ships at berth | Normal activity | 91–93 |
| GREEN CRUISE PORT [20] | Normal activity | 99 |
| Source | LW (dB(A)) |
|---|---|
| Container ship | 100–115 |
| Ro-Ro ship | 100–114 |
| (1) |
| Producer | Type | One-Third Octave Frequency Bands (dB(A)) | Total (dB(A)) | |||||||||
|---|---|---|---|---|---|---|---|---|---|---|---|---|
| 16 Hz | 31.5 Hz | 63 Hz | 125 Hz | 250 Hz | 500 Hz | 1000 Hz | 2000 Hz | 4000 Hz | 8000 Hz | |||
| MAN B and W | L32/40 | 80 | 115 | 130 | 135 | 129 | 133 | 135 | 135 | 133 | 130 | 142 |
| V32/40 | 82 | 111 | 126 | 133 | 129 | 133 | 135 | 135 | 133 | 130 | 142 | |
| L48/60B | 88 | 119 | 124 | 126 | 129 | 133 | 135 | 135 | 133 | 130 | 141 | |
| V48/60B | 84 | 111 | 124 | 126 | 129 | 133 | 135 | 135 | 133 | 130 | 141 | |
| L58/64 | 80 | 115 | 130 | 135 | 129 | 133 | 135 | 135 | 133 | 130 | 142 | |
| Wärtsilä | W26 | - | 122 | 132 | 135 | 131 | 125 | 124 | 118 | 112 | 102 | 138 |
| W32 | - | 107 | 115 | 127 | 130 | 129 | 127 | 121 | 109 | - | 135 | |
| W38 | - | 101 | 119 | 122 | 127 | 131 | 134 | 129 | 126 | 118 | 138 | |
| Fan Function | Volume Flow (m3/h) | One-Third Octave Frequency Bands (dB(A)) | Total (dB(A)) | |||||||
|---|---|---|---|---|---|---|---|---|---|---|
| 63 Hz | 125 Hz | 250 Hz | 500 Hz | 1000 Hz | 2000 Hz | 4000 Hz | 8000 Hz | |||
| Engine room fans | 120,000 | 73 | 93 | 98 | 105 | 105 | 102 | 98 | 91 | 110 |
| 70,000 | 68 | 84 | 100 | 104 | 106 | 103 | 99 | 93 | 110 | |
| 50,000 | 66 | 82 | 98 | 101 | 103 | 101 | 97 | 90 | 108 | |
| 33,000 | 64 | 79 | 96 | 99 | 101 | 99 | 94 | 88 | 106 | |
| 15,000 | 51 | 67 | 80 | 95 | 96 | 96 | 92 | 86 | 101 | |
| 12,000 | 52 | 68 | 81 | 96 | 96 | 96 | 93 | 87 | 102 | |
| 1000 | 39 | 55 | 73 | 78 | 83 | 83 | 80 | 74 | 88 | |
| Hold ventilation | 95,000 | 75 | 93 | 97 | 100 | 100 | 97 | 91 | 83 | 105 |
| 85,000 | 69 | 89 | 94 | 101 | 101 | 98 | 94 | 87 | 106 | |
| 73,000 | 67 | 83 | 99 | 102 | 104 | 102 | 97 | 91 | 109 | |
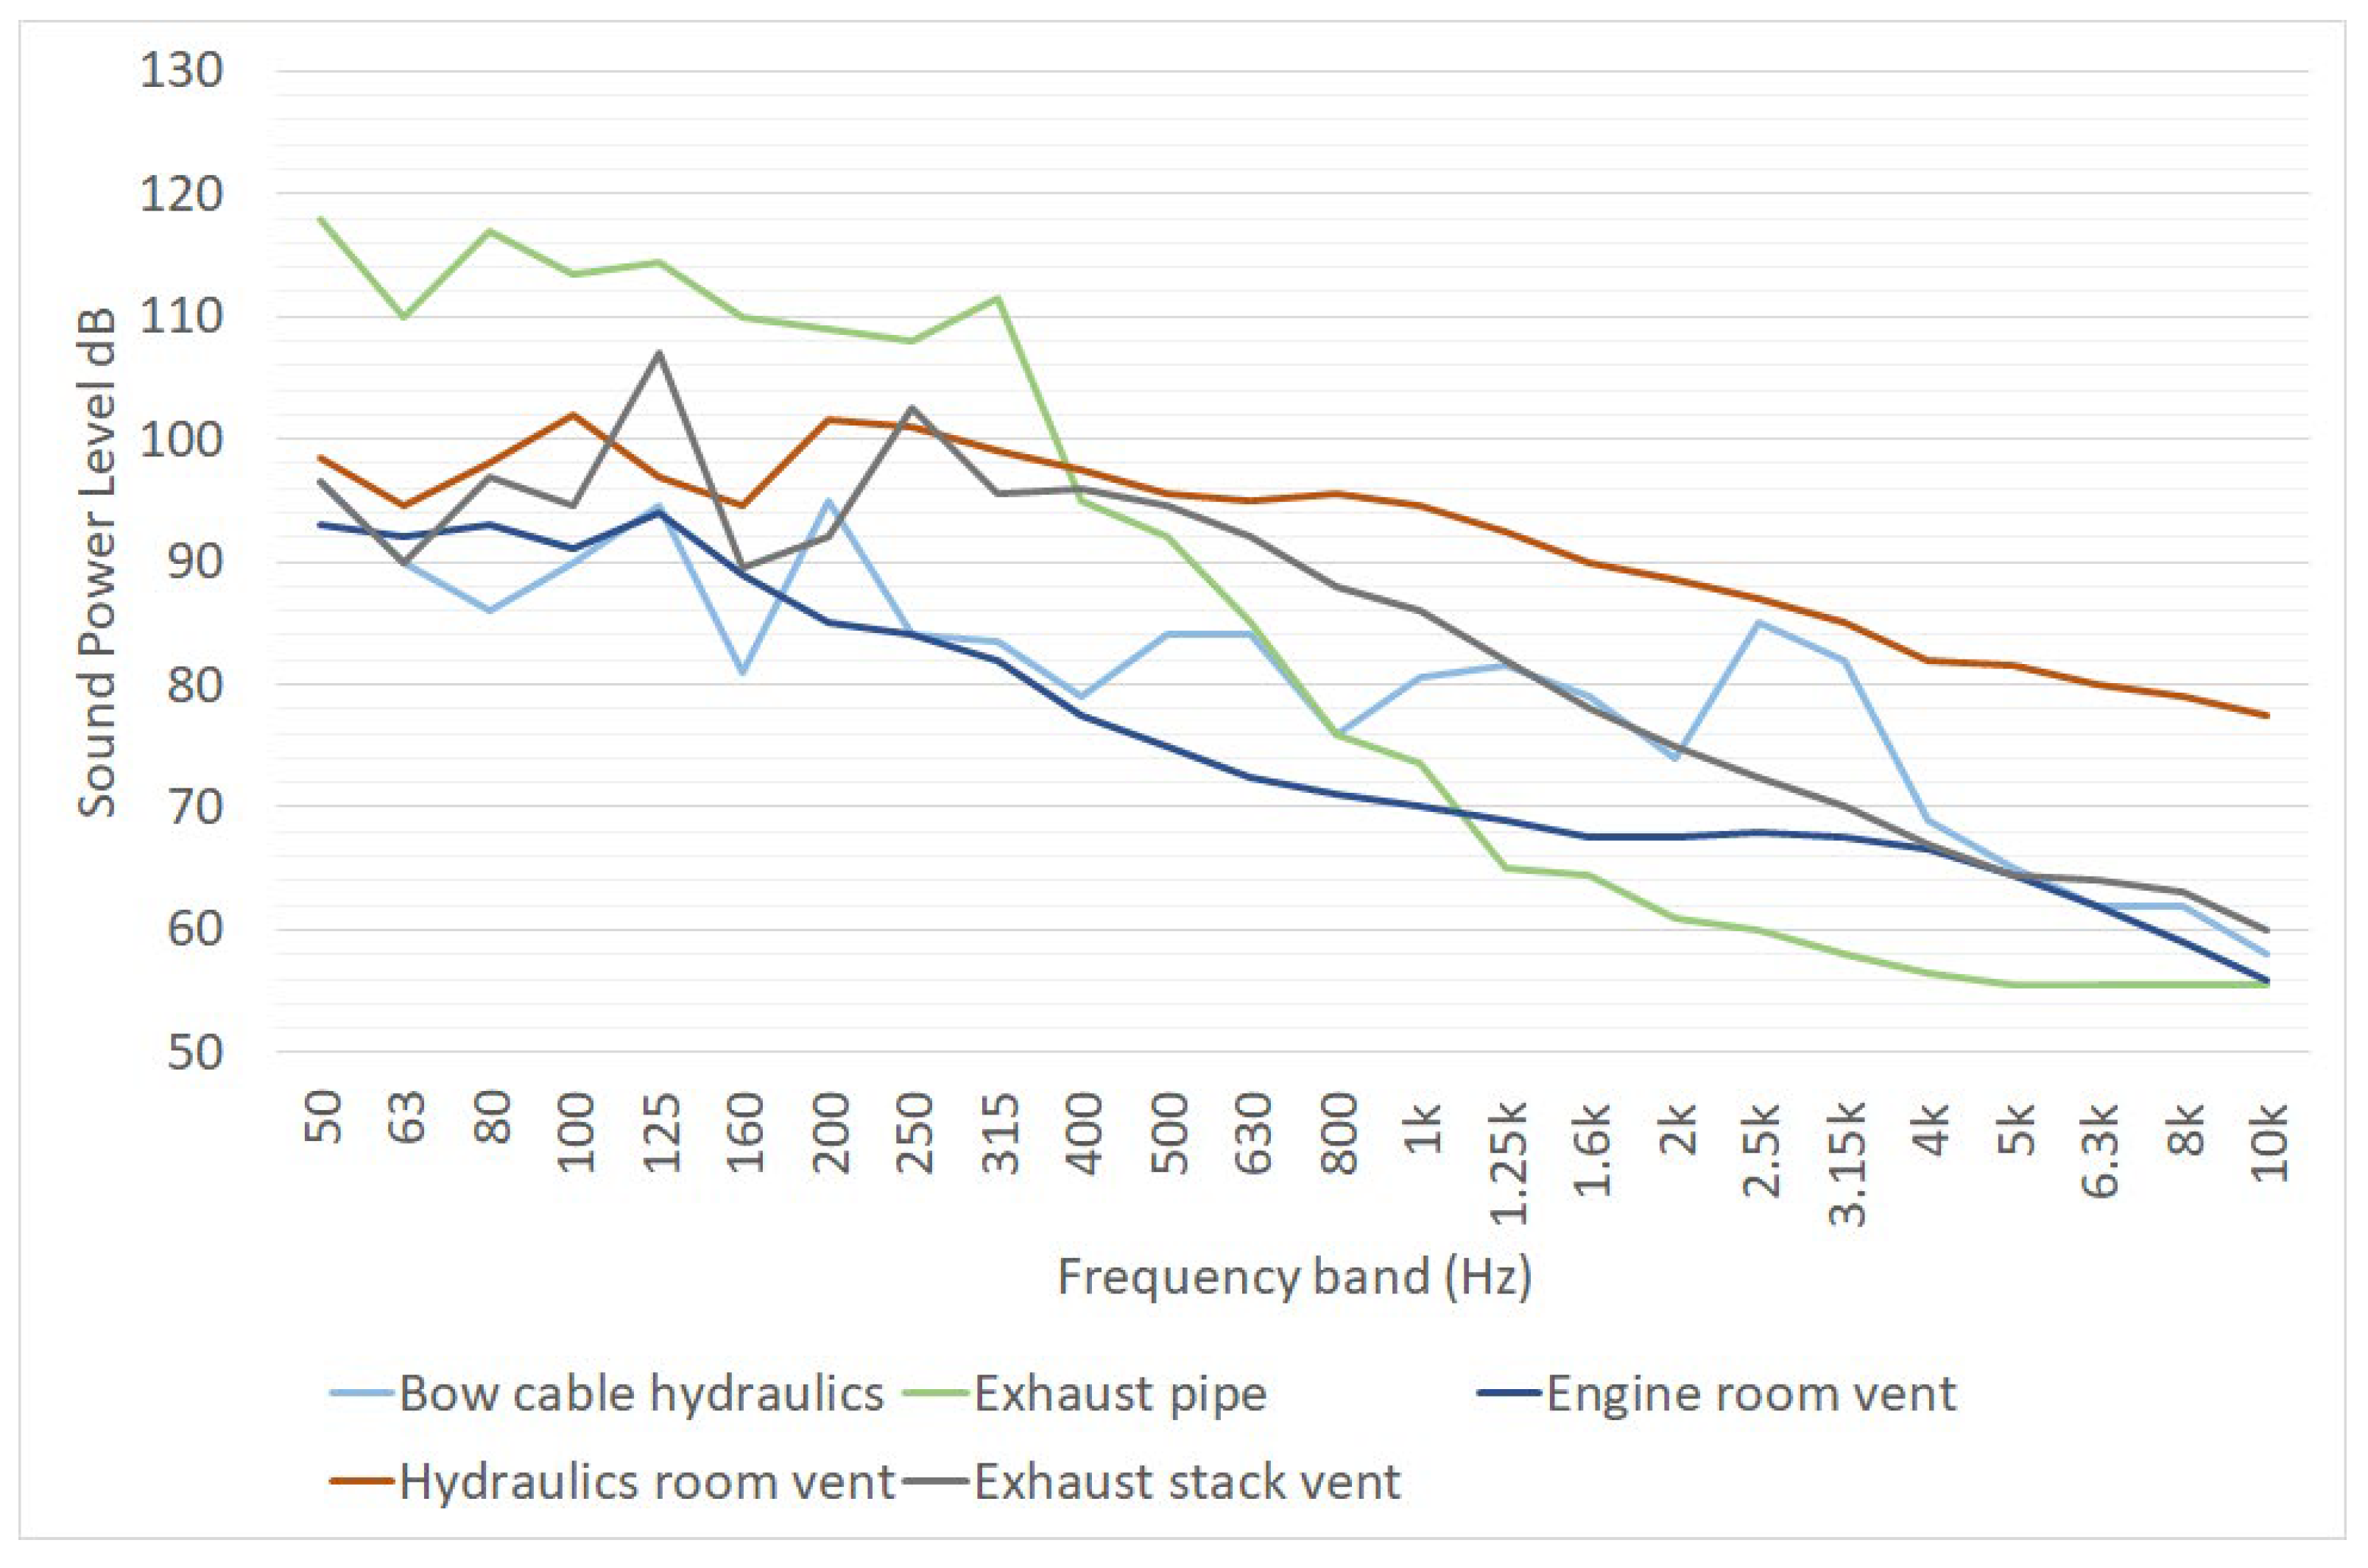
| Ship Source | LW (dB) | LW (dB(A)) |
|---|---|---|
| Engine room ventilation [18] | 102 | 86 |
| Hydraulic room ventilation [18] | 110 | 104 |
| Bow cable hydraulics [18] | 103 | 93 |
| Auxiliary engine exhaust pipe [18] | 124 | 106 |
| Exhaust stack ventilation [18] | 112 | 100 |
| Auxiliary engine [27] | / | 107 |
| Ventilation unit [27] | / | 109 |
| Type | Year | Size (GT) | Size (TEU *) | Reefer (TEU *) | Auxiliary Engine Power (kW) | Operating Conditions (kW) | Auxiliary Engine | Additional Source: Ventilation | ||
|---|---|---|---|---|---|---|---|---|---|---|
| Lw (dB(A) | Tonal Components/Low Frequency (dB) | Sound Power Level (dB(A)) | Tonal Components/Low Frequency (dB) | |||||||
| Ro-Pax | 2003 | 22,382 | - | - | 4200 | 900 | 109.3 | 6/0 | 113.2 | 6/0 |
| Ro-Ro | 1999 | 12,076 | - | - | 2 × 980 | 400 | 107.5 | 3/3 | 109.0 | 6/0 |
| Containers | 2002 | 14,241 | 1129 | 153 | - | - | 97.4 | 3/6 | - | - |
| 2008 | 7702 | 798 | 150 | 2 × 750 | 1 × 750 | 95.1 | 0/3 | - | - | |
| 2007 | 8971 | 917 | 200 | 2 × 469 | 1 × 469 | 95.0 | 3/3 | - | - | |
| 2009 | 10,585 | 1036 | - | - | - | 90.2 | 0/3 | 92.3 | 3 | |
| Cruise ship | 1973 | 28,372 | - | - | 2200 | - | 111.1 | 3/6 | 103.2 | 3/6 |
| 2000 | 30,277 | - | - | - | - | 104.2 | 0/6 | 94.7 | 0/6 | |
| 2016 | 55,254 | - | - | - | - | 101.6 | 3/6 | 97.5 | 3/6 | |
| 2002 | 139,570 | - | - | - | - | 105.3 | 3/6 | 98.7 | 3/6 | |
| 2008 | 154,407 | - | - | - | - | 104.5 | 0/6 | 96.2 | 0/6 | |
| Ship Source | LW (dB) | LW (dB(A)) |
|---|---|---|
| Ro-Ro ramp in Turku: tractor with trailer | 114 ± 3 | 109 ± 3 |
| Ro-Ro ramp in Turku: tractor without trailer | 112 ± 4 | 106 ± 4 |
| 1st Ro-Ro ramp in Dublin: ramp noise | 119 ± 5 | 112 ± 5 |
| 1st Ro-Ro ramp in Dublin: ship loading * | 115 ± 2 | 108 ± 2 |
| 2nd Ro-Ro ramp in Dublin: ramp noise | 121 ± 6 | 115 ± 6 |
| 2nd Ro-Ro ramp in Dublin: ship loading * | 116 ± 2 | 109 ± 2 |
| Ro-Ro ramp in Turku: tractor with trailer | 114 ± 3 | 109 ± 3 |
| Source Description | LW (dB(A)) | Data Taken from |
|---|---|---|
| Small/medium diesel forklift | 97 | Manufacturer |
| Heavy duty size diesel forklift | 107 | Manufacturer |
| Electric forklift | 90 | [42] |
| Mobile crane for cruise ship | 107 | [43] |
| Ship Type | Direction | SEL (dB(A)) |
|---|---|---|
| A | Arriving | 87–90 |
| A | Leaving | 89–90 |
| B | Arriving | 88–91 |
| B | Leaving | 88–89 |
| One-Third Octave Frequency Bands (dB(A)) | ||||||||||||||||||||||||||||||||
|---|---|---|---|---|---|---|---|---|---|---|---|---|---|---|---|---|---|---|---|---|---|---|---|---|---|---|---|---|---|---|---|---|
| Ship Type | LW dB(A) | 20 Hz | 25 Hz | 31.5 Hz | 40 Hz | 50 Hz | 63 Hz | 80 Hz | 100 Hz | 125 Hz | 160 Hz | 200 Hz | 250 Hz | 315 Hz | 400 Hz | 500 Hz | 630 Hz | 800 Hz | 1 kHz | 1.25 kHz | 1.6 kHz | 2 kHz | 2.5 kHz | 3.15 kHz | 4 kHz | 5 kHz | 6.3 kHz | 8 kHz | 10 kHz | 12.5 kHz | 16 kHz | 20 kHz |
| Ro-Ro | 87.5 | 99.2 | 98.3 | 96.7 | 97.7 | 96.9 | 97.1 | 94.8 | 91.4 | 90.0 | 88.8 | 86.2 | 84.6 | 83.1 | 81.2 | 80.1 | 78.7 | 77.2 | 75.9 | 74.1 | 72.5 | 70.9 | 68.8 | 67.1 | 65.6 | 64.8 | 64.5 | 64.4 | 67.0 | 68.6 | 69.2 | 69.2 |
| Container | 89.0 | 92.7 | 91.7 | 93.5 | 97.9 | 98.1 | 96.7 | 93.6 | 92.3 | 89.5 | 88.5 | 87.3 | 85.1 | 83.8 | 83.8 | 82.5 | 81.4 | 79.8 | 78.1 | 76.2 | 74.3 | 72.3 | 70.7 | 69.1 | 67.6 | 65.5 | 64.7 | 64.3 | 67.4 | 67.8 | 67.7 | 67.0 |
| Oil tanker | 82.6 | 86.5 | 85.9 | 88.3 | 90.5 | 89.0 | 87.3 | 89.5 | 87.6 | 84.2 | 80.3 | 78.5 | 78.0 | 76.7 | 75.1 | 74.2 | 73.1 | 72.4 | 71.5 | 70.9 | 69.3 | 67.8 | 68.6 | 66.6 | 64.7 | 64.0 | 64.4 | 63.6 | 65.0 | 66.9 | 67.6 | 67.5 |
| Chemical tanker | 85.9 | 87.1 | 89.5 | 90.6 | 94.4 | 95..0 | 91.8 | 91.1 | 89.2 | 88.3 | 84.8 | 83.2 | 84.5 | 81.3 | 79.8 | 78.6 | 77.3 | 75.9 | 75.4 | 73.1 | 71.8 | 69.6 | 67.8 | 67.0 | 65.0 | 63.7 | 62.6 | 62.1 | 64.1 | 65.3 | 66.1 | 67.5 |
| Ferry | 83.1 | 92.3 | 93.6 | 95.5 | 97.7 | 95.0 | 92.3 | 87.4 | 87.6 | 83.3 | 81.2 | 79.1 | 77.3 | 75.9 | 76.3 | 76.4 | 73.2 | 74.3 | 73.0 | 72.5 | 70.5 | 68.7 | 66.1 | 64.2 | 62.4 | 61.5 | 59.9 | 59.5 | 61.3 | 62.4 | 62.4 | 62.8 |
| Small vessels | 77.4 | 77.6 | 78.7 | 78.8 | 81.2 | 85.2 | 80.6 | 78.6 | 80.4 | 76.8 | 76.3 | 73.5 | 72.7 | 70.5 | 69.5 | 69.0 | 68.1 | 67.4 | 66.9 | 66.4 | 65.6 | 64.4 | 63.3 | 62.1 | 61.0 | 59.6 | 57.8 | 57.0 | 57.5 | 56.7 | 54.0 | 49.2 |
| Medium vessels | 83.5 | 78.1 | 80.4 | 85.5 | 86.3 | 90.9 | 85.6 | 87.3 | 89.7 | 87.4 | 84.4 | 82.1 | 80.9 | 77.4 | 75.5 | 75.4 | 75.1 | 73.8 | 72.6 | 70.9 | 69.6 | 68.0 | 66.9 | 65.8 | 64.2 | 62.3 | 60.4 | 59.8 | 60.3 | 59.6 | 56.6 | 51.7 |
Publisher’s Note: MDPI stays neutral with regard to jurisdictional claims in published maps and institutional affiliations. |
© 2022 by the authors. Licensee MDPI, Basel, Switzerland. This article is an open access article distributed under the terms and conditions of the Creative Commons Attribution (CC BY) license (https://creativecommons.org/licenses/by/4.0/).
Share and Cite
Schiavoni, S.; D’Alessandro, F.; Borelli, D.; Fredianelli, L.; Gaggero, T.; Schenone, C.; Baldinelli, G. Airborne Sound Power Levels and Spectra of Noise Sources in Port Areas. Int. J. Environ. Res. Public Health 2022, 19, 10996. https://0-doi-org.brum.beds.ac.uk/10.3390/ijerph191710996
Schiavoni S, D’Alessandro F, Borelli D, Fredianelli L, Gaggero T, Schenone C, Baldinelli G. Airborne Sound Power Levels and Spectra of Noise Sources in Port Areas. International Journal of Environmental Research and Public Health. 2022; 19(17):10996. https://0-doi-org.brum.beds.ac.uk/10.3390/ijerph191710996
Chicago/Turabian StyleSchiavoni, Samuele, Francesco D’Alessandro, Davide Borelli, Luca Fredianelli, Tomaso Gaggero, Corrado Schenone, and Giorgio Baldinelli. 2022. "Airborne Sound Power Levels and Spectra of Noise Sources in Port Areas" International Journal of Environmental Research and Public Health 19, no. 17: 10996. https://0-doi-org.brum.beds.ac.uk/10.3390/ijerph191710996