
Environmental Regulation, Financial Pressure and Industrial Ecological Efficiency of Resource-Based Cities in China: Spatiotemporal Characteristics and Impact Mechanism


Abstract
:1. Introduction
1.1. Necessity of Study
1.2. Purpose
- (1)
- To identify the impact of environmental regulation and financial pressure on IEE of RBCs.
- (2)
- To identify the comprehensive impact mechanism of environmental regulation and financial pressure on IEE of RBCs.
2. Theoretical Analysis
3. Study Area
4. Methods and Materials
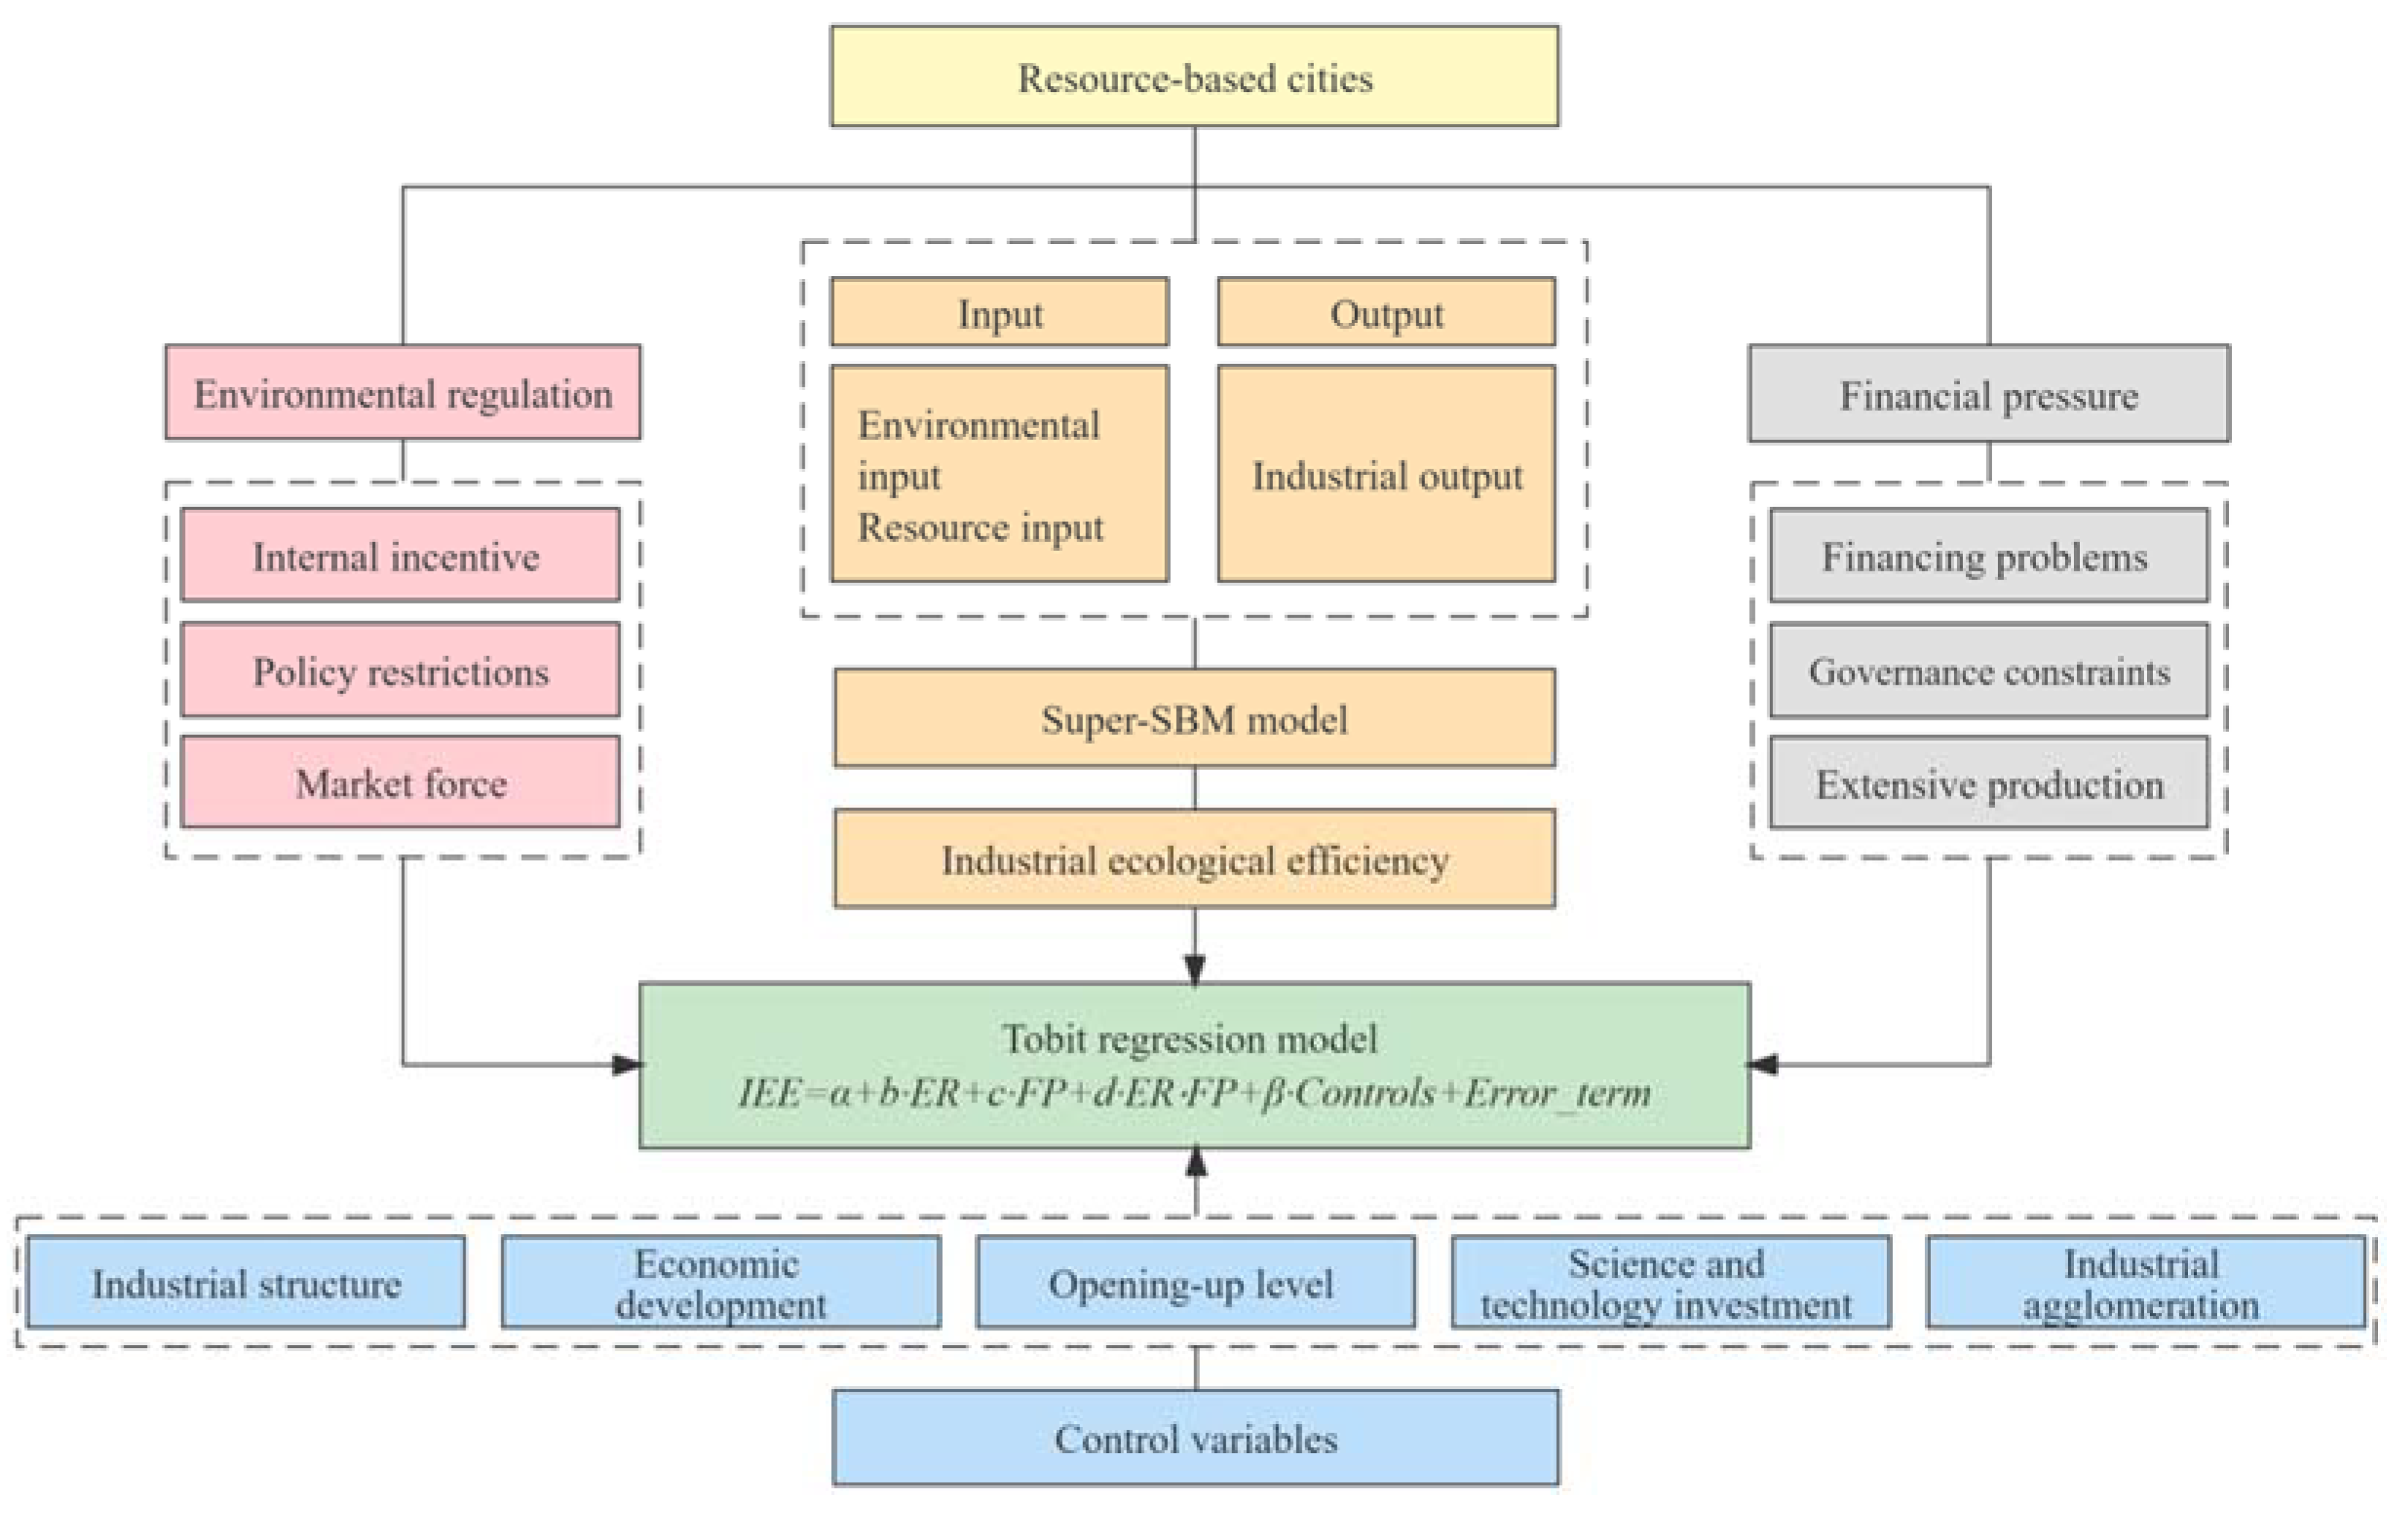
4.1. Methods
4.1.1. The Super-SBM Model
4.1.2. Tobit Regression Model
4.2. Variable Selection
4.2.1. Explained Variable
4.2.2. Explanatory Variables
- (1)
- Environmental regulation
- (2)
- Financial pressure
4.2.3. Control Variables
- (1)
- Industrial structure
- (2)
- Economic development level
- (3)
- Opening-up level
- (4)
- Science and technology investment
- (5)
- Industrial agglomeration
5. Results and Discussion
5.1. Spatiotemporal Characteristics of IEE
5.2. Regression Result Analysis
5.3. Heterogeneity Analysis
5.3.1. Results Analysis for Different Economic Regions
5.3.2. Results Analysis for Different Economic Development Stages
5.3.3. Results Analysis for Different Resource Types
5.4. Robustness Check
6. Conclusions
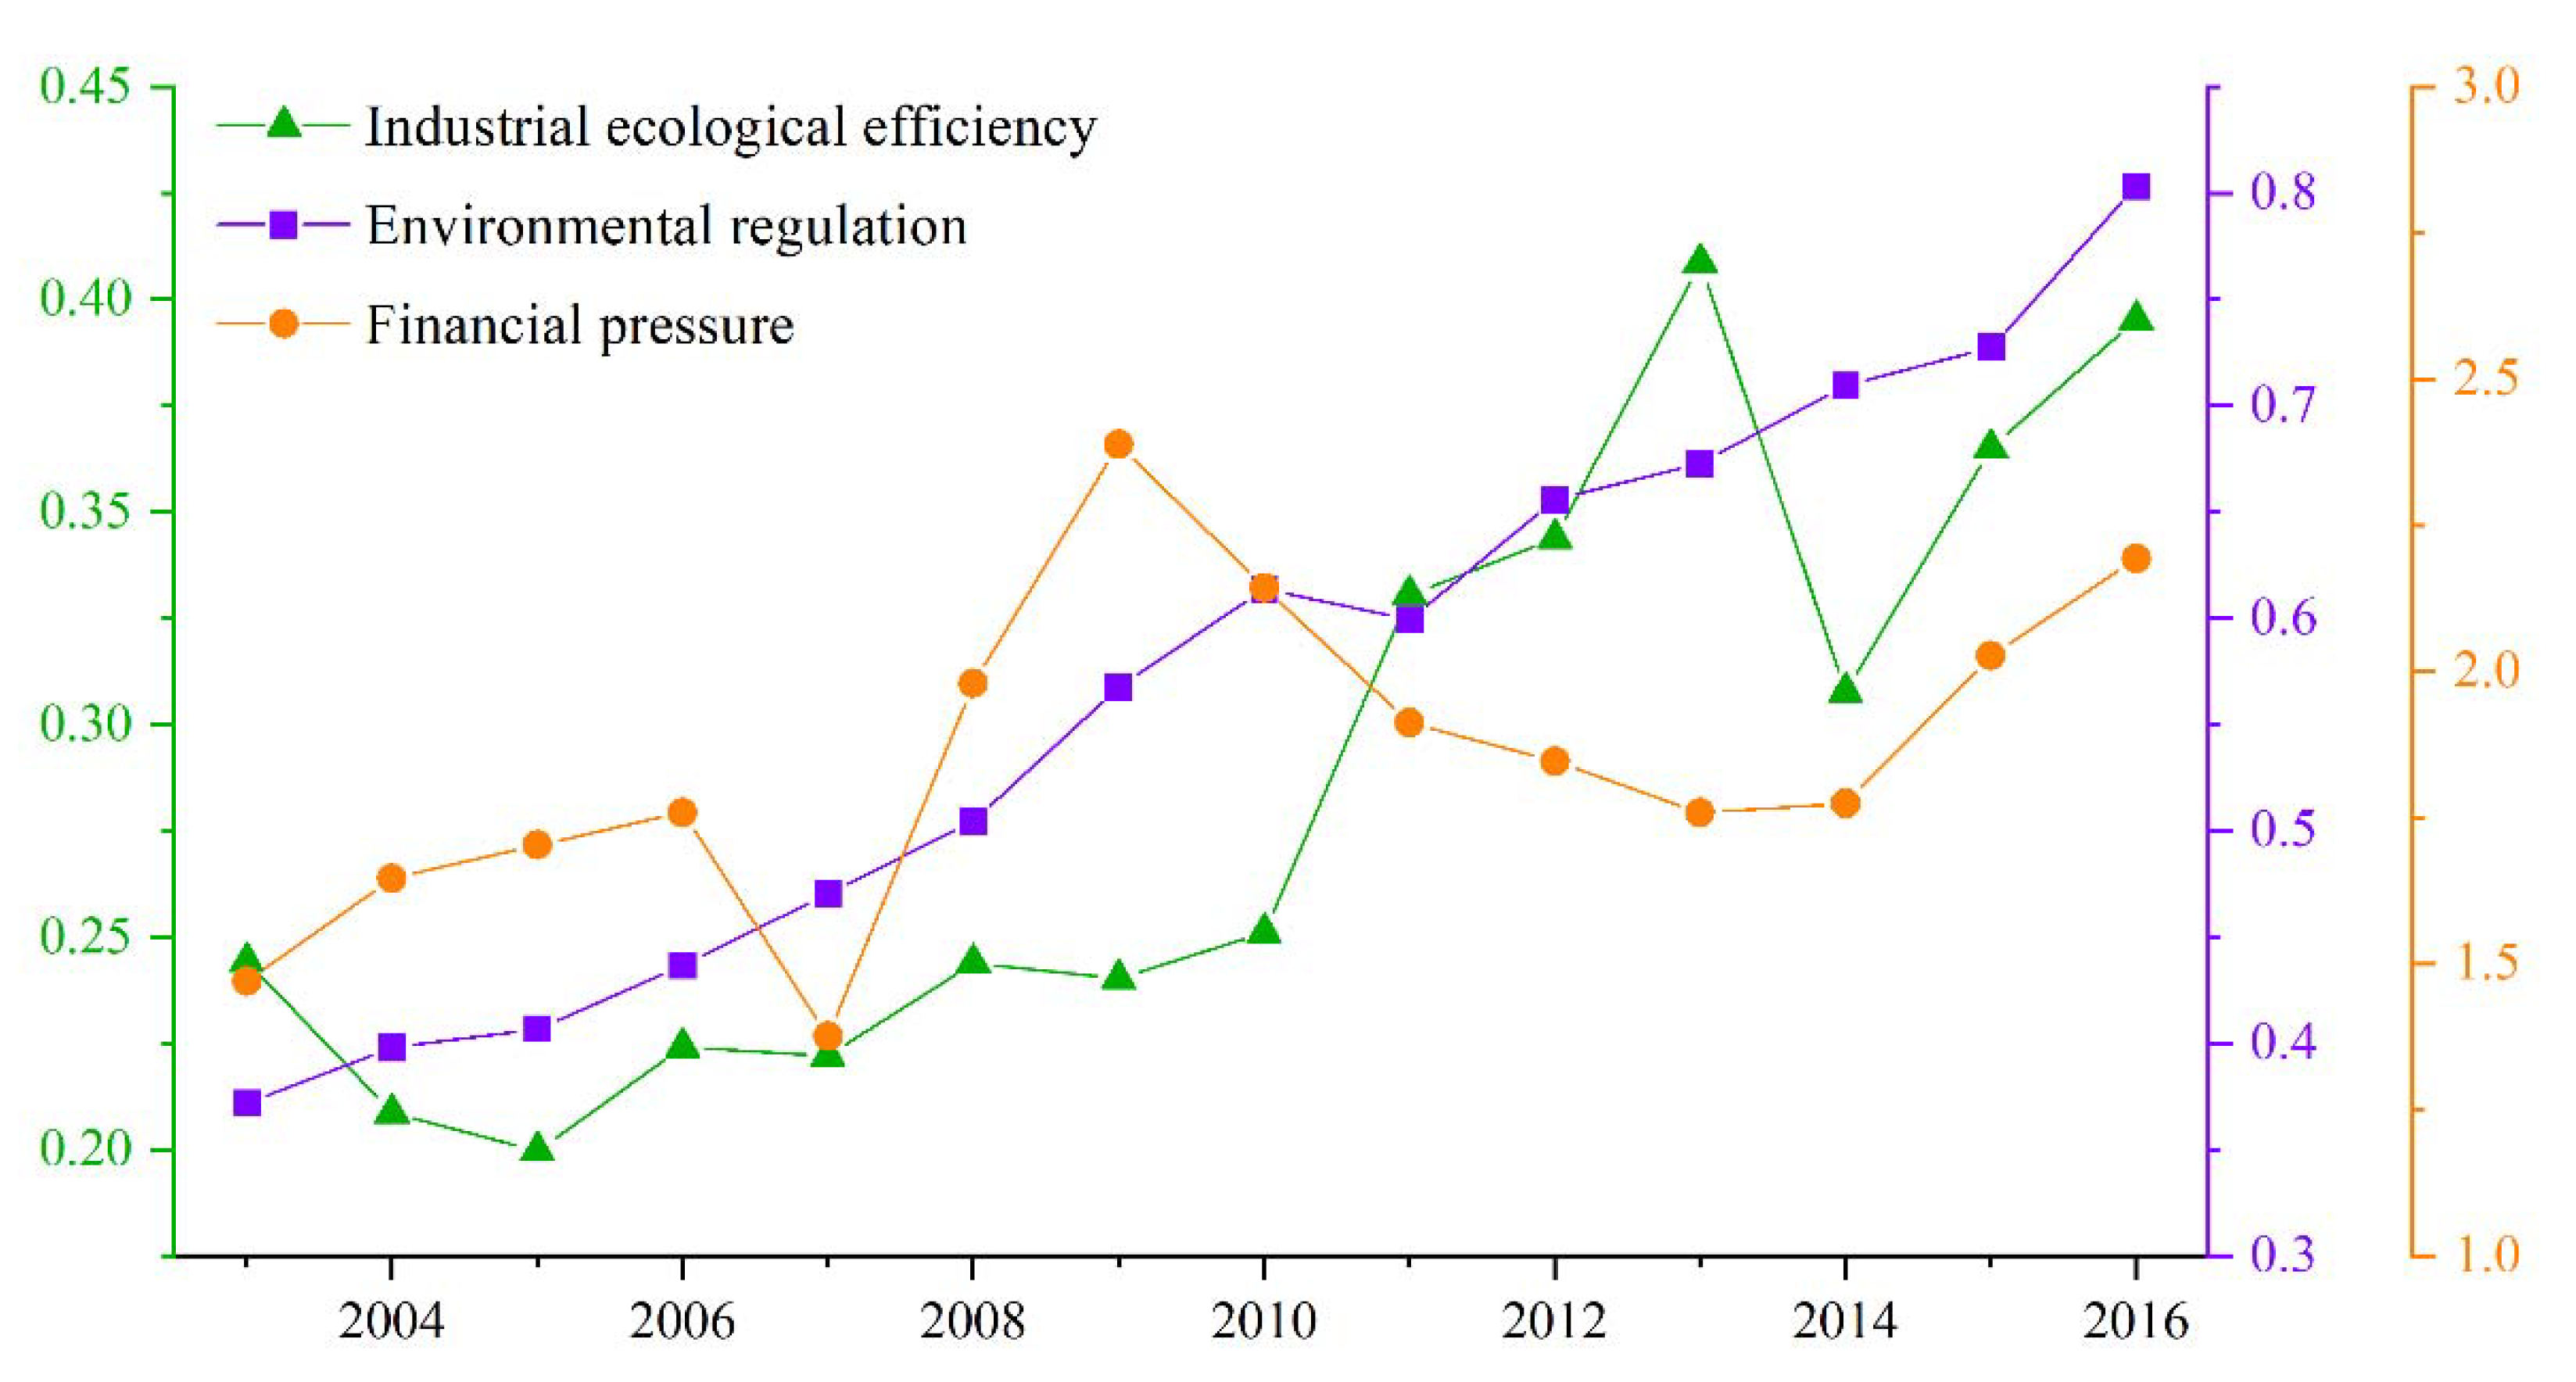
- (1)
- Over the study period, the IEE of RBCs in China showed an upward trend with fluctuations. With continuous improvement in China’s environmental management policies, the intensity of environmental regulation has shown a clear increasing trend. The financial pressure of RBCs is greatly affected by both the economic situation and the reform of the fiscal and taxation system and fluctuates greatly.
- (2)
- The IEE of RBCs in China shows a decreasing trend from the eastern region to the central region and on to the western region. The IEE of the northeastern and southwestern regions is still at a low level. The spatial heterogeneity of environmental regulation intensity is small. The level of financial pressure is high in the western and northern regions and low in the eastern and southern regions. The financial pressure in the northeastern and western regions remains in an uptrend.
- (3)
- Appropriate environmental regulation and financial pressure have a positive impact on the IEE of RBCs. When faced with the dual pressures of environmental regulation and financial difficulty, improvement of IEE is inhibited. Industrial structure and level of industrial agglomeration can promote improvement of IEE, while the opening-up level has a significant negative impact on IEE. The impact of environmental regulation and financial pressure on cities in different regions, development stages, and of different resource types shows clear heterogeneity.
Author Contributions
Funding
Institutional Review Board Statement
Informed Consent Statement
Data Availability Statement
Conflicts of Interest
References
- Yin, G.; Liu, Y.; Wang, F. Emerging Chinese new towns: Local government-directed capital switching in inland China. Cities 2018, 79, 102–112. [Google Scholar] [CrossRef]
- Gu, Y.; Wu, Y.; Liu, J.; Xu, M.; Zuo, T. Ecological civilization and government administrative system reform in China. Resour. Conserv. Recycl. 2020, 155, 104654. [Google Scholar] [CrossRef]
- Chen, C.; Sun, Y.; Lan, Q.; Jiang, F. Impacts of industrial agglomeration on pollution and ecological efficiency-A spatial econometric analysis based on a big panel dataset of China’s 259 cities. J. Clean. Prod. 2020, 258, 120721. [Google Scholar] [CrossRef]
- Ma, X.; Wang, C.; Yu, Y.; Li, Y.; Dong, B.; Zhang, X.; Niu, X.; Yang, Q.; Chen, R.; Li, Y. Ecological efficiency in China and its influencing factors—a super-efficient SBM metafrontier-Malmquist-Tobit model study. Environ. Sci. Pollut. Res. 2018, 25, 20880–20898. [Google Scholar] [CrossRef] [PubMed]
- Zhou, M.; Wang, T.; Yan, L.; Xie, X.-B. Has Economic Competition Improved China’s Provincial Energy Ecological Efficiency under Fiscal Decentralization? Sustainability 2018, 10, 2483. [Google Scholar] [CrossRef]
- Yao, J.; Li, H.; Shang, D.; Ding, L. Evolution of the industrial innovation ecosystem of resource-based cities (RBCs): A case study of Shanxi Province, China. Sustainability 2021, 13, 11350. [Google Scholar] [CrossRef]
- Qin, M.; Sun, M.; Li, J. Impact of environmental regulation policy on ecological efficiency in four major urban agglomerations in eastern China. Ecol. Indic. 2021, 130, 108002. [Google Scholar] [CrossRef]
- Song, M.; Zhao, X.; Shang, Y. The impact of low-carbon city construction on ecological efficiency: Empirical evidence from quasi-natural experiments. Resour. Conserv. Recycl. 2020, 157, 104777. [Google Scholar] [CrossRef]
- Yu, C.; Dijkema, G.P.J.; de Jong, M.; Shi, H. From an eco-industrial park towards an eco-city: A case study in Suzhou, China. J. Clean. Prod. 2015, 102, 264–274. [Google Scholar] [CrossRef]
- Ma, S.; Hu, S.; Chen, D.; Zhu, B. A case study of a phosphorus chemical firm’s application of resource efficiency and eco-efficiency in industrial metabolism under circular economy. J. Clean. Prod. 2015, 87, 839–849. [Google Scholar] [CrossRef]
- Tan, R.; Lin, B. The influence of carbon tax on the ecological efficiency of China’s energy intensive industries—A inter-fuel and inter-factor substitution perspective. J. Environ. Manag. 2020, 261, 110252. [Google Scholar] [CrossRef] [PubMed]
- Boussofiane, A.; Dyson, R.G.; Thanassoulis, E. Applied data envelopment analysis. Eur. J. Oper. Res. 1991, 52, 1–15. [Google Scholar] [CrossRef]
- Ge, X.; Xu, J.; Xie, Y.; Guo, X.; Yang, D. Evaluation and dynamic evolution of eco-efficiency of resource-based cities—A case study of typical resource-based cities in China. Sustainability 2021, 13, 6802. [Google Scholar] [CrossRef]
- Song, M.; Xie, Q.; Shen, Z. Impact of green credit on high-efficiency utilization of energy in China considering environmental constraints. Energy Policy 2021, 153, 112267. [Google Scholar] [CrossRef]
- Fan, Y.; Qiao, Q.; Xian, C.; Xiao, Y.; Fang, L. A modified ecological footprint method to evaluate environmental impacts of industrial parks. Resour. Conserv. Recycl. 2017, 125, 293–299. [Google Scholar] [CrossRef]
- Peng, W.; Wang, X.; Li, X.; He, C. Sustainability evaluation based on the emergy ecological footprint method: A case study of Qingdao, China, from 2004 to 2014. Ecol. Indic. 2018, 85, 1249–1261. [Google Scholar] [CrossRef]
- Hau, J.L.; Bakshi, B.R. Promise and problems of emergy analysis. Ecol. Model. 2004, 178, 215–225. [Google Scholar] [CrossRef]
- Raimundo, A.; Saraiva, N.; Dias Pereira, L.; Rebelo, A. Market-Oriented Cost-Effectiveness and Energy Analysis of Windows in Portugal. Energies 2021, 14, 3720. [Google Scholar] [CrossRef]
- Wang, C.; Zhang, C.; Hu, F.; Wang, Y.; Yu, L.; Liu, C. Emergy-based ecological efficiency evaluation and optimization method for logistics park. Environ. Sci. Pollut. Res. Int. 2021, 28, 58342–58354. [Google Scholar] [CrossRef]
- Huang, T.; Shi, F.; Tanikawa, H.; Fei, J.; Han, J. Materials demand and environmental impact of buildings construction and demolition in China based on dynamic material flow analysis. Resour. Conserv. Recycl. 2013, 72, 91–101. [Google Scholar] [CrossRef]
- Deshpande, P.C.; Philis, G.; Brattebø, H.; Fet, A.M. Using Material Flow Analysis (MFA) to generate the evidence on plastic waste management from commercial fishing gears in Norway. Resour. Conserv. Recycl. X 2020, 5, 100024. [Google Scholar] [CrossRef]
- Liu, N.; Zhang, Y.; Fath, B.D. The material metabolism characteristics and growth patterns of the central cities of China’s Beijing-Tianjin-Hebei region. Ecol. Model. 2021, 448, 109532. [Google Scholar] [CrossRef]
- Zhang, J.; Liu, Y.; Chang, Y.; Zhang, L. Industrial eco-efficiency in China: A provincial quantification using three-stage data envelopment analysis. J. Clean. Prod. 2017, 143, 238–249. [Google Scholar] [CrossRef]
- Song, C.; Yin, G.; Lu, Z.; Chen, Y. Industrial ecological efficiency of cities in the Yellow River Basin in the background of China’s economic transformation: Spatial-temporal characteristics and influencing factors. Environ. Sci. Pollut. Res. 2022, 29, 4334–4349. [Google Scholar] [CrossRef] [PubMed]
- Liu, Z.; Zhang, H.; Zhang, Y.-J.; Zhu, T.-T. How does industrial policy affect the eco-efficiency of industrial sector? Evidence from China. Appl. Energy 2020, 272, 115206. [Google Scholar] [CrossRef]
- Zhou, C.; Shi, C.; Wang, S.; Zhang, G. Estimation of eco-efficiency and its influencing factors in Guangdong province based on Super-SBM and panel regression models. Ecol. Indic. 2018, 86, 67–80. [Google Scholar] [CrossRef]
- Yuan, B.; Xiang, Q. Environmental regulation, industrial innovation and green development of Chinese manufacturing: Based on an extended CDM model. J. Clean. Prod. 2018, 176, 895–908. [Google Scholar] [CrossRef]
- Lu, W.; Wu, H.; Geng, S. Heterogeneity and threshold effects of environmental regulation on health expenditure: Considering the mediating role of environmental pollution. J. Environ. Manag. 2021, 297, 113276. [Google Scholar] [CrossRef]
- Feng, Z.; Chen, W. Environmental Regulation, Green Innovation, and Industrial Green Development: An Empirical Analysis Based on the Spatial Durbin Model. Sustainability 2018, 10, 223. [Google Scholar] [CrossRef]
- Li, W.; Sun, H.; Tran, D.K.; Taghizadeh-Hesary, F. The impact of environmental regulation on technological innovation of resource-based industries. Sustainability 2020, 12, 6837. [Google Scholar] [CrossRef]
- Chong, Z.; Qin, C.; Ye, X. Environmental Regulation, Economic Network and Sustainable Growth of Urban Agglomerations in China. Sustainability 2016, 8, 467. [Google Scholar] [CrossRef]
- Zhang, Z.; Zhao, W. Research on Financial Pressure, Poverty Governance, and Environmental Pollution in China. Sustainability 2018, 10, 1834. [Google Scholar] [CrossRef]
- Carmeli, A. The fiscal distress of local governments in Israel: Sources and coping strategies. Adm. Soc. 2008, 39, 984–1007. [Google Scholar] [CrossRef]
- Vivian Zhan, J. Decentralizing China: Analysis of central strategies in China’s fiscal reforms. J. Contemp. China 2009, 18, 445–462. [Google Scholar] [CrossRef]
- Wu, H.; Li, Y.; Hao, Y.; Ren, S.; Zhang, P. Environmental decentralization, local government competition, and regional green development: Evidence from China. Sci. Total Environ. 2020, 708, 135085. [Google Scholar] [CrossRef]
- Ahmad, F.; Xu, H.; Draz, M.U.; Ozturk, I.; Chandio, A.A.; Wang, Y.; Zhang, D. The case of China’s fiscal decentralization and eco-efficiency: Is it worthwhile or just a bootless errand? Sustain. Prod. Consum. 2021, 26, 89–100. [Google Scholar] [CrossRef]
- van der Kamp, D.; Lorentzen, P.; Mattingly, D. Racing to the Bottom or to the Top? Decentralization, Revenue Pressures, and Governance Reform in China. World Dev. 2017, 95, 164–176. [Google Scholar] [CrossRef]
- Fredriksson, P.G.; List, J.A.; Millimet, D.L. Bureaucratic corruption, environmental policy and inbound US FDI: Theory and evidence. J. Public Econ. 2003, 87, 1407–1430. [Google Scholar] [CrossRef]
- Kou, P.; Han, Y. Vertical environmental protection pressure, fiscal pressure, and local environmental regulations: Evidence from China’s industrial sulfur dioxide treatment. Environ. Sci. Pollut. Res. 2021, 28, 60095–60110. [Google Scholar] [CrossRef]
- Hao, Y.; Zhang, Z.Y.; Liao, H.; Wei, Y.M.; Wang, S. Is CO2 emission a side effect of financial development? An empirical analysis for China. Environ. Sci. Pollut. Res. Int. 2016, 23, 21041–21057. [Google Scholar] [CrossRef]
- Han, L.; Kung, J.K.-S. Fiscal incentives and policy choices of local governments: Evidence from China. J. Dev. Econ. 2015, 116, 89–104. [Google Scholar] [CrossRef]
- Zhang, X.; Qu, M. Impact of environmental regulation on scientific and technological competitiveness of resource-based cities in china—based on panel data of 33 resource-based cities. Int. J. Environ. Res. Public Health 2020, 17, 9187. [Google Scholar] [CrossRef] [PubMed]
- Lee, E. Environmental regulation and financial performance in China: An integrated view of the Porter hypothesis and institutional theory. Sustainability 2020, 12, 10183. [Google Scholar] [CrossRef]
- Ren, S.; Li, X.; Yuan, B.; Li, D.; Chen, X. The effects of three types of environmental regulation on eco-efficiency: A cross-region analysis in China. J. Clean. Prod. 2018, 173, 245–255. [Google Scholar] [CrossRef]
- Tian, Z.; Tian, Y.; Chen, Y.; Shao, S. The economic consequences of environmental regulation in China: From a perspective of the environmental protection admonishing talk policy. Bus. Strategy Environ. 2020, 29, 1723–1733. [Google Scholar] [CrossRef]
- Hwang, J.A.; Kim, Y. Effects of environmental regulations on trade flow in manufacturing sectors: Comparison of static and dynamic effects of environmental regulations. Bus. Strategy Environ. 2017, 26, 688–706. [Google Scholar] [CrossRef]
- Shao, S.; Tian, Z.; Fan, M. Do the rich have stronger willingness to pay for environmental protection? New evidence from a survey in China. World Dev. 2018, 105, 83–94. [Google Scholar] [CrossRef]
- Yang, Z.; Fan, M.; Shao, S.; Yang, L. Does carbon intensity constraint policy improve industrial green production performance in China? A quasi-DID analysis. Energy Econ. 2017, 68, 271–282. [Google Scholar] [CrossRef]
- Song, Y.; Yang, T.; Zhang, M. Research on the impact of environmental regulation on enterprise technology innovation—an empirical analysis based on Chinese provincial panel data. Environ. Sci. Pollut. Res. 2019, 26, 21835–21848. [Google Scholar] [CrossRef]
- Xu, J.; Chen, D.; Liu, R.; Zhou, M.; Kong, Y. Environmental Regulation, Technological Innovation, and Industrial Transformation: An Empirical Study Based on City Function in China. Sustainability 2021, 13, 12512. [Google Scholar] [CrossRef]
- Neves, S.A.; Marques, A.C.; Patrício, M. Determinants of CO2 emissions in European Union countries: Does environmental regulation reduce environmental pollution? Econ. Anal. Policy 2020, 68, 114–125. [Google Scholar] [CrossRef]
- Grankvist, G.; Dahlstrand, U.; Biel, A. The impact of environmental labelling on consumer preference: Negative vs. positive labels. J. Consum. Policy 2004, 27, 213–230. [Google Scholar] [CrossRef]
- Liu, J.; Xie, J. Environmental regulation, technological innovation, and export competitiveness: An empirical study based on China’s manufacturing industry. Int. J. Environ. Res. Public Health 2020, 17, 1427. [Google Scholar] [CrossRef] [PubMed]
- Luan, M.; Shao, X.; Dou, F. Financial conditions, health care provision, and patient outcomes: Evidence from Chinese public hospitals. Econ. Lett. 2020, 186, 108876. [Google Scholar] [CrossRef]
- Bai, J.; Lu, J.; Li, S. Fiscal Pressure, Tax Competition and Environmental Pollution. Environ. Resour. Econ. 2018, 73, 431–447. [Google Scholar] [CrossRef]
- Rauscher, M. Economic growth and tax-competing leviathans. Int. Tax Public Financ. 2005, 12, 457–474. [Google Scholar] [CrossRef]
- Stewart, R.B. Pyramids of Sacrifice--Problems of Federalism in Mandating State Implementations of National Environmental Policy. Yale Law J. 1976, 86, 1196. [Google Scholar] [CrossRef]
- Charnes, A.; Cooper, W.W.; Rhodes, E. Measuring the efficiency of decision making units. Eur. J. Oper. Res. 1978, 2, 429–444. [Google Scholar] [CrossRef]
- Medarević, A.; Vuković, D. Efficiency and Productivity of Public Hospitals in Serbia Using DEA-Malmquist Model and Tobit Regression Model, 2015–2019. Int. J. Environ. Res. Public Health 2021, 18, 12475. [Google Scholar] [CrossRef]
- Tone, K. A slacks-based measure of efficiency in data envelopment analysis. Eur. J. Oper. Res. 2001, 130, 498–509. [Google Scholar] [CrossRef] [Green Version]
- Korhonen, P.J.; Luptacik, M. Eco-efficiency analysis of power plants: An extension of data envelopment analysis. Eur. J. Oper. Res. 2004, 154, 437–446. [Google Scholar] [CrossRef]
- Li, Y.; Zhang, Q.; Wang, L.; Liang, L. Regional environmental efficiency in China: An empirical analysis based on entropy weight method and non-parametric models. J. Clean. Prod. 2020, 276, 124147. [Google Scholar] [CrossRef]
- Yan, Y.; Reschovsky, A. Fiscal disparities among local governments in Zhejiang Province, China. J. Urban Aff. 2021, 1–22. [Google Scholar] [CrossRef]
- Chen, Y.; Yin, G.; Liu, K. Regional differences in the industrial water use efficiency of China: The spatial spillover effect and relevant factors. Resour. Conserv. Recycl. 2021, 167, 105239. [Google Scholar] [CrossRef]
- Zhao, X.; Shang, Y.; Song, M. Industrial structure distortion and urban ecological efficiency from the perspective of green entrepreneurial ecosystems. Socio-Econ. Plan. Sci. 2020, 72, 100757. [Google Scholar] [CrossRef]
- Coxhead, I. A New Resource Curse? Impacts of China’s Boom on Comparative Advantage and Resource Dependence in Southeast Asia. World Dev. 2007, 35, 1099–1119. [Google Scholar] [CrossRef]
- Yasmeen, H.; Tan, Q.; Zameer, H.; Tan, J.; Nawaz, K. Exploring the impact of technological innovation, environmental regulations and urbanization on ecological efficiency of China in the context of COP21. J. Environ. Manag. 2020, 274, 111210. [Google Scholar] [CrossRef]
- Jin, X.; Li, X.; Feng, Z.; Wu, J.; Wu, K. Linking ecological efficiency and the economic agglomeration of China based on the ecological footprint and nighttime light data. Ecol. Indic. 2020, 111, 106035. [Google Scholar] [CrossRef]
- Chen, J.-X.; Zhang, Y.; Zheng, S. Ecoefficiency, environmental regulation opportunity costs, and interregional industrial transfers: Evidence from the Yangtze River Economic Belt in China. J. Clean. Prod. 2019, 233, 611–625. [Google Scholar] [CrossRef]
- Guo, L.L.; Qu, Y.; Tseng, M.-L. The interaction effects of environmental regulation and technological innovation on regional green growth performance. J. Clean. Prod. 2017, 162, 894–902. [Google Scholar] [CrossRef]
- Zhou, Y.; Kong, Y.; Sha, J.; Wang, H. The role of industrial structure upgrades in eco-efficiency evolution: Spatial correlation and spillover effects. Sci. Total Environ. 2019, 687, 1327–1336. [Google Scholar] [CrossRef] [PubMed]
- Tan, J.; Wang, R. Research on evaluation and influencing factors of regional ecological efficiency from the perspective of carbon neutrality. J. Environ. Manag. 2021, 294, 113030. [Google Scholar] [CrossRef] [PubMed]
- Yang, X.; Li, C. Industrial environmental efficiency, foreign direct investment and export—Evidence from 30 provinces in China. J. Clean. Prod. 2019, 212, 1490–1498. [Google Scholar] [CrossRef]
- Dai, Z.; Guo, L.; Jiang, Z. Study on the industrial Eco-Efficiency in East China based on the Super Efficiency DEA Model: An example of the 2003–2013 panel data. Appl. Econ. 2016, 48, 5779–5785. [Google Scholar] [CrossRef]
- Chen, Y.; Zhu, B.; Sun, X.; Xu, G. Industrial environmental efficiency and its influencing factors in China: Analysis based on the Super-SBM model and spatial panel data. Environ. Sci. Pollut. Res. Int. 2020, 27, 44267–44278. [Google Scholar] [CrossRef] [PubMed]
- Gao, L.; Li, F.; Zhang, J.; Wang, X.; Hao, Y.; Li, C.; Tian, Y.; Yang, C.; Song, W.; Wang, T. Study on the Impact of Industrial Agglomeration on Ecological Sustainable Development in Southwest China. Sustainability 2021, 13, 1301. [Google Scholar] [CrossRef]
- Liu, B.; Wang, J.; Jing, Z.; Tang, Q. Measurement of sustainable transformation capability of resource-based cities based on fuzzy membership function: A case study of Shanxi Province, China. Resour. Policy 2020, 68, 101739. [Google Scholar] [CrossRef]
- Lu, X.; White, H. Robustness checks and robustness tests in applied economics. J. Econom. 2014, 178, 194–206. [Google Scholar] [CrossRef]


| Indicator | Category | Variable | Unit | Mean | Std. Dev. | Min | Max |
|---|---|---|---|---|---|---|---|
| Input | Environmental input | Industrial smoke and dust emissions | ton | 44,016.49 | 178,979.98 | 139 | 5,168,812 |
| Industrial SO2 emissions | ton | 65,332.57 | 56,291.14 | 612 | 337,164 | ||
| Industrial wastewater discharge | 10 kilotons | 4998.05 | 4357.63 | 122 | 29,365 | ||
| Resource input | Industrial electricity consumption | 100 million KW·h | 36.74 | 51.94 | 0.10 | 519.59 | |
| Output | Economic output | Industrial output | 100 million Yuan | 1282.89 | 1778.73 | 8.45 | 15,367.87 |
| Variable | Indicator | Code | Mean | Std. Dev. | Min | Max |
|---|---|---|---|---|---|---|
| Dependent variable | Industrial ecological efficiency | IEE | 0.285 | 0.331 | 0.126 | 3.617 |
| Explanatory variable | Environmental regulation | ER | 0.567 | 0.191 | 0.117 | 0.973 |
| Financial pressure | FP | 1.836 | 1.724 | 0.002 | 17.399 | |
| Control variable | Industrial structure | IS | 51.283 | 12.294 | 9.150 | 90.970 |
| Economic development level | lnPGDP | 9.973 | 0.816 | 4.595 | 12.456 | |
| Opening-up level | FDI | 7.084 | 7.808 | 1.080 | 97.174 | |
| Science and technology investment | TEC | 0.843 | 0.967 | 0.201 | 20.683 | |
| Industrial agglomeration | IA | 2.299 | 3.228 | 0.008 | 20.988 |
| Variable | All Resource-Based Cities | ||
|---|---|---|---|
| (1) | (2) | (3) | |
| ER | 0.3461 *** | 0.4010 *** | |
| FP | 0.0165 *** | 0.0331 ** | |
| ER·FP | −0.0406 ** | ||
| IS | 0.0035 *** | 0.0019 * | 0.0037 *** |
| lnPGDP | 0.0193 | 0.0925 *** | 0.0221 |
| FDI | −0.0034 *** | −0.0038 *** | −0.0034 *** |
| TEC | −0.0075 | −0.0043 | −0.0081 |
| IA | 0.0585 *** | 0.0597 *** | 0.0587 *** |
| Constant | −0.3881 *** | −0.8699 *** | −0.4773 *** |
| Variable | Eastern Region | Central Region | Western Region | Northeastern Region | ||||||||
|---|---|---|---|---|---|---|---|---|---|---|---|---|
| (1) | (2) | (3) | (1) | (2) | (3) | (1) | (2) | (3) | (1) | (2) | (3) | |
| ER | 0.3410 ** | 0.8980 *** | 0.3637 *** | 0.1899 * | 0.2934 *** | 0.3077 ** | 0.3765 *** | 0.2658 ** | ||||
| FP | 0.0097 | 0.2903 *** | 0.0001 | −0.0797 ** | 0.0143 * | 0.0194 | 0.0168 | −0.0162 | ||||
| ER·FP | −0.5884 *** | 0.1247 | −0.0172 | 0.0477 | ||||||||
| Control | Yes | Yes | Yes | Yes | Yes | Yes | Yes | Yes | Yes | Yes | Yes | Yes |
| Variable | Growing | Matured | Recessionary | Regenerative | ||||||||
|---|---|---|---|---|---|---|---|---|---|---|---|---|
| (1) | (2) | (3) | (1) | (2) | (3) | (1) | (2) | (3) | (1) | (2) | (3) | |
| ER | 0.3224 *** | 0.3382 *** | 0.6156 *** | 0.9844 *** | 0.1909 ** | 0.1455 | 0.5010 ** | 0.3986 * | ||||
| FP | 0.0107 | 0.0097 | 0.0254 * | 0.0080 *** | −0.0091 | −0.0301 | −0.0060 | −0.0678 | ||||
| ER·FP | −0.0132 | −0.1434 ** | 0.0316 | 0.0936 | ||||||||
| Control | Yes | Yes | Yes | Yes | Yes | Yes | Yes | Yes | Yes | Yes | Yes | Yes |
| Variable | Coal-Based City | Metal-Based City | Nonmetallic-Based City | Forest-Based City | Oil and Gas-Based City | |||||||||||
|---|---|---|---|---|---|---|---|---|---|---|---|---|---|---|---|---|
| (1) | (2) | (3) | (1) | (2) | (3) | (1) | (2) | (3) | (1) | (2) | (3) | (1) | (2) | (3) | ||
| ER | 0.1430 ** | 0.2334 *** | 0.3779 *** | 0.4535 *** | 0.6366 *** | 0.6833 *** | 0.9667 ** | −0.6262 | 0.6399 * | 0.9808 ** | ||||||
| FP | 0.0032 | 0.0275 | 0.0234 *** | 0.0477 *** | 0.0244 ** | 0.0329 | −0.0264 | −0.3770 *** | 0.0121 | 0.1604 | ||||||
| ER·FP | −0.0485 | −0.0469 ** | −0.0433 | −0.9184 *** | −0.2565 | |||||||||||
| Control | Yes | Yes | Yes | Yes | Yes | Yes | Yes | Yes | Yes | Yes | Yes | Yes | Yes | Yes | Yes | |
| Variable | All | Eastern Region | Central Region | Western Region | Northeastern Region | Growing | Matured | Recessionary | Regenerative | Coal-Based City | Metal-Based City | Nonmetallic-Based City | Forest-Based City | Oil and Gas-Based City |
|---|---|---|---|---|---|---|---|---|---|---|---|---|---|---|
| ER | 0.2380 *** | 0.3194 ** | 0.0296 | 0.1110 | 0.4215 *** | 0.3662 ** | 0.2158 *** | 0.0909 ** | 0.3389 ** | 0.1771 ** | 0.2914 *** | 0.7532 *** | −0.2010 | 0.2548 |
| FP | 0.0071 * | 0.0485 | −0.0390 | 0.0043 | −0.0138 | 0.0508 ** | −0.0152 | −0.0717 | −0.0453 | 0.0212 | −0.0268 * | −0.0018 | −0.1011 | 0.0121 |
| ER·FP | −0.0023 ** | −0.1020 * | 0.0791 | 0.0070 | −0.0153 | −0.0495 | 0.0204 | −0.0771 | 0.0495 | −0.0500 ** | −0.0028 | −0.0333 | −0.1335 ** | 0.0006 |
| Control | Yes | Yes | Yes | Yes | Yes | Yes | Yes | Yes | Yes | Yes | Yes | Yes | Yes | Yes |
Publisher’s Note: MDPI stays neutral with regard to jurisdictional claims in published maps and institutional affiliations. |
© 2022 by the authors. Licensee MDPI, Basel, Switzerland. This article is an open access article distributed under the terms and conditions of the Creative Commons Attribution (CC BY) license (https://creativecommons.org/licenses/by/4.0/).
Share and Cite
Hou, Y.; Yin, G.; Chen, Y. Environmental Regulation, Financial Pressure and Industrial Ecological Efficiency of Resource-Based Cities in China: Spatiotemporal Characteristics and Impact Mechanism. Int. J. Environ. Res. Public Health 2022, 19, 11079. https://0-doi-org.brum.beds.ac.uk/10.3390/ijerph191711079
Hou Y, Yin G, Chen Y. Environmental Regulation, Financial Pressure and Industrial Ecological Efficiency of Resource-Based Cities in China: Spatiotemporal Characteristics and Impact Mechanism. International Journal of Environmental Research and Public Health. 2022; 19(17):11079. https://0-doi-org.brum.beds.ac.uk/10.3390/ijerph191711079
Chicago/Turabian StyleHou, Yiming, Guanwen Yin, and Yanbin Chen. 2022. "Environmental Regulation, Financial Pressure and Industrial Ecological Efficiency of Resource-Based Cities in China: Spatiotemporal Characteristics and Impact Mechanism" International Journal of Environmental Research and Public Health 19, no. 17: 11079. https://0-doi-org.brum.beds.ac.uk/10.3390/ijerph191711079