Case Report

Interchangeability between the Data Obtained by Two Powermeters during Road Cycling Competitions: A Case Study

by
Javier Iglesias-Pino
,
Alba Herrero-Molleda
*,
Jaime Fernández-Fernández
and
Juan García-López
Faculty of Physical Activity and Sports Sciences, AMRED, Human Movement and Sports Performance Analysis, Universidad de León, 24071 León, Spain
*
Author to whom correspondence should be addressed.
Int. J. Environ. Res. Public Health 2022, 19(24), 16446; https://0-doi-org.brum.beds.ac.uk/10.3390/ijerph192416446
Submission received: 24 October 2022 / Revised: 2 December 2022 / Accepted: 7 December 2022 / Published: 8 December 2022
(This article belongs to the Special Issue Advances in Training and Rehabilitation Strategies in Youth Sports)

Abstract

:
Various power meters are used to assess road-cycling performance in training and competition, but no previous study has analyzed their interchangeability in these conditions. Therefore, the purpose was to compare the data obtained from two different power meters (PowerTap vs. Power2Max) during cycling road races. A national-level under-23 male competitive cyclist completed six road-cycling official competitions (five road races and one individual time trial), in which power output was simultaneously registered with the two power meters. After this, the main power output variables were analyzed with the same software. The average and critical power obtained from the PowerTap power meter were slightly lower than from the Power2Max power meter (3.56 ± 0.68 and 3.62 ± 0.74 W·kg−1, 5.06 and 5.11 W·kg−1, respectively), and the correlations between both devices were very high (r ≥ 0.996 and p < 0.001). In contrast, the PowerTap power meter registered a significantly higher (p < 0.05) percentage of time at <0.75 and >7.50 W·kg−1 and power profile at 1, 5 and 10 s. In conclusion, the data obtained in competitions by the two power meters were interchangeable. Nevertheless, the Power2Max power meter underestimated the pedaling power during short and high-intensity intervals (≤10.0 s and >7.50 W·kg−1) compared to the PowerTap power meter. Therefore, the analysis of these efforts should be treated with caution.

1. Introduction

The first registry of pedaling power output in cycle ergometer was dated in 1896, but the first portable power meters were not designed until the end of the 1980s (i.e., SRM, Balboa Instrument PowerPacer and Look Max One) [1,2]. Since then, these devices have been used to monitor training, to perform field-based performance tests, to analyze cycling competitions, and to evaluate changes in bicycle equipment [3].
Various portable power meters are available nowadays and can be classified according to their location on the bike (i.e., rear hub, crank, chainring, pedal, shoe, or handlebar) or to the sensor technology used (i.e., strain gauges, accelerometers, or multi-sensors to measure wind-speed, slope, etc.). More specifically, since the SRM patent expiration in 2007 (chainring power meter with strain gauges) some power meters with similar characteristics have been available (e.g., PowerTap C1, Quarq, Power2Max, FSA Powerbox). While Quarq’s validity and reliability has been questioned [4], the Power2Max power meter seems to be valid and reliable during submaximal pedaling (between 180–360 W) with the cyclist in seated position [3]. However, the PowerTap C1 and FSA Powerbox power meters have not been tested yet.
The Power2Max power meter was presented in the Eurobike 2010, and is now used by professional road cycling teams, triathletes, and amateur cyclists (www.power2max.de (accessed on 15 September 2022)). Nevertheless, two recent studies have questioned the interchangeability of the registry of different portable power meters in field conditions [3,5]. Consequently, Maier et al. [3] observed that the power output registered by different power meters is highly variable (even when they have been designed by the same manufacturer) and recommend further studies in field conditions with changes in ambient temperature, vibrations, or gear shifts. Shute et al. [6] observed that environmental temperature affected the registry of various power meters. Furthermore, Bouillod et al. [5] demonstrated that vibration and field conditions affect the power output measured.
This latter could condition the analysis and interpretation of both exercise intensity zones and power output profile of the cyclists [2,5,7], and their critical power [8,9]. These variables are widely used to quantify the competition load and to plan training [2]. However, to the best of our knowledge, no study has compared the influence of the power meter on these types of analysis during competition, possibly due to the mass added by each power meter or to the conflict of interest between sponsors (i.e., normally each cycling team uses only one power meter brand). Therefore, the main purpose of the present case study was to compare the interchangeability of the data obtained from two power meters (Power2Max vs. PowerTap) during road cycling competition.

2. Materials and Methods

A national-level under-23 male competitive cyclist (age: 21 years, height: 1.74 m, body mass: 64 kg; VO2max: 74.0 mL·kg−1·min−1; maximal aerobic power: 406 W; cycling experience: 13 years; typical training volume: 15,000 km per year) voluntarily participated and signed a written consent. The study was approved by the University Ethics Committee and met the requirements of the Declaration of Helsinki for research on human beings.

2.1. Procedures

The cyclist completed six road-cycling official competitions (five road races and one individual time-trial) of the elite under-23 regional and national calendar, between March and May of the same year (Table 1). During all of them, power output was simultaneously registered with two power meters (i.e., PowerTap and Power2Max) installed on the same road-racing bicycle (Scott Addict 30, Givisiez, Switzerland). The Power2Max meter, which registers power thanks to four strain gauges that measure torque and a cadence sensor (Power2Max Type S, Waldhufen, Germany), was fitted in the crankset and synchronized with a power control (Garmin Edge 705, Lenexa, KA, USA). On the other hand, the PowerTap meter registers power by using four strain gauges that measure torque and a speed sensor that measures the speed of the hub (PowerTap G3, Madison, WI, USA). This power meter was installed in the rear hub and synchronized with another power control (Garmin Edge 500, Lenexa, KA, USA). The two power controls were configured at 1 Hz sample frequency and installed on the handlebar stem. To avoid the influence of temperature on the calibration procedure [10], the bike remained for at least 30 min in the same ambient conditions in which the registry was obtained. Afterwards, the power meters were zeroed before performing each registry, according to the indications of the manufacturer, and a warm-up of 15 min at 150 W was standardized before starting the competition.
The six competitions were registered in both power meters from the beginning to the end of each stage. Power output measurements of both devices were analyzed with the same cycling performance software (Golden Cheetah 3.1, www.goldencheetah.org (accessed on 30 September 2022)). The identification of the exercise intensity zones and the power output profiles were obtained according to previous studies [11]. The first variable was the percentage of time with respect to the overall competition duration that the cyclist spent in each intensity zone (i.e., eleven intensities from <0.75 to >7.50 W·kg−1, with increments of 0.75 W·kg−1 between them). The second variable was the highest mean power that the cyclist held for a given period (i.e., twelve periods from 1 s to 60 min). Additionally, critical power, which was defined as the power asymptote of the hyperbolic relationship between power output and time to exhaustion [9], was also obtained from the power output profile, as previous studies did [6]. Finally, Normalized power, defined as the power output the cyclist could sustain if intensity were maintained constant without any variability [12].

2.2. Statistical Analysis
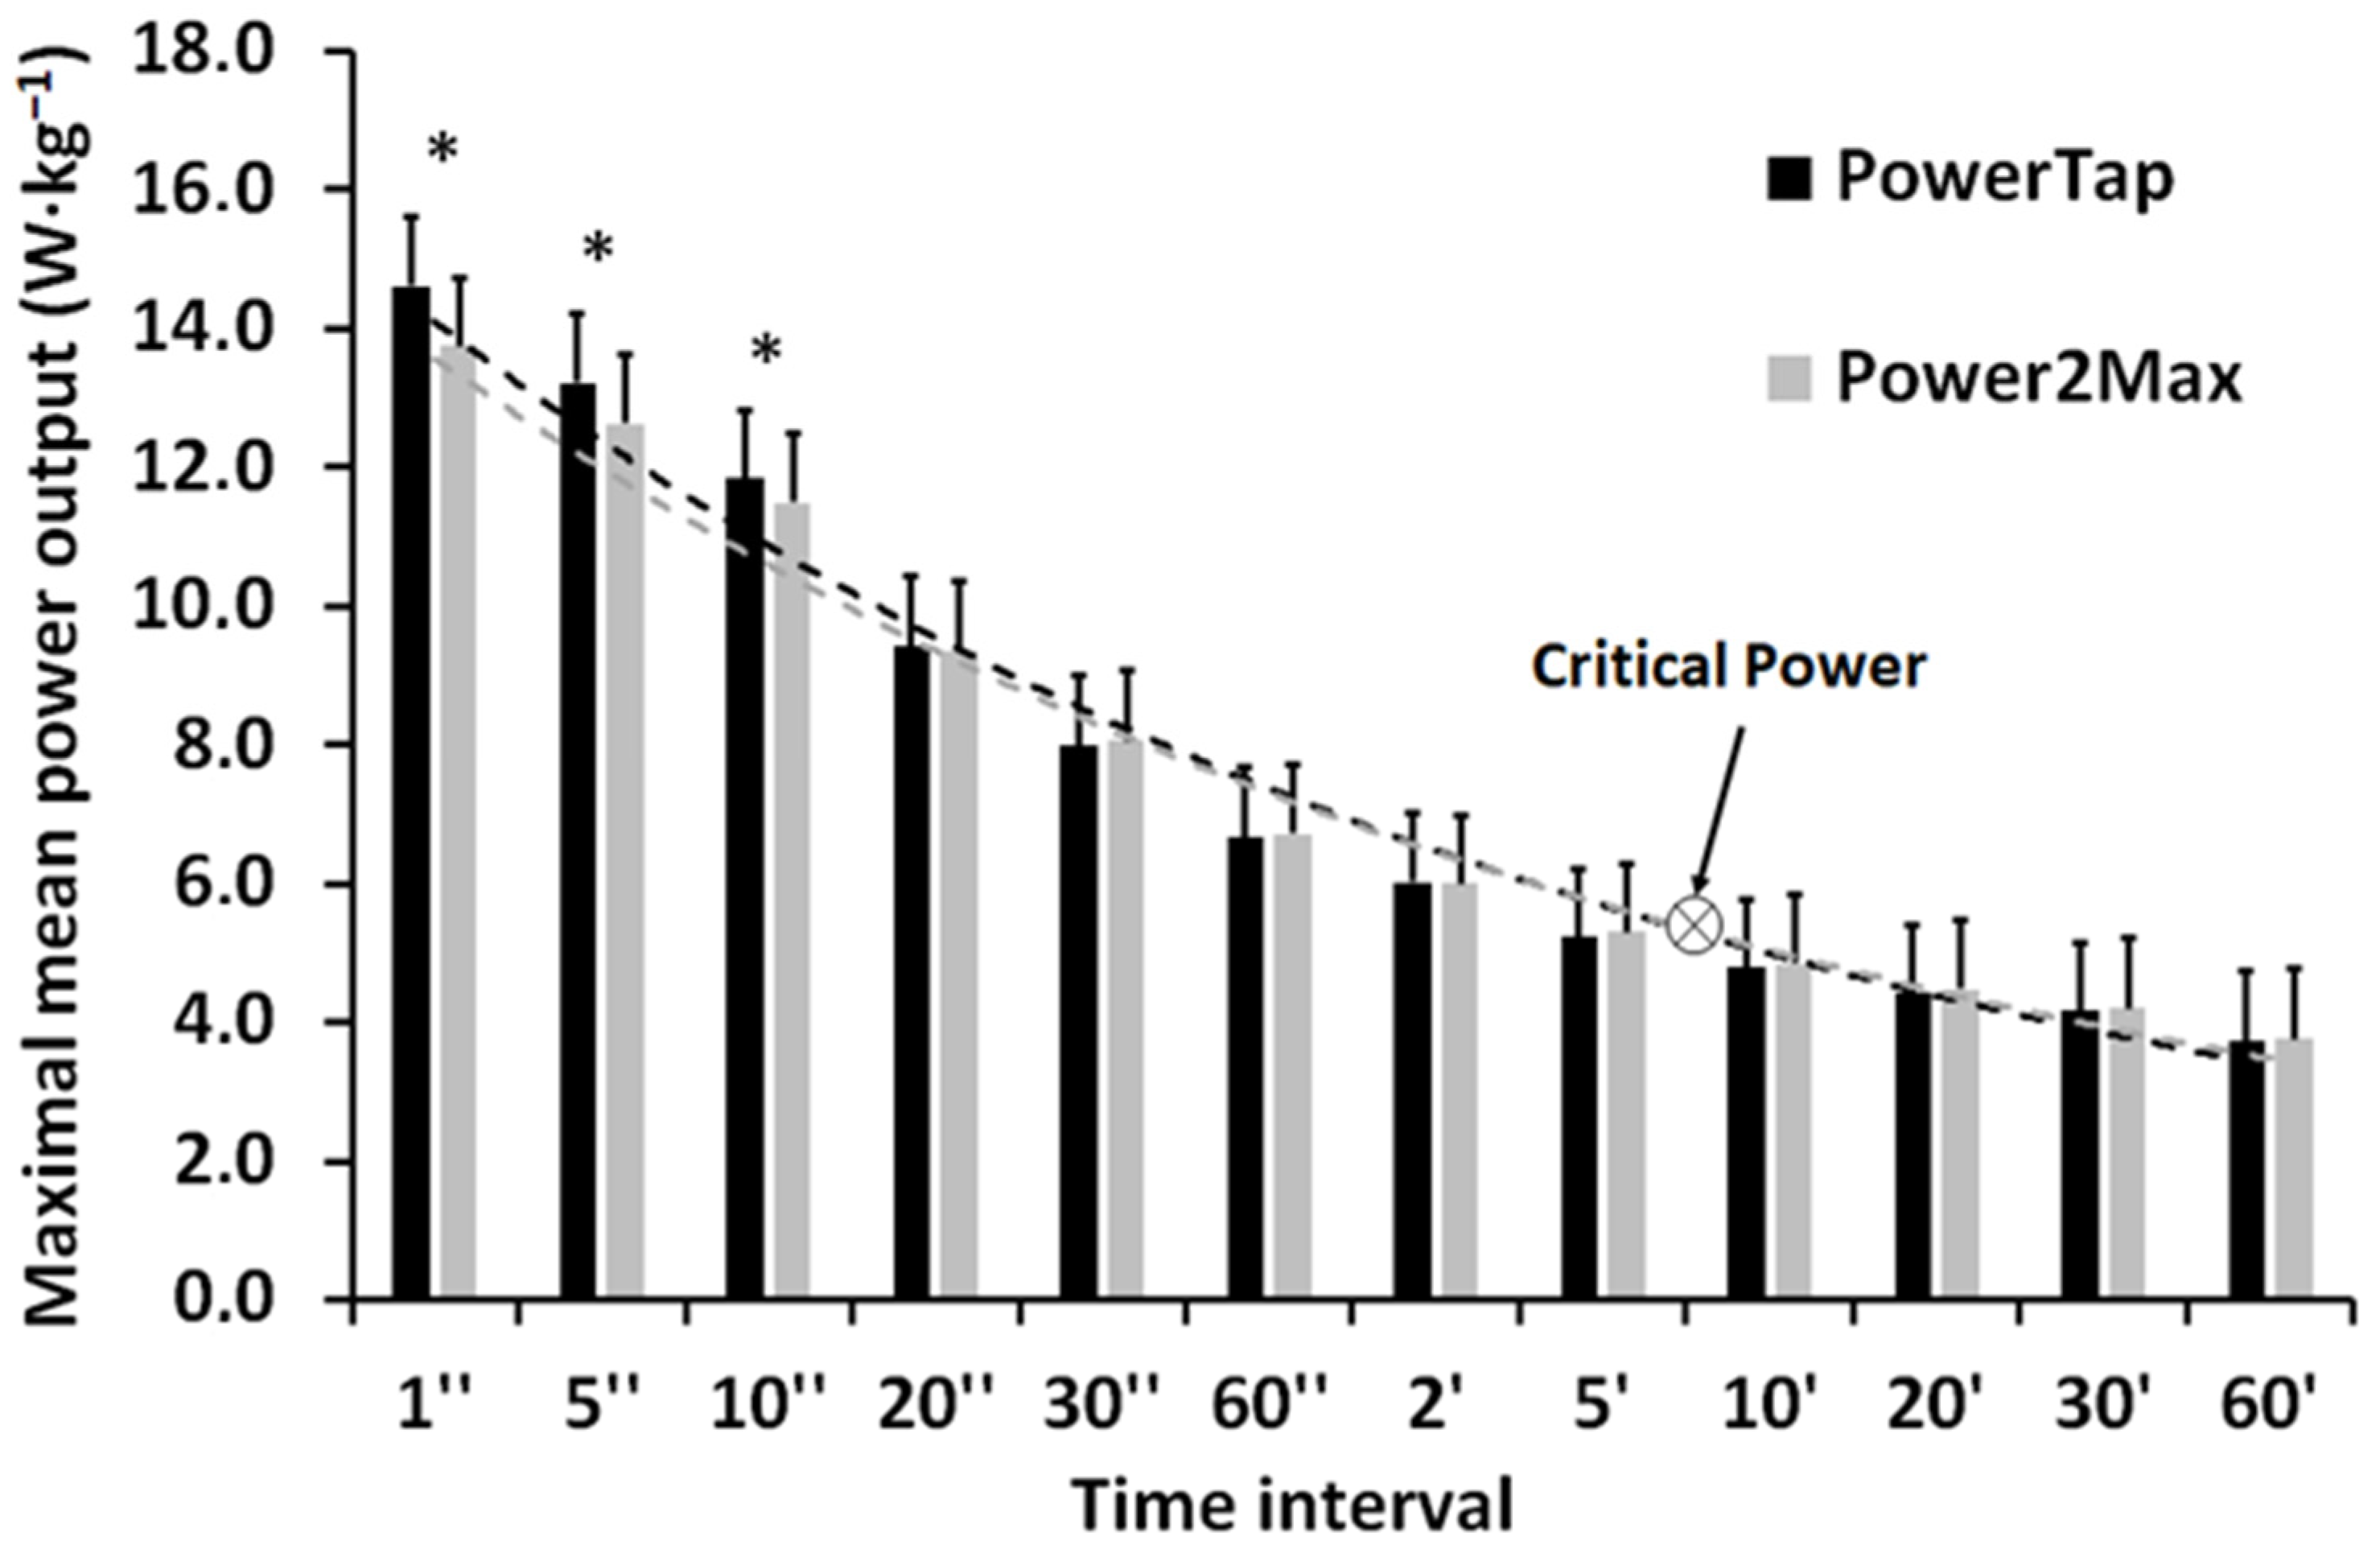
The results are expressed as mean ± SD. The SPSS+ version 20.0 statistical software was used (SPSS, Inc., Chicago, IL, USA). Spearman’s test was used to calculate the correlation coefficients between the two power meters, and the Wilcoxon signed-rank test to establish the statistical differences between means. Values of p < 0.05 were considered statistically significant.

3. Results

Table 1 shows the average power output, Normalized power and the cadence obtained in both power meters during the six competitions. The average power output (3.56 ± 0.68 and 3.62 ± 0.74 W·kg−1, p < 0.05), Normalized power (4.05 ± 0.45 and 4.11 ± 0.50 W·kg−1, p < 0.05), and cadence (95.7 ± 4.1 and 98.3 ± 3.5 rpm, p < 0.05) were lower in the PowerTap power meter than in the Power2Max power meter (ranges of the differences between 0.00–0.17 W·kg−1, 0.01–0.17 W·kg−1, and 2–4 rpm, respectively).
Figure 1 shows that the percentage of time at the different intensity zones was very similar between the PowerTap and the Power2Max power meters. Small differences were found at three intensity zones (PowerTap power meter values were higher at <0.75 and >7.50 W·kg−1, and Power2Max power meter values were higher at 5.26–6.00 W·kg−1). The spearman correlation test showed positive strong correlations between the two power meters in all zones during the six competitions (r = 0.986, p < 0.001).
Figure 2 shows that the power profile registered by the PowerTap meter was significantly higher (p < 0.05) than in Power2Max meter at the time intervals of 1, 5, and 10 s (6.6, 4.9, and 2.8%, respectively), without differences in the rest of the intervals (between −1.0 and 1.3%). The Spearman correlation test showed positive correlations between the two power meters in all the intervals during the six competitions (r = 0.998, p < 0.001). The critical power obtained from both devices was very similar (5.06 and 5.11 W·kg−1, respectively).

4. Discussion

The main finding of this study was that the power output data for the PowerTap and Power2Max power meters were interchangeable when they were registered during road-cycling competitions. Values for average power and Normalized power (Table 1), time in power zones (Figure 1), power profile, and critical power (Figure 2) were very similar when comparing both power meters, with very high correlations between the two. However, the Power2Max power meter slightly overestimated average, Normalized, and critical power, and underestimated the pedaling power output during short and high-intensity intervals (i.e., 1–10 s and >7.50 W·kg−1). This is very important when analyzing efforts during training and competition, so future studies need to make an in-depth evaluation of it.
The small differences in both average and critical power (1–2%) could be explained by the location of the power meters (i.e., chainring vs. rear hub), because this power was dissipated in the deformation of the bike and chain friction, as previously stated by other authors [13,14]. They were similar to those described in studies that compared SRM and PowerTap meters [15], as well as to those observed on the development of a mathematical model of road cycling power [14]. Nevertheless, the differences at high pedaling power (2.8–6.6%), the highest cadence registered by the Power2Max power meter (1–4%, Table 1) and the possible influence of the weather (i.e., the average power was similar in two cloudy and/or rainy days, Table 1) justify the need for a study on the Power2Max meter’s validity, as previous studies about PowerTap and SRM power meters did [10,15]. In contrast, the Power2Max power meter could be used in studies where submaximal or incremental pedaling exercises are performed [16], considering its slight 1–2% overestimation of mean power output when compared to other cycle-ergometers [17,18,19].
According to Bertucci et al. [15], the PowerTap power meter slightly underestimates the pedaling power at high intensities with respect to the SRM meter, which should be added to the Power2Max power meter’s underestimation with respect to the PowerTap power meter found in the present study. During road cycling competition, power output values of ≥10 W·kg−1 have been registered during ≤30 s intervals for male professional cyclists [20,21,22]. Furthermore, it was demonstrated that the ability to repeat these high-intensity efforts was the difference between elite and non-elite male and female cyclists [7,22,23]. Therefore, it is very important to take into account the type of power meter for the registry and analysis of these efforts [24].
The main limitation of the present study was the participation of only one cyclist instead of several. As commented previously, this design was selected due to the difficulty of using two power meters during competition (i.e., mass added to the bike and conflict of interest between sponsors) and was similar to that used in previous studies on this subject [5,15].

5. Conclusions

The results from this case study suggest that the data for average power, time in power zones, power profile and critical power obtained from the Power Tap and Power2Max power meters during road cycling competitions might be interchangeable. Nevertheless, during short and high-intensity effort (≤10.0 s and >7.50 W·kg−1), the Power2Max power meter underestimates the pedaling power (2.8–6.6%). Therefore, this last registry should be treated with caution. However, further studies with a larger number of participants should confirm these findings.

Author Contributions

Conceptualization, J.G.-L. and J.I.-P.; methodology, J.I.-P.; formal analysis, J.G.-L.; investigation, J.I.-P.; writing—original draft preparation, J.G.-L. and J.I.-P.; writing—review and editing, A.H.-M. and J.F.-F.; visualization, A.H.-M.; supervision, J.G.-L. and J.F.-F.; project administration, J.G.-L. and J.F.-F. All authors have read and agreed to the published version of the manuscript.

Funding

This research received no external funding.

Institutional Review Board Statement

The study was conducted in accordance with the Declaration of Helsinki and approved by the Ethics Committee of University of Leon (protocol code 017-2018, date of approval 21 May 2018).

Informed Consent Statement

Informed consent was obtained from the subject involved in the study.

Data Availability Statement

Data are contained within the article.

Conflicts of Interest

The authors declare no conflict of interest.

References

  1. Allen, H.; Coggan, A. Training and Racing with a Power Meter; Velopress: Boulder, CO, USA, 2010. [Google Scholar]
  2. Leo, P.; Spragg, J.; Podlogar, T.; Lawley, J.S.; Mujika, I. Power profiling and the power-duration relationship in cycling: A narrative review. Eur. J. Appl. Physiol 2021, 122, 301–316. [Google Scholar] [CrossRef] [PubMed]
  3. Maier, T.; Schmid, L.; Müller, B.; Steiner, T.; Wehrlin, J.P. Accuracy of cycling power meters against a mathematical model of treadmill cycling. Int. J. Sport. Med. 2017, 38, 456–461. [Google Scholar] [CrossRef] [PubMed] [Green Version]
  4. Hurst, H.T.; Atkins, S.; Sinclair, J.; Metcalfe, J. Agreement between the Stages cycling and SRM powermeter systems during field-based off-road climbing. J. Sci. Cycl. 2015, 4, 21–27. [Google Scholar]
  5. Bouillod, A.; Pinot, J.; Soto-Romero, G.; Bertucci, W.; Grappe, F. Validity, sensitivity, reproducibility and robustness of the Powertap, Stages and Garmin Vector power meters in comparison with the SRM device. Int. J. Sport. Physiol. Perform. 2016, 12, 1023–1030. [Google Scholar] [CrossRef] [PubMed]
  6. Shute, R.; Zak, R.; Slivka, D. Validity and reproducibility of commercial cycling power meters in hot and cold environmental temperatures. J. Sci. Cycl. 2019, 8, 32–39. [Google Scholar] [CrossRef]
  7. Menaspà, P.; Sias, M.; Bates, G.; La Torre, A. Demands of world cup competitions in elite women’s road cycling. Int. J. Sport. Physiol. Perform. 2017, 12, 1293–1296. [Google Scholar] [CrossRef]
  8. Quod, M.J.; Martin, D.T.; Martin, J.C.; Laursen, P.B. The power profile predicts road cycling MMP. Int. J. Sport. Med. 2010, 31, 397–401. [Google Scholar] [CrossRef]
  9. Vanhatalo, A.; Jones, A.M.; Burnley, M. Application of critical power in sport. Int. J. Sport. Physiol. Perform. 2011, 6, 128–136. [Google Scholar] [CrossRef] [Green Version]
  10. Gardner, A.S.; Stephens, S.; Martin, D.T.; Lawton, E.; Lee, H.; Jenkins, D. Accuracy of SRM and Powertap power monitoring systems for bicycling. Med. Sci. Sport. Exerc. 2004, 36, 1252–1258. [Google Scholar] [CrossRef] [Green Version]
  11. Sanders, D.; van Erp, T.; de Koning, J.J. Intensity and load characteristics of professional road cycling: Differences between men’s and women’s races. Int. J. Sport. Physiol. Perform. 2019, 14, 296–302. [Google Scholar] [CrossRef]
  12. Etxebarria, N.; D’Auria, S.; Anson, J.M.; Pyne, D.B.; Ferguson, R.A. Variability in power output during cycling in international Olympic-distance triathlon. Int. J. Sport. Physiol. Perform. 2014, 9, 732–734. [Google Scholar] [CrossRef] [PubMed]
  13. Kyle, C.R. Chain friction, windy hills and other quick calculations. Cycling Sci. 1990, 2, 23–26. [Google Scholar]
  14. Martin, J.C.; Milliken, D.L.; Cobb, J.E.; McFadden, K.L.; Coggan, A.R. Validation of a mathematical model for road cycling power. J. Appl. Biomech. 1998, 14, 276–291. [Google Scholar] [CrossRef] [PubMed] [Green Version]
  15. Bertucci, W.; Duc, S.; Villerius, V.; Pernin, J.N.; Grappe, F. Validity and reliability of the PowerTap mobile cycling powermeter when compared with the SRM device. Int. J. Sport. Med. 2005, 26, 868–873. [Google Scholar] [CrossRef] [Green Version]
  16. Knechtle, B.; Rosemann, T.; Nikolaidis, P.T. Self-Selected Pacing during a 24 h Track Cycling World Record. Int. J. Environ. Res. Public Health 2019, 16, 2943. [Google Scholar] [CrossRef] [Green Version]
  17. Kuo, Y.H.; Cheng, C.F.; Kuo, Y.C. Determining validity of critical power estimated using a three-minute all-out test in hot environments. Int. J. Environ. Res. Public Health 2021, 18, 9193. [Google Scholar] [CrossRef]
  18. Moral-González, S.; González-Sánchez, J.; Valenzuela, P.L.; García-Merino, S.; Barbado, C.; Lucia, A.; Foster, C.; Barranco-Gil, D. Time to exhaustion at the respiratory compensation point in recreational cyclists. Int. J. Environ. Res. Public Health 2020, 17, 6352. [Google Scholar] [CrossRef] [PubMed]
  19. Alvero-Cruz, J.R.; García Romero, J.C.; Ordonez, F.J.; Mongin, D.; Correas-Gómez, L.; Nikolaidis, P.T.; Knechtle, B. Age and Training-Related Changes on Body Composition and Fitness in Male Amateur Cyclists. Int. J. Environ. Res. Public Health 2021, 19, 93. [Google Scholar] [CrossRef]
  20. Vogt, S.; Schumacher, Y.O.; Roecker, K.; Dickhuth, H.-H.; Schoberer, U.; Schmid, A.; Heinrich, L. Power output during the Tour de France. Int. J. Sport. Med. 2007, 28, 756–761. [Google Scholar] [CrossRef]
  21. Sanders, D.; van Erp, T. The physical demands and power profile of professional men’s cycling races: An updated review. Int. J. Sport. Physiol. Perform. 2020, 16, 3–12. [Google Scholar] [CrossRef]
  22. Van Erp, T.; Sanders, D. Demands of professional cycling races: Influence of race category and result. Eur. J. Sport. Sci. 2021, 21, 666–677. [Google Scholar] [CrossRef] [PubMed]
  23. Van Erp, T.; Lamberts, R.P. Performance Characteristics of TOP5 Versus NOT-TOP5 Races in Female Professional Cycling. Int. J. Sport. Physiol. Perform. 2022, 17, 1070–1076. [Google Scholar] [CrossRef] [PubMed]
  24. Danek, N.; Smolarek, M.; Michalik, K.; Zatoń, M. Comparison of acute responses to two different cycling sprint interval exercise protocols with different recovery durations. Int. J. Environ. Res. Public Health 2020, 17, 1026. [Google Scholar] [CrossRef] [PubMed]
Figure 1. Mean ± SD of the time spent in each exercise intensity zone during the six official cycling competitions registered by the PowerTap and Power2Max power meters. * = significant differences (p < 0.05) between both power meters.
Ijerph 19 16446 g001
Figure 2. Mean ± SD of the maximal mean power output registered by the PowerTap and Power2Max power meters in each time interval during the six official cycling competitions. Critical power obtained from the PowerTap (dashed black line) and Power2Max registry (dashed grey line). * = significant differences (p < 0.05) between both power meters.
Ijerph 19 16446 g002
Table 1. Characteristics of the six official cycling competitions, average power output and cadence obtained by both the PowerTap and Power2Max power meters.
CompetitionDistance (km)Duration (hh:mm:ss)Elevation gain (m)Temperature
(°C)
WeatherAverage Power (W·kg−1)Normalized Power (W·kg−1)Average
Cadence (rpm)
PTP2MPTP2MPTP2M
RR 1114.502:58:44114518.8Cloudy3.183.183.723.759396
RR 29002:03:1587726Sunny3.363.424.004.0897101
RR 312502:57:28109615.4Cloudy3.403.483.984.089698
RR 415403:31:3666825.4Sunny3.103.153.733.779296
RR 5134.503:38:4485515.1Cloudy and rainy3.363.363.923.919395
ITT 121.500:31:0315226Sunny4.935.104.925.09103104
RR = Road Race; ITT = Individual Time Trial; PT = Powertap; P2M = Power2Max.
Publisher’s Note: MDPI stays neutral with regard to jurisdictional claims in published maps and institutional affiliations.

