
Physical Performance of Brazilian Military Policemen: A Longitudinal Analysis by Occupational Specialties

 , , ,
, , ,  and
and
Abstract
:1. Introduction
2. Materials and Methods
2.1. Participants
2.2. Procedures
2.3. Physical Fitness Assessment
- Pull-ups (exercises on the bar): The MPs started from the initial position with the grip in pronation and arms outstretched. The complete execution of the exercise began with the grip of the hands on the bar, with the performer keeping their arms and legs fully extended and performing flexion of the arms until passing their chin line over the bar and returning to the starting position. The position of the legs is free, and the height of the bar is adjusted according to the candidate’s height so that the candidate does not touch the ground when their arms are extended above their body. The highest number of repetitions was performed, in an uninterrupted manner, until fatigue or failure to perform the technique correctly. An official inspector accompanied the test to carry out the count [15].
- Push-ups: The MPS started from the position with the body extended horizontally on the ground with arms extended perpendicular to the shoulders and hands flat on the ground. Flexion of the arms was performed to form a ninety-degree angle so that the elbow was aligned with the back. One repetition was counted starting from the extended arms position, executing the arm flexion movement, and returning to the initial position. The highest number of repetitions was counted uninterruptedly until fatigue or failure to perform the technique correctly. An inspector accompanied the test to carry out the count [15].
- Sit-ups: The MPs started from the initial position lying in dorsal decubitus (back on the floor), arms crossed on the chest, hands resting on the shoulders, knees bent, feet resting on the floor and fixed to a support point) which could be a bar, or even the official inspector or someone else, heels close to the buttocks. They performed abdominal flexion, removing their shoulder blades from the ground, until the elbows made contact with the knees or quadriceps, then returned to the initial position until they touched the ground with the upper half of the shoulder blade, performing the highest number of repetitions uninterruptedly in the exercise until fatigue or failure to perform the technique correctly. An official inspector accompanied the test to carry out the count [15].
- The 12 min run: On an official athletics track of 400 m (one lap), identification cones were placed every 50 m. The test lasted 12 uninterrupted minutes; at 11 min a whistle was blown to warn the MPs about the time, and at 12 min the final whistle was blown, at which time the police officers immediately stopped running. The distance covered was measured in meters. The time was monitored using a stopwatch device. All tests were accompanied by an official inspector (PMMS, 2018). To calculate the VO2max, the following formula by Cooper [14] was used: VO2max (mL/kg/min) = Distance covered (meters)—504/45.
2.4. Statistical Analysis
3. Results
4. Discussion
Limitations and Future Perspectives
5. Conclusions
Author Contributions
Funding
Institutional Review Board Statement
Informed Consent Statement
Data Availability Statement
Acknowledgments
Conflicts of Interest
References
- Cerqueira, D.; Renato, S.L.; Bueno, S.; Neme, C.; Ferreira, H.; Coelho, D.; Alves, P.P.; Pinheiro, M.; Astolfi, R.; Marques, D.; et al. Atlas da Violência IPEA-Fórum Brasileiro de Segurança Pública: 2018. Available online: https://www.ipea.gov.br/atlasviolencia/arquivos/artigos/1375-atlasdaviolencia2021completo.pdf (accessed on 4 October 2021).
- Losty, C.; Williams, E.; Gossman, P. Police officer physical fitness to work: A case for health and fitness training. J. Hum. Sport Exerc. 2017, 11, 455–467. [Google Scholar] [CrossRef] [Green Version]
- Lockie, R.G.; Dawes, J.J.; Kornhauser, C.L.; Holmes, R.J. Cross-Sectional and Retrospective Cohort Analysis of the Effects of Age on Flexibility, Strength Endurance, Lower-Body Power, and Aerobic Fitness in Law Enforcement Officers. J. Strength Cond. Res. 2019, 33, 451–458. [Google Scholar] [CrossRef] [PubMed]
- Marins, E.F.; Andrade, L.S.; Peixoto, M.B.; Da Silva, M.C. Frequência de sintomas musculoesqueléticos entre policiais: Revisão sistemática. Braz. J. Pain 2020, 3, 164–169. [Google Scholar] [CrossRef]
- Violanti, J.M.; Charles, L.E.; McCanlies, E.; Hartley, T.A.; Baughman, P.; Andrew, M.E.; Fekedulegn, D.; Ma, C.C.; Mnatsakanova, A.; Burchfiel, C.M. Police stressors and health: A state-of-the-art review. Police Int. J. Police Strat. Manag. 2017, 40, 642–656. [Google Scholar] [CrossRef]
- Mackey, C.S.; DeFreitas, J.M. A longitudinal analysis of the U.S. Air Force reserve officers’ training corps physical fitness assessment. Mil. Med Res. 2019, 6, 30. [Google Scholar] [CrossRef]
- Pereira, E.F.; Teixeira, C.S. Proposta de valores normativos para avaliação da aptidão física em militares da Aeronáutica. Rev. Bras. Educ. Física E Esporte 2006, 20, 249–256. [Google Scholar] [CrossRef]
- Lagestad, P.; Jenssen, O.R.; Dillern, T. Changes in Police Officers’ Physical Performance after 16 Years of Work. Int. J. Police Sci. Manag. 2014, 16, 308–317. [Google Scholar] [CrossRef]
- McGill, S.; Frost, D.; Lam, T.; Finlay, T.; Darby, K.; Cannon, J. Can fitness and movement quality prevent back injury in elite task force police officers? A 5-year longitudinal study. Ergonomics 2015, 58, 1682–1689. [Google Scholar] [CrossRef]
- Orr, R.; Dawes, J.; Pope, R.; Terry, J. Assessing Differences in Anthropometric and Fitness Characteristics Between Police Academy Cadets and Incumbent Officers. J. Strength Cond. Res. 2018, 32, 2632–2641. [Google Scholar] [CrossRef] [PubMed] [Green Version]
- Kukić, F.; Heinrich, K.M.; Koropanovski, N.; Poston, W.S.C.; Čvorović, A.; Dawes, J.J.; Orr, R.; Dopsaj, M. Differences in Body Composition across Police Occupations and Moderation Effects of Leisure Time Physical Activity. Int. J. Environ. Res. Public Health 2020, 17, 6825. [Google Scholar] [CrossRef]
- Senado Federal. Constituição Da República Federativa Do Brasil; Centro Grafico do Senado Federal: Brasilia, Brazil, 1988. [Google Scholar]
- Mato Grosso Do Sul. Constituição Do Estado De Mato Grosso Do Sul (1989), Capítulo III, Da Segurança Pública. 1989. Available online: http://aacpdappls.net.ms.gov.br/appls/legislacao/secoge/govato.nsf/0a67c456bc566b8a04257e590063f1fd/dfde24a4767ddcbf04257e4b006c0233?OpenDocument (accessed on 8 July 2022).
- Cooper, K.H. O Programa Aeróbio Para O Bem Estar Total; Nórdica: Rio de Janeiro, Brazil, 1982. [Google Scholar]
- Polícia Militar Do Estado De Mato Grosso Do Sul (PMMS). Portaria N°042/PM-1/EMG/2018, de 20 de agosto de 2018 Boletim do Comando Geral Nº 156 de 21 de agosto de 2018. Available online: http://portal.ciops.ms.gov.br/portal/images/_ciops_documentos/BCG-PM-2018-08-21-156_Supl-1-Portaria-042-PM1-TAF.pdf (accessed on 7 June 2022).
- Berria, J.; Daronco, L.S.E.; Bevilacqua, L.A. Aptidão motora e capacidade para o trabalho de policiais militares do batalhão de operações especiais. Salusvita 2011, 31, 89–104. Available online: https://secure.unisagrado.edu.br/static/biblioteca/salusvita/salusvita_v30_n2_2011_art_02.pdf (accessed on 15 June 2022).
- Muniz, M.R.; Ferreira, L.F.; Calvo, A.P.; Ferraciolli, M.C. Estigmas do destreinamento físico. Rev. Digit. Buenos Aires 2011, 16, 1. Available online: https://efdeportes.com/efd162/estigmas-do-destreinamento-fisico.htm (accessed on 20 July 2012).
- Freitas, A.V.; Prado, R.L.; Silva, R.J.S. Associação entre o percentual de gordura e o VO2máximo na estimativa de fatores de riscos relacionados à saúde em policiais militares do município de Aracaju-SE. Rev. Bras. Prescrição E Fisiol. Exerc. 2007, 1, 87–95. Available online: http://www.rbpfex.com.br/index.php/rbpfex/article/view/9/9 (accessed on 8 July 2022).
- De Oliveira, M.L.C. Condições de Saúde Física dos Policiais Militares do Serviço Operacional da Região Metropolitana de Belém. 106f. Postgraduate Thesis, UFPA, Belém, Brasil, 2020. Available online: https://www.ppgsp.propesp.ufpa.br/ARQUIVOS/teses_e_dissertacoes/dissertacoes/2018/201807%20-%20OLIVEIRA.pdf (accessed on 15 July 2022).
- Rocha, P.C.; Goulart, G.A.; Ferreira, F.O.; Lima, M.M.; Amorim, F.; Peixoto, M.F. Relação entre o percentual de gordura e a capacidade aeróbia máxima em militares do 3º Batalhão da Polícia Militar de Minas Gerais da Cidade de Diamantina. Rev. Bras. Prescrição Fisiol. Exerc. 2011, 5, 453–459. Available online: http://www.rbpfex.com.br/index.php/rbpfex/article/view/365/349 (accessed on 25 June 2022).
- Da Silva, J.B.; Da Silva, C.D.O.; Pavan, M.M.S.; Lima, V.P. Índice de massa corporal e desempenho cardiorrespiratório em militares. Rev. Cuba. Med. Mil. 2017, 46, 1–8. Available online: https://www.medigraphic.com/pdfs/revcubmedmil/cmm-2016/cmm164f.pdf (accessed on 10 July 2022).
- Lockie, R.G.; Dawes, J.J.; Balfany, K.; Gonzales, C.E.; Beitzel, M.M.; Dulla, J.M.; Orr, R.M. Physical Fitness Characteristics That Relate to Work Sample Test Battery Performance in Law Enforcement Recruits. Int. J. Environ. Res. Public Health 2018, 15, 2477. [Google Scholar] [CrossRef] [Green Version]
- Lagestad, P.; Tillaar, R.V.D. Longitudinal Changes in the Physical Activity Patterns of Police Officers. Int. J. Police Sci. Manag. 2014, 16, 76–86. [Google Scholar] [CrossRef]
- Lockie, R.G.; Rodas, K.A.; Dawes, J.J.; Dulla, J.M.; Orr, R.M.; Moreno, M.R. How Does Time Spent Working in Custody Influence Health and Fitness Characteristics of Law Enforcement Officers? Int. J. Environ. Res. Public Health 2021, 18, 9297. [Google Scholar] [CrossRef]
- Matos, D.G.; Salgueiro, R.S.; Mazini Filho, M.L.; Rodrigues, B.M.; Aidar, F.J.; De Lima, J.R.P. Perfil evolutivo do condicionamento aeróbio e da força em policiais militares. Rev. Bras. Ciências Saúde 2010, 8, 14–20. [Google Scholar] [CrossRef]
- Boyce, R.W.; Jones, G.R.; Schendt, K.E.; Lloyd, C.L.; Boone, E.L. Longitudinal Changes in Strength of Police Officers with Gender Comparisons. J. Strength Cond. Res. 2009, 23, 2411–2418. [Google Scholar] [CrossRef] [PubMed]
- Teixeira, J.; Monteiro, L.F.; Silvestre, R.; Beckert, J.; Massuça, L.M. Age-related influence on physical fitness and individual on-duty task performance of Portuguese male non-elite police officers. Biol. Sport 2019, 36, 163–170. [Google Scholar] [CrossRef] [PubMed]
- Sörensen, L.; Smolander, J.; Louhevaara, V.; Korhonen, O.; Oja, P. Physical Activity, Fitness and Body Composition of Finnish Police Officers: A 15-year Follow-up Study. Occup. Med. 2000, 50, 3–10. [Google Scholar] [CrossRef] [Green Version]
- Dawes, J.J.; Orr, R.M.; Flores, R.R.; Lockie, R.G.; Kornhauser, C.; Holmes, R. A physical fitness profile of state highway patrol officers by gender and age. Ann. Occup. Environ. Med. 2017, 29, 16. [Google Scholar] [CrossRef] [PubMed]
- Silva, O.L.P.; De Lima, D.G.; Freitas, A.G.; Imada, K.S.; Pereira, R.S.; Silva, R.P.M. Fatores associados às doenças cardiovasculares em policiais militares de uma cidade na amazônia ocidental. S. Am. J. Basic Educ. Tech. Technol. 2018, 5, 78–91. Available online: https://periodicos.ufac.br/index.php/SAJEBTT/article/view/1661/1043 (accessed on 1 July 2022).
- Redkva, P.E.; Luz, R.; Vargas, L.M.; Ikaminagakura, E.; Gomes, E.B. influência da composição corporal no teste de cooper e testes motores realizados no NPOR do 13° BIB. Rev. Educ. Física 2010, 150, 34–40. [Google Scholar]
- Pícoli, T.D.S.; De Figueiredo, L.L.; Patrizzi, L.J. Sarcopenia e envelhecimento. Fisioter. Mov. 2011, 24, 455–462. [Google Scholar] [CrossRef]
- Rossi, E. Envelhecimento do sistema osteoarticular. Einstein 2008, 6, 7–12. Available online: http://apps.einstein.br/revista/arquivos/PDF/746-Einstein%20Suplemento%20v6n1%20pS7-12.pdf (accessed on 11 April 2022).
- Dawes, J.J.; Orr, R.B.; Conroy, R.; Pope, R. The effect of age on push-up performance amongst male law enforcement officers. Aust. Strength Cond. J. 2016, 24, 23–27. [Google Scholar]
- Pryor, R.R.; Colburn, D.; Crill, M.T.; Hostler, D.P.; Suyama, J. Fitness Characteristics of a Suburban Special Weapons and Tactics Team. J. Strength Cond. Res. 2012, 26, 752–757. [Google Scholar] [CrossRef]
- Tharkar, S.; Kumpatla, S.; Muthukumaran, P.; Viswanathan, V. High prevalence of metabolic syndrome and cardiovascular risk among police personnel compared to general population in India. J. Assoc. Physicians India 2008, 56, 845–849. [Google Scholar]
- Minayo, M.C.D.S.; Assis, S.; Oliveira, R.D.V.C.D. Impacto das atividades profissionais na saúde física e mental dos policiais civis e militares do Rio de Janeiro (RJ, Brasil). Ciênc. Saúde Colet. 2011, 16, 2199–2209. [Google Scholar] [CrossRef] [PubMed]
- Ferreira, D.K.D.S.; Bonfim, C.; Augusto, L.G.D.S. Fatores associados ao estilo de vida de policiais militares. Ciênc. Saúde Colet. 2011, 16, 3403–3412. [Google Scholar] [CrossRef] [PubMed]
- Marins, E.F.; Ferreira, R.W.; Del Vecchio, F.B. Cardiorespiratory and neuromuscular fitness of federal highway police officers. Rev. Bras. Med. Esporte 2018, 24, 426–431. [Google Scholar] [CrossRef]


| 2015 | 2016 | 2017 | 2018 | 2019 | |
|---|---|---|---|---|---|
| X ± SD | X ± SD | X ± SD | X ± SD | X ± SD | |
| 12-min run (m) | |||||
| Environmental (n = 113) | 2326.8 ± 211.4 | 2354.8± 251.9 | 2262.7 ± 276.1 | 2234.9 ± 296.9 | 2110.9 ± 270.4 |
| Specialized (n = 98) | 2599.6 ± 226.5 | 2568.6 ± 225.5 | 2558.2 ± 259.6 | 2486.3 ± 251.7 | 2463.3 ± 252.9 |
| Border (n = 52) | 2371.9 ± 283.1 | 2 339.3 ± 290.3 | 2272.7 ± 294.5 | 2206.5 ± 305.4 | 2217.5 ± 270.8 |
| Urban (n = 27) | 2475.2 ± 240.2 | 2537.0 ± 284.1 | 2485.2 ± 255.6 | 2573.3 ± 281.5 | 2538.9 ± 286.7 |
| VO2max (mL/kg/min) | |||||
| Environmental (n = 113) | 40.5 ± 4.7 | 41.1 ± 5.6 | 39.1 ± 6.1 | 38.5 ± 6.6 | 35.7 ± 6.0 |
| Specialized (n = 98) | 46.6 ± 5.0 | 45.9 ± 5.0 | 45.6 ± 5.8 | 44.1 ± 5.6 | 43.5 ± 5.6 |
| Border (n = 52) | 41.5 ± 6.3 | 40.8 ± 6.5 | 39.3 ± 6.5 | 37.8 ± 6.8 | 38.1 ± 6.0 |
| Urban (n = 27) | 43.8 ± 5.3 | 45.2 ± 6.3 | 44.0 ± 5.7 | 46.0 ± 6.3 | 45.2 ± 6.4 |
| Push-ups (maximum repetitions) | |||||
| Environmental (n = 82) | 23 ± 4 | 31 ± 8 | 22 ± 4 | 22 ± 4 | 18 ± 6 |
| Specialized (n = 10) | 33 ± 10 | 31 ± 9 | 28 ± 3 | 30 ± 11 | 24 ± 8 |
| Border (n = 31) | 23 ± 4 | 25 ± 6 | 24 ± 5 | 24 ± 5 | 24 ± 8 |
| Urban (n = 07) | 31 ± 8 | 31 ± 7 | 26 ± 3 | 30 ± 9 | 28 ± 7 |
| Pull-ups (maximum repetitions) | |||||
| Environmental (n = 06) | 8 ± 2 | 9 ± 2 | 8 ± 3 | 8 ± 3 | 8 ± 2 |
| Specialized (n = 64) | 11 ± 2 | 10 ± 2 | 10 ± 2 | 9 ± 3 | 8 ± 2 |
| Border (n = 11) | 9 ± 2 | 9 ± 2 | 8 ± 2 | 7 ± 2 | 7 ± 3 |
| Urban (n = 14) | 9 ± 2 | 9 ± 2 | 8 ± 3 | 9 ± 2 | 8 ± 3 |
| Sit-ups (maximum repetitions) | |||||
| Environmental (n = 89) | 42 ± 7 | 45 ± 9 | 43 ± 7 | 43 ± 9 | 32 ± 12 |
| Specialized (n = 97) | 56 ± 8 | 56 ± 9 | 53 ± 9 | 49 ± 7 | 45 ± 9 |
| Border (n = 39) | 44 ± 7 | 44 ± 7 | 44 ± 6 | 42 ± 8 | 37 ± 7 |
| Urban (n = 16) | 44 ± 11 | 47 ± 8 | 46 ± 6 | 51 ± 7 | 44 ± 5 |
| Estimated Coefficient | Standard Error | Degrees of Freedom | t-Value | p-Value | |
|---|---|---|---|---|---|
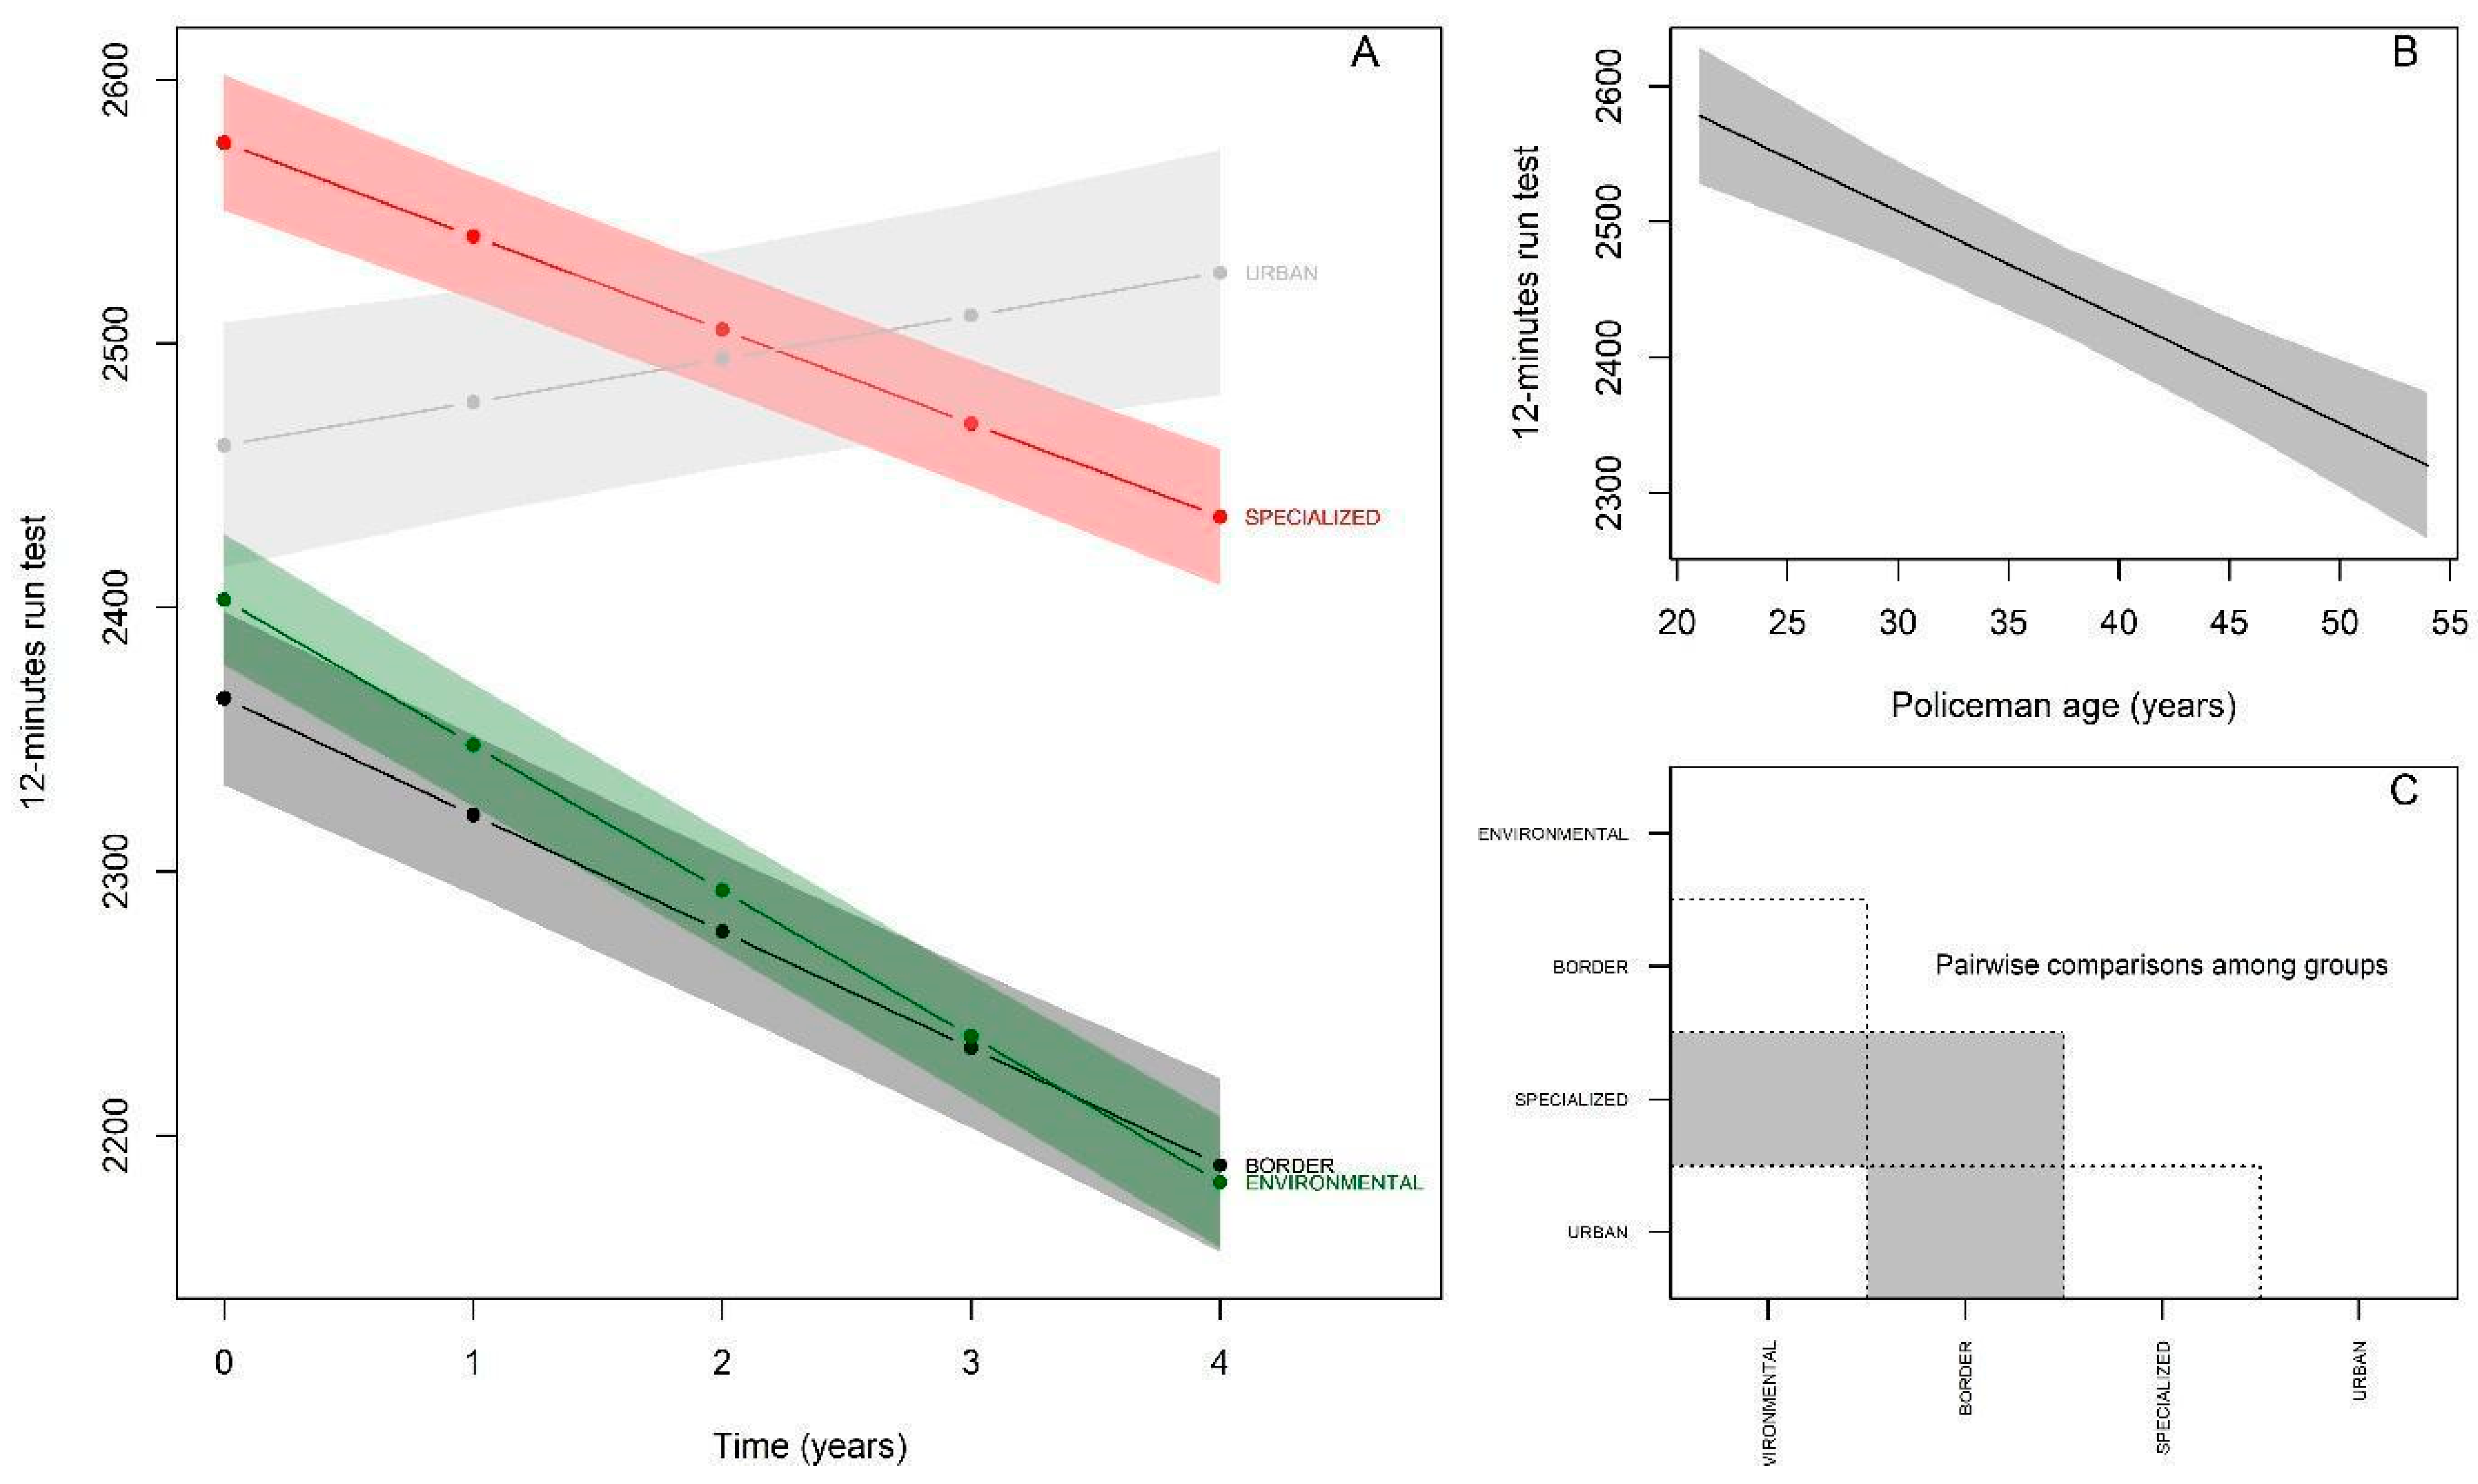
| Reference group (Environmental) | 2693.84 | 105.91 | 1156 | 25.43 | 0.00 |
| Specialized | 173.28 | 38.91 | 285 | 4.489 | 0.00 |
| Border | −37.47 | 41.58 | 285 | 0.90 | 0.36 |
| Urban | 58.57 | 54.45 | 285 | 1.07 | 0.28 |
| Time effect (follow-up) | −55.16 | 5.09 | 1156 | −10.83 | 0.00 |
| Age effect | −7.81 | 2.48 | 285 | −3.14 | 0.00 |
| Environmental vs. Specialized | 19.67 | 7.46 | 1156 | 2.63 | 0.00 |
| Environmental vs. Border | 10.99 | 9.06 | 1156 | 1.21 | 0.22 |
| Environmental vs. Urban | 71.53 | 11.59 | 1156 | 6.17 | 0.00 |
| Estimated Coefficient | Standard Error | Degrees of Freedom | t-Value | p-Value | |
|---|---|---|---|---|---|
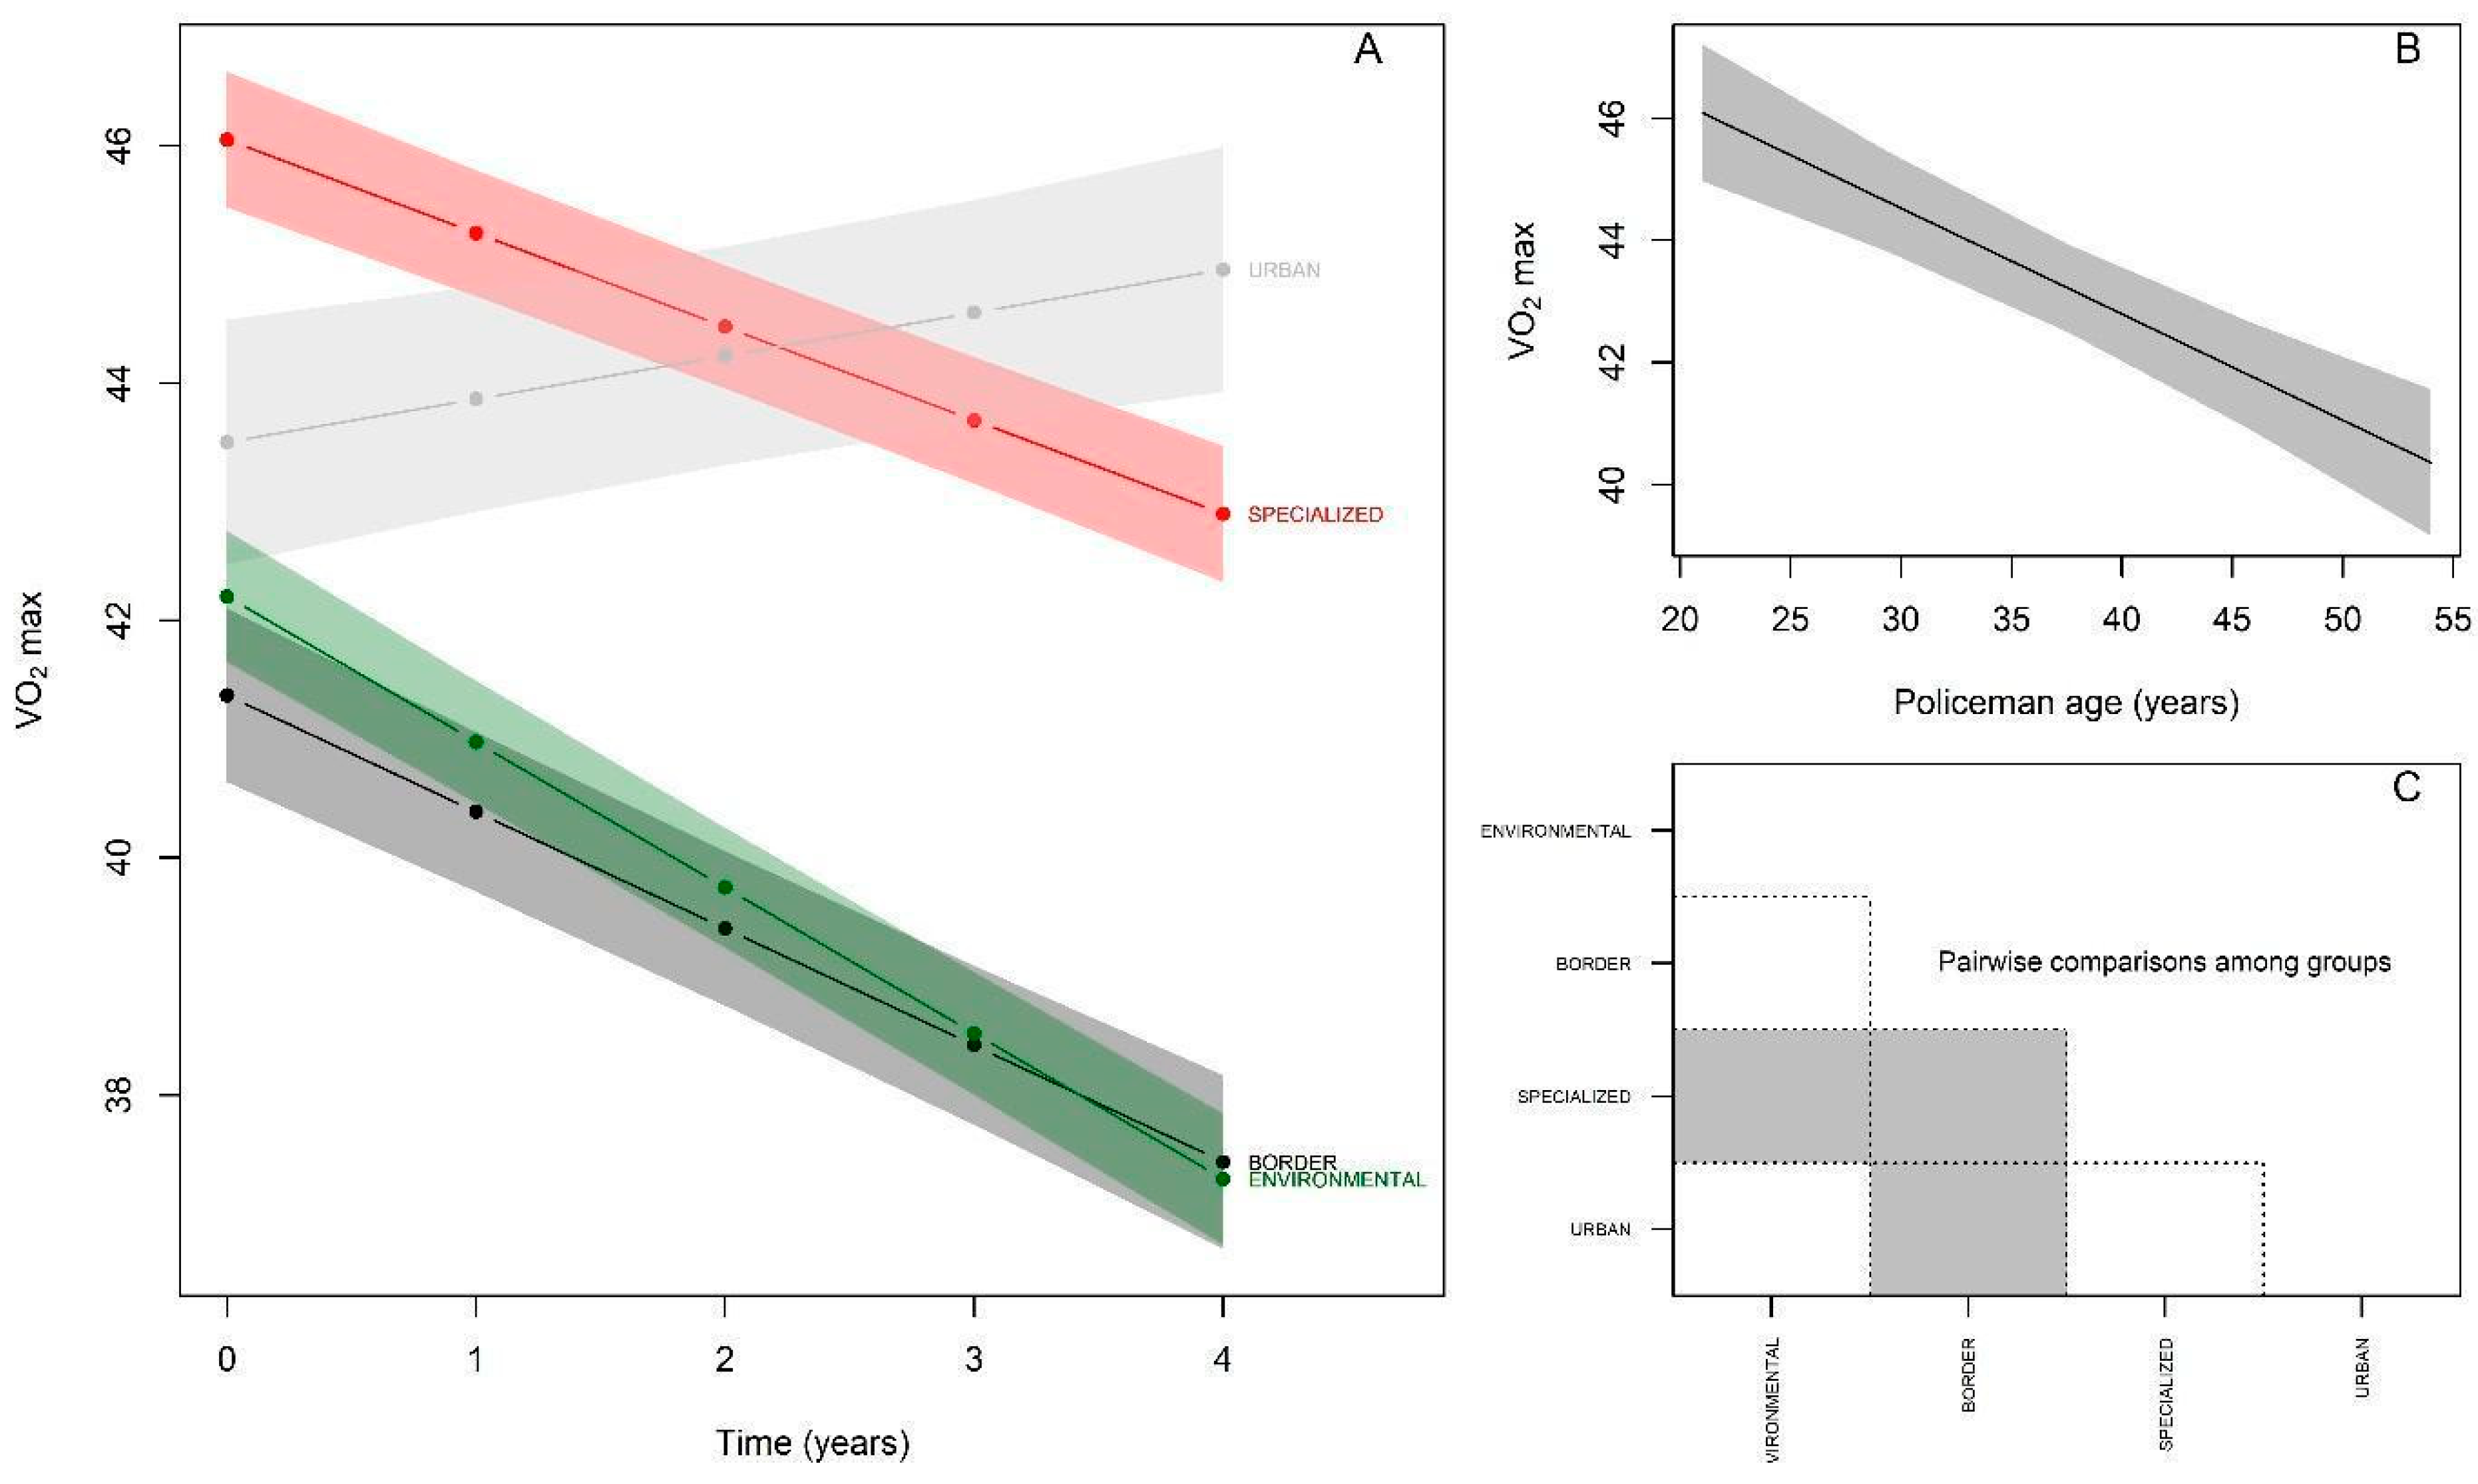
| Reference group (Environmental) | 48.66 | 2.35 | 1156 | 20.67 | 0.00 |
| Specialized | 3.85 | 0.85 | 285 | 4.49 | 0.00 |
| Border | −0.83 | 0.92 | 285 | −0.90 | 0.36 |
| Urban | 1.30 | 1.21 | 285 | 1.07 | 0.28 |
| Time effect (follow-up) | −1.22 | 0.11 | 1156 | −10.83 | 0.00 |
| Age effect | −0.17 | 0.05 | 285 | −3.14 | 0.00 |
| Environmental vs. Specialized | 0.43 | 0.16 | 1156 | 2.63 | 0.00 |
| Environmental vs. Border | 0.24 | 0.20 | 1156 | 1.21 | 0.22 |
| Environmental vs. Urban | 1.58 | 0.25 | 1156 | 6.17 | 0.00 |
| Estimated Coefficient | Standard Error | Degrees of Freedom | t-Value | p-Value | |
|---|---|---|---|---|---|
| Reference group (Environmental) | 36.24 | 3.36 | 516 | 10.75 | 0.00 |
| Specialized | 5.74 | 1.74 | 125 | 3.28 | 0.00 |
| Border | −2.01 | 1.07 | 125 | −1.86 | 0.06 |
| Urban | 3.82 | 1.99 | 125 | 1.91 | 0.05 |
| Time effect (follow-up) | −1.36 | 0.163 | 516 | −8.36 | 0.00 |
| Age effect | −0.26 | 0.07 | 125 | −3.37 | 0.00 |
| Environmental vs. Specialized | −0.54 | 0.49 | 516 | −1.09 | 0.27 |
| Environmental vs. Border | 1.51 | 0.31 | 516 | 4.85 | 0.00 |
| Environmental vs. Urban | 0.69 | 0.58 | 516 | 1.19 | 0.23 |
| Estimated Coefficient | Standard Error | Degrees of Freedom | t-Value | p-Value | |
|---|---|---|---|---|---|
| Reference group (Environmental) | 11.95 | 1.71 | 376 | 6.96 | 0.00 |
| Specialized | 2.63 | 0.84 | 90 | 3.10 | 0.00 |
| Border | 0.80 | 0.99 | 90 | 0.81 | 0.41 |
| Urban | 0.69 | 0.95 | 90 | 0.72 | 0.47 |
| Time effect (follow-up) | −0.20 | 0.20 | 376 | −0.95 | 0.33 |
| Age effect | −0.11 | 0.05 | 90 | −2.14 | 0.03 |
| Environmental vs. Specialized | −0.43 | 0.21 | 376 | −2.01 | 0.04 |
| Environmental vs. Border | −0.43 | 0.25 | 376 | −1.68 | 0.09 |
| Environmental vs. Urban | −0.15 | 0.24 | 376 | −0.62 | 0.52 |
| Estimated Coefficient | Standard Error | Degrees of Freedom | t-Value | p-Value | |
|---|---|---|---|---|---|
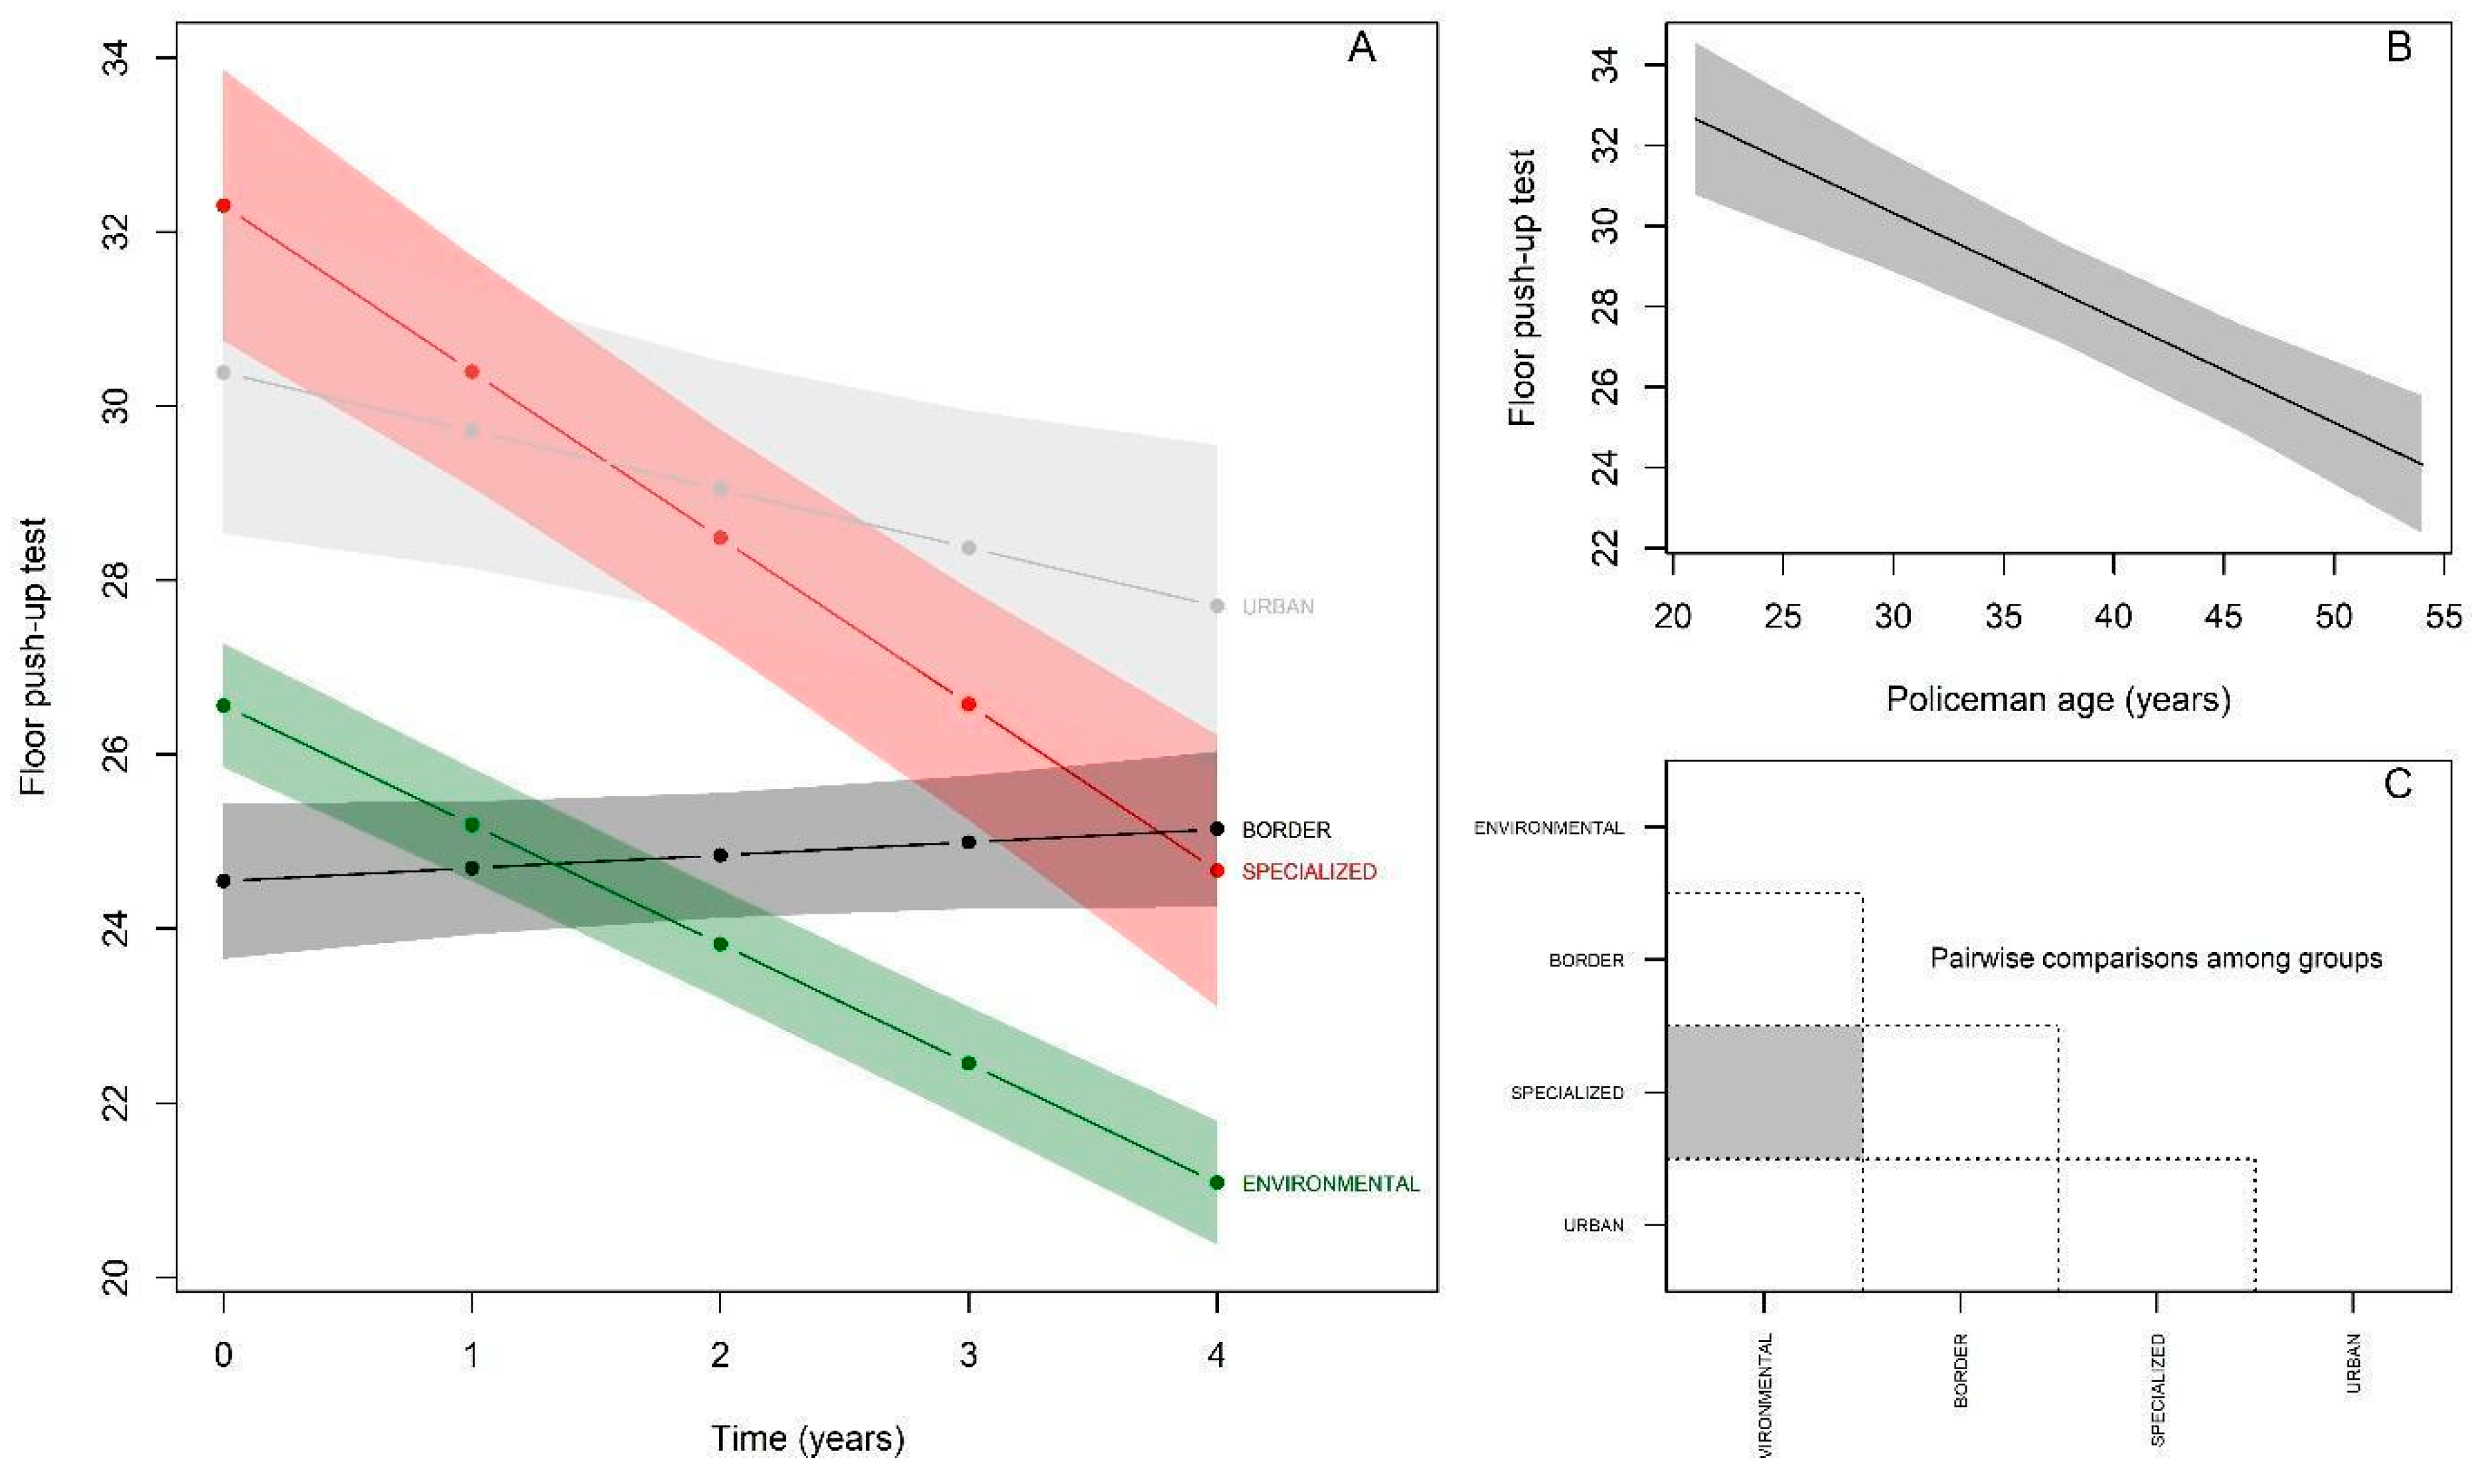
| Reference group (Environmental) | 68.44 | 2.98 | 960 | 22.95 | 0.00 |
| Specialized | 7.64 | 1.16 | 236 | 6.58 | 0.00 |
| Border | −2.06 | 1.36 | 236 | −1.51 | 0.13 |
| Urban | −4.00 | 1.95 | 236 | −2.04 | 0.04 |
| Time effect (follow-up) | −2.08 | 0.23 | 960 | −8.95 | 0.00 |
| Age effect | −0.56 | 0.06 | 236 | −8.06 | 0.00 |
| Environmental vs. Specialized | −0.65 | 0.32 | 960 | −2.03 | 0.04 |
| Environmental vs. Border | 0.53 | 0.42 | 960 | 1.26 | 0.20 |
| Environmental vs. Urban | 2.55 | 0.59 | 960 | 4.26 | 0.00 |
Publisher’s Note: MDPI stays neutral with regard to jurisdictional claims in published maps and institutional affiliations. |
© 2022 by the authors. Licensee MDPI, Basel, Switzerland. This article is an open access article distributed under the terms and conditions of the Creative Commons Attribution (CC BY) license (https://creativecommons.org/licenses/by/4.0/).
Share and Cite
Rezende, L.; Dellagrana, R.A.; Oliveira-Santos, L.G.R.; Cruz, A.D.F.C.; da Silva Mota, M.F.; Coelho-Ravagnani, C.F. Physical Performance of Brazilian Military Policemen: A Longitudinal Analysis by Occupational Specialties. Int. J. Environ. Res. Public Health 2022, 19, 16948. https://0-doi-org.brum.beds.ac.uk/10.3390/ijerph192416948
Rezende L, Dellagrana RA, Oliveira-Santos LGR, Cruz ADFC, da Silva Mota MF, Coelho-Ravagnani CF. Physical Performance of Brazilian Military Policemen: A Longitudinal Analysis by Occupational Specialties. International Journal of Environmental Research and Public Health. 2022; 19(24):16948. https://0-doi-org.brum.beds.ac.uk/10.3390/ijerph192416948
Chicago/Turabian StyleRezende, Luiz, Rodolfo A. Dellagrana, Luiz Gustavo Rodrigues Oliveira-Santos, Arthur Duarte Fantesia Costa Cruz, Maycon Felipe da Silva Mota, and Christianne F. Coelho-Ravagnani. 2022. "Physical Performance of Brazilian Military Policemen: A Longitudinal Analysis by Occupational Specialties" International Journal of Environmental Research and Public Health 19, no. 24: 16948. https://0-doi-org.brum.beds.ac.uk/10.3390/ijerph192416948