
Postural Control Differences between Patients with Posterior Tibial Tendon Dysfunction and Healthy People during Gait


Abstract
:1. Introduction
2. Methods
2.1. Participants
2.2. Experimental Procedures
2.3. Data Processing
2.4. Statistical Analyses
3. Results
4. Discussion
5. Conclusions
Author Contributions
Funding
Institutional Review Board Statement
Informed Consent Statement
Data Availability Statement
Conflicts of Interest
References
- Kohls-Gatzoulis, J.; Woods, B.; Angel, J.C.; Singh, D. The prevalence of symptomatic posterior tibialis tendon dysfunction in women over the age of 40 in England. Foot Ankle Surg. 2009, 15, 75–81. [Google Scholar] [CrossRef] [PubMed]
- Myerson, M.S. Adult acquired flatfoot deformity: Treatment of dysfunction of the posterior tibial tendon. Instr. Course Lect. 1997, 46, 393–405. [Google Scholar] [PubMed]
- Niki, H.; Ching, R.P.; Kiser, P.; Sangeorzan, B.J. The effect of posterior tibial tendon dysfunction on hindfoot kinematics. Foot Ankle Int. 2001, 22, 292–300. [Google Scholar] [CrossRef] [PubMed]
- Watanabe, K.; Kitaoka, H.B.; Fujii, T.; Crevoisier, X.; Berglund, L.J.; Zhao, K.D.; Kaufman, K.R.; An, K.N. Posterior tibial tendon dysfunction and flatfoot: Analysis with simulated walking. Gait Posture 2013, 37, 264–268. [Google Scholar] [CrossRef] [PubMed] [Green Version]
- Brodsky, J.W.; Charlick, D.A.; Coleman, S.C.; Pollo, F.E.; Royer, C.T. Hindfoot motion following reconstruction for posterior tibial tendon dysfunction. Foot Ankle Int. 2009, 30, 613–618. [Google Scholar] [CrossRef]
- Houck, J.R.; Neville, C.G.; Tome, J.; Flemister, A.S. Ankle and Foot Kinematics Associated with Stage II PTTD During Stance. Foot Ankle Int. 2009, 30, 530–539. [Google Scholar] [CrossRef] [Green Version]
- Neville, C.; Flemister, A.S.; Houck, J.R. Deep posterior compartment strength and foot kinematics in subjects with stage II posterior tibial tendon dysfunction. Foot Ankle Int. 2010, 31, 320–328. [Google Scholar] [CrossRef] [Green Version]
- Ness, M.E.; Long, J.; Marks, R.; Harris, G. Foot and ankle kinematics in patients with posterior tibial tendon dysfunction. Gait Posture 2008, 27, 331–339. [Google Scholar] [CrossRef]
- Ringleb, S.I.; Kavros, S.J.; Kotajarvi, B.R.; Hansen, D.K.; Kitaoka, H.B.; Kaufman, K.R. Changes in gait associated with acute stage II posterior tibial tendon dysfunction. Gait Posture 2007, 25, 555–564. [Google Scholar] [CrossRef]
- Kulig, K.; Lee, S.P.; Reischl, S.F.; Noceti-DeWit, L. Effect of posterior tibial tendon dysfunction on unipedal standing balance test. Foot Ankle Int. 2015, 36, 83–89. [Google Scholar] [CrossRef]
- Haddad, J.M.; Gagnon, J.L.; Hasson, C.J.; Van Emmerik, R.E.A.; Hamill, J. Evaluation of time-to-contact measures for assessing postural stability. J. Appl. Biomech. 2006, 22, 155–161. [Google Scholar] [CrossRef] [PubMed] [Green Version]
- Slobounov, S.M.; Moss, S.A.; Slobounova, E.S.; Newell, K.M. Aging and time to instability in posture. J. Gerontol. A Biol. Sci. Med. Sci. 1998, 53, B71–B80. [Google Scholar] [CrossRef] [PubMed] [Green Version]
- Hall, M.; Perraton, L.G.; Stevermer, C.A.; Gillette, J.C. Alterations in medial-lateral postural control after anterior cruciate ligament reconstruction during stair use. Gait Posture 2020, 77, 283–287. [Google Scholar] [CrossRef] [PubMed]
- Wang, J.; Gillette, J.C. Carrying asymmetric loads while walking on an uneven surface. Gait Posture 2018, 65, 39–44. [Google Scholar] [CrossRef] [Green Version]
- Johnson, K.A.; Strom, D.E. Tibialis posterior tendon dysfunction. Clin. Orthop. Relat. Res. 1989, 196–206. [Google Scholar] [CrossRef]
- Bluman, E.M.; Title, C.I.; Myerson, M.S. Posterior Tibial Tendon Rupture: A Refined Classification System. Foot Ankle Clin. 2007, 12, 233–249. [Google Scholar] [CrossRef]
- CDC.gov. Defining Adult Overweight & Obesity|Overweight & Obesity|CDC. Available online: https://www.cdc.gov/obesity/adult/defining.html (accessed on 21 December 2021).
- Butler, R.J.; Hillstrom, H.; Song, J.; Richards, C.J.; Davis, I.S. Arch height index measurement system: Establishment of reliability and normative values. J. Am. Podiatr. Med. Assoc. 2008, 98, 102–106. [Google Scholar] [CrossRef]
- Neville, C.; Flemister, A.S.; Houck, J. Total and distributed plantar loading in subjects with stage II tibialis posterior tendon dysfunction during terminal stance. Foot Ankle Int. 2013, 34, 131–139. [Google Scholar] [CrossRef]
- Wang, J.; Gillette, J.C. Mediolateral postural stability when carrying asymmetric loads during stair negotiation. Appl. Ergon. 2020, 85, 103057. [Google Scholar] [CrossRef]
- Hall, M.; Stevermer, C.A.; Gillette, J.C. Gait analysis post anterior cruciate ligament reconstruction: Knee osteoarthritis perspective. Gait Posture 2012, 36, 56–60. [Google Scholar] [CrossRef]
- Cohen, J. A power primer. Psychol. Bull. 1992, 112, 155–159. [Google Scholar] [CrossRef] [PubMed]
- Maki, B.E. Gait changes in older adults: Predictors of falls or indicators of fear? J. Am. Geriatr. Soc. 1997, 45, 313–320. [Google Scholar] [CrossRef] [PubMed]
- Gök, H.; Ergin, S.; Yavuzer, G. Kinetic and kinematic characteristics of gait in patients with medial knee arthrosis. Acta Orthop. Scand. 2002, 73, 647–652. [Google Scholar] [CrossRef]
- Sliwinski, M.M.; Sisto, S.A. Gait, quality of life, and their association following total hip arthroplasty. J. Geriatr. Phys. Ther. 2006, 29, 8–15. [Google Scholar] [CrossRef]
- Hallemans, A.; De Clercq, D.; Van Dongen, S.; Aerts, P. Changes in foot-function parameters during the first 5 months after the onset of independent walking: A longitudinal follow-up study. Gait Posture 2006, 23, 142–148. [Google Scholar] [CrossRef] [PubMed]
- Menz, H.B.; Auhl, M.; Tan, J.M.; Buldt, A.K.; Munteanu, S.E. Centre of pressure characteristics during walking in individuals with and without first metatarsophalangeal joint osteoarthritis. Gait Posture 2018, 63, 91–96. [Google Scholar] [CrossRef] [PubMed]
- Blackwood, C.B.; Yuen, T.J.; Sangeorzan, B.J.; Ledoux, W.R. The Midtarsal Joint Locking Mechanism. Foot Ankle Int. 2005, 26, 1074–1080. [Google Scholar] [CrossRef]
- Tome, J.; Nawoczenski, D.A.; Flemister, A.; Houck, J. Comparison of foot kinematics between subjects with posterior tibialis tendon dysfunction and healthy controls. J. Orthop. Sport. Phys. Ther. 2006, 36, 635–644. [Google Scholar] [CrossRef] [Green Version]


| PTTD (n = 11) | Controls (n = 11) | p Value | |
|---|---|---|---|
| Age (year) | 59.1 ± 7.1 | 55.8 ± 8.9 | 0.26 |
| Height (m) | 1.66 ± 0.12 | 1.68 ± 0.10 | 0.64 |
| Weight (kg) | 84.2 ± 16.0 | 76.1 ± 17.1 | 0.27 |
| Body mass index | 30.4 ± 3.5 | 26.7 ± 4.5 | 0.07 |
| Gait velocity (m/s) | 0.92 ± 0.20 | 1.13 ± 0.11 | 0.02 |
| Gender (M/F) | 4/7 | 4/7 | - |
| Affected side (L/R) | 9/2 | N.A | - |
| Variables | PTTD (n = 11) | Control (n = 11) | p Value | Effect Size (D) |
|---|---|---|---|---|
| Double stance ratio (%) | 40.1 (6.1) | 32.7 (5.8) | 0.009 * | 1.2 |
| AP COP excursion (cm) | 11.2 (2.9) | 13.9 (2.0) | 0.020 * | 1.1 |
| ML COP excursion (cm) | 1.8 (0.7) | 1.8 (0.8) | 0.965 | 0.0 |
| AP COP velocity (cm/s) | 23.8 (5.7) | 33.9 (3.9) | <0.001 * | 2.1 |
| ML COP velocity (cm/s) | 4.4 (1.3) | 7.3 (3.4) | 0.018 * | 1.2 |
| AP TTC percentage (%) | 83.0 (8.2) | 71.6 (10.0) | 0.009 * | 1.2 |
| ML TTC percentage (%) | 86.4 (9.3) | 80.3 (6.5) | 0.094 | 0.8 |
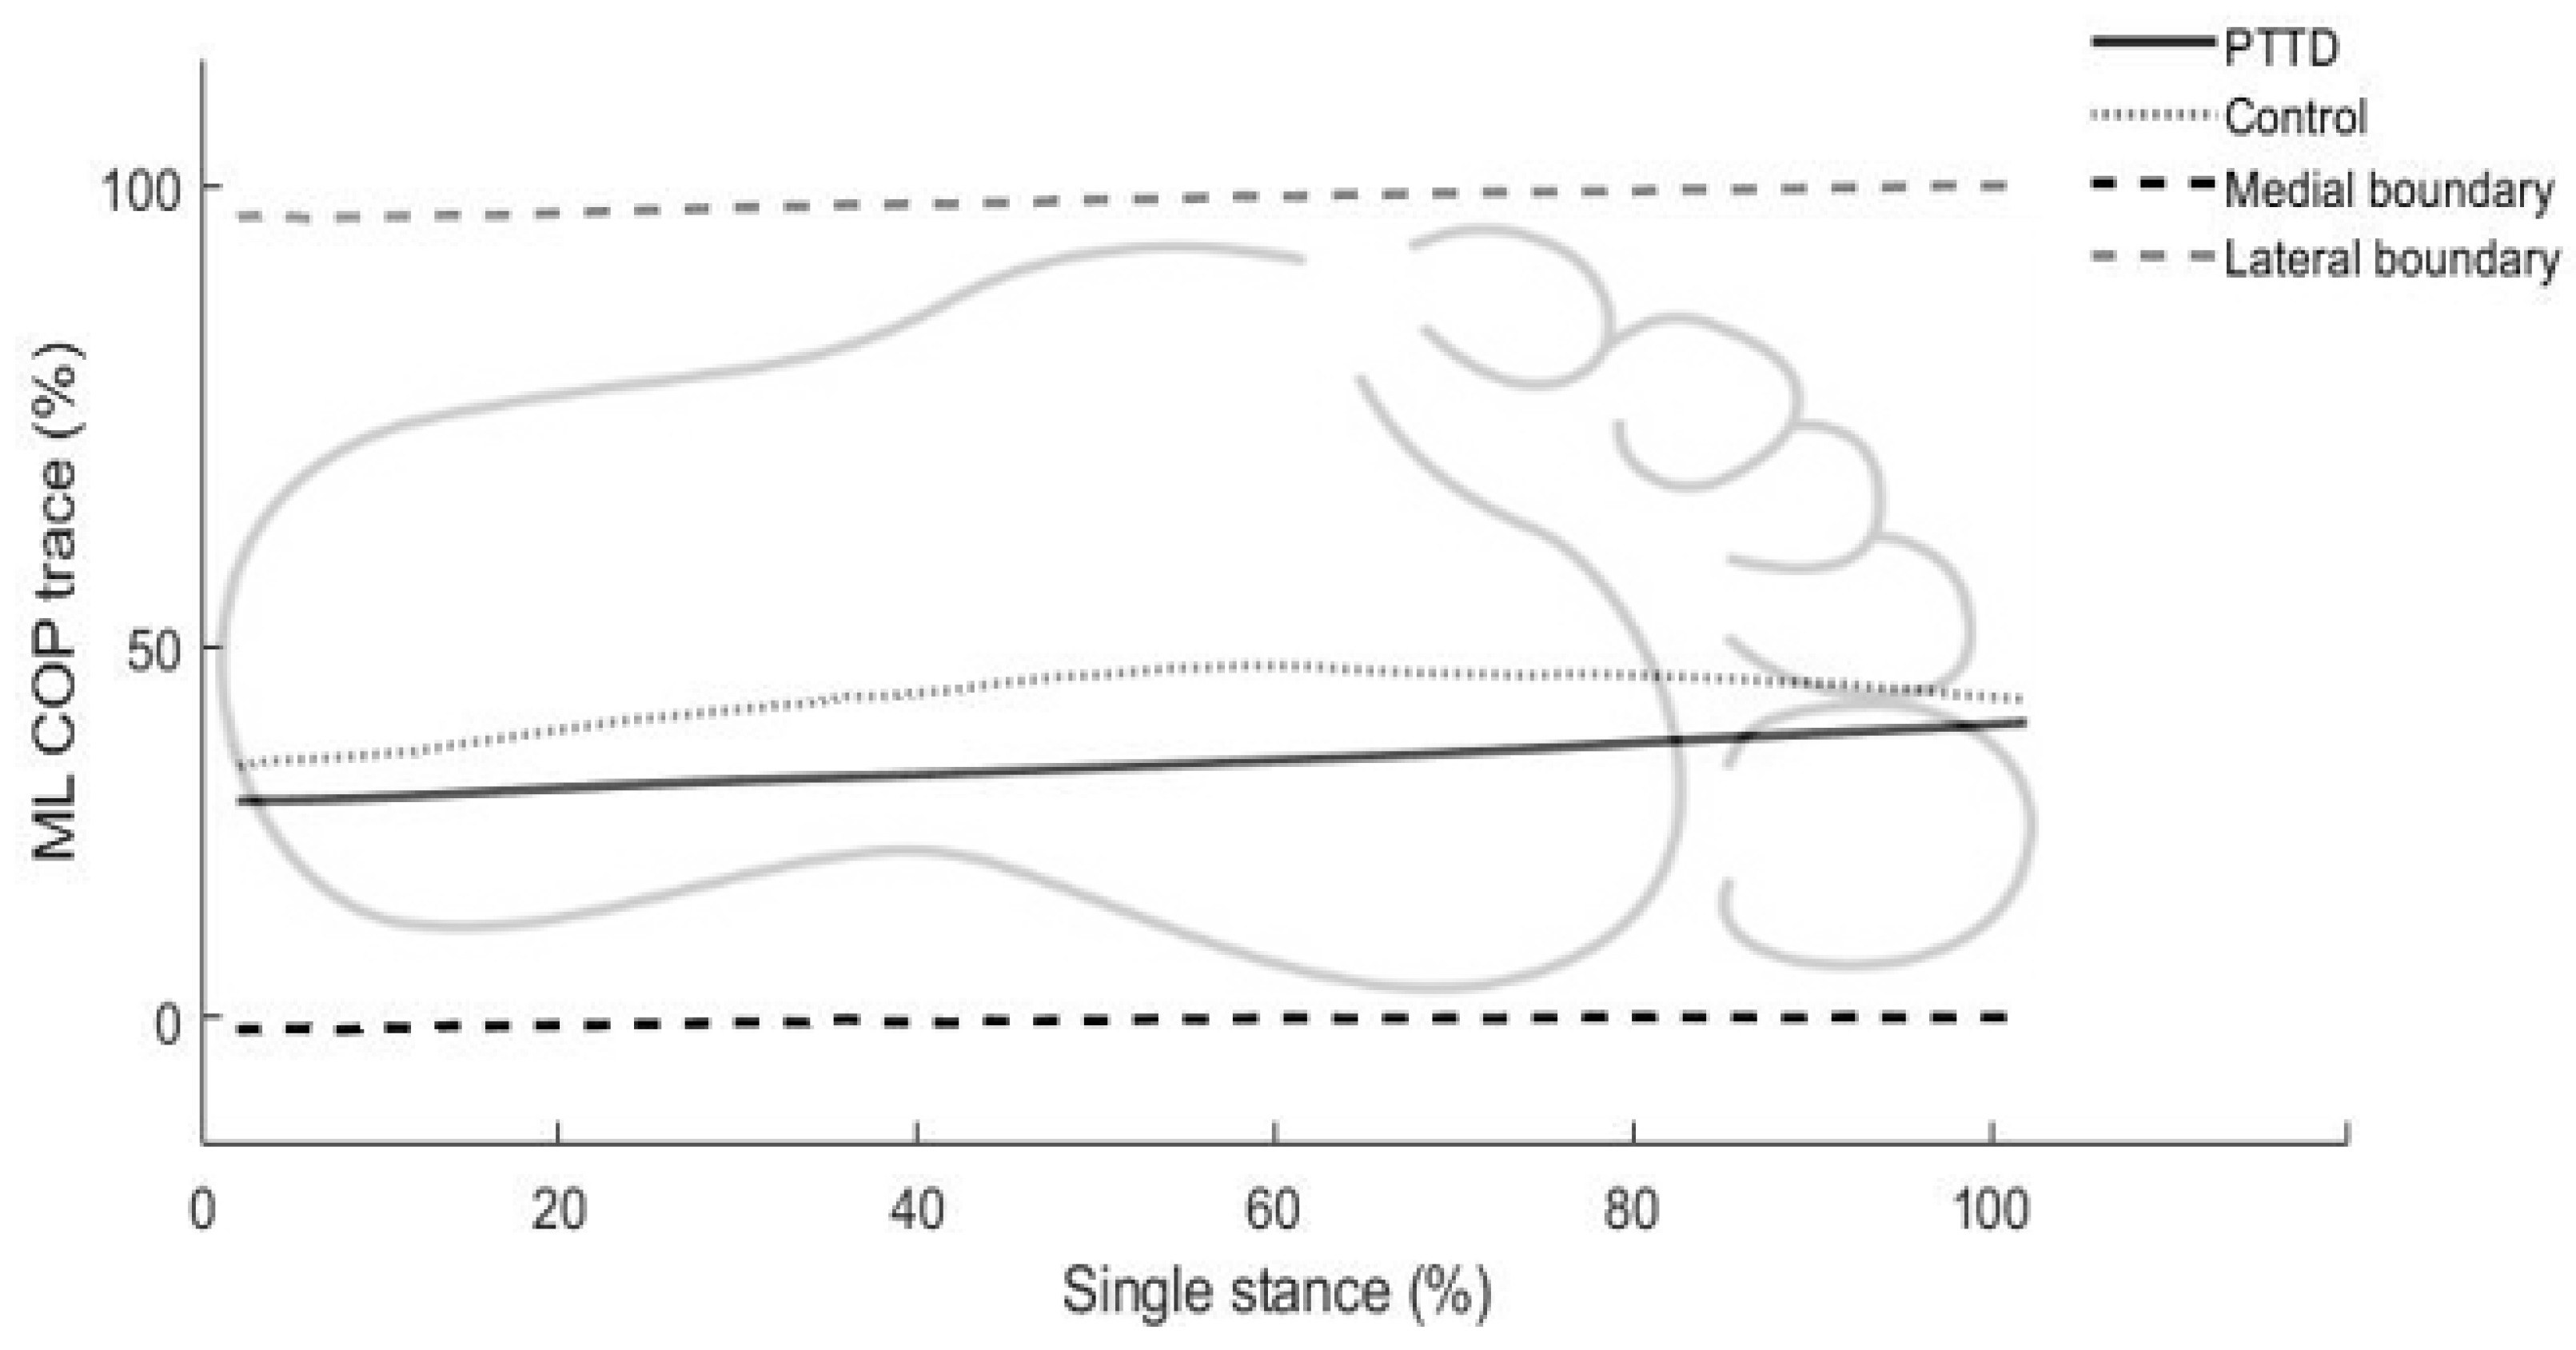
| ML COP trace (%) | 40.6 (11.7) | 52.4 (10.6) | 0.022 * | 1.1 |
Publisher’s Note: MDPI stays neutral with regard to jurisdictional claims in published maps and institutional affiliations. |
© 2022 by the authors. Licensee MDPI, Basel, Switzerland. This article is an open access article distributed under the terms and conditions of the Creative Commons Attribution (CC BY) license (https://creativecommons.org/licenses/by/4.0/).
Share and Cite
Wang, J.; Latt, L.D.; Martin, R.D.; Mannen, E.M. Postural Control Differences between Patients with Posterior Tibial Tendon Dysfunction and Healthy People during Gait. Int. J. Environ. Res. Public Health 2022, 19, 1301. https://0-doi-org.brum.beds.ac.uk/10.3390/ijerph19031301
Wang J, Latt LD, Martin RD, Mannen EM. Postural Control Differences between Patients with Posterior Tibial Tendon Dysfunction and Healthy People during Gait. International Journal of Environmental Research and Public Health. 2022; 19(3):1301. https://0-doi-org.brum.beds.ac.uk/10.3390/ijerph19031301
Chicago/Turabian StyleWang, Junsig, L. Daniel Latt, Robert D. Martin, and Erin M. Mannen. 2022. "Postural Control Differences between Patients with Posterior Tibial Tendon Dysfunction and Healthy People during Gait" International Journal of Environmental Research and Public Health 19, no. 3: 1301. https://0-doi-org.brum.beds.ac.uk/10.3390/ijerph19031301