
Fitness, Fatness, and Academic Attainment in Male Schoolchildren from a Soccer Academy


Abstract
:1. Introduction
2. Materials and Methods
2.1. Participants
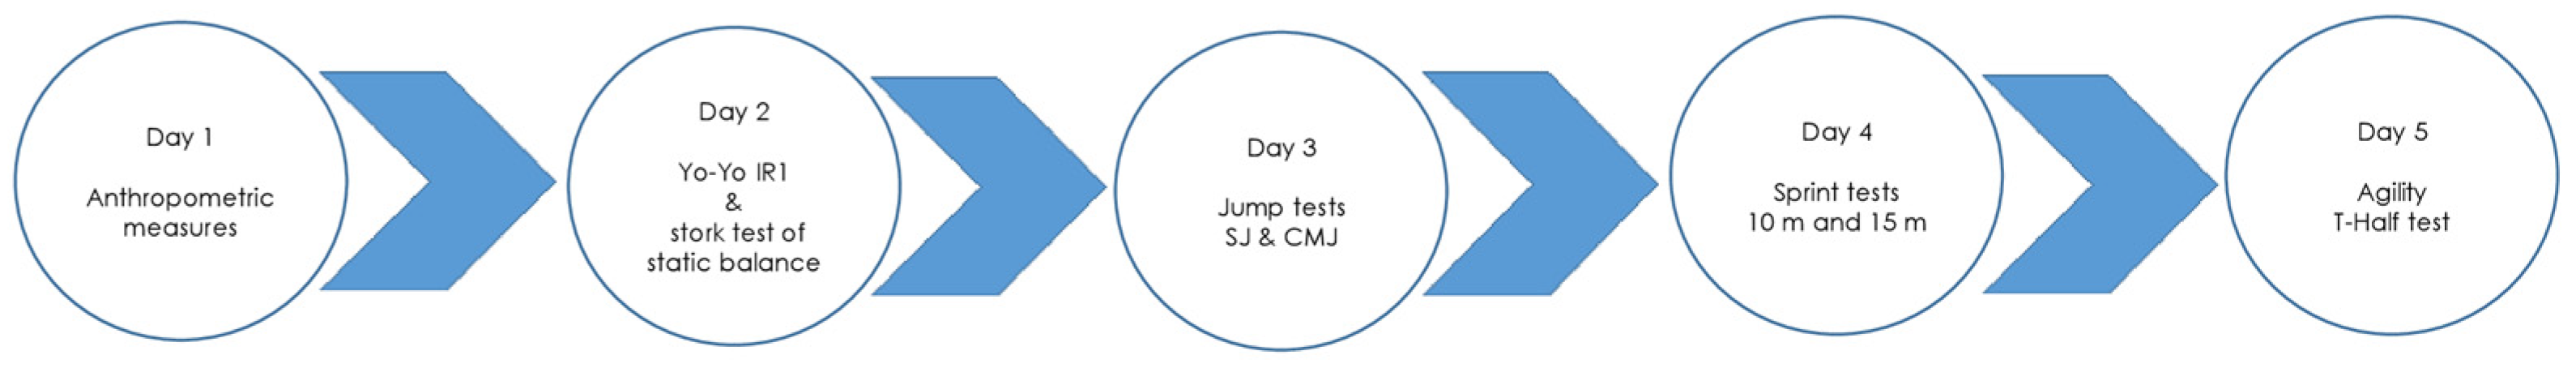
2.2. Procedures and Evaluations
2.3. Anthropometry
2.4. Maturity
2.5. The Yo-Yo Intermittent Recovery Test Level 1
2.6. Sprint Tests
2.7. Vertical Jumps
2.8. Static Balance Performance
2.9. Change of Direction (T-Half Test)
2.10. Academic Attainment
2.11. Statistical Analysis
3. Results
3.1. Normal Distribution and Homogeneity of Variance
3.2. Intrarater Reliability
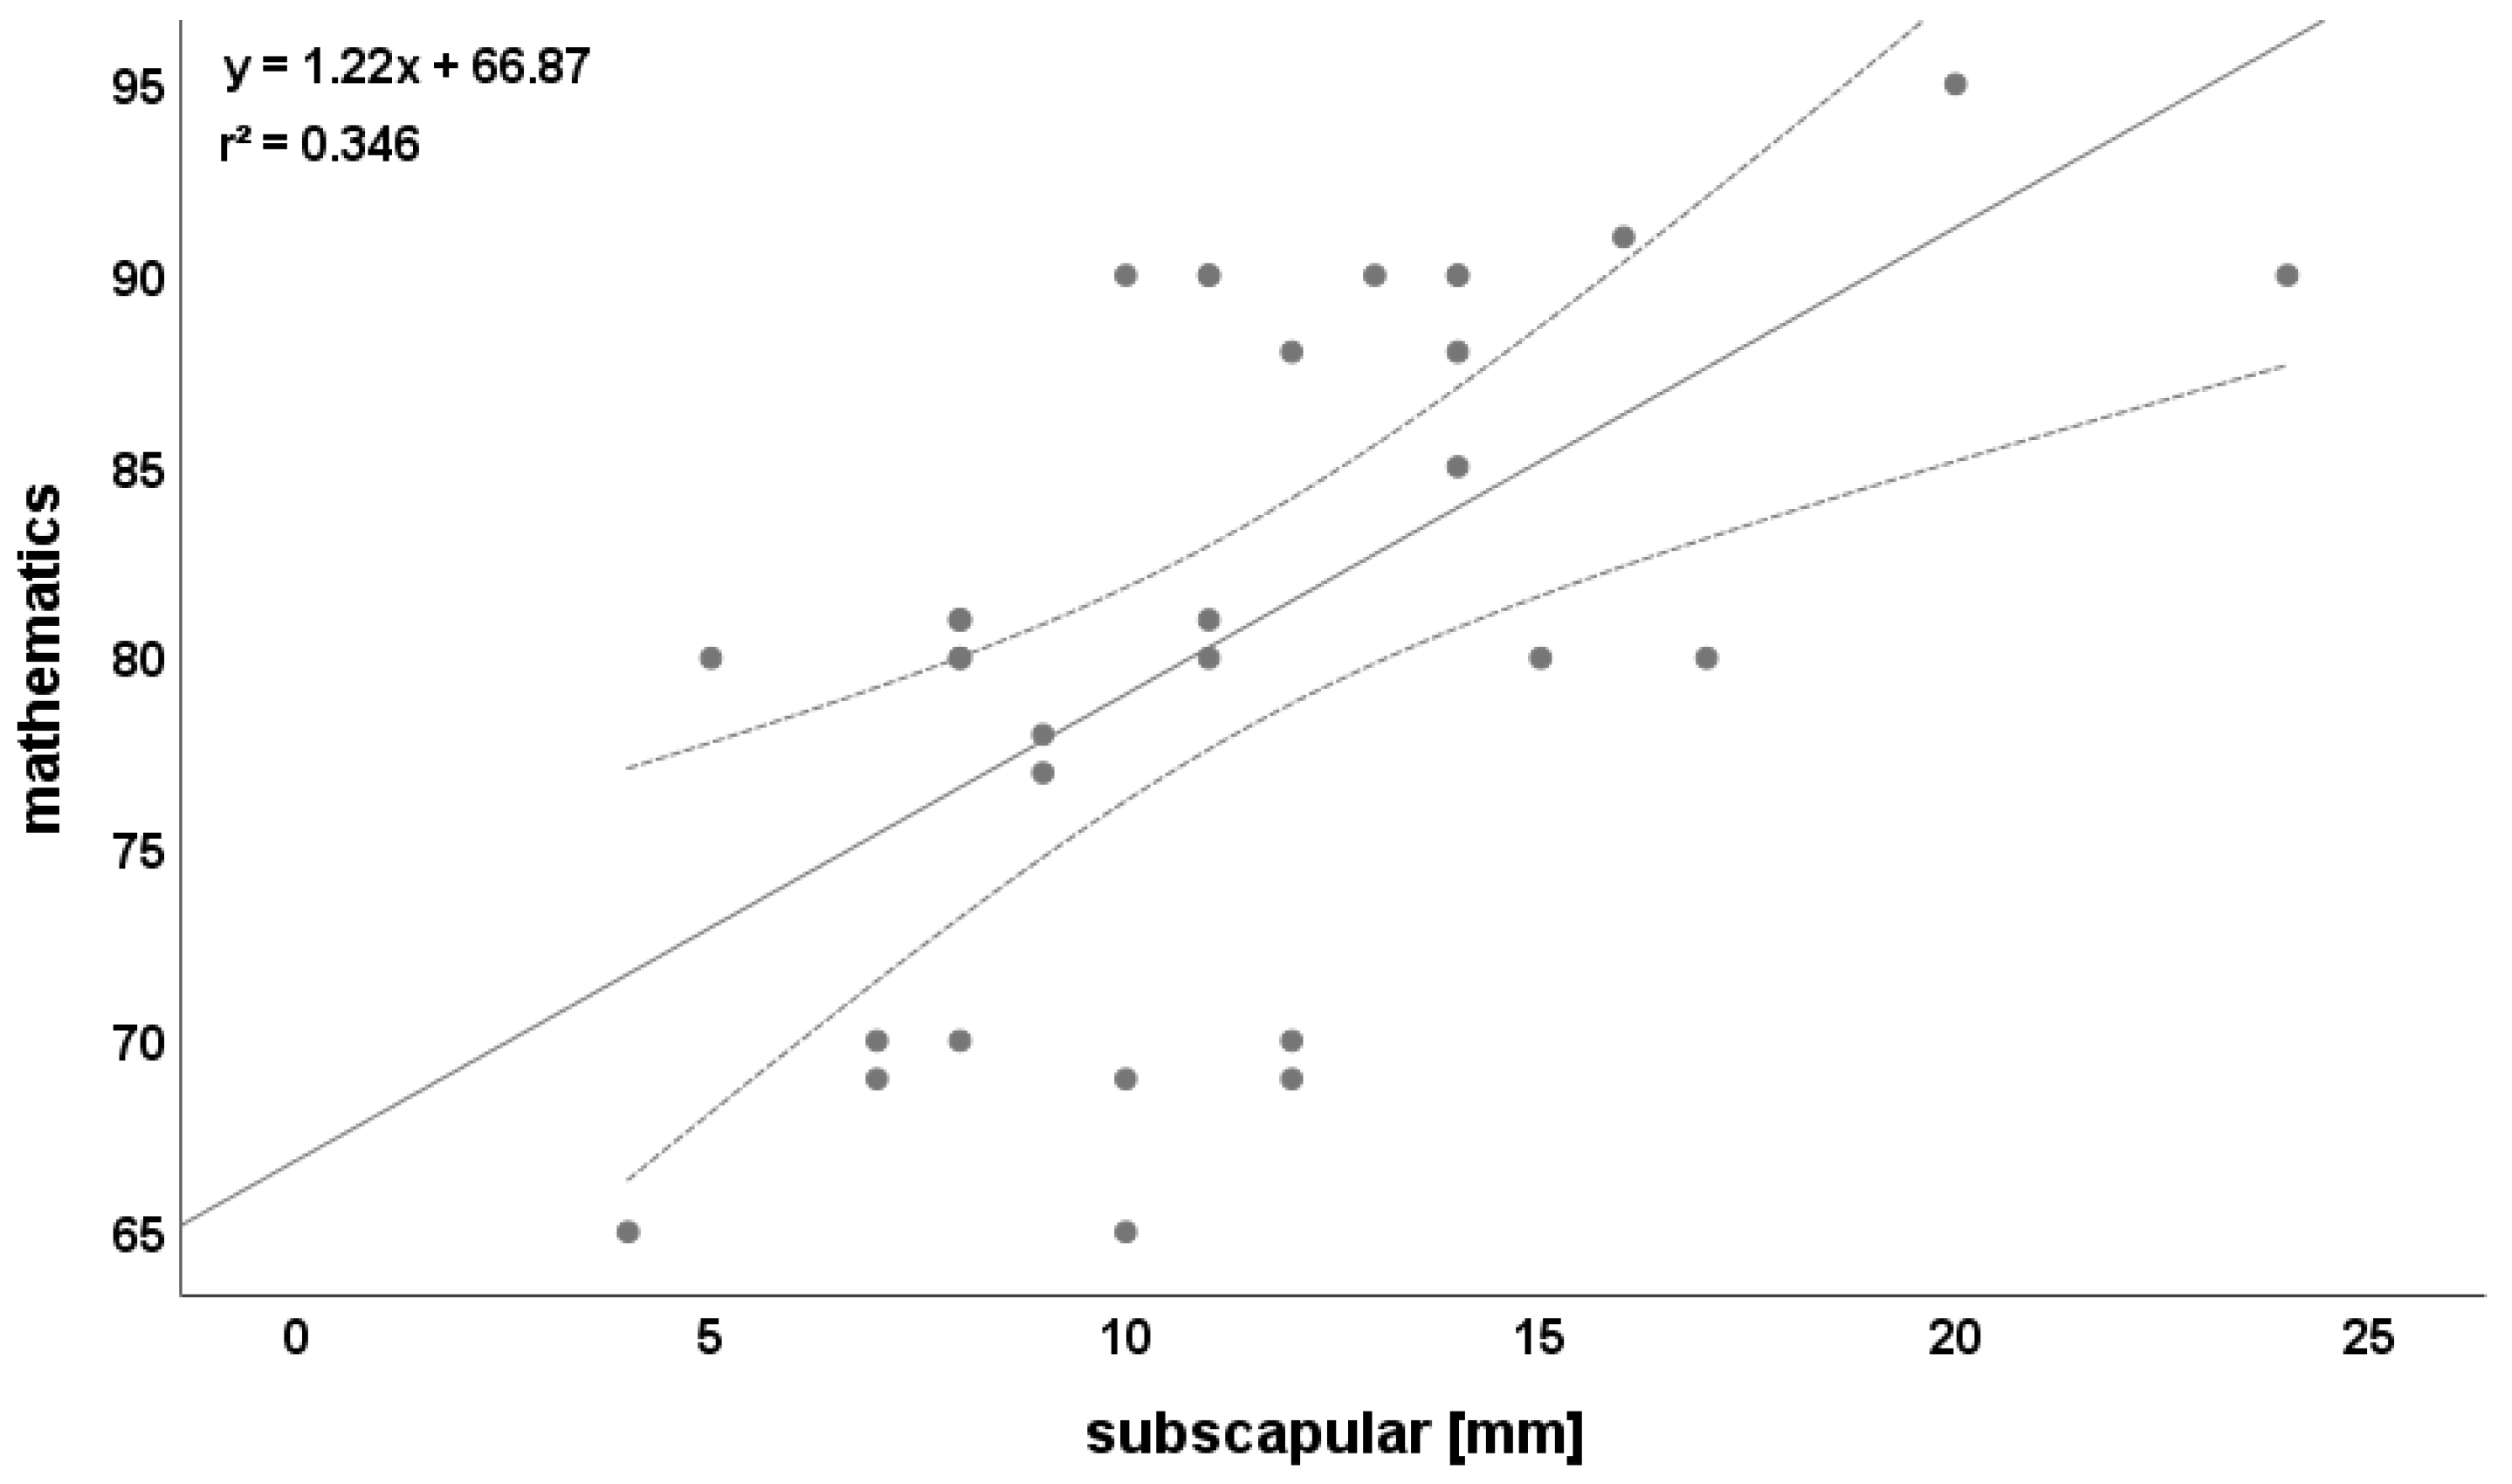
3.3. Correlation between Fatness and Academic Attainment
4. Discussion
4.1. Relationship between Fatness and Academic Attainment
4.2. Associations between Physical Fitness and GPA
4.3. Limitations
5. Conclusions
Author Contributions
Funding
Institutional Review Board Statement
Informed Consent Statement
Data Availability Statement
Acknowledgments
Conflicts of Interest
References
- Leyhr, D.; Kelava, A.; Raabe, J.; Höner, O. Longitudinal motor performance development in early adolescence and its relationship to adult success: An 8-year prospective study of highly talented soccer players. PLoS ONE 2018, 13, e0196324. [Google Scholar] [CrossRef] [PubMed] [Green Version]
- Leyhr, D.; Bergmann, F.; Schreiner, R.; Mann, D.; Dugandzic, D.; Höner, O. Relative Age-Related Biases in Objective and Subjective Assessments of Performance in Talented Youth Soccer Players. Front. Sports Act. Living 2021, 14, 664231. [Google Scholar] [CrossRef] [PubMed]
- Reilly, T.; Williams, A.M.; Nevill, A.; Franks, A. A multidisciplinary approach to talent identification in soccer. J. Sports Sci. 2000, 18, 695–702. [Google Scholar] [CrossRef]
- Sarmento, H.; Anguera, M.T.; Pereira, A.; Araújo, D. Talent Identification and Development in Male Football: A Systematic Review. Sports Med. 2018, 48, 907–931. [Google Scholar] [CrossRef]
- Abarghoueinejad, M.; Baxter-Jones, A.D.G.; Gomes, T.N.; Barreira, D.; Maia, J. Motor Performance in Male Youth Soccer Players: A Systematic Review of Longitudinal Studies. Sports 2021, 9, 53. [Google Scholar] [CrossRef] [PubMed]
- Hohmann, A.; Siener, M. Talent Identification in Youth Soccer: Prognosis of U17 Soccer Performance on the Basis of General Athleticism and Talent Promotion Interventions in Second-Grade Children. Front. Sports Act. Living 2021, 3, 625645. [Google Scholar] [CrossRef] [PubMed]
- Unnithan, V.; White, J.; Georgiou, A.; Iga, J.; Drust, B. Talent identification in youth soccer. J. Sports Sci. 2012, 30, 1719–1726. [Google Scholar] [CrossRef]
- Chang, E.C.-H.; Chu, C.-H.; Karageorghis, C.I.; Wang, C.-C.; Tsai, J.H.-C.; Wang, Y.-S.; Chang, Y.-K. Relationship between mode of sport training and general cognitive performance. J. Sport Health Sci. 2017, 6, 89–95. [Google Scholar] [CrossRef] [PubMed] [Green Version]
- Lovecchio, N.; Manes, G.; Filipas, L.; Giuriato, M.; La Torre, A.; Marcello Iaia, F.; Codella, R. Screening Youth Soccer Players by Means of Cognitive Function and Agility Testing. Percept. Mot. Skills 2021, 128, 2710–2724. [Google Scholar] [CrossRef]
- Murr, D.; Feichtinger, P.; Larkin, P.; O’Connor, D.; Honer, O. Psychological € talent predictors in youth soccer: A systematic review of the prognostic relevance of psychomotor, perceptual-cognitive and personality-related factors. PLoS ONE 2018, 13, e0205337. [Google Scholar] [CrossRef] [Green Version]
- Sakamoto, S.; Takeuchi, H.; Ihara, N.; Ligao, B.; Suzukawa, K. Possible requirement of executive functions for high performance in soccer. PLoS ONE 2018, 13, e0201871. [Google Scholar] [CrossRef] [PubMed]
- Buchheit, M.; Al Haddad, H.; Simpson, B.M.; Palazzi, D.; Bourdon, P.C.; Di Salvo, V.; Mendez-Villanueva, A. Monitoring accelerations with GPS in football: Time to slow down? Int. J. Sports Physiol. Perform. 2014, 9, 442–445. [Google Scholar] [CrossRef] [PubMed]
- Cochrane, D.J.; Monaghan, D. Using sprint velocity decrement to enhance acute sprint performance. J. Strength Cond. Res. 2021, 35, 442–448. [Google Scholar] [CrossRef] [PubMed]
- Mara, J.; Thompson, K.G.; Pumpa, K.L.; Morgan, S. The acceleration and deceleration profiles of elite female soccer players during competitive matches. J. Sci. Med. Sports 2017, 20, 867–872. [Google Scholar] [CrossRef]
- Aloui, G.; Hermassi, S.; Khemiri, A.; Bartels, T.; Hayes, L.D.; Bouhafs, E.G.; Souhaiel Chelly, M.; Schwesig, R. An 8-Week Program of Plyometrics and Sprints with Changes of Direction Improved Anaerobic Fitness in Young Male Soccer Players. Int. J. Environ. Res. Public Health 2021, 18, 10446. [Google Scholar] [CrossRef]
- Hermassi, S.; Bragazzi, N.L.; Majed, L. Body Fat Is a Predictor of Physical Fitness in Obese Adolescent Handball Athletes. Int. J. Environ. Res. Public Health 2020, 17, 8428. [Google Scholar] [CrossRef]
- Nikolaidis, P.T. Physical fitness is inversely related with body mass index and body fat percentage in soccer players aged 16–18 years. Med. Pregl. 2012, 65, 470–475. [Google Scholar] [CrossRef] [Green Version]
- Nikolaidis, P.T.; Asadi, A.; Santos, E.J.; Calleja-Gonzalez, J.; Padulo, J.; Chtourou, H.; Zemkova, E. Relationship of body mass status with running and jumping performances in young basketball players. Muscles Ligaments Tendons J. 2015, 5, 187–194. [Google Scholar] [CrossRef]
- Chomitz, V.R.; Slining, M.M.; McGowan, R.J.; Mitchell, S.E.; Dawson, G.F.; Hacker, K.A. Is there a relationship between physical fitness and academic achievement? Positive results from public school children in the northeastern United States. J. Sch. Health 2009, 79, 30–37. [Google Scholar] [CrossRef]
- Wittberg, R.A.; Northrup, K.L.; Cottrell, L.A. Children’s aerobic fitness and academic achievement: A longitudinal examination of students during their fifth and seventh grade years. Am. J. Public Health 2012, 102, 2303–2307. [Google Scholar] [CrossRef]
- Esteban-Cornejo, I.; Tejero-Gonzalez, C.M.; Martinez-Gomez, D.; Cabanas Sanchez, V.; Fernandez-Santos, J.R.; Conde-Caveda, J.; Sallis, S.F.; Veiga, O.L. UP & Down Study Group. Objectively measured physical activity has a negative but weak association with academic performance in children and adolescents. Acta Paediatr. 2014, 103, e501–e506. [Google Scholar] [CrossRef] [PubMed]
- Hermassi, S.; Chelly, M.S.; Michalsik, L.B.; Sanal, N.E.M.; Hayes, L.D.; Cadenas-Sanchez, C. Relationship between fatness, physical fitness, and academic performance in normal weight and overweight schoolchild handball players in Qatar State. PLoS ONE. 2021, 16, e0246476. [Google Scholar] [CrossRef] [PubMed]
- Hermassi, S.; van den Tillaar, R.; Bragazzi, N.L.; Schwesig, R. The Associations Between Physical Performance and Anthropometric Characteristics in Obese and Non-obese Schoolchild Handball Players. Front. Physiol. 2021, 11, 580991. [Google Scholar] [CrossRef] [PubMed]
- Pepera, G.; Hadjiandrea, S.; Iliadis, I.; Sandercock, G.R.H.; Batalik, L. Associations between cardiorespiratory fitness, fatness, hemodynamic characteristics, and sedentary behaviour in primary school-aged children. BMC Sports Sci. Med. Rehabil. 2022, 14, 16. [Google Scholar] [CrossRef]
- Hermassi, S.; Hayes, L.D.; Bragazzi, N.L.; Schwesig, R. Physical Fitness and Academic Performance in Normal Weight, Overweight, and Obese Schoolchild Handball Players in Qatar: A Pilot Study. Front. Psychol. 2021, 11, 616671. [Google Scholar] [CrossRef]
- Hermassi, S.; Hayes, L.D.; Schwesig, R. Differences in Fitness and Academic Attainment between Obese, and Non Obese School-Age Adolescent Handball Players: An Explorative, Cross-Sectional Study. Appl. Sci. 2021, 11, 4185. [Google Scholar] [CrossRef]
- Huijgen, B.C.; Leemhuis, S.; Kok, N.M.; Verburgh, L.; Oosterlaan, J.; Elferink-Gemser, M.T.; Visscher, C. Cognitive Functions in Elite and Sub-Elite Youth Soccer Players Aged 13 to 17 Years. PLoS ONE 2015, 10, e0144580. [Google Scholar] [CrossRef] [Green Version]
- Anderson, Y.C.; Kirkpatrick, K.; Dolan, G.M.S.; Wouldes, T.A.; Grant, C.C.; Cave, T.L.; Wild, C.E.K.; Derraik, J.G.B.; Cutfield, W.S.; Hofman, P.L. Do changes in weight status affect cognitive function in children and adolescents with obesity? A secondary analysis of a clinical trial. BMJ Open 2019, 9, e021586. [Google Scholar] [CrossRef] [Green Version]
- Naveed, S.; Lakka, T.; Haapala, E.A. An Overview on the Associations between Health Behaviors and Brain Health in Children and Adolescents with Special Reference to Diet Quality. Int. J. Environ. Res. Public Health 2020, 17, 953. [Google Scholar] [CrossRef] [Green Version]
- Donnelly, J.E.; Hillman, C.H.; Castelli, D.; Etnier, J.L.; Lee, S.; Tomporowski, P.; Lambourne, K.; Szabo-Reed, A.N. Physical activity, fitness, cognitive function, and academic achievement in children: A systematic review. Med. Sci. Sport Exerc. 2016, 48, 1197–1222. [Google Scholar] [CrossRef] [Green Version]
- Veronese, N.; Facchini, S.; Stubbs, B.; Luchini, C.; Solmi, M.; Manzato, E.; Sergi, G.; Maggi, S.; Cosco, T.; Fontana, L. Weight loss is associated with improvements in cognitive function among overweight and obese people: A systematic review and meta-analysis. Neurosci. Biobehav. Rev. 2017, 72, 87–94. [Google Scholar] [CrossRef] [PubMed]
- Verloigne, M.; Loyen, A.; Van Hecke, L.; Lakerveld, J.; Hendriksen, I.; De Bourdheaudhuij, I.; Deforche, B.; Donnelly, A.; Ekelund, U.; Brug, J.; et al. Variation in population levels of sedentary time in European children and adolescents according to cross-European studies: A systematic literature review within DEDIPAC. Int. J. Behav. Nutr. Phys. Act. 2016, 13, 69. [Google Scholar] [CrossRef] [PubMed] [Green Version]
- Arundell, L.; Fletcher, E.; Salmon, J.; Veitch, J.; Hinkley, T. A systematic review of the prevalence of sedentary behavior during the after-school period among children aged 5-18 years. Int. J. Behav. Nutr. Phys. Act. 2016, 13, 93. [Google Scholar] [CrossRef] [PubMed] [Green Version]
- Carson, V.; Hunter, S.; Kuzik, N.; Gray, C.E.; Poitras, V.J.; Chaput, J.P.; Saunders, T.J.; Katzmarzyk, P.T.; Okely, A.D.; Gorber, S.C.; et al. Systematic review of sedentary behaviour and health indicators in school-aged children and youth: An update. Appl. Physiol. Nutr. Metab. 2016, 41, S240–S265. [Google Scholar] [CrossRef] [PubMed]
- Tremblay, M.S.; LeBlanc, A.G.; Kho, M.E.; Saunders, T.J.; Larouche, R.; Colley, R.C.; Goldfield, G.; Gorber, S.C. Systematic review of sedentary behaviour and health indicators in school-aged children and youth. Int. J. Behav. Nutr. Phys. Act. 2011, 8, 98. [Google Scholar] [CrossRef] [PubMed] [Green Version]
- Salmon, J.; Tremblay, M.S.; Marshall, S.J.; Hume, C. Health risks, correlates, and interventions to reduce sedentary behavior in young people. Am. J. Prev. Med. 2011, 41, 197–206. [Google Scholar] [CrossRef]
- Howie, E.K.; Joosten, J.; Harris, C.J.; Straker, L.M. Associations between meeting sleep, physical activity or screen time behaviour guidelines and academic performance in Australian school children. BMC Public Health. 2020, 20, 520. [Google Scholar] [CrossRef]
- Fedewa, A.L.; Ahn, S. The effects of physical activity and physical fitness on children’s achievement and cognitive outcomes: A meta-analysis. Res. Q. Exerc. Sport 2011, 82, 521–535. [Google Scholar] [CrossRef]
- Kao, S.C.; Westfall, D.R.; Parks, A.C.; Pontifex, M.B.; Hillman, C.H. Muscular and aerobic fitness, working memory, and academic achievement in children. Med. Sci. Sports Exerc. 2017, 49, 500–508. [Google Scholar] [CrossRef]
- He, J.; Chen, X.; Fan, X.; Cai, Z.; Huang, F. Is there a relationship between body mass index and academic achievement? A meta-analysis. Public Health 2019, 167, 111–124. [Google Scholar] [CrossRef]
- Hermassi, S.; Sellami, M.; Fieseler, G.; Bouhafs, E.G.; Hayes, L.D.; Schwesig, R. Differences in Body Fat, Body Mass Index, and Physical Performance of Specific Field Tests in 10-to-12-Year-Old School-Aged Team Handball Players. Appl. Sci. 2020, 10, 9022. [Google Scholar] [CrossRef]
- Haapala, E.A. Cardiorespiratory fitness and motor skills in relation to cognition and academic performance in children—A review. J. Hum. Kinet. 2013, 36, 55–68. [Google Scholar] [CrossRef] [PubMed] [Green Version]
- Chelly, M.S.; Fathloun, M.; Cherif, N.; Ben Amar, M.; Tabka, Z.; Van Praagh, E. Effects of a back squat training program on leg power, jump, and sprint performances in junior soccer players. J. Strength Cond. Res. 2009, 23, 2241–2249. [Google Scholar] [CrossRef] [Green Version]
- Womersley, J.; Durnin, J.V. An experimental study on variability of measurements of skinfold thickness on young adults. Hum. Biol. 1973, 45, 281–292. [Google Scholar] [PubMed]
- Mirwald, R.L.; Baxter-Jones, A.D.; Bailey, D.A.; Beunen, G.P. An assessment of maturity from anthropometric measurements. Med. Sci. Sports Exerc. 2002, 34, 689–694. [Google Scholar] [CrossRef]
- Krustrup, P.; Mohr, M.; Amstrup, T.; Rysgaard, T.; Johansen, J.; Steensberg, A.; Pedersen, P.K.; Bangsbo, J. The yo-yo intermittent recovery test: Physiological response, reliability, and validity. Med. Sci. Sports Exerc. 2003, 35, 697–705. [Google Scholar] [CrossRef] [PubMed]
- Miller, D. Measurement by the Physical Educator: Why and How? Brown and Benchmark: Madison, WI, USA, 2002. [Google Scholar]
- Sassi, R.H.; Dardouri, W.; Yahmed, M.H.; Gmada, N.; Mahfoudhi, M.E.; Gharbi, Z. Relative and absolute reliability of a modified agility T-test and its relationship with vertical jump and straight sprint. J. Strength Cond. Res. 2009, 23, 1644–1651. [Google Scholar] [CrossRef]
- Hsieh, S.S.; Tsai, J.R.; Chang, S.H.; Ho, J.Y.; Chen, J.F.; Chen, P.H.; Sung, Y.-T.; Hung, M.-T. The subject-dependent, cumulative, and recency association of aerobic fitness with academic performance in Taiwanese junior high school students. BMC Pediatr. 2019, 19, 25. [Google Scholar] [CrossRef]
- Vincent, W. Statistics in Kinesiology; Human Kinetics: Champaign, IL, USA, 1995. [Google Scholar]
- Schabort, E.J.; Hopkins, W.G.; Hawley, J.A. Reproducibility of selfpaced treadmill performance of trained endurance runners. Int. J. Sports Med. 1998, 19, 48–51. [Google Scholar] [CrossRef]
- Cohen, J. The effect size. In Statistical Power Analysis for the Behavioural Sciences; Taylor & Francis: Abingdon, UK, 1988; pp. 77–83. [Google Scholar]
- Willimczik, K. Statistik im Sport: Grundlagen, Verfahren, Anwendungen, 3rd ed.; Czwalina: Hamburg, Germany, 1997; p. 259. [Google Scholar]
- WHO. Growth Reference Data for 5–19 Years. Available online: https://www.who.int/tools/growth-reference-data-for-5to19-years/indicators/bmi-for-age (accessed on 25 June 2021).
- Harrington, D.M.; Staiano, A.E.; Broyles, S.T.; Gupta, A.K.; Katzmarzyk, P.T. BMI percentiles for the identification of abdominal obesity and metabolic risk in children and adolescents: Evidence in support of the CDC 95th percentile. Eur. J. Clin. Nutr. 2013, 67, 218–222. [Google Scholar] [CrossRef]
- Burkhalter, T.M.; Hillman, C.H. A narrative review of physical activity, nutrition, and obesity to cognition and scholastic performance across the human lifespan. Adv. Nutr. 2011, 2, 201S–206S. [Google Scholar] [CrossRef] [PubMed] [Green Version]
- Anderson, A.S.; Good, D.J. Increased body weight affects academic performance in university students. Prev. Med. Rep. 2016, 28, 220–223. [Google Scholar] [CrossRef] [PubMed]
- Krukowski, R.A.; West, D.S.; Philyaw Perez, A.; Bursac, Z.; Phillips, M.M.; Raczynski, J.M. Overweight children, weight-based teasing and academic performance. Int. J. Pediatr. Obes. 2009, 4, 274–280. [Google Scholar] [CrossRef]
- Bisset, S.; Foumier, M.; Pagani, L.; Janosz, M. Predicting academic and cognitive outcomes from weight status trajectories during childhood. Int. J. Obes. 2013, 37, 154–159. [Google Scholar] [CrossRef] [PubMed] [Green Version]
- Rauner, R.R.; Walters, R.W.; Avery, M.; Wanser, T.J. Evidence that aerobic fitness is more salient than weight status in predicting standardized math and reading outcomes in fourth- through eighth-grade students. J. Pediatr. 2013, 163, 344–348. [Google Scholar] [CrossRef] [Green Version]
- Baxter, S.D.; Guinn, C.H.; Tebbs, J.M.; Royer, J.A. There is no relationship between academic achievement and body mass index among fourth-grade, predominantly African-American children. J. Acad. Nutr. Diet. 2013, 113, 551–557. [Google Scholar] [CrossRef] [Green Version]
- Alswat, K.A.; Al-Shehri, A.D.; Aljuaid, T.A.; Alzaidi, B.A.; Alasmari, H.D. The association between body mass index and academic performance. Saudi Med. J. 2017, 38, 186–191. [Google Scholar] [CrossRef]
- Castelli, D.M.; Hillman, C.H.; Buck, S.M.; Erwin, H.E. Physical fitness and academic achievement in third- and fifth-grade students. J. Sport Exerc. Psychol. 2007, 29, 239–252. [Google Scholar] [CrossRef]
- Wu, N.; Chen, Y.; Yang, J.; Li, F. Childhood Obesity and Academic Performance: The Role of Working Memory. Front. Psychol. 2017, 8, 611. [Google Scholar] [CrossRef] [Green Version]
- Cottrell, L.A.; Northrup, K.; Wittberg, R.; Lesley, A.; Northrup, K. The Extended Relationship between Child Cardiovascular Risks and Academic Performance Measures. Obesity 2007, 15, 3170–3177. [Google Scholar] [CrossRef]
- Judge, S.; Jahns, L. Association of Overweight with Academic Performance and Social and Behavioral Problems: An Update from the Early Childhood Longitudinal Study. J. Sch. Health 2007, 77, 672–678. [Google Scholar] [CrossRef] [PubMed]
- Kamijo, K.; Pontifex, M.B.; Khan, N.A.; Raine, L.B.; Scudder, M.R.; Drollette, E.S.; Evans, E.M.; Castelli, D.M.; Hillman, C.H. The Association of Childhood Obesity to Neuroelectric Indices of Inhibition. Psychophysiology 2012, 49, 1361–1371. [Google Scholar] [CrossRef] [PubMed]
- Medrano, M.; Cadenas-Sánchez, C.; Oses, M.; Villanueva, A.; Cabeza, R.; Idoate, F.; Sanz, A.; Rodríguez-Vigil, B.; Ortega, F.B.; Ruiz, J.R.; et al. Associations of fitness and physical activity with specific abdominal fat depots in children with overweight/obesity. Scand. J. Med. Sci. Sports 2022, 32, 211–222. [Google Scholar] [CrossRef] [PubMed]
- Cadenas-Sanchez, C.; Migueles, J.H.; Esteban-Cornejo, I.; Mora-Gonzalez, J.; Henriksson, P.; Rodriguez-Ayllon, M.; Molina-García, P.; Löf, M.; Labayen, I.; Hillman, C.H.; et al. Fitness, physical activity and academic achievement in overweight/obese children. J. Sports Sci. 2020, 38, 731–740. [Google Scholar] [CrossRef]
- Van Dusen, D.P.; Kelder, S.H.; Kohl, H.W., 3rd; Ranjit, N.; Perry, C.L. Associations of physical fitness and academic performance among schoolchildren. J. Sch. Health 2011, 81, 733–740. [Google Scholar] [CrossRef]
- Eveland-Sayers, B.M.; Farley, R.S.; Fuller, D.K.; Morgan, D.W.; Caputo, J.L. Physical fitness and academic achievement in elementary school children. J. Phys. Act. Health 2009, 6, 99–104. [Google Scholar] [CrossRef]
- Chen, L.J.; Fox, K.R.; Ku, P.W.; Taun, C.Y. Fitness change and subsequent academic performance in adolescents. J. Sch. Health 2013, 83, 631–638. [Google Scholar] [CrossRef]
- Hillman, C.H.; Erickson, K.I.; Kramer, A.F. Be smart, exercise your heart: Exercise effects on brain and cognition. Nat. Rev. Neurosci. 2008, 9, 58–65. [Google Scholar] [CrossRef]
- Jaakkola, T.T.; Sääkslahti, A.; Yli-Piipari, S.; Manninen, M.; Watt, A.; Liukkonen, J. Student motivation associated with fitness testing in the physical education context. J. Teach. Phys. Educ. 2013, 32, 270–286. [Google Scholar] [CrossRef] [Green Version]
- Biddle, S.J.; Atkin, A.J.; Cavill, N.; Foster, C. Correlates of physical activity in youth: A review of quantitative systematic reviews. Int. Rev. Sport Exerc. Psychol. 2011, 4, 25–49. [Google Scholar] [CrossRef]
- Moore, R.D.; Wu, C.T.; Pontifex, M.B.; O’Leary, K.C.; Scudder, M.R.; Raine, L.B.; Johnson, C.R.; Hillman, C.H. Aerobic fitness and intra-individual variability of neurocognition in preadolescent children. Brain Cogn. 2013, 82, 43–57. [Google Scholar] [CrossRef] [PubMed] [Green Version]
- Kutlu, M.; Yapıcı, H.; Yoncalık, O.; Celik, S. Comparison of a new test for agility and skill in soccer with other agility tests. J. Hum. Kinet. 2012, 33, 143–150. [Google Scholar] [CrossRef] [PubMed]
- Vestberg, T.; Reinebo, G.; Maurex, L.; Ingvar, M.; Petrovic, P. Core executive functions are associated with success in young elite soccer players. PLoS ONE 2017, 12, e0170845. [Google Scholar] [CrossRef] [PubMed]


| Test | Session One (Mean ± SD) | Session Two (Mean ± SD) | ICC (95% CI) | CV (%) (95% CI) |
|---|---|---|---|---|
| 10 m sprint (s) | 2.29 ± 0.23 | 2.28 ± 0.21 | 0.97 (0.94–0.99) | 2.2 (1.7–3.4) |
| 15 m sprint (s) | 3.39 ± 0.34 | 3.41 ± 0.34 | 1.00 (0.99–1.00) | 0.9 (0.7–1.5) |
| Agility T-half test (s) | 7.50 ± 0.92 | 7.83 ± 1.02 | 0.93 (0.68–0.98) | 4.2 (3.2–6.5) |
| SJ (cm) | 25.2 ± 6.5 | 25.7 ± 6.52 | 0.98 (0.96–0.99) | 1.6 (1.2–2.5) |
| CMJ (cm) | 28.2 ± 6.09 | 28.4 ± 5.99 | 1.00 (0.99–1.00) | 1.5 (1.1–2.3) |
| Static balance (s) | 20.8 ± 8.30 | 20.7 ± 7.60 | 0.98 (0.97–0.99) | 13.7 (10.7–23.1) |
| Mean ± SD | Range | |
|---|---|---|
| Physical Performance Parameters | ||
| 10 m sprint (s) | 2.29 ± 0.23 | 1.99–2.90 |
| 15 m sprint (s) | 3.39 ± 0.34 | 2.50–3.99 |
| Agility T-half test (s) | 7.50 ± 0.92 | 5.81–9.00 |
| SJ (cm) | 25.2 ± 6.53 | 14.8–36.0 |
| CMJ (cm) | 28.3 ± 6.01 | 16.7–36.0 |
| Postural balance (s) | 20.8 ± 8.3 | 9.0–37.0 |
| Yo-Yo IR1 (m) | 862 ± 251 | 440–1440 |
| Academic Attainment Parameters | ||
| Mathematics | 81 ± 9 | 65–95 |
| Science | 82 ± 9 | 70–98 |
| Mean ± SD | Range | |
|---|---|---|
| Height (m) | 1.43 ± 0.07 | 1.27–1.60 |
| Body mass (kg) | 41.7 ± 6.45 | 25.0–55.0 |
| Leg length (cm) | 73.1 ± 3.81 | 68.0–80.0 |
| Sitting height (cm) | 75.2 ± 3.73 | 68.0–83.0 |
| BMI (kg/m2) | 20.3 ± 2.82 | 15.2–26.2 |
| bicipital (mm) | 10.3 ± 3.96 | 4.00–21.0 |
| tricipital (mm) | 13.8 ± 5.20 | 6.00–27.0 |
| suprailiac (mm) | 11.5 ± 5.58 | 5.00–30.0 |
| subscapular (mm) | 11.4 ± 4.24 | 4.00–24.0 |
| Body fat (%) | 18.5 ± 3.84 | 9.45–28.0 |
| Y-PHV | 2.67 ± 0.80 | 1.12–4.05 |
| Intercorrelations (r) between Science/Mathematics and Anthropometrics | |||||||||||||||||
|---|---|---|---|---|---|---|---|---|---|---|---|---|---|---|---|---|---|
| Height | Weight | leg length | Sitting height | BMI | Bicipital | Tricipital | Suprailiac | Subscapular | Fat | Y-PHY | |||||||
| Mathematics | −0.041 | 0.436 | −0.056 | −0.243 | 0.540 | 0.427 | 0.314 | 0.476 | 0.589 | 0.560 | −0.047 | ||||||
| Science | −0.152 | 0.103 | −0.124 | −0.205 | 0.238 | 0.018 | 0.202 | 0.012 | 0.321 | 0.173 | 0.121 | ||||||
| Intercorrelations (r) between Science/Mathematics and Physical Performances | |||||||||||||||||
| 10 m sprint | 15 m sprint | Agility T-half test | SJ | CMJ | Static balance | Yo-Yo IR1 | |||||||||||
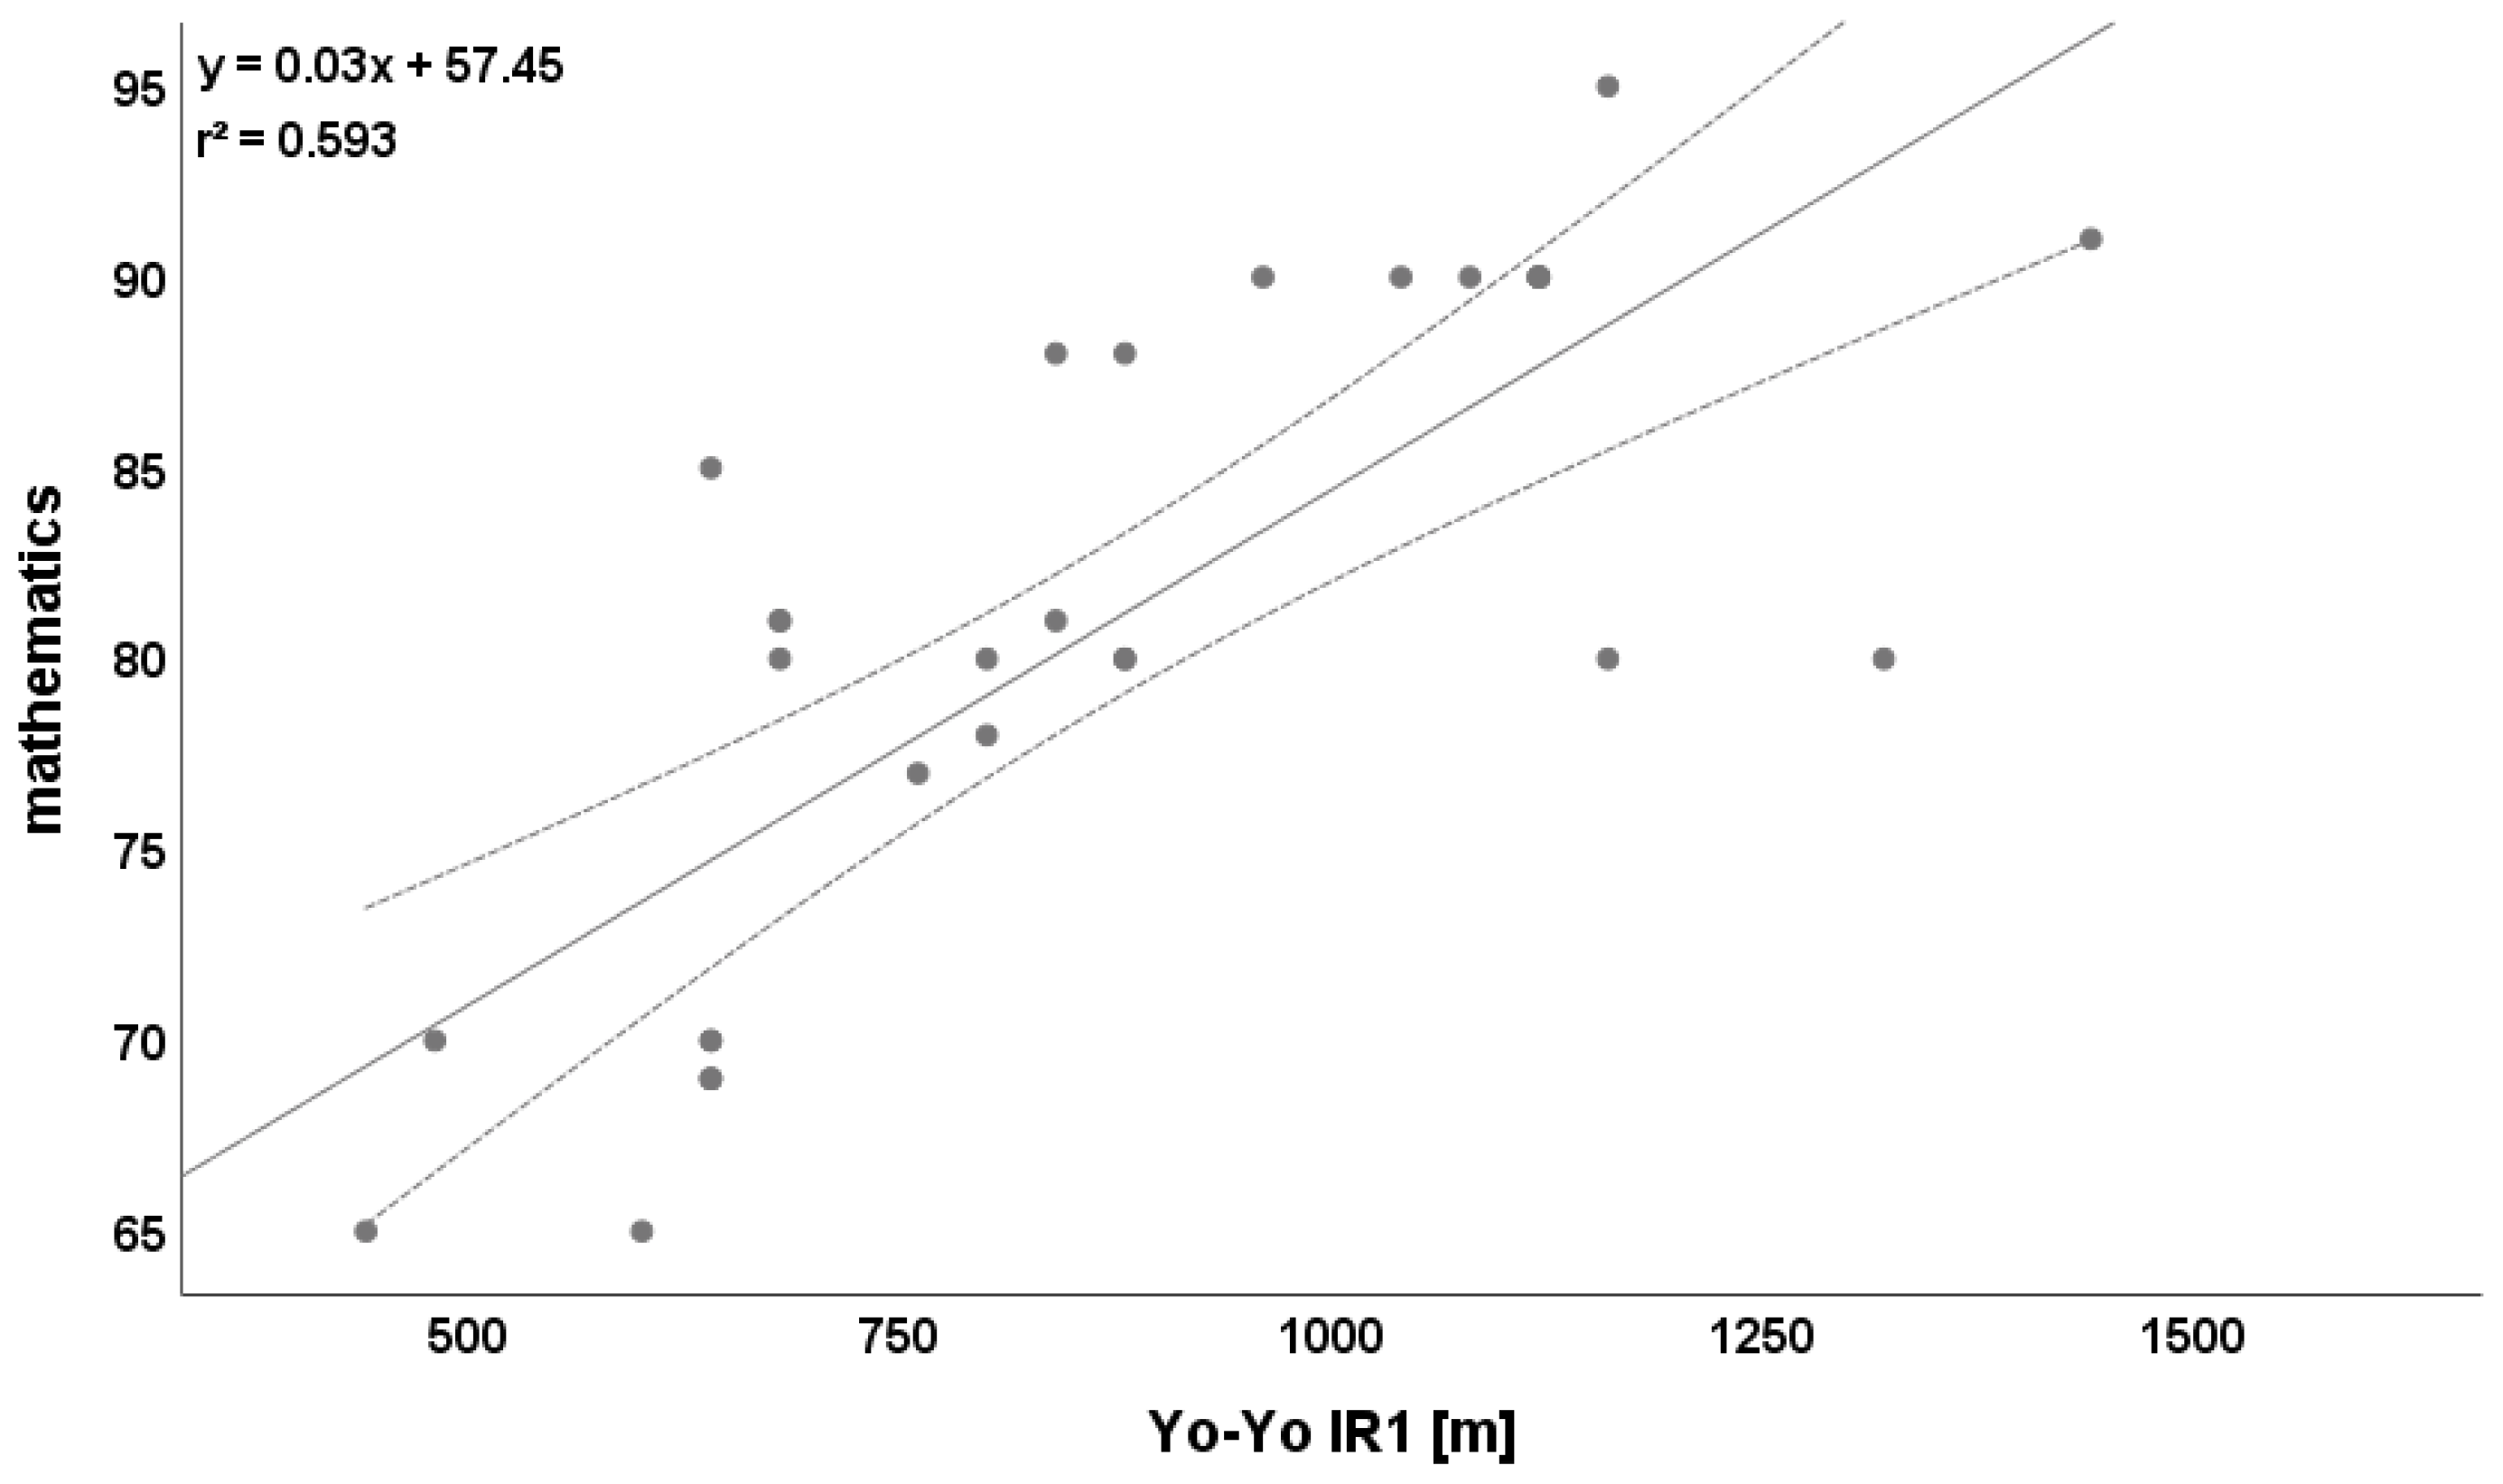
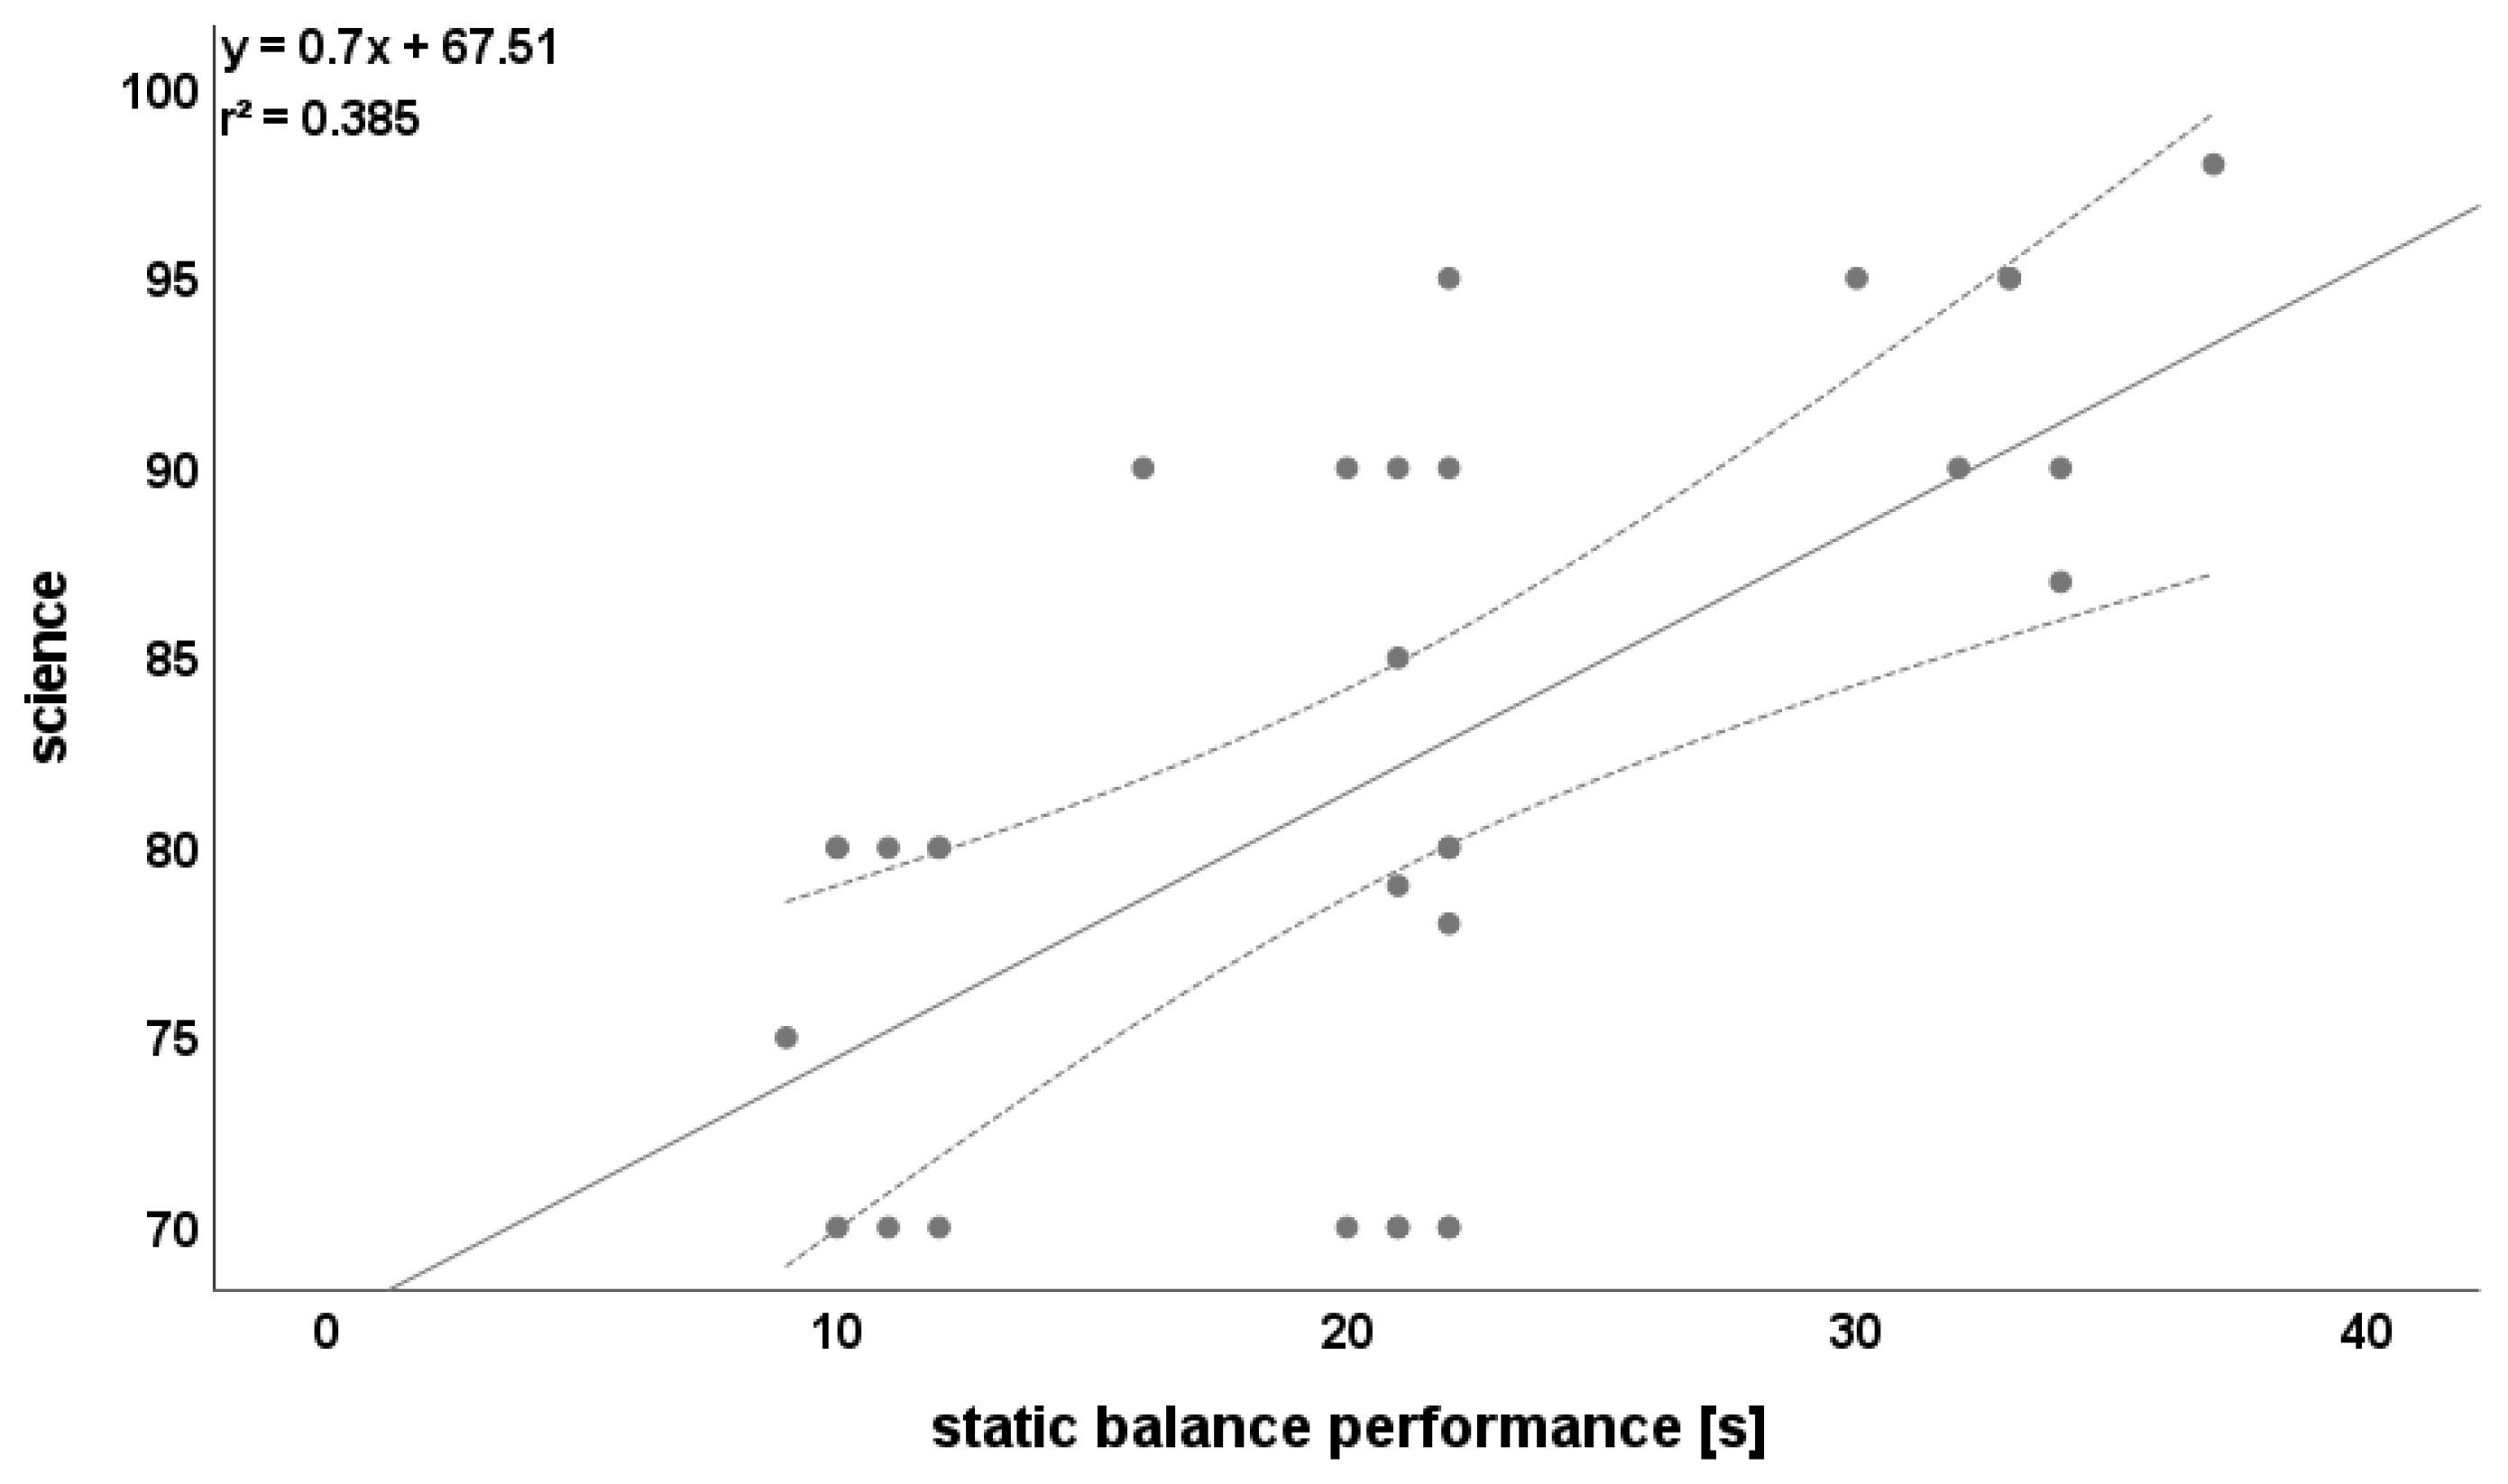
| Mathematics | 0.604 | 0.574 | 0.722 | 0.624 | 0.577 | 0.428 | 0.770 | ||||||||||
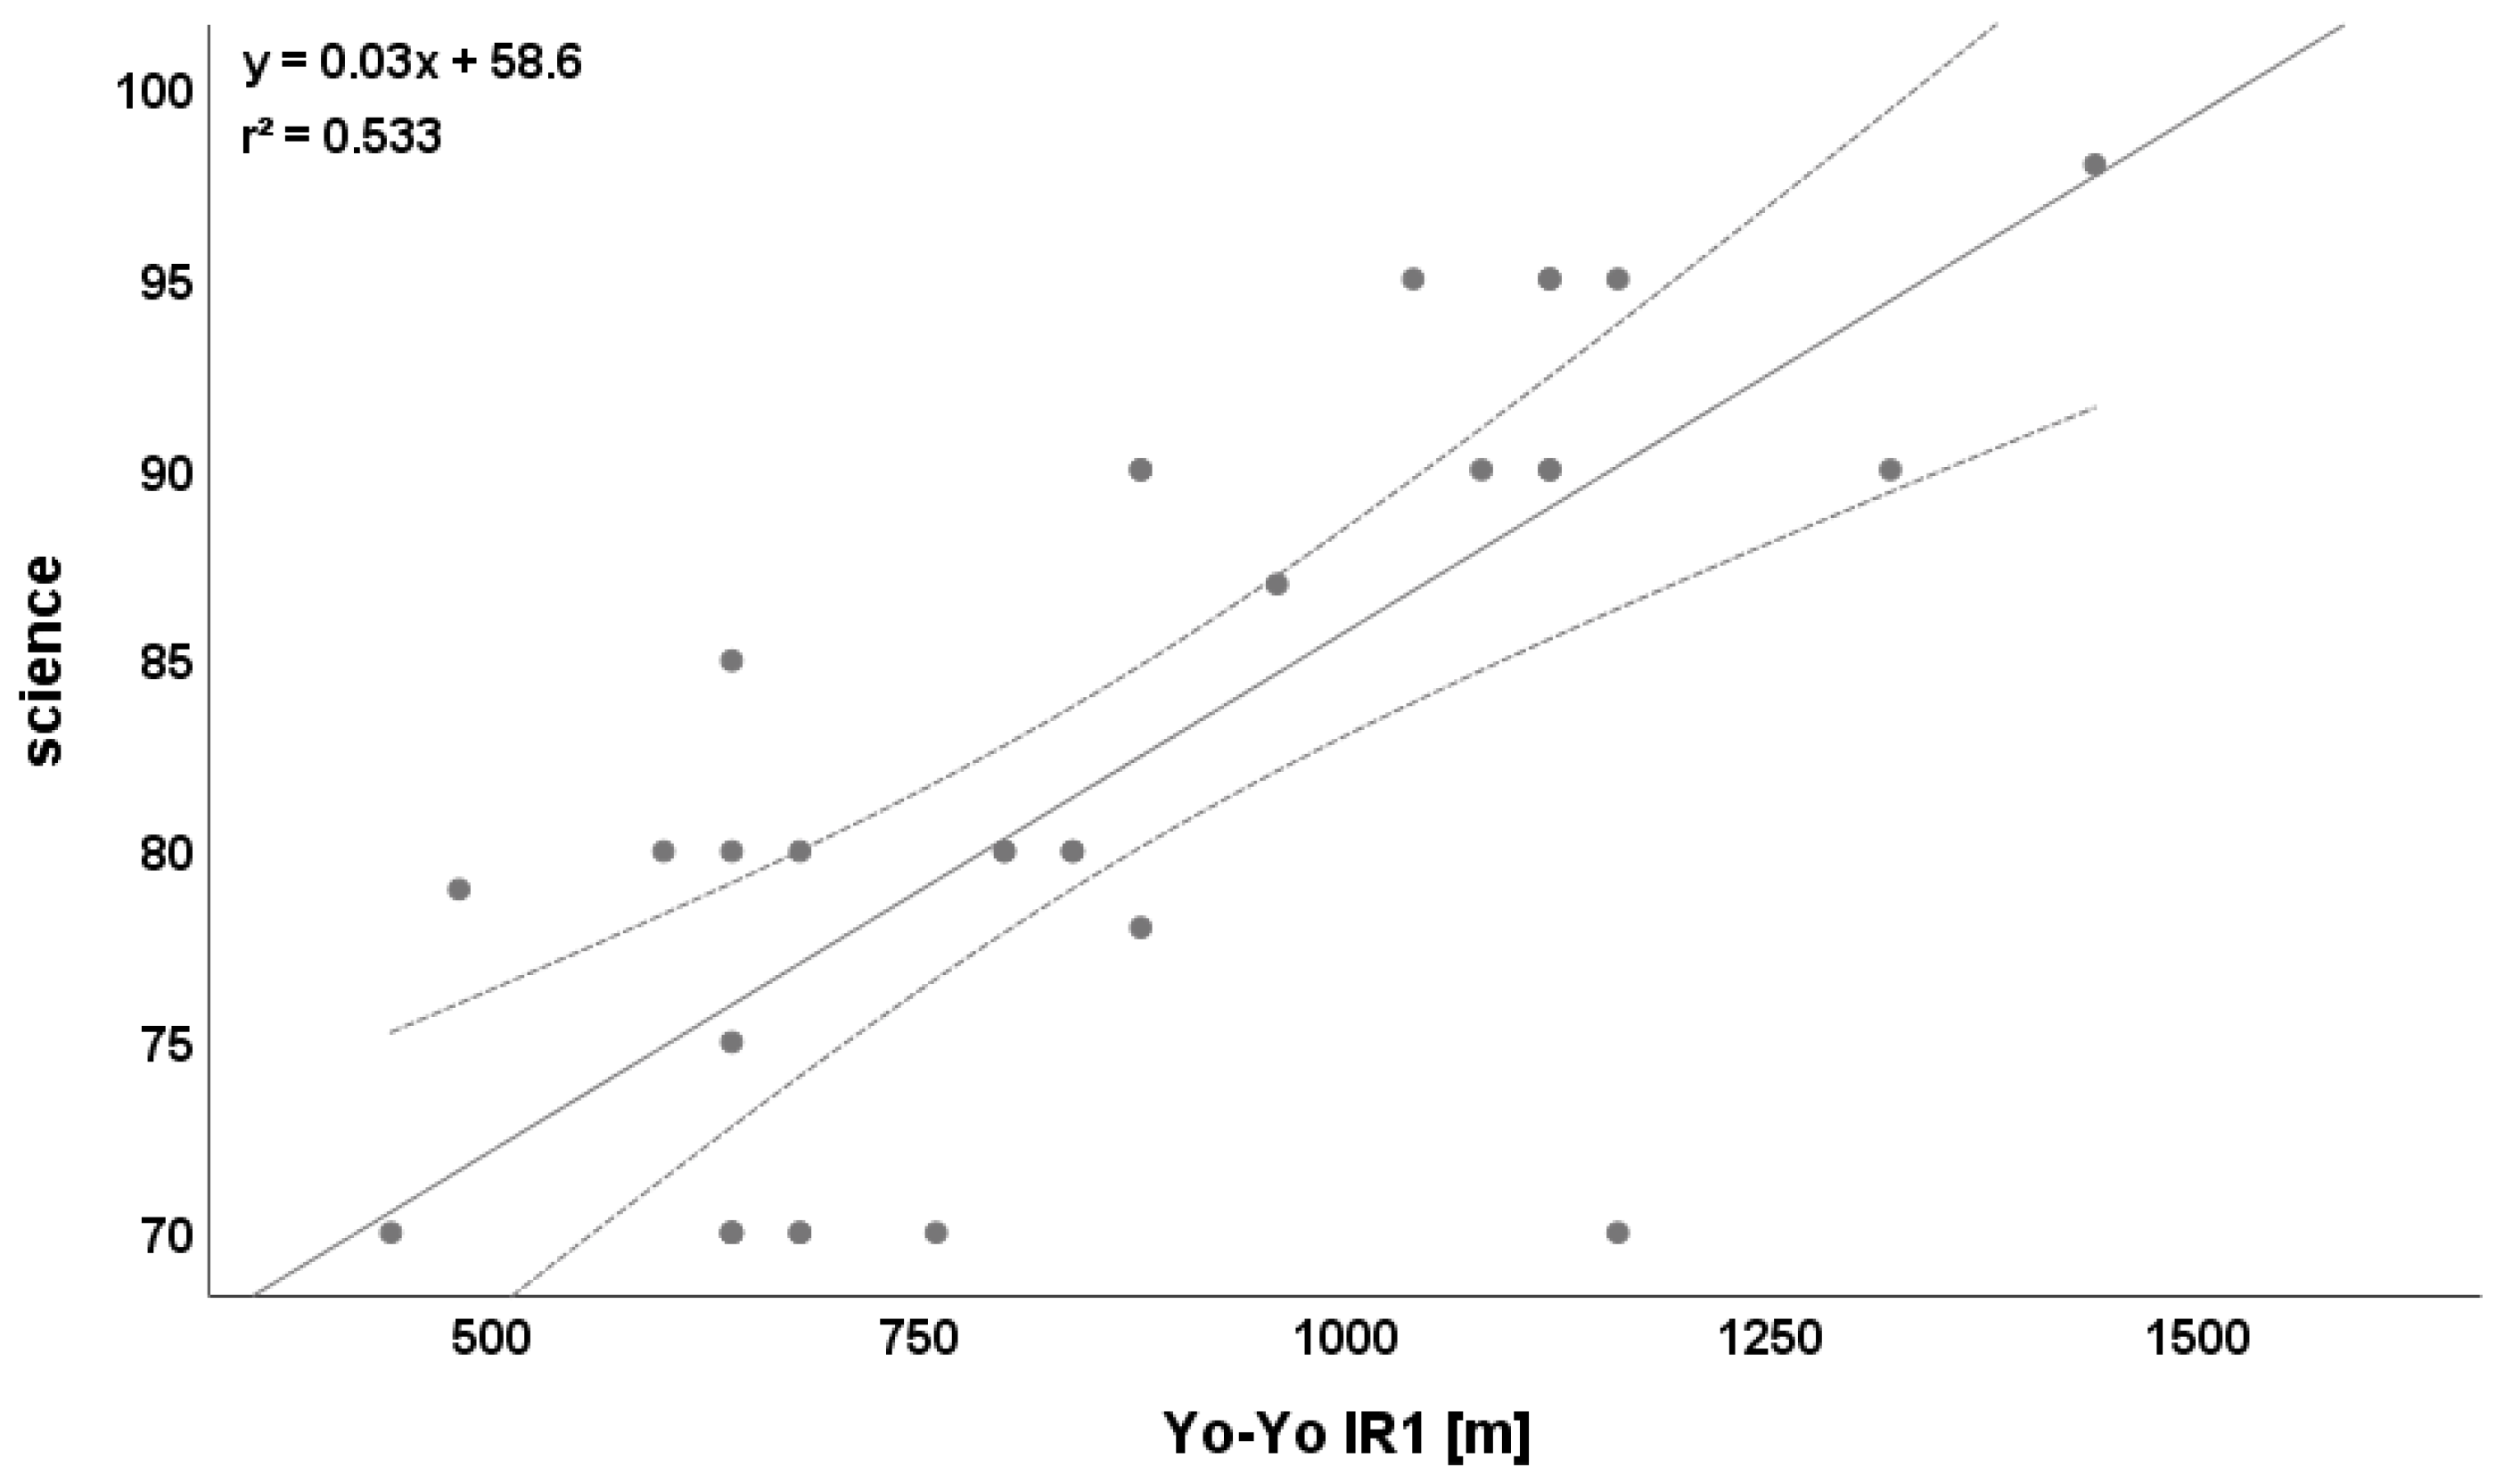
| Science | 0.280 | 0.466 | 0.370 | 0.258 | 0.155 | 0.620 | 0.730 | ||||||||||
Publisher’s Note: MDPI stays neutral with regard to jurisdictional claims in published maps and institutional affiliations. |
© 2022 by the authors. Licensee MDPI, Basel, Switzerland. This article is an open access article distributed under the terms and conditions of the Creative Commons Attribution (CC BY) license (https://creativecommons.org/licenses/by/4.0/).
Share and Cite
Hermassi, S.; Bartels, T.; Hayes, L.D.; Schwesig, R. Fitness, Fatness, and Academic Attainment in Male Schoolchildren from a Soccer Academy. Int. J. Environ. Res. Public Health 2022, 19, 3106. https://0-doi-org.brum.beds.ac.uk/10.3390/ijerph19053106
Hermassi S, Bartels T, Hayes LD, Schwesig R. Fitness, Fatness, and Academic Attainment in Male Schoolchildren from a Soccer Academy. International Journal of Environmental Research and Public Health. 2022; 19(5):3106. https://0-doi-org.brum.beds.ac.uk/10.3390/ijerph19053106
Chicago/Turabian StyleHermassi, Souhail, Thomas Bartels, Lawrence D. Hayes, and René Schwesig. 2022. "Fitness, Fatness, and Academic Attainment in Male Schoolchildren from a Soccer Academy" International Journal of Environmental Research and Public Health 19, no. 5: 3106. https://0-doi-org.brum.beds.ac.uk/10.3390/ijerph19053106