
Estimated Healthcare Costs of Melanoma and Keratinocyte Skin Cancers in Australia and Aotearoa New Zealand in 2021

 ,
,  , ,
, ,
Abstract
:1. Introduction
2. Materials and Methods
2.1. Overview
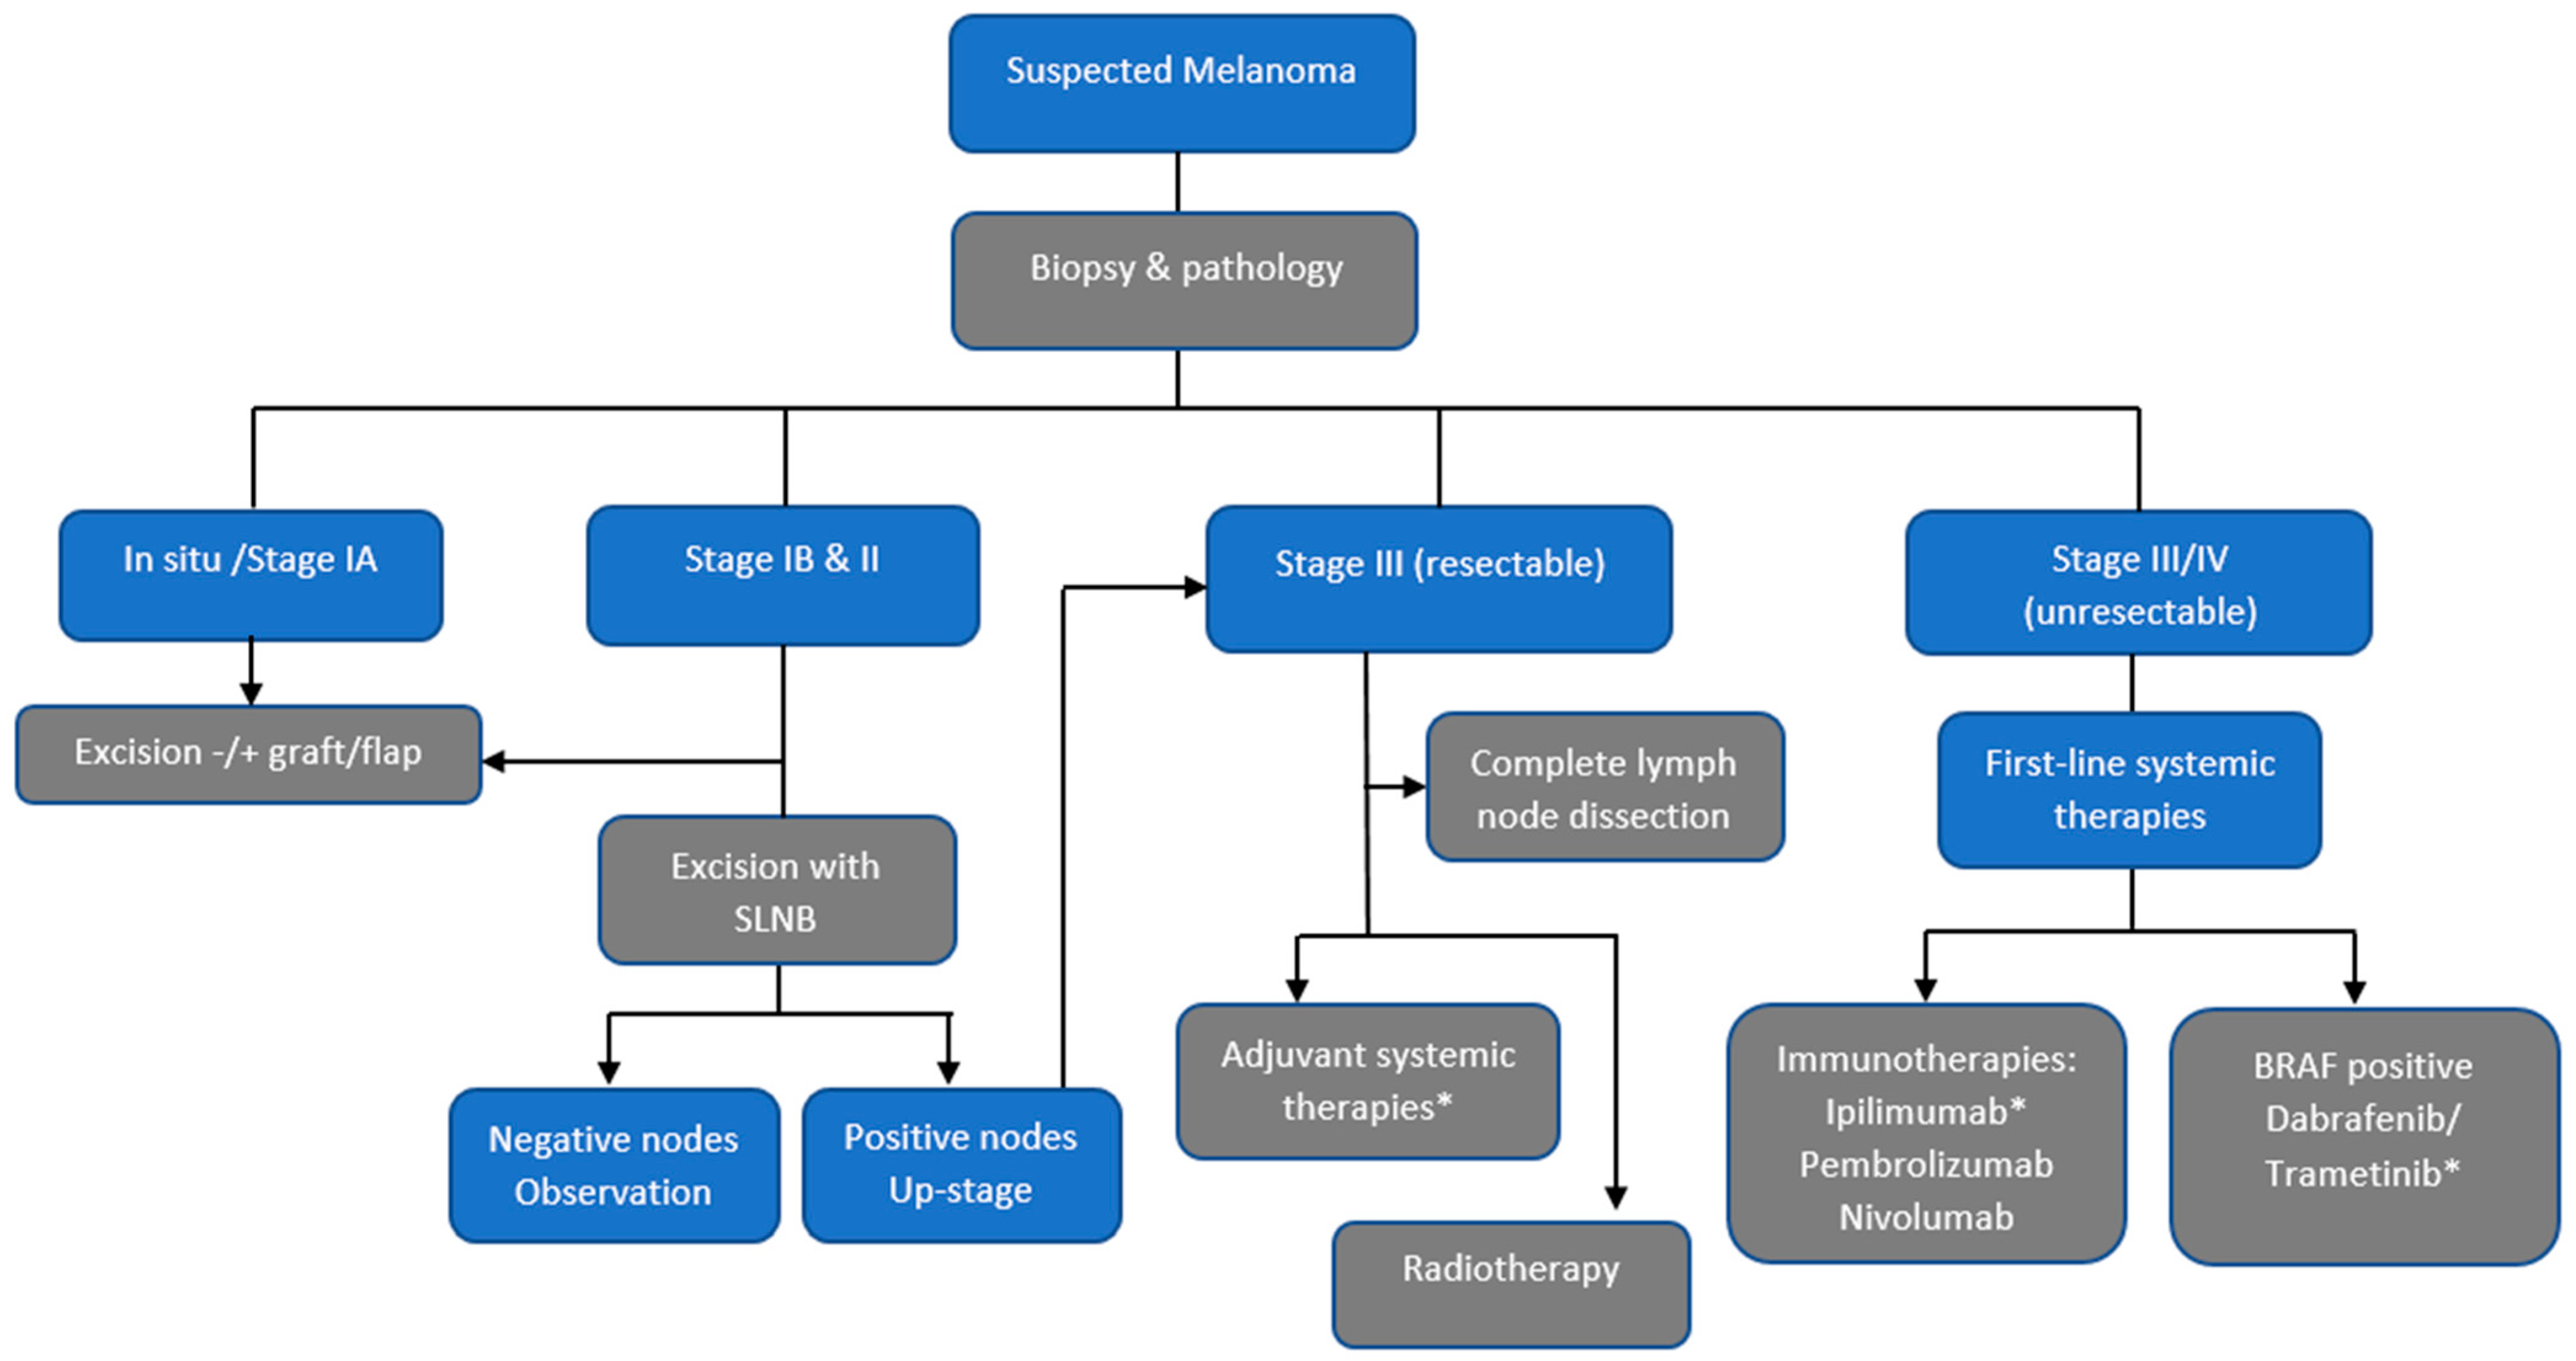
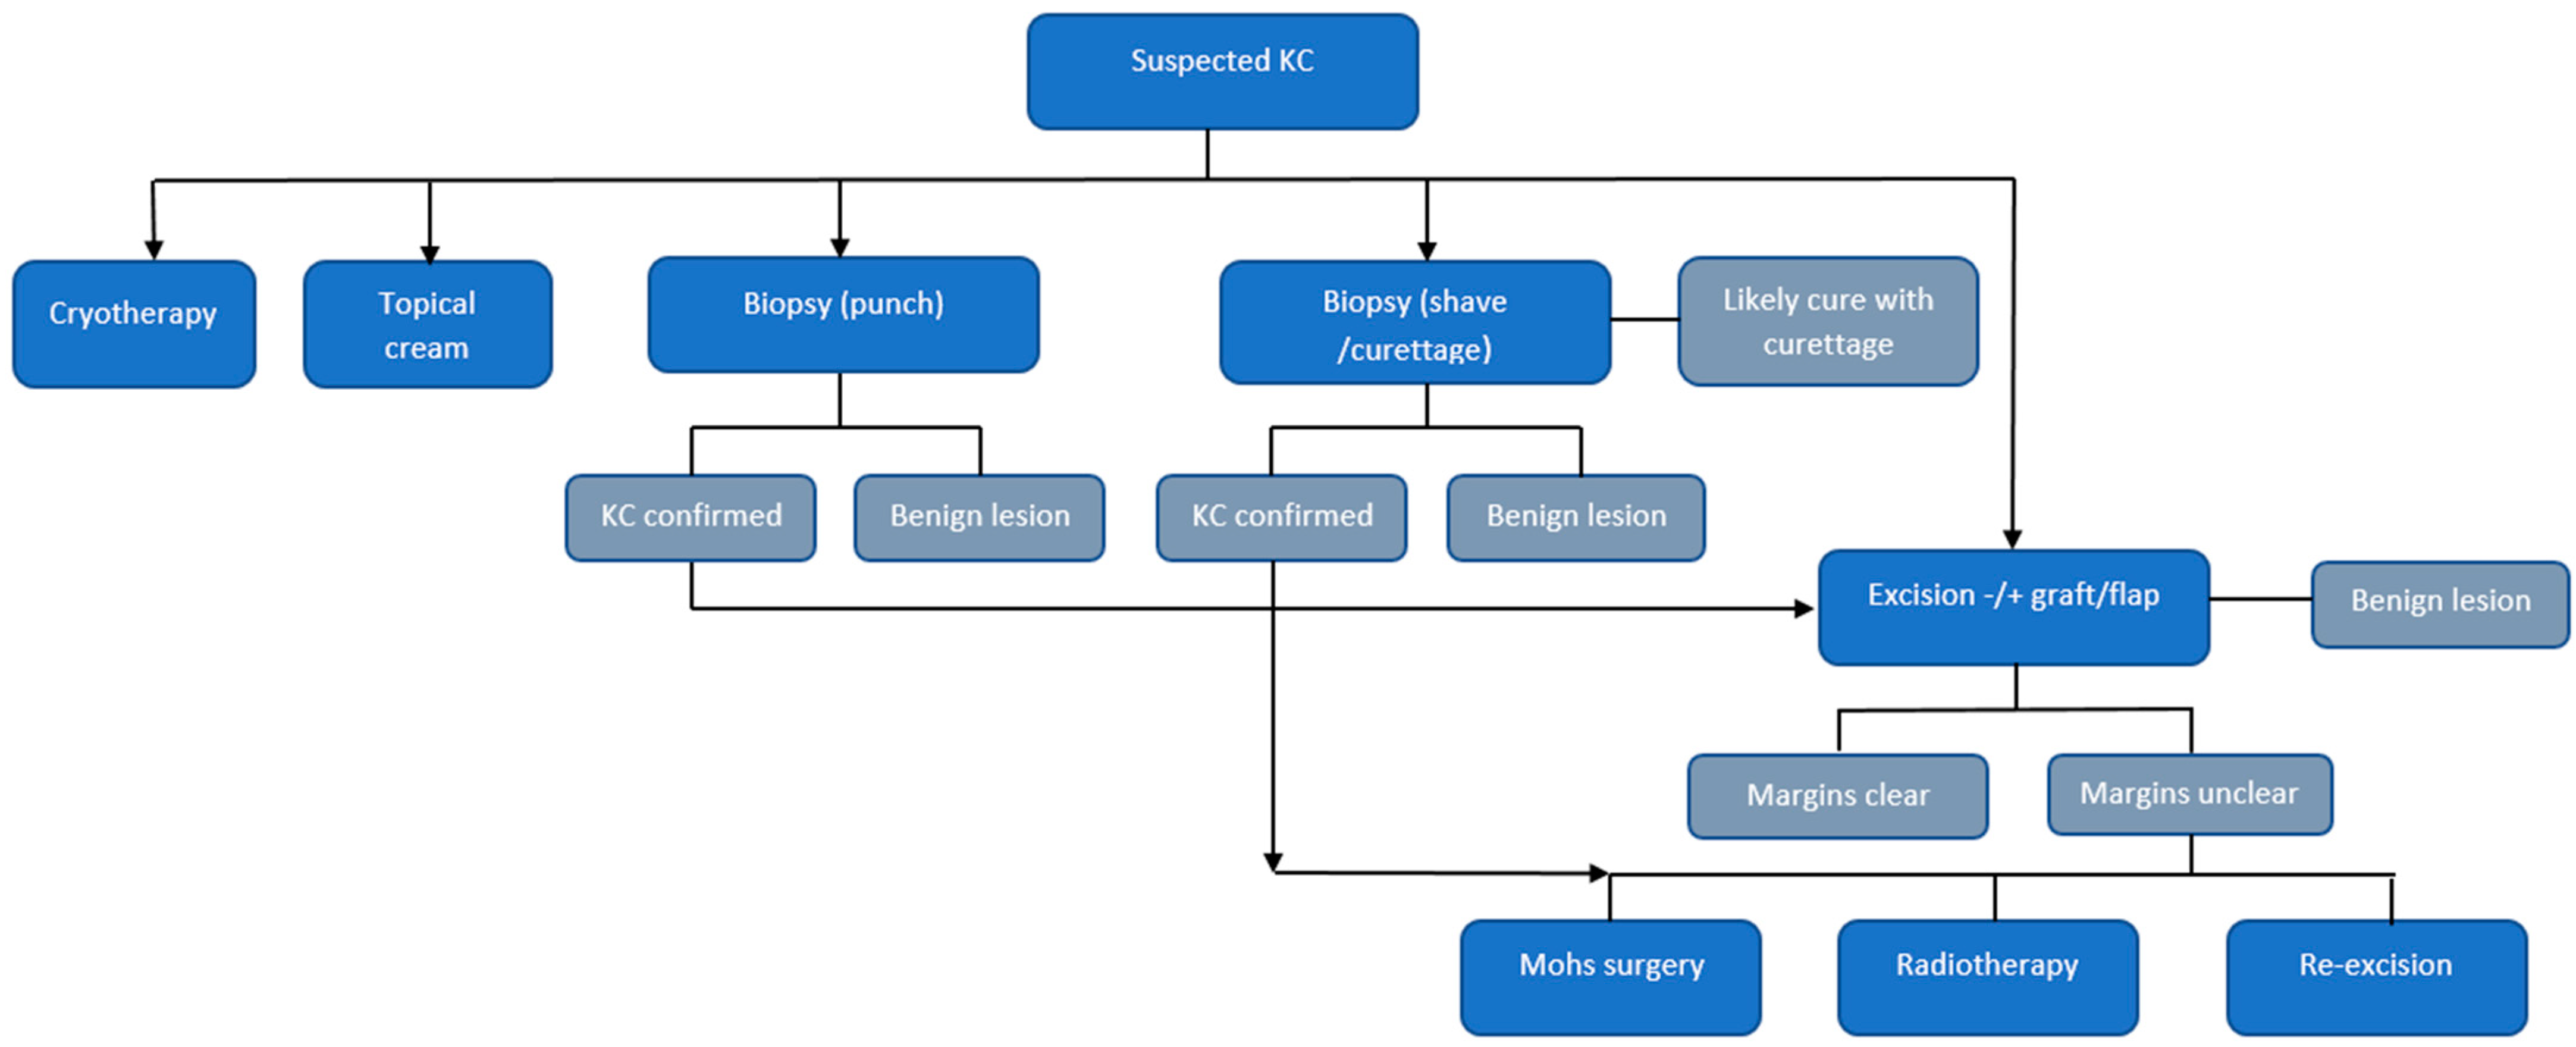
2.2. Model Structures
2.3. Data Sources
2.4. Probabilities
2.5. Costs
2.6. Analyses
3. Results
4. Discussion
Implications
5. Conclusions
Supplementary Materials
Author Contributions
Funding
Institutional Review Board Statement
Informed Consent Statement
Data Availability Statement
Acknowledgments
Conflicts of Interest
References
- International Agency for Research in Cancer (IARC). GLOBOCAN 2020. 2021. Available online: https://gco.iarc.fr/ (accessed on 10 November 2021).
- Australian Institute of Health and Welfare (AIHW). Cancer Data in Australia; Australian Institute of Health and Welfare: Canberra, Australia, 2021. [Google Scholar]
- Environmental Health Indicators. Melanoma Registrations 2020 Factsheet. 2020. Available online: https://www.ehinz.ac.nz/assets/Factsheets/Released_2020/Melanoma-Registrations-2020.pdf (accessed on 10 November 2021).
- Sneyd, M.J.; Gray, A. Expected Non Melanoma Skin (Keratinocytic) Cancer Incidence in New Zealand for 2018; Health Promotion Agency and Cancer Society of New Zealand: Wellington, New Zealand, 2018. [Google Scholar]
- Pandeya, N.; Olsen, C.M.; Whiteman, D.C. The incidence and multiplicity rates of keratinocyte cancers in Australia. Med. J. Aust. 2017, 207, 339–343. [Google Scholar] [CrossRef] [PubMed]
- Gordon, L.G.; Rowell, D. Health system costs of skin cancer and cost-effectiveness of skin cancer prevention and screening: A systematic review. Eur. J. Cancer Prev. 2015, 24, 141–149. [Google Scholar] [CrossRef] [PubMed]
- Services Australia. PBS Item Reports. 2021. Available online: http://medicarestatistics.humanservices.gov.au/statistics/pbs_item.jsp (accessed on 23 October 2021).
- Elliott, T.M.; Whiteman, D.C.; Olsen, C.M.; Gordon, L.G. Estimated Healthcare Costs of Melanoma in Australia Over 3 Years Post-Diagnosis. Appl. Health Econ. Health Policy 2017, 15, 805–816. [Google Scholar] [CrossRef] [PubMed]
- O’Dea, D. The Costs of Skin Cancer to New Zealand; University of Otago: Wellington, New Zealand, 2009. [Google Scholar]
- Australian Cancer Atlas. Cancer Council Queensland, Queensland University of Technology, Cooperative Research Centre for Spatial Information. Available online: http://atlas.cancer.org.au (accessed on 1 November 2018).
- Doran, C.M.; Ling, R.; Byrnes, J.; Crane, M.; Searles, A.; Perez, D.; Shakeshaft, A. Estimating the economic costs of skin cancer in New South Wales, Australia. BMC Public Health 2015, 15, 952. [Google Scholar] [CrossRef] [Green Version]
- Tinghog, G.; Carlsson, P.; Synnerstad, I.; Rosdahl, I. Societal cost of skin cancer in Sweden in 2005. Acta Derm.-Venereol. 2008, 88, 467–473. [Google Scholar] [CrossRef] [Green Version]
- Vallejo-Torres, L.; Morris, S.; Kinge, J.M.; Poirier, V.; Verne, J. Measuring current and future cost of skin cancer in England. J. Public Health 2014, 36, 140–148. [Google Scholar] [CrossRef] [PubMed]
- Husereau, D.; Drummond, M.; Petrou, S.; Carswell, C.; Moher, D.; Greenberg, D.; Augustovski, F.; Briggs, A.H.; Mauskopf, J.; Loder, E. Consolidated Health Economic Evaluation Reporting Standards (CHEERS) statement. Int. J. Technol. Assess. Health Care 2013, 29, 117–122. [Google Scholar] [CrossRef] [PubMed] [Green Version]
- Askew, D.A.; Wilkinson, D.; Schluter, P.J.; Eckert, K. Skin cancer surgery in Australia 2001–2005: The changing role of the general practitioner. Med. J. Aust. 2007, 187, 210–214. [Google Scholar] [CrossRef]
- Olsen, C.M.; Green, A.C.; Neale, R.E.; Webb, P.M.; Cicero, R.A.; Jackman, L.M.; O’Brien, S.M.; Perry, S.L.; Ranieri, B.A.; Whiteman, D.C. Cohort profile: The QSkin Sun and Health Study. Int. J. Epidemiol. 2012, 41, 929–929i. [Google Scholar] [CrossRef] [Green Version]
- Fleurence, R.L.; Hollenbeak, C.S. Rates and probabilities in economic modelling: Transformation, translation and appropriate application. Pharmacoeconomics 2007, 25, 3–6. [Google Scholar] [CrossRef]
- Cancer Council Australia Melanoma Guidelines Working Party. Clinical Practice Guidelines for the Diagnosis and Management of Melanoma. Available online: https://wiki.cancer.org.au/australia/Guidelines:Melanoma (accessed on 10 December 2021).
- Niebling, M.G.; Haydu, L.E.; Karim, R.Z.; Thompson, J.F.; Scolyer, R.A. Pathology review significantly affects diagnosis and treatment of melanoma patients: An analysis of 5011 patients treated at a melanoma treatment center. Ann. Surg. Oncol. 2014, 21, 2245–2251. [Google Scholar] [CrossRef]
- Ascierto, P.A.; Del Vecchio, M.; Mandalá, M.; Gogas, H.; Arance, A.M.; Dalle, S.; Cowey, C.L.; Schenker, M.; Grob, J.J.; Chiarion-Sileni, V.; et al. Adjuvant nivolumab versus ipilimumab in resected stage IIIB-C and stage IV melanoma (CheckMate 238): 4-year results from a multicentre, double-blind, randomised, controlled, phase 3 trial. Lancet Oncol. 2020, 21, 1465–1477. [Google Scholar] [CrossRef]
- Dummer, R.; Hauschild, A.; Santinami, M.; Atkinson, V.; Mandalà, M.; Kirkwood, J.M.; Chiarion Sileni, V.; Larkin, J.; Nyakas, M.; Dutriaux, C.; et al. Five-Year Analysis of Adjuvant Dabrafenib plus Trametinib in Stage III Melanoma. N. Engl. J. Med. 2020, 383, 1139–1148. [Google Scholar] [CrossRef] [PubMed]
- Hamid, O.; Robert, C.; Daud, A.; Hodi, F.S.; Hwu, W.J.; Kefford, R.; Wolchok, J.D.; Hersey, P.; Joseph, R.; Weber, J.S.; et al. Five-year survival outcomes for patients with advanced melanoma treated with pembrolizumab in KEYNOTE-001. Ann. Oncol. 2019, 30, 582–588. [Google Scholar] [CrossRef] [PubMed]
- Larkin, J.; Chiarion-Sileni, V.; Gonzalez, R.; Grob, J.J.; Rutkowski, P.; Lao, C.D.; Cowey, C.L.; Schadendorf, D.; Wagstaff, J.; Dummer, R.; et al. Five-Year Survival with Combined Nivolumab and Ipilimumab in Advanced Melanoma. N. Engl. J. Med. 2019, 381, 1535–1546. [Google Scholar] [CrossRef] [PubMed] [Green Version]
- Robert, C.; Grob, J.J.; Stroyakovskiy, D.; Karaszewska, B.; Hauschild, A.; Levchenko, E.; Chiarion Sileni, V.; Schachter, J.; Garbe, C.; Bondarenko, I.; et al. Five-Year Outcomes with Dabrafenib plus Trametinib in Metastatic Melanoma. N. Engl. J. Med. 2019, 381, 626–636. [Google Scholar] [CrossRef]
- Robert, C.; Long, G.V.; Brady, B.; Dutriaux, C.; Di Giacomo, A.M.; Mortier, L.; Rutkowski, P.; Hassel, J.C.; McNeil, C.M.; Kalinka, E.A.; et al. Five-Year Outcomes With Nivolumab in Patients With Wild-Type BRAF Advanced Melanoma. J. Clin. Oncol. 2020, 38, 3937–3946. [Google Scholar] [CrossRef]
- Australian Institute of Health and Welfare. Skin Cancer in Australia; AIHW: Canberra, Australia, 2016. [Google Scholar]
- Independent Hospital Pricing Authority. National Hospital Cost Data Collection Report, Public Sector, Round 22 (Financial Year 2017–18). 2020. Available online: https://www.ihpa.gov.au/what-we-do/nhcdc/public-sector. (accessed on 18 November 2021).
- Bates, N.; Callander, E.; Lindsay, D.; Watt, K. CancerCostMod: A model of the healthcare expenditure, patient resource use, and patient co-payment costs for Australian cancer patients. Health Econ. Rev. 2018, 8, 28. [Google Scholar] [CrossRef] [PubMed]
- Merollini, K.M.D.; Gordon, L.G.; Aitken, J.F.; Kimlin, M.G. Lifetime Costs of Surviving Cancer-A Queensland Study (COS-Q): Protocol of a Large Healthcare Data Linkage Study. Int. J. Environ. Res. Public Health 2020, 17, 2831. [Google Scholar] [CrossRef] [PubMed] [Green Version]
- Hansen, C.; Wilkinson, D.; Hansen, M.; Soyer, H.P. Factors contributing to incomplete excision of nonmelanoma skin cancer by Australian general practitioners. Arch. Dermatol. 2009, 145, 1253–1260. [Google Scholar] [CrossRef]
- Rolfe, H.M. Accuracy in skin cancer diagnosis: A retrospective study of an Australian public hospital dermatology department. Australas. J. Dermatol. 2012, 53, 112–117. [Google Scholar] [CrossRef] [PubMed]
- Coory, M.; Baade, P.; Aitken, J.; Smithers, M.; McLeod, G.R.; Ring, I. Trends for in situ and invasive melanoma in Queensland, Australia, 1982–2002. Cancer Causes Control. 2006, 17, 21–27. [Google Scholar] [CrossRef] [PubMed]
- Blakely, T.; Atkinson, J.; Kvizhinadze, G.; Wilson, N.; Davies, A.; Clarke, P. Patterns of cancer care costs in a country with detailed individual data. Med. Care 2015, 53, 302–309. [Google Scholar] [CrossRef] [Green Version]
- Zealand, N.; Wright, C.; Hislop, R. The Price of Cancer: The public Price of Registered Cancer in New Zealand; Ministry of Health: Wellington, New Zealand, 2011. [Google Scholar]
- Australian Institute of Health and Welfare (AIHW). Disease Expenditure in Australia 2018–19; Australian Institute of Health and Welfare: Canberra, Australia, 2021. [Google Scholar]
- Australian Institute of Health and Welfare (AIHW). Health Expenditure Australia 2018–19; Australian Institute of Health and Welfare: Canberra, Australia, 2020. [Google Scholar]
- Gaulin, C.; Sebaratnam, D.F.; Fernandez-Penas, P. Quality of life in non-melanoma skin cancer. Australas. J. Dermatol. 2015, 56, 70–76. [Google Scholar] [CrossRef]
- Olsen, C.M.; Wilson, L.F.; Green, A.C.; Bain, C.J.; Fritschi, L.; Neale, R.E.; Whiteman, D.C. Cancers in Australia attributable to exposure to solar ultraviolet radiation and prevented by regular sunscreen use. Aust. New Zealand J. Public Health 2015, 39, 471–476. [Google Scholar] [CrossRef] [Green Version]
- Iannacone, M.R.; Youlden, D.R.; Baade, P.D.; Aitken, J.F.; Green, A.C. Melanoma incidence trends and survival in adolescents and young adults in Queensland, Australia. Int. J. Cancer 2014, 136, 603–609. [Google Scholar] [CrossRef] [Green Version]
- OECD. What Future for Health Spending? OECD Economics Department Policy Notes, No. 19. 2013. Available online: https://www.oecd.org/economy/health-spending.pdf (accessed on 16 November 2021).
- Health Workforce New Zealand. Dermatology Workforce Service Forecast. 2014. Available online: https://www.health.govt.nz/our-work/health-workforce/workforce-service-forecasts/dermatology-workforce-service-forecast (accessed on 17 November 2021).
- Australia’s Future Health Workforce—Dermatology. 2017. Available online: https://www.health.gov.au/resources/publications/dermatology-australias-future-health-workforce-report (accessed on 17 November 2021).
- Shih, S.T.; Carter, R.; Sinclair, C.; Mihalopoulos, C.; Vos, T. Economic evaluation of skin cancer prevention in Australia. Prev. Med. 2009, 49, 449–453. [Google Scholar] [CrossRef]
- Gordon, L.G.; Scuffham, P.A.; van der Pols, J.C.; McBride, P.; Williams, G.M.; Green, A.C. Regular sunscreen use is a cost-effective approach to skin cancer prevention in subtropical settings. J. Investig. Dermatol. 2009, 129, 2766–2771. [Google Scholar] [CrossRef]
- Hirst, N.G.; Gordon, L.G.; Scuffham, P.A.; Green, A.C. Lifetime cost-effectiveness of skin cancer prevention through promotion of daily sunscreen use. Value Health 2012, 15, 261–268. [Google Scholar] [CrossRef] [Green Version]
- Rapport, F.; Smith, A.L.; Cust, A.E.; Mann, G.J.; Watts, C.G.; Gyorki, D.E.; Henderson, M.; Hong, A.M.; Kelly, J.W.; Long, G.V.; et al. Identifying challenges to implementation of clinical practice guidelines for sentinel lymph node biopsy in patients with melanoma in Australia: Protocol paper for a mixed methods study. BMJ Open 2020, 10, e032636. [Google Scholar] [CrossRef] [Green Version]
- Leeneman, B.; Schreuder, K.; Uyl-de Groot, C.A.; van Akkooi, A.C.J.; Haanen, J.; Wakkee, M.; Franken, M.G.; Louwman, M.W.J. Stage-specific trends in incidence and survival of cutaneous melanoma in the Netherlands (2003–2018): A nation-wide population-based study. Eur. J. Cancer 2021, 154, 111–119. [Google Scholar] [CrossRef]
- Aitken, J.F.; Youlden, D.R.; Baade, P.D.; Soyer, H.P.; Green, A.C.; Smithers, B.M. Generational shift in melanoma inci-dence and mortality in Queensland, Australia, 1995–2014. Int. J. Cancer 2018, 142, 1528–1535. [Google Scholar] [CrossRef] [PubMed]
- Gershenwald, J.E.; Scolyer, R.A.; Hess, K.R.; Sondak, V.K.; Long, G.V.; Ross, M.I.; Lazar, A.J.; Faries, M.B.; Kirkwood, J.M.; McArthur, G.A.; et al. Melanoma staging: Evidence-based changes in the American Joint Committee on Cancer eighth edition cancer staging manual. CA Cancer J. Clin. 2017, 67, 472–492. [Google Scholar] [CrossRef] [PubMed] [Green Version]
- Nelson, K.C.; Swetter, S.M.; Saboda, K.; Chen, S.C.; Curiel-Lewandrowski, C. Evaluation of the Number-Needed-to-Biopsy Metric for the Diagnosis of Cutaneous Melanoma: A Systematic Review and Meta-analysis. JAMA Dermatol. 2019, 155, 1167–1174. [Google Scholar] [CrossRef]
- Chia, A.L.; Simonova, G.; Dutta, B.; Lim, A.; Shumack, S. Melanoma diagnosis: Australian dermatologists’ number needed to treat. Australas J. Dermatol. 2008, 49, 12–15. [Google Scholar] [CrossRef]


| NSW | VIC | QLD | WA | SA | TAS | NT | ACT | AUST. ($AU) | NZ ($NZ) | |
|---|---|---|---|---|---|---|---|---|---|---|
| Est. 2021 population (million) | 8.2 | 6.7 | 5.2 | 1.8 | 2.7 | 0.5 | 0.2 | 0.4 | 25.7 | 5.1 |
| Melanoma | ||||||||||
| Melanoma incidence 1 per 100,000 persons | 61.1 | 51.0 | 81.1 | 62.0 | 46.4 | 58.5 | 54.7 | 56.5 | 62.4 | 62.4 |
| Est. no. persons with invasive melanoma | 5000 | 3404 | 4222 | 1100 | 1242 | 317 | 135 | 244 | 16,878 | 3197 |
| Est. no. persons with in situ melanoma | 5000 | 3404 | 4222 | 1100 | 1242 | 317 | 135 | 244 | 16,878 | 3197 |
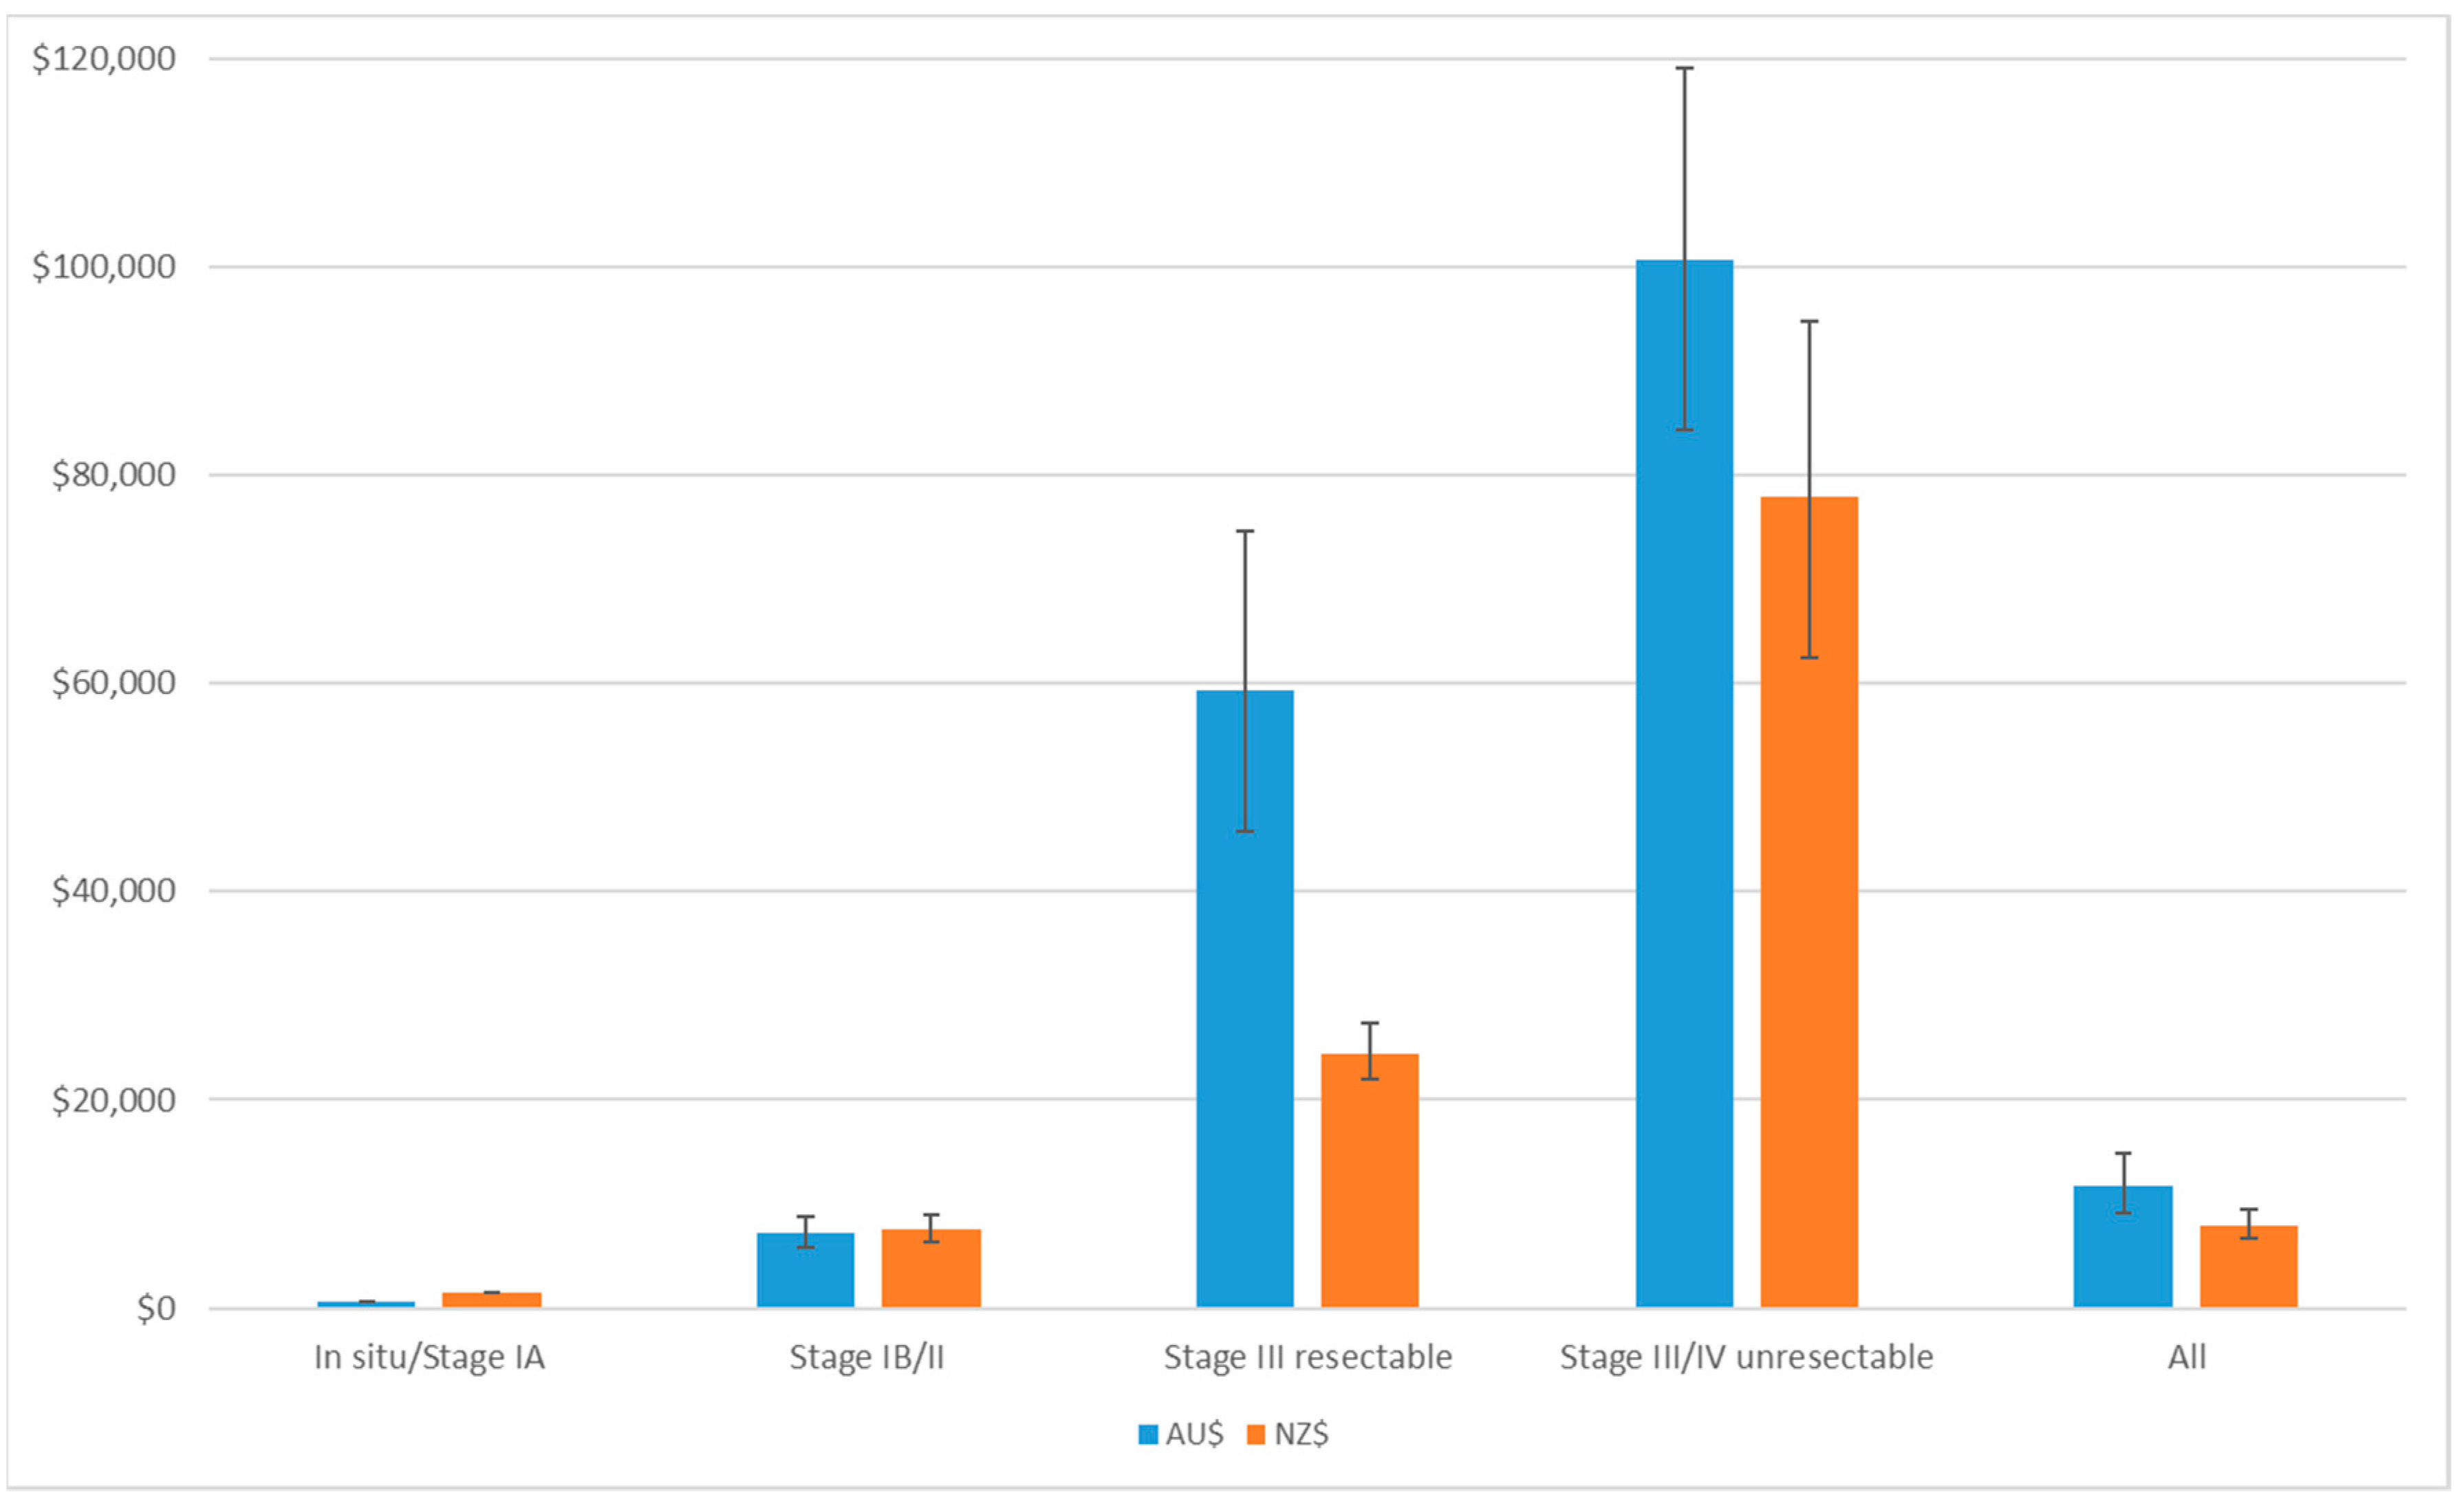
| Annual mean cost per melanoma (all stages) | $11,787 | $8001 | ||||||||
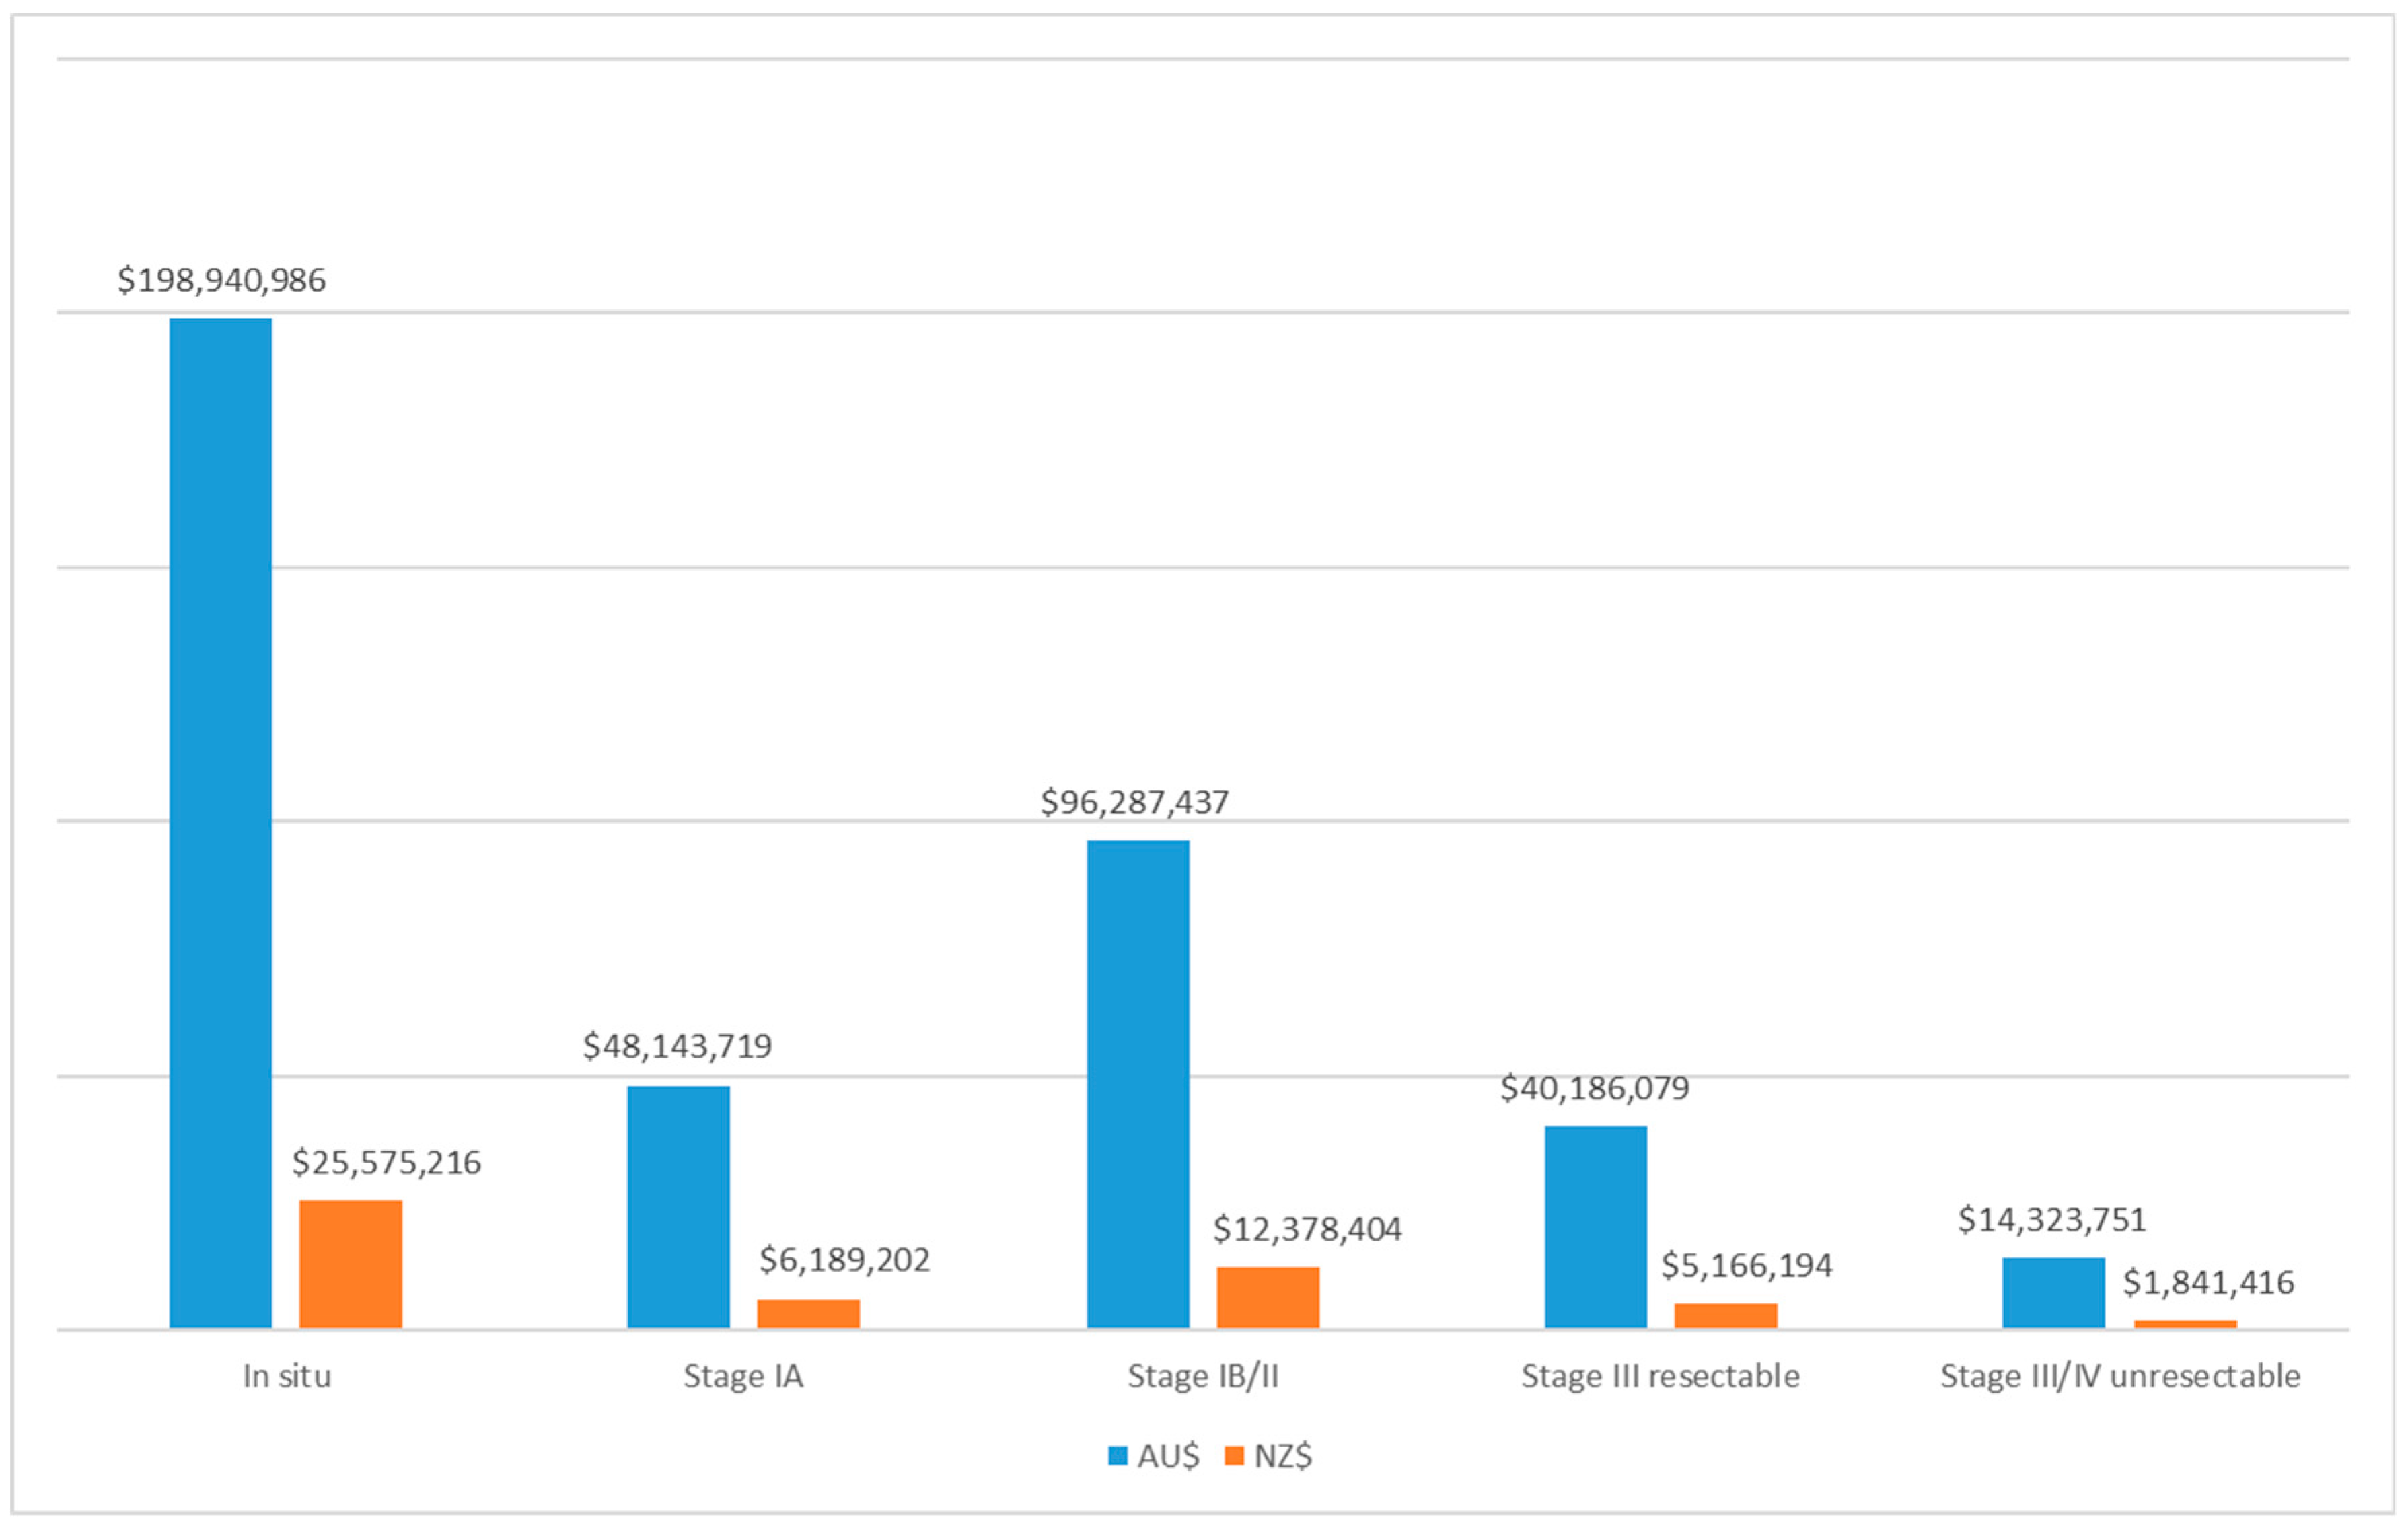
| Total cost for melanoma (million) | $117.9 | $80.2 | $99.5 | $25.9 | $29.3 | $7.5 | $3.2 | $5.8 | $397.9 | $51.2 |
| Keratinocyte cancers | ||||||||||
| Incidence of KC per 100,000 persons (lesion-based) 2 | 2799 | 1638 | 6174 | 2055 | 2620 | 133 | 174 | 148 | 3154 | 2165 |
| Estimated no. persons with KC 3 (1000) | 229.2 | 109.3 | 321.4 | 36.5 | 70.1 | 0.722 | 0.429 | 0.639 | 812.1 | 110.9 |
| Mean cost per KC to Aust/NZ Govt | $525 | $1167 | ||||||||
| Total cost for KC to Medicare (million) | $120.3 | $57.4 | $168.7 | $19.1 | $36.8 | $0.4 | $0.2 | $0.3 | $426.2 | $129.4 |
| Total annual cost of skin cancer (million) | $238.2 | $137.6 | $268.2 | $45.1 | $66.1 | $7.9 | $3.4 | $6.1 | $824.0 | $180.5 |
| 2021 | 2022 | 2023 | 2024 | 2025 | |
|---|---|---|---|---|---|
| Australia | |||||
| Melanoma | |||||
| First incident cases of melanoma 1 (person-based) | 33,756 | 34,063 | 34,373 | 34,686 | 35,001 |
| Continuing cohorts (minus deaths) | 0 | 32,441 | 63,884 | 94,395 | 124,067 |
| Cost of first incident cases | $397.9 | $409.6 | $413.3 | $417.1 | $420.9 |
| Cost of subsequent episodes of melanoma | $0 | $16.1 | $28.2 | $37.9 | $45.9 |
| Total melanoma cost | $397.9 | $425.7 | $441.6 | $455.1 | $466.8 |
| KC | |||||
| First incident cases of KCs (person-based) | 812,103 | 819,491 | 826,946 | 834,470 | 842,061 |
| Continuing cohorts (minus deaths) | 0 | 811,343 | 1,629,284 | 2,453,858 | 3,285,103 |
| Cost of first incident cases | $426.2 | $438.7 | $442.7 | $446.7 | $450.8 |
| Cost of subsequent episodes of KCs | $0 | $66.6 | $131.0 | $192.0 | $250.0 |
| Total KC cost | $426.2 | $505.3 | $573.7 | $638.7 | $700.8 |
| Total Melanoma and KC cost (AU$) | $824.0 | $931.0 | $1015.3 | $1093.8 | $1167.6 |
| New Zealand | |||||
| Melanoma | |||||
| First incident cases of melanoma (person-based) | 6393 | 6451 | 6510 | 6569 | 6629 |
| Continuing cohorts (minus deaths) | 0 | 6031 | 11,758 | 17,182 | 22,303 |
| Cost of first incident cases | $51.2 | $51.6 | $52.1 | $52.6 | $53.0 |
| Cost of subsequent episodes of melanoma | $0 | $5.2 | $9.7 | $13.9 | $17.6 |
| Total melanoma cost | $51.2 | $56.8 | $61.8 | $66.5 | $70.7 |
| KC | |||||
| First incident cases of KCs (person-based) | 110,884 | 111,893 | 112,911 | 113,938 | 114,974 |
| Continuing cohorts (minus deaths) | 0 | 110,727 | 222,305 | 334,745 | 448,055 |
| Cost of first incident cases | $129.4 | $130.5 | $131.7 | $132.9 | $134.1 |
| Cost of subsequent episodes of KCs | $0 | $0.111 | $0.222 | $0.335 | $0.448 |
| Total KC cost | $129.4 | $154.6 | $179.1 | $202.4 | $224.7 |
| Total Melanoma and KC cost (NZ$) | $180.5 | $211.4 | $240.9 | $268.9 | $295.3 |
Publisher’s Note: MDPI stays neutral with regard to jurisdictional claims in published maps and institutional affiliations. |
© 2022 by the authors. Licensee MDPI, Basel, Switzerland. This article is an open access article distributed under the terms and conditions of the Creative Commons Attribution (CC BY) license (https://creativecommons.org/licenses/by/4.0/).
Share and Cite
Gordon, L.G.; Leung, W.; Johns, R.; McNoe, B.; Lindsay, D.; Merollini, K.M.D.; Elliott, T.M.; Neale, R.E.; Olsen, C.M.; Pandeya, N.; et al. Estimated Healthcare Costs of Melanoma and Keratinocyte Skin Cancers in Australia and Aotearoa New Zealand in 2021. Int. J. Environ. Res. Public Health 2022, 19, 3178. https://0-doi-org.brum.beds.ac.uk/10.3390/ijerph19063178
Gordon LG, Leung W, Johns R, McNoe B, Lindsay D, Merollini KMD, Elliott TM, Neale RE, Olsen CM, Pandeya N, et al. Estimated Healthcare Costs of Melanoma and Keratinocyte Skin Cancers in Australia and Aotearoa New Zealand in 2021. International Journal of Environmental Research and Public Health. 2022; 19(6):3178. https://0-doi-org.brum.beds.ac.uk/10.3390/ijerph19063178
Chicago/Turabian StyleGordon, Louisa G., William Leung, Richard Johns, Bronwen McNoe, Daniel Lindsay, Katharina M. D. Merollini, Thomas M. Elliott, Rachel E. Neale, Catherine M. Olsen, Nirmala Pandeya, and et al. 2022. "Estimated Healthcare Costs of Melanoma and Keratinocyte Skin Cancers in Australia and Aotearoa New Zealand in 2021" International Journal of Environmental Research and Public Health 19, no. 6: 3178. https://0-doi-org.brum.beds.ac.uk/10.3390/ijerph19063178