
Mechanical Differences between Men and Women during Overground Load Carriage at Self-Selected Walking Speeds

 , , , , , and
Abstract
:1. Introduction
2. Materials and Methods
2.1. Participants
2.2. Experimental Protocol
2.3. Motion Capture
2.4. Statistical Analyses
3. Results
4. Discussion
5. Conclusions
Author Contributions
Funding
Institutional Review Board Statement
Informed Consent Statement
Data Availability Statement
Acknowledgments
Conflicts of Interest
Appendix A


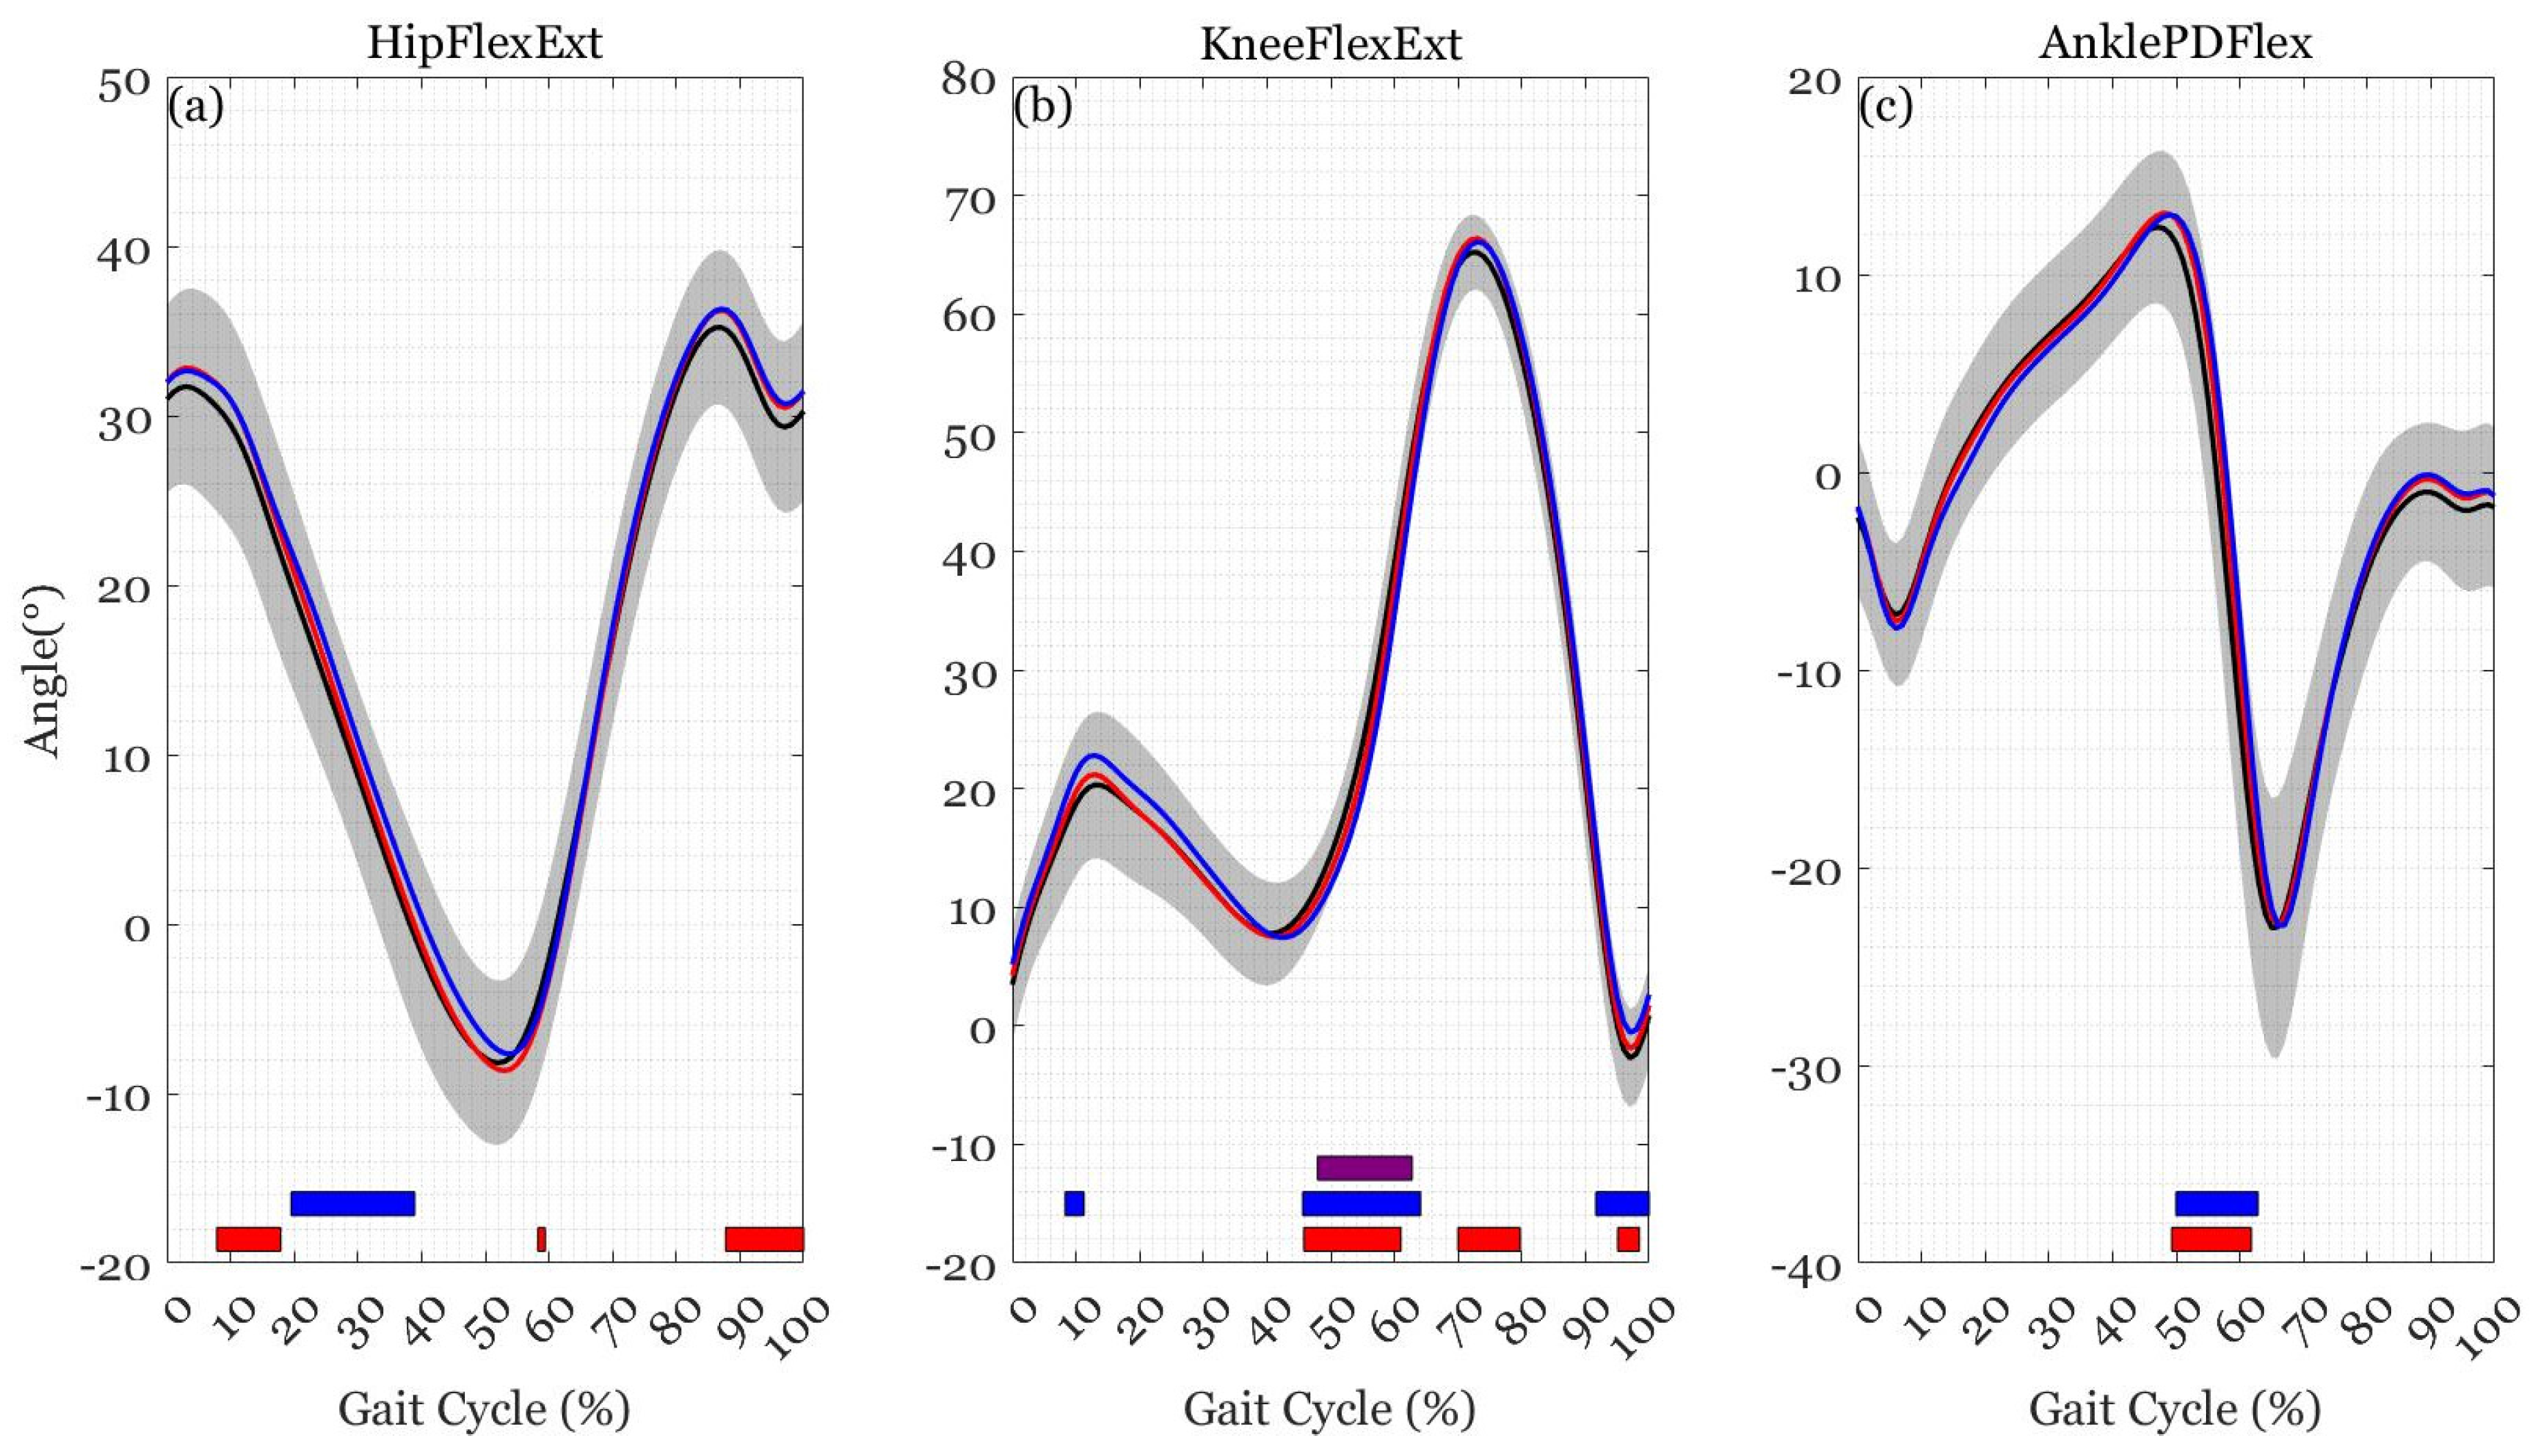
| Joint Angle | 0%BM–20%BM | 0%BM–40%BM | 20%BM–40%BM | |||
|---|---|---|---|---|---|---|
| %Cycle | Direction | %Cycle | Direction | %Cycle | Direction | |
| Hip flexion-extension | 8–18 | ↑ | 20–39 | ↑ | - | - |
| 58–59 | ↓ | - | - | - | - | |
| 88–100 | ↑ | - | - | - | - | |
| Knee flexion-extension | 46–61 | ↓ | 8–11 | ↑ | 48–63 | ↓ |
| 70–80 | ↑ | 46–64 | ↓ | - | - | |
| 95–98 | ↑ | 92–100 | ↑ | - | - | |
| Ankle plantar-dorsi flexion | 49–62 | ↑ | 50–63 | ↑ | - | - |
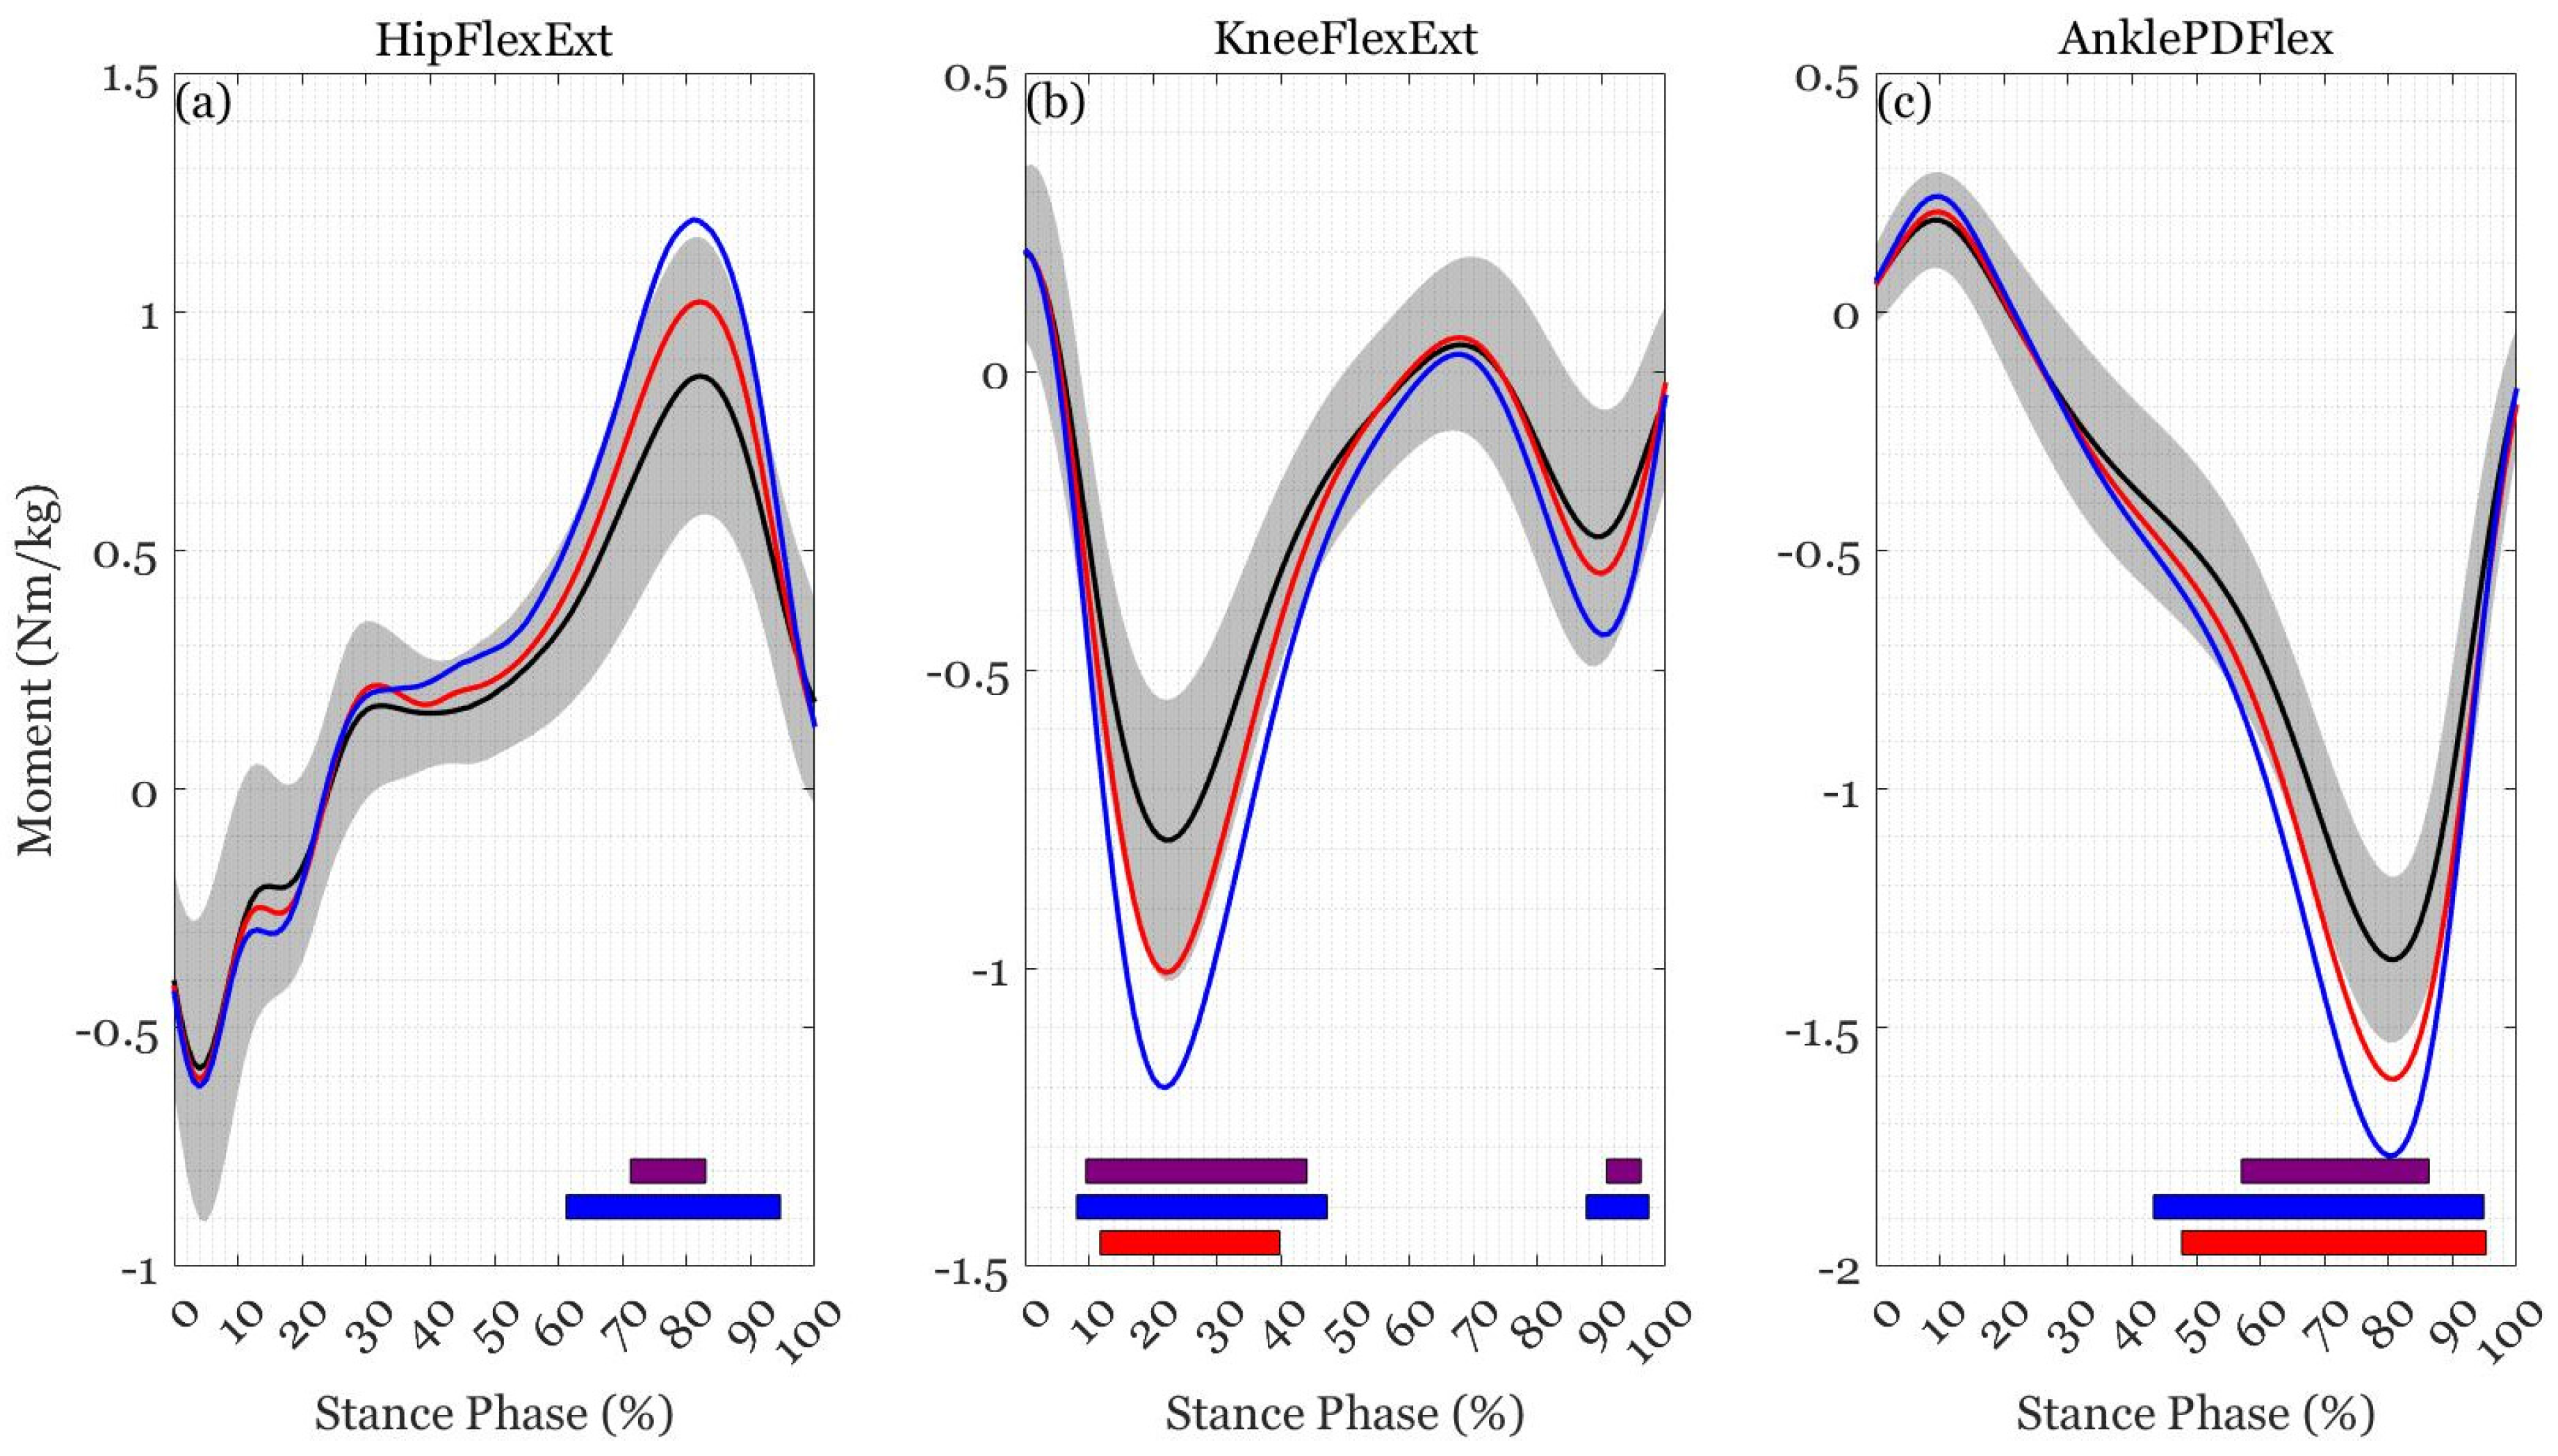
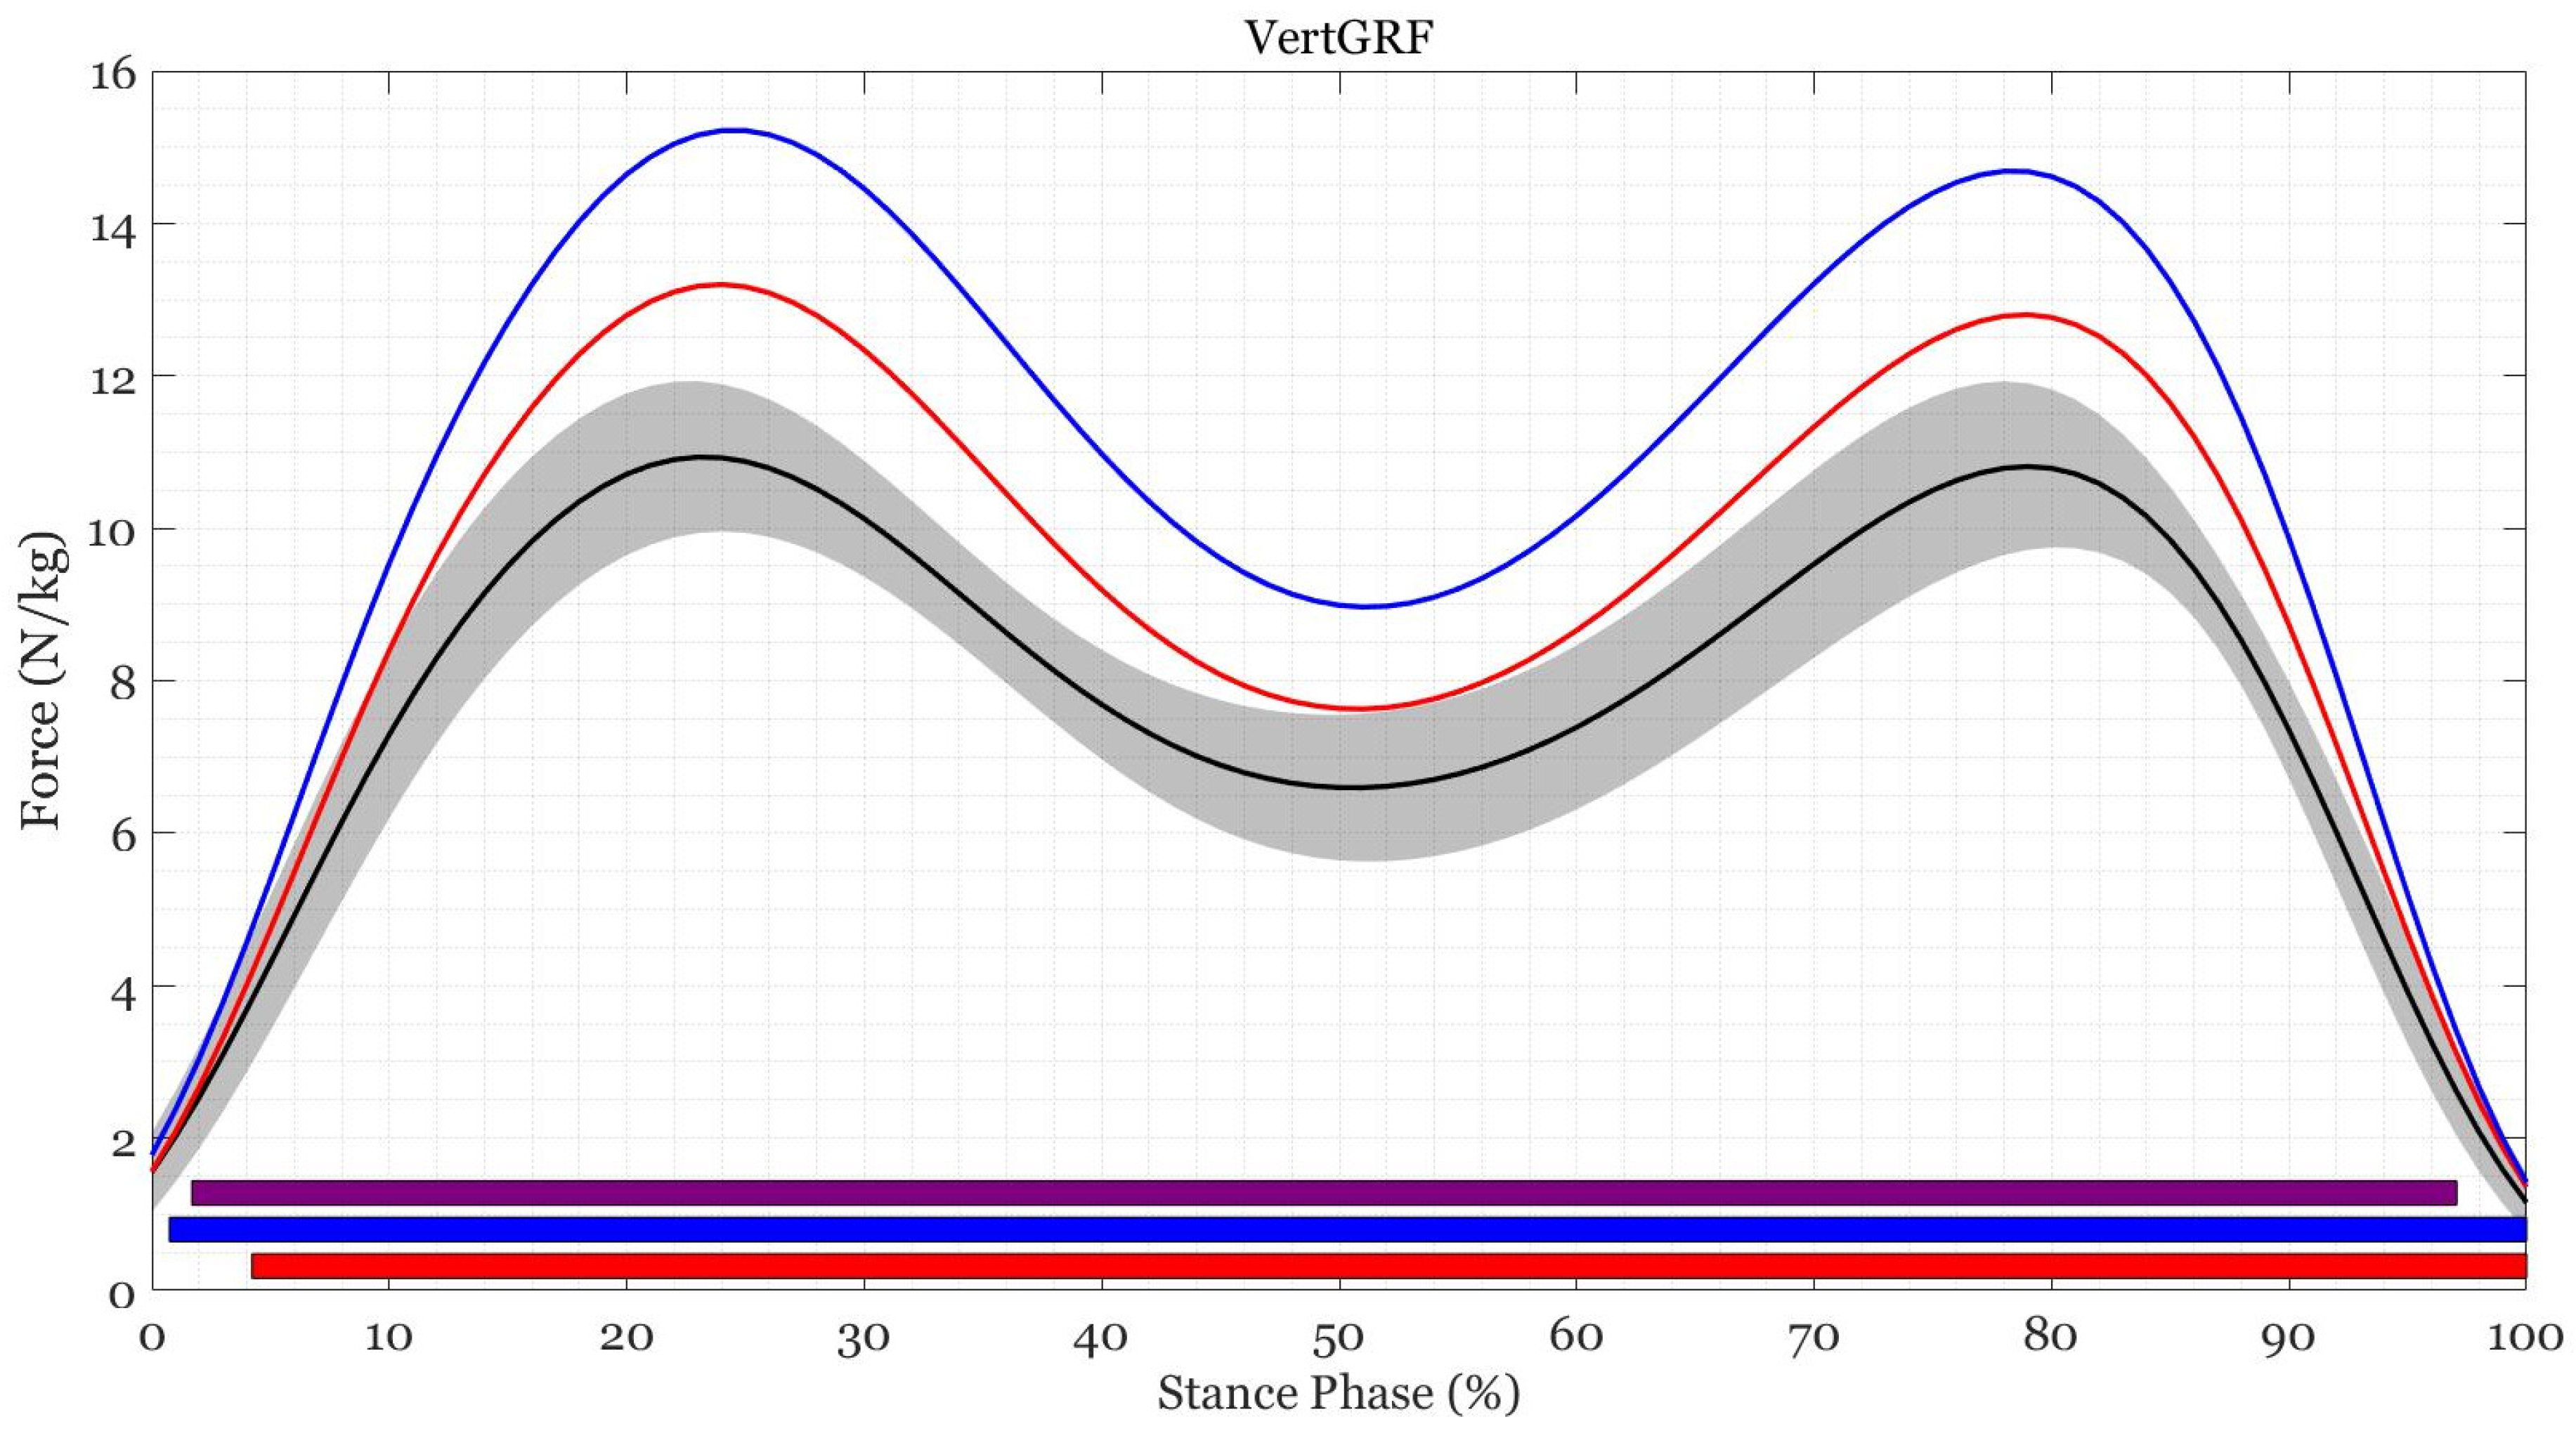
| Joint Moment | 0%BM–20%BM | 0%BM–40%BM | 20%BM–40%BM | |||
|---|---|---|---|---|---|---|
| %Stance | Direction | %Stance | Direction | %Stance | Direction | |
| Hip flexion-extension | 61–95 | ↑ flex | 71–83 | ↑ flex | ||
| Knee flexion-extension | 12–40 | ↑ ext | 8–47 | ↑ ext | 10–44 | ↑ ext |
| 88–97 | ↑ ext | 91–96 | ↑ ext | |||
| Ankle plantar-dorsi flexion | 48–95 | ↑ PF | 43–95 | ↑ PF | 57–86 | ↑ PF |
| Vertical ground reaction force | 4–100% | ↑ | 1–100% | ↑ | 2–97% | ↑ |
References
- Dean, C. The Modern Warrior’s Combat Load; 2003. Available online: http://thedonovan.com/archives/modernwarriorload/ModernWarriorsCombatLoadReport.pdf (accessed on 15 April 2021).
- Orr, R.M.; Johnston, V.; Coyle, J.; Pope, R. Load carriage and the female soldier. J. Mil. Veterans Health 2011, 19, 25–34. [Google Scholar]
- Cathcart, E.P.; Richardson, D.T.; Campbell, W. Army hygiene advisory committee report no. 3 on the maximum load to be carried by the soldier. BMJ Mil. Health 1923, 41, 161–178. [Google Scholar] [CrossRef]
- Haisman, M.F. Determinants of load carrying ability. Appl. Ergon. 1988, 19, 111–121. [Google Scholar] [CrossRef]
- Knapik, J.J.; Reynolds, K.L.; Harman, E. Soldier load carriage: Historical, physiological, biomechanical, and medical aspects. Mil. Med. 2004, 169, 45–56. [Google Scholar] [CrossRef] [Green Version]
- O’Leary, T.J.; Wardle, S.L.; Rawcliffe, A.J.; Chapman, S.; Mole, J.; Greeves, J.P. Understanding the musculoskeletal injury risk of women in combat: The effect of infantry training and sex on musculoskeletal injury incidence during British Army basic training. BMJ Mil. Health 2020. [Google Scholar] [CrossRef]
- Roy, T.C.; Lopez, H.P.; Piva, S.R. Loads worn by soldiers predict episodes of low back pain during deployment to afghanistan. Spine (Phila Pa 1976) 2013, 38, 1310–1317. [Google Scholar] [CrossRef]
- Schuh-Renner, A.; Grier, T.L.; Canham-Chervak, M.; Hauschild, V.D.; Roy, T.C.; Fletcher, J.; Jones, B.H. Risk factors for injury associated with low, moderate, and high mileage road marching in a U.S. Army infantry brigade. J. Sci. Med. Sport 2017, 20, S28–S33. [Google Scholar] [CrossRef]
- Roy, T.C.; Knapik, J.J.; Ritland, B.M.; Murphy, N.; Sharp, M.A. Risk factors for musculoskeletal injuries for soldiers Deployed to Afghanistan. Aviat. Space Environ. Med. 2012, 83, 1060–1066. [Google Scholar] [CrossRef]
- Orr, R.M.; Johnston, V.; Coyle, J.; Pope, R. Reported load carriage injuries of the Australian Army soldier. J. Occup. Rehabil. 2015, 25, 316–322. [Google Scholar] [CrossRef] [Green Version]
- Canham-Chervak, M.; Hauret, K.; Hoedebecke, E.; Laurin, M.J.; Cuthie, J. Discharges during U.S. Army basic training: Injury rates and risk factors. Mil. Med. 2001, 166, 641–647. [Google Scholar] [CrossRef] [Green Version]
- Finestone, A.; Milgrom, C.; Evans, R.; Yanovich, R.; Constantini, N.; Moran, D.S. Overuse injuries in female infantry recruits during low-intensity basic training. Med. Sci. Sports Exerc. 2008, 40, 630–635. [Google Scholar] [CrossRef] [PubMed]
- Jones, B.H.; Amoroso, P.J.; Canham, M.L.; Weyandt, M.B.; Schmitt, J.B. Atlas of Injuries in the U.S. Armed Forces: A Report by the DOD Injury Surveillance and Prevention Work Group for the Assistant Deputy under Secretary of Defense for Safety and Occupational Health; Association of Military Surgeons: Bethesda, MD, USA, 1999. [Google Scholar]
- Bell, N.S.; Mangione, T.W.; Hemenway, D.; Amoroso, P.J.; Jones, B.H. High injury rates among female Army trainees: A function of gender? Am. J. Prev. Med. 2000, 18, 141–146. [Google Scholar] [CrossRef]
- Fallowfield, J.L.; Leiper, R.G.; Shaw, A.M.; Whittamore, D.R.; Lanham-New, S.A.; Allsopp, A.J.; Kluzek, S.; Arden, N.K.; Sanchez-Santos, M.T. Risk of injury in Royal Air Force training: Does sex really matter? Mil. Med. 2020, 185, 170–177. [Google Scholar] [CrossRef] [PubMed] [Green Version]
- Finestone, A.S.; Milgrom, C.; Yanovich, R.; Evans, R.; Constantini, N.; Moran, D.S. Evaluation of the performance of females as light infantry soldiers. Biomed. Res. Int. 2014, 2014, 572953. [Google Scholar] [CrossRef] [PubMed] [Green Version]
- Sharma, J.; Greeves, J.P.; Byers, M.; Bennett, A.N.; Spears, I.R. Musculoskeletal injuries in British Army recruits: A prospective study of diagnosis-specific incidence and rehabilitation times. BMC Musculoskelet. Disord. 2015, 16, 106. [Google Scholar] [CrossRef] [PubMed] [Green Version]
- Nindl, B.C.; Jones, B.H.; Van Arsdale, S.J.; Kelly, K.; Kraemer, W.J. Operational physical performance and fitness in military women: Physiological, musculoskeletal injury, and optimized physical training considerations for successfully integrating women into combat-centric military occupations. Mil. Med. 2016, 181, 50–62. [Google Scholar] [CrossRef] [PubMed] [Green Version]
- Gemmell, I.M.M. Injuries among female army recruits: A conflict of legislation. J. R. Soc. Med. 2002, 95, 23–27. [Google Scholar] [CrossRef]
- Knapik, J.J.; Sharp, M.A.; Canham-Chervak, M.; Hauret, K.; Patton, J.F.; Jones, B.H. Risk factors for training-related injuries among men and women in basic combat training. Med. Sci. Sports Exerc. 2001, 33, 946–954. [Google Scholar] [CrossRef]
- Krupenevich, R.; Rider, P.; Domire, Z.; DeVita, P. Males and females respond similarly to walking with a standardized, heavy load. Mil. Med. 2015, 180, 994–1000. [Google Scholar] [CrossRef] [Green Version]
- Silder, A.; Delp, S.L.; Besier, T. Men and women adopt similar walking mechanics and muscle activation patterns during load carriage. J. Biomech. 2013, 46, 2522–2528. [Google Scholar] [CrossRef]
- Vickery-Howe, D.M.; Drain, J.R.; Clarke, A.C.; Dascombe, B.J.; McWilliam, J.T.; Middleton, K.J. Treadmill load carriage overestimates energy expenditure of overground load carriage. Ergonomics 2021, 64, 521–531. [Google Scholar] [CrossRef] [PubMed]
- Vickery-Howe, D.M.; Clarke, A.C.; Drain, J.R.; Dascombe, B.J.; Middleton, K.J. No physiological or biomechanical sex-by-load interactions during treadmill-based load carriage. Ergonomics 2020, 63, 1175–1181. [Google Scholar] [CrossRef] [PubMed]
- Knapik, J.J.; Reynolds, K.L. Load Carriage in Military Operations: A Review of Historical, Physiological, Biomechanical and Medical Aspects; Defence Technical Information Center: Fort Belvoir, VA, USA, 1997. [Google Scholar]
- Kristianslund, E.; Krosshaug, T.; Van den Bogert, A.J. Effect of low pass filtering on joint moments from inverse dynamics: Implications for injury prevention. J. Biomech. 2012, 45, 666–671. [Google Scholar] [CrossRef] [PubMed] [Green Version]
- Winter, D.A. Biomechanics and Motor Control of Human Movement, 4th ed.; John Wiley & Sons: Hoboken, NJ, USA, 2009. [Google Scholar] [CrossRef]
- Bisseling, R.W.; Hof, A.L. Handling of impact forces in inverse dynamics. J. Biomech. 2006, 39, 2438–2444. [Google Scholar] [CrossRef]
- Harrington, M.E.; Zavatsky, A.B.; Lawson, S.E.M.; Yuan, Z.; Theologis, T.N. Prediction of the hip joint centre in adults, children, and patients with cerebral palsy based on magnetic resonance imaging. J. Biomech. 2007, 40, 595–602. [Google Scholar] [CrossRef]
- Wu, G.; Siegler, S.; Allard, P.; Kirtley, C.; Leardini, A.; Rosenbaum, D.; Whittle, M.; D’Lima, D.D.; Cristofolini, L.; Witte, H.; et al. ISB recommendation on definitions of joint coordinate system of various joints for the reporting of human joint motion—Part I: Ankle, hip, and spine. J. Biomech. 2002, 35, 543–548. [Google Scholar] [CrossRef]
- Schache, A.G.; Baker, R. On the expression of joint moments during gait. Gait Posture 2007, 25, 440–452. [Google Scholar] [CrossRef]
- de Leva, P. Adjustments to Zatsiorsky-Seluyanov’s segment inertia parameters. J. Biomech. 1996, 29, 1223–1230. [Google Scholar] [CrossRef]
- Zeni, J.A.J.; Richards, J.G.; Higginson, J.S. Two simple methods for determining gait events during treadmill and overground walking using kinematic data. Gait Posture 2008, 27, 710–714. [Google Scholar] [CrossRef] [Green Version]
- Derrick, T.R.; van den Bogert, A.J.; Cereatti, A.; Dumas, R.; Fantozzi, S.; Leardini, A. ISB recommendations on the reporting of intersegmental forces and moments during human motion analysis. J. Biomech. 2020, 99, 109533. [Google Scholar] [CrossRef]
- The Jamovi Project (2021). Jamovi (Version 1.6) [Computer Software]. Available online: https://www.jamovi.org (accessed on 18 October 2021).
- Pataky, T.C. One-dimensional statistical parametric mapping in Python. Comput. Methods Biomech. Biomed. Eng. 2012, 15, 295–301. [Google Scholar] [CrossRef] [PubMed]
- Edwards, M.; Furnell, A.; Coleman, J.; Davis, S. A Preliminary Anthropometry Standard for Australian Army Equipment Evaluation; Defence Science and Technology Organisation: Victoria, Australia, 2014. [Google Scholar]
- Castro, M.P.; Figueiredo, M.C.; Abreu, S.; Sousa, H.; Machado, L.; Santos, R.; Vilas-Boas, J.P. The influence of gait cadence on the ground reaction forces and plantar pressures during load carriage of young adults. Appl. Ergon. 2015, 49, 41–46. [Google Scholar] [CrossRef] [PubMed] [Green Version]
- Demura, T.; Demura, S.I. Relationship among gait parameters while walking with varying loads. J. Physiol. Anthropol. 2010, 29, 29–34. [Google Scholar] [CrossRef] [PubMed] [Green Version]
- Beaupré, G.S.; Orr, T.E.; Carter, D.R. An approach for time-dependent bone modeling and remodeling—Theoretical development. J. Orthop. Res. 1990, 8, 651–661. [Google Scholar] [CrossRef]
- Whalen, R.T.; Carter, D.R.; Steele, C.R. Influence of physical activity on the regulation of bone density. J. Biomech. 1988, 21, 825–837. [Google Scholar] [CrossRef]
- Oloyede, A.; Flachsmann, R.; Broom, N.D. The dramatic influence of loading velocity on the compressive response of articular cartilage. Connect Tissue Res. 1992, 27, 211–224. [Google Scholar] [CrossRef]
- Beck, T.J.; Ruff, C.B.; Shaffer, R.A.; Betsinger, K.; Trone, D.W.; Brodine, S.K. Stress fracture in military recruits: Gender differences in muscle and bone susceptibility factors. Bone 2000, 27, 437–444. [Google Scholar] [CrossRef]
- Orr, R.M.; Pope, R. Gender differences in load carriage injuries of Australian army soldiers. BMC Musculoskelet. Disord. 2016, 17, 488. [Google Scholar] [CrossRef] [Green Version]
- Wentz, L.; Liu, P.-Y.; Haymes, E.; Ilich, J.Z. Females have a greater incidence of stress fractures than males in both military and athletic populations: A systemic review. Mil. Med. 2011, 176, 420–430. [Google Scholar] [CrossRef] [Green Version]
- Bijur, P.E.; Horodyski, M.; Egerton, W.; Kurzon, M.; Lifrak, S.; Friedman, S. Comparison of injury during cadet basic training by gender. Arch. Pediatr. Adolesc. Med. 1997, 151, 456–461. [Google Scholar] [CrossRef]
- Jones, B.H.; Bovee, M.W.; Harris, J.M.; Cowan, D.N. Intrinsic risk factors for exercise-related injuries among male and female army trainees. Am. J. Sports Med. 1993, 21, 705–710. [Google Scholar] [CrossRef] [PubMed]
- Moran, D.S.; Israeli, E.; Evans, R.K.; Yanovich, R.A.N.; Constantini, N.; Shabshin, N.; Merkel, D.; Luria, O.; Elrich, T.; Laor, A.; et al. Prediction model for stress fracture in young female recruits during basic training. Med. Sci. Sport Exerc. 2008, 40 (Suppl. 11), S636–S644. [Google Scholar] [CrossRef] [PubMed]
- Välimäki, V.-V.; Alfthan, H.; Lehmuskallio, E.; Löyttyniemi, E.; Sahi, T.; Suominen, H.; Valimaki, M.J. Risk factors for clinical stress fractures in male military recruits: A prospective cohort study. Bone 2005, 37, 267–273. [Google Scholar] [CrossRef] [PubMed]
- Gill, N.; Roberts, A.; O’Leary, T.J.; Liu, A.; Hollands, K.; Walker, D.; Greeves, J.P.; Jones, R. Role of sex and stature on the biomechanics of normal and loaded walking: Implications for injury risk in the military. BMJ Mil. Health 2021. [Google Scholar] [CrossRef] [PubMed]
- Birrell, S.A.; Haslam, R.A. The effect of load distribution within military load carriage systems on the kinetics of human gait. Appl. Ergon. 2010, 41, 585–590. [Google Scholar] [CrossRef]
- Harman, E.; Han, K.H.; Frykman, P.; Pandorf, C. The Effects of Backpack Weight on the Biomechanics of Load Carriage; Defence Technical Information Center: Fort Belvoir, VA, USA, 2000; Volume 71, pp. 1–62. [Google Scholar]
- Martin, P.E.; Nelson, R.C. The effect of carried loads on the walking patterns of men and women. Ergonomics 1986, 29, 1191–1202. [Google Scholar] [CrossRef]
- Simpson, K.M.; Munro, B.J.; Steele, J.R. Effects of prolonged load carriage on ground reaction forces, lower limb kinematics and spatio-temporal parameters in female recreational hikers. Ergonomics 2012, 55, 316–326. [Google Scholar] [CrossRef]
- Grenier, J.G.; Millet, G.Y.; Peyrot, N.; Samozino, P.; Oullion, R.; Messonnier, L.; Morin, J.-B. Effects of extreme-duration heavy load carriage on neuromuscular function and locomotion: A military-based study. PLoS ONE 2012, 7, e43586. [Google Scholar] [CrossRef] [Green Version]
- Kinoshita, H. Effects of different loads and carrying systems on selected biomechanical parameters describing walking gait. Ergonomics 1985, 28, 1347–1362. [Google Scholar] [CrossRef]
- Seay, J.F.; Fellin, R.E.; Sauer, S.G.; Frykman, P.N.; Bensel, C.K. Lower extremity biomechanical changes associated with symmetrical torso loading during simulated marching. Mil. Med. 2014, 179, 85–91. [Google Scholar] [CrossRef] [Green Version]
- Attwells, R.L.; Birrell, S.A.; Hooper, R.H.; Mansfield, N.J. Influence of carrying heavy loads on soldiers’ posture, movements and gait. Ergonomics 2006, 49, 1527–1537. [Google Scholar] [CrossRef] [Green Version]
- Majumdar, D.; Pal, M.S.; Majumdar, D. Effects of military load carriage on kinematics of gait. Ergonomics 2010, 53, 782–791. [Google Scholar] [CrossRef] [PubMed]
- Mann, R.A.; Hagy, J. Biomechanics of walking, running, and sprinting. Am. J. Sports Med. 1980, 8, 345–350. [Google Scholar] [CrossRef] [PubMed]
- Seay, J.F. Biomechanics of load carriage. In The Mechanobiology and Mechanophysiology of Military-Related Injuries; Gefen, A., Epstein, Y., Eds.; Springer International Publishing: Berlin/Heidelberg, Germany, 2015; pp. 71–106. [Google Scholar] [CrossRef]
- Birrell, S.A.; Hooper, R.H.; Haslam, R.A. The effect of military load carriage on ground reaction forces. Gait Posture 2007, 26, 611–614. [Google Scholar] [CrossRef] [Green Version]
- Tilbury-Davis, D.C.; Hooper, R.H. The kinetic and kinematic effects of increasing load carriage upon the lower limb. Hum. Mov. Sci. 1999, 18, 693–700. [Google Scholar] [CrossRef]
- Orr, R.M.; Pope, R.; Johnston, V.; Coyle, J. Soldier occupational load carriage: A narrative review of associated injuries. Int. J. Inj. Contr. Saf. Promot. 2014, 21, 388–396. [Google Scholar] [CrossRef]
- Wills, J.A.; Drain, J.; Fuller, J.T.; Doyle, T.L.A. Physiological responses of female load carriage improves after 10 weeks of training. Med. Sci. Sport Exerc. 2020, 52, 1763–1769. [Google Scholar] [CrossRef]


| Female | Male | Mean Difference [95% CI] | Effect Size (Cohen’s d) [95% CI] | t Statistic | p Value | |
|---|---|---|---|---|---|---|
| (Mean ± SD) | ||||||
| Age (years) | 25.1 ± 6.1 | 22.3 ± 2.3 | −2.8 [−6.3, 0.6] | −0.619 [−1.36, 0.142] | −1.7 | 0.101 |
| Body mass (kg) | 61.5 ± 6.9 | 74.2 ± 8.5 | 12.7 [7.0, 18.5] | 1.653 [0.698, 2.574] | 4.53 | < 0.001 |
| Height (cm) | 166 ± 7 | 179 ± 7 | 13 [8, 19] | 1.878 [0.867, 2.853] | 5.14 | <0 .001 |
| External Load (20% BM) | 12.2 ± 1.3 | 14.9 ± 1.8 | 2.7 [1.5, 3.9] | 1.661 [0.704, 2.584] | 4.55 | < 0.001 |
| External Load (40% BM) | 24.5 ± 2.7 | 29.9 ± 3.6 | 5.4 [3.0, 7.8] | 1.706 [0.738, 2.639] | 4.67 | <0.001 |
| 0% BM | 20% BM | 40% BM | Effect Size (η2p) | p Value | ||||||||
|---|---|---|---|---|---|---|---|---|---|---|---|---|
| Female | Male | Female | Male | Female | Male | Sex * Load | Sex | Load | Sex * Load | Sex | Load | |
| Walking speed (km/h) | 4.8 ± 0.5 | 4.7 ± 0.5 | 4.8 ± 0.5 | 4.7 ± 0.5 | 4.6 ± 0.5 | 4.6 ± 0.5 | 0.058 | 0.004 | 0.234 | 0.193 | 0.750 | 0.001 |
| Cadence (steps/min) | 118 ± 5 | 109 ± 7 | 118 ± 7 | 108 ± 7 | 116 ± 7 | 109 ± 8 | 0.086 | 0.294 | 0.043 | 0.098 | 0.002 | 0.286 |
| Stride length (% height) | 82 ± 9 | 83 ± 6 | 82 ± 8 | 82 ± 7 | 81 ± 11 | 78 ± 12 | 0.021 | 0.002 | 0.054 | 0.513 | 0.830 | 0.219 |
| Step width (% height) | 7 ± 1 | 6 ± 1 | 6 ± 1 | 6 ± 2 | 7 ± 1 | 6 ± 2 | 0.014 | 0.056 | 0.019 | 0.681 | 0.207 | 0.584 |
| Stance time (s) | 0.61 ± 0.04 | 0.66 ± 0.05 | 0.62 ± 0.04 | 0.68 ± 0.06 | 0.64 ± 0.05 | 0.69 ± 0.07 | 0.084 | 0.225 | 0.423 | 0.106 | 0.008 | <0.001 |
| Stance time (%) | 60 ± 2 | 60 ± 2 | 61 ± 2 | 61 ± 2 | 62 ± 2 | 62 ± 1 | 0.044 | 0.000 | 0.718 | 0.281 | 0.914 | <0.001 |
| Model | Estimate (B) | SE (B) | β | t | p | R | R2 | ΔR2 |
|---|---|---|---|---|---|---|---|---|
| Stage 1 | 0.543 | 0.295 | - | |||||
| Intercept | 190.423 | 22.650 | - | 8.41 | <0.001 | |||
| Height | −0.449 | 0.131 | −0.543 | −3.43 | 0.002 | |||
| Stage 2 | 0.561 | 0.315 | 0.020 | |||||
| Intercept | 184.510 | 23.714 | - | 7.78 | <0.001 | |||
| Height | −0.358 | 0.167 | −0.433 | −2.14 | 0.042 | |||
| Mass | −0.144 | 0.164 | −0.178 | −0.88 | 0.387 | |||
| Stage 3 | 0.715 | 0.511 | 0.196 | |||||
| Intercept | 170.732 | 20.859 | - | 8.18 | <0.001 | |||
| Height | −0.399 | 0.145 | −0.483 | −2.76 | 0.011 | |||
| Mass | −0.099 | 0.142 | −0.123 | −0.70 | 0.491 | |||
| Age | 0.751 | 0.233 | 0.445 | 3.23 | .003 | |||
| Stage 4 | 0.715 | 0.511 | 0.000 | |||||
| Intercept | 172.349 | 29.544 | - | 5.83 | <0.001 | |||
| Height | −0.407 | 0.179 | −0.492 | −2.28 | 0.032 | |||
| Mass | −0.104 | 0.157 | −0.128 | −0.66 | 0.514 | |||
| Age | 0.761 | 0.267 | 0.451 | 2.85 | 0.009 | |||
| Sex (F-M) | −0.298 | 3.778 | −0.037 | −0.08 | 0.938 |
| Model | Estimate (B) | SE (B) | β | t | p | R | R2 | ΔR2 |
|---|---|---|---|---|---|---|---|---|
| Stage 1 | 0.492 | 0.242 | - | |||||
| Intercept | 0.161 | 0.164 | - | 0.99 | 0.332 | |||
| Height | 0.003 | 0.001 | 0.492 | 2.99 | 0.006 | |||
| Stage 2 | 0.539 | 0.290 | 0.048 | |||||
| Intercept | 0.226 | 0.168 | - | 1.34 | 0.190 | |||
| Height | 0.002 | 0.001 | 0.319 | 1.55 | 0.134 | |||
| Mass | 0.002 | 0.001 | 0.280 | 1.36 | 0.186 | |||
| Stage 3 | 0.606 | 0.368 | 0.078 | |||||
| Intercept | 0.286 | 0.165 | - | 1.73 | 0.095 | |||
| Height | 0.002 | 0.001 | 0.350 | 1.76 | 0.091 | |||
| Mass | 0.001 | 0.001 | 0.245 | 1.23 | 0.231 | |||
| Age | −0.003 | 0.002 | −0.280 | −1.79 | 0.086 | |||
| Stage 4 | 0.608 | 0.369 | 0.001 | |||||
| Intercept | 0.245 | 0.234 | - | 1.05 | 0.304 | |||
| Height | 0.002 | 0.001 | 0.385 | 1.57 | 0.129 | |||
| Mass | 0.001 | 0.001 | 0.266 | 1.21 | 0.238 | |||
| Age | −0.004 | 0.002 | −0.301 | −1.67 | 0.106 | |||
| Sex (F-M) | 0.008 | 0.030 | 0.136 | 0.25 | 0.801 |
Publisher’s Note: MDPI stays neutral with regard to jurisdictional claims in published maps and institutional affiliations. |
© 2022 by the authors. Licensee MDPI, Basel, Switzerland. This article is an open access article distributed under the terms and conditions of the Creative Commons Attribution (CC BY) license (https://creativecommons.org/licenses/by/4.0/).
Share and Cite
Middleton, K.; Vickery-Howe, D.; Dascombe, B.; Clarke, A.; Wheat, J.; McClelland, J.; Drain, J. Mechanical Differences between Men and Women during Overground Load Carriage at Self-Selected Walking Speeds. Int. J. Environ. Res. Public Health 2022, 19, 3927. https://0-doi-org.brum.beds.ac.uk/10.3390/ijerph19073927
Middleton K, Vickery-Howe D, Dascombe B, Clarke A, Wheat J, McClelland J, Drain J. Mechanical Differences between Men and Women during Overground Load Carriage at Self-Selected Walking Speeds. International Journal of Environmental Research and Public Health. 2022; 19(7):3927. https://0-doi-org.brum.beds.ac.uk/10.3390/ijerph19073927
Chicago/Turabian StyleMiddleton, Kane, Danielle Vickery-Howe, Ben Dascombe, Anthea Clarke, Jon Wheat, Jodie McClelland, and Jace Drain. 2022. "Mechanical Differences between Men and Women during Overground Load Carriage at Self-Selected Walking Speeds" International Journal of Environmental Research and Public Health 19, no. 7: 3927. https://0-doi-org.brum.beds.ac.uk/10.3390/ijerph19073927