


The Dynamic Evaluation Model of Health Sustainability under MCDM Benchmarking Health Indicator Standards

Abstract
:1. Introduction
2. Materials and Methods
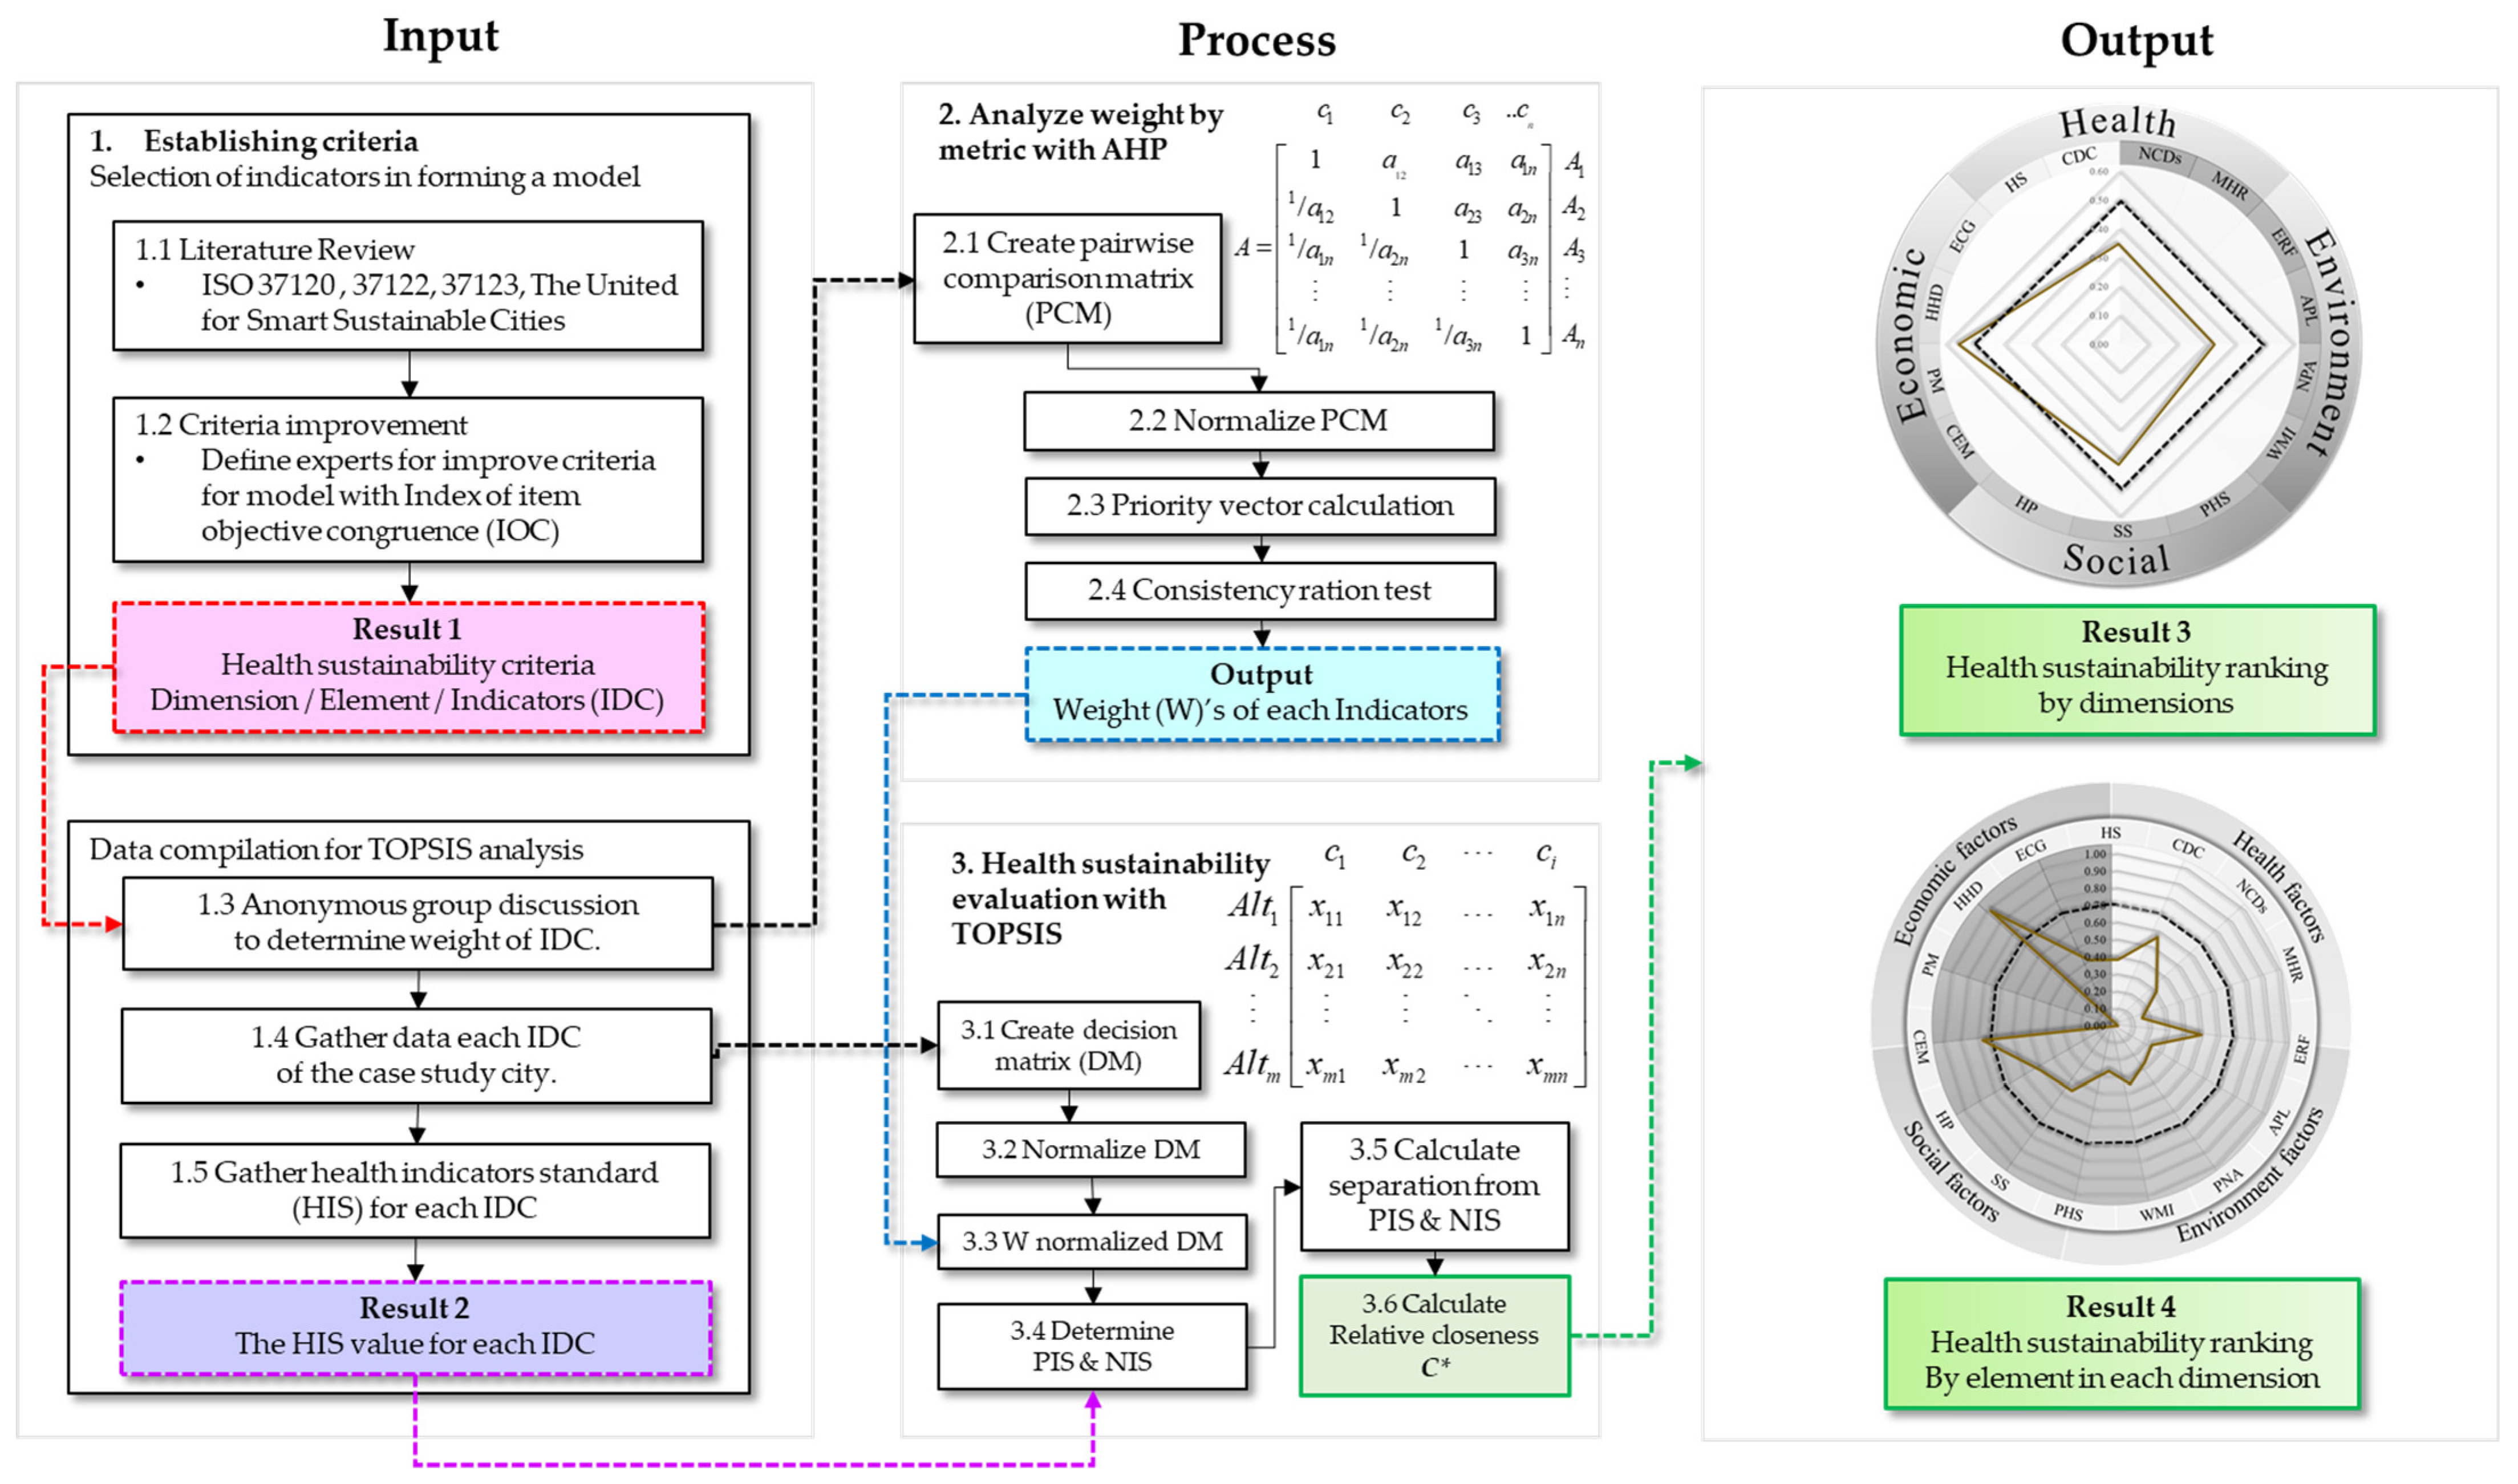
2.1. Establishing Criteria and Standard
2.1.1. Selection of Indicators in Forming a Model
- The researchers gather indicators from literature reviews and standards in relation to building a sustainable city, such as ISO37120, ISO37122, ISO37123 and U4SSC [27,28,29,30,31] to select criteria (CTR), hereafter called indicators (IDC) with consideration for the context of Thailand. The selected indicators must consist of quantitative secondary data disclosed by the public sector because TOPSIS analysis requires quantitative data.
- To verify suitability with the index of item objective congruence (IOC) by closed-ended questions on the indicators derived from reviews of the literature, an odd number of experts were invited. For each indicator, each expert was asked for its suitability. The possible answers were minus one (−1) if the expert deemed it unsuitable, zero (0) if the expert was uncertain or plus one (+1) if the expert deemed it suitable. The value for each indicator must be close to the minimum value of 0.05, whereas the indicators with a value less than 0.05 must be improved or deleted [32]. The CVs of the experts are shown in Table A1.
2.1.2. Data Compilation for TOPSIS Analysis
- The process started by assigning a weight () to each indicator of the TOPSIS analysis. This was determined by asking the same group of 15 experts their opinion on the rate of suitability of each indicator using an AHP pairwise comparison matrix based on Saaty’s nine point ratio scale. This was done anonymously through an online conference to mitigate issues of personal and group bias and maintain independence of opinions.
- The researchers compiled the data as of 2019 for the target city from both online and offline government databases to standardize the base year and maintain consistency with data from IDCs. All data and their sources are shown in Table A2.
- The researchers compiled health indicator standards (HIS) set by reliable international organizations, public policies and research with a credible database. The data used for HISes are also as of 2019 to maintain neutrality, as it is the year before the occurrence of the pandemic, and to ensure the completeness of the data.
2.2. Analytic Hierarchy Process (AHP)
2.2.1. Pairwise Comparison Matrix (PCM)
2.2.2. Eigenvalue (EV)
2.2.3. Consistency Ratio Test (C.R.)
2.3. The Technique for Order Preference by Similarity to Ideal Solution (TOPSIS)
2.3.1. Creation of Decision Matrix (DM)
2.3.2. Normalization of DM for Ease of Comparison
2.3.3. Weights of Normalized DM ()
2.3.4. Ideal Solution
2.3.5. Deviation from Ideal Solutions
2.3.6. Relative Closeness ()
3. Results
3.1. Criteria and Standard
- Health status (HS) consists of five IDCs ranging from VR01–VR05. It was found that the world average life expectancy, or VR01, was 73.2 years, with the highest value found in Hong Kong at 85.29 years [35]. For the world average of low-birth-weight newborns, or VR02, the minimum value was 5% while the maximum value was over 20% [36]. Next, the world average death rate, or VR03, was 7.6 deaths per 1000 population [37]. The infant mortality livebirth rate, or VR04, was targeted to be 12 per 1000 livebirths at minimum and not to exceed 25 per 1000 livebirths by 2030 by SDGs [38]. Lastly, the world average suicide mortality rate, or VR05, was 5.6 deaths per 100,000 population at the minimum and 23.5 deaths per 100,000 population at the maximum [39].
- Communicable disease control (CDC) consists of four IDCs ranging from VR06–VR09. It was found that the current world average HIV/AIDS mortality rate, or VR06, was 11 deaths per 100,000 population with the expectation that the value will fall to 8.5 deaths per 100,000 population in 2040 [40]. Next, the world average tuberculosis mortality rate, or VR07, was less than 38 deaths per 100,000 population at the minimum and not more than 319 deaths per 100,000 population at the maximum [41]. For the world average pneumonia mortality rate, or VR08, the value was 34.31 deaths per 100,000 population, with the lowest number in Finland at the rate of 5.20 deaths per 100,000 population [42]. Lastly, the world average diarrhea mortality rate, or VR09, was 20.95 deaths per 100,000 population, with the lowest number in Montenegro at the rate of 0.09 deaths per 100,000 population [43].
- Non-communicable disease control (NCDs) consists of six IDCs ranging from VR10–VR15. It was found that the world average cancer mortality rate, or VR10, was 131.53 deaths per 100,000 population, with the lowest value in Kuwait at 71.26 deaths per 100,000 population [44]. Next, the world average stroke mortality rate, or VR11, was 84.19 deaths per 100,000 population, with the lowest value in Switzerland at a rate of 21.77 deaths per 100,000 population [45]. Then, the world average ischemic heart disease mortality rate, or VR12, mainly found in North Africa, the Middle East, Eastern Europe and Central Asia, was 112.37 deaths per 100,000 population [46]. For the world average diabetes mellitus mortality rate, or VR13, a report in 2019 found that the rate was 18.5 deaths per 100,000 population [47], while the world average chronic obstructive pulmonary disease mortality rate, or VR14, was 46.3 deaths per 100,000 population [48] and the world average kidney disease mortality rate, or VR15, was 77.01 deaths per 100,000 population [49].
- Health resources (HR) consists of seven IDCs ranging from VR16 to VR22. With references to the standards on healthcare resources set by the WHO based on national income, Thailand is categorized as an upper-middle-income country. The minimum ratio of physicians, or VR16, of the group was 10 physicians per 100,000 population, with the maximum ratio being 170 physicians per 100,000 population. Next, the minimum ratio of nursing and midwifery personnel, or VR18, was 60 persons per 100,000 population at the minimum, with a maximum ratio of 380 persons per 100,000 population. Then, the total health worker ratio, or VR20, was 210 workers per 100,000 population at the minimum, with a maximum ratio of 780 workers per 100,000 population [50]. For the current world average hospital beds ratio, or VR17, the value was 110 beds per 100,000 population [52] where the WHO has determined the benchmark should be at least 3 beds per 100,000 population [51]. The world average psychiatrist ratio, or VR19, was 1.7 psychiatrists per 100,000 population [54], whereas the recommended ratio for high-income countries was 6 psychiatrists per 100,000 population [53]. According to WHO standards, the ambulance ratio, or VR21, should be at least 1 ambulance per 100,000 population for people living in plains [56]. Nevertheless, the rate is set at 3.3 ambulances per 100,000 population for high-income countries [55]. Lastly, on the completion of electronic medical records, or VR22, the Ministry of Public Health (MOPH) of Thailand has published a policy enforcing that all electronic medical records must be at least 90% complete [57].
- Environment risk management (ERM) consists of one IDC: VR23. MOPH has required each province to manage at least 60% of environmental risks involving one hygienic and environmental disease at minimum [58].
- Air pollution management (APM) consists of one IDC: VR24, which uses an average air quality index (AQI) reporting PM2.5, PM10, O3, CO, NO2 and SO2 in each city area as an element. AQI is divided into six levels from 0 to above 201, where an AQI value equal to 100 indicates standard air quality. When the AQI is above 100, the air pollution has exceeded the standard, thus affecting health [59,62].
- Protected Natural Areas (PNA) consists of one IDC: VR25. The Thai royal forest department has formulated its main strategy to preserve the prosperity of forests in Thailand by designating each city to have natural and artificial forest in at least 40% of the city area within 10 years [60].
- Water management (WM) consists of one IDC, VR26, by adopting a water management index (WMI) as an element. The index reports a score of water management in eight dimensions: (1) resources, (2) household water security, (3) economic water security, (4) balance in resources and usage, (5) environmental water security, (6) resilience to water-related disasters, (7) management of upstream forests and (8) water resource management performance. To quantify the evaluation, the index is assessed under five ranges where 0.00–1.00 means hazardous, 1.01–2.00 means engaged, 2.01–3.00 means capable, 3.01–4.00 means effective and 4.01–5.00 means model for water management [61].
- Health service standard (HSS) consists of six IDCs ranging from VR27 to VR32. Every IDC is defined by the policies from MOPH, which indicate the score for health resource management, or VR27, must be close to 0, not exceeding 4%. For transparency in public health, or VR28, all provincial health departments must pass the integrity and transparency assessment with a score equal to or more than 92%. With regards to green and clean hospital administration, or VR29, hospitals must organize green and clean activities and pass an assessment with a score of at least 98%. In addition, the management of public health crises, or VR30, must meet the criteria with an outstanding level of 100%, whereas the community hospital quality, or VR31, must meet Hospital Accreditation Level 3 with a minimum value of 90%. Lastly, the control of acute infectious diseases, or VR32, must be 100%.
- Social security (SS) consists of four IDCs ranging from VR33 to VR36. It was found that the world average smoking mortality rate, or VR33, was 95.61 deaths per 100,000 population, with the lowest mortality rate in Peru of 14.02 deaths per 100,000 population [63]. For the world average alcohol drinking mortality rate, or VR34, the value was 2.01 deaths per 100,000 population, with the lowest value found in Singapore at a rate of 0.16 deaths per 100,000 population [64]. In addition, the world average traffic accident mortality rate, or VR35, was 14.99 deaths per 100,000 population, with the lowest rate in Singapore of 2.64 deaths per 100,000 population [65]. Lastly, on the crime world average mortality rate, or VR36, the value was 5.4 deaths per 100,000 population, with the lowest rate found in Singapore of 0.4 deaths per 100,000 population [66].
- Health promotion (HP) consists of five IDCs ranging from VR37 to VR41. The IDCs in health promotion are also defined by the policies from MOPH, requiring that universal health coverage service, or VR37, desirable health behaviors, or VR38, management of glycemic control, or VR39, and management of blood pressure control, or VR40, must each be equal to or more than 80%, while the world average obesity (BMI > 30 kg/m2) or VR41 was 8.52 persons per 100,000 population [67].
- City’s employment (CEM) consists of one IDC: VR42. To consider employment situation at a good level, each city should control its unemployment rate to be less than the current global average of 6.5% [68].
- Poverty reduction (PR) consists of one IDC: VR43. The average share of the population living in poverty was 8.44% [69].
- Household debt (HD) consists of one IDC: VR44. The appropriate debt bearing ratio was between 1% and 30%, not exceeding 43% [70].
- Economic growth (EGR) consists of one IDC: VR45. The Bank of Thailand predicted that the Thai economy would grow by 3.3% in 2019 [71].
3.2. Analyze Weight by Metric with AHP
3.3. Application Research
3.3.1. Calculation of A+ and A− for Each IDC
3.3.2. Calculation of S+ and S− for Each IDC
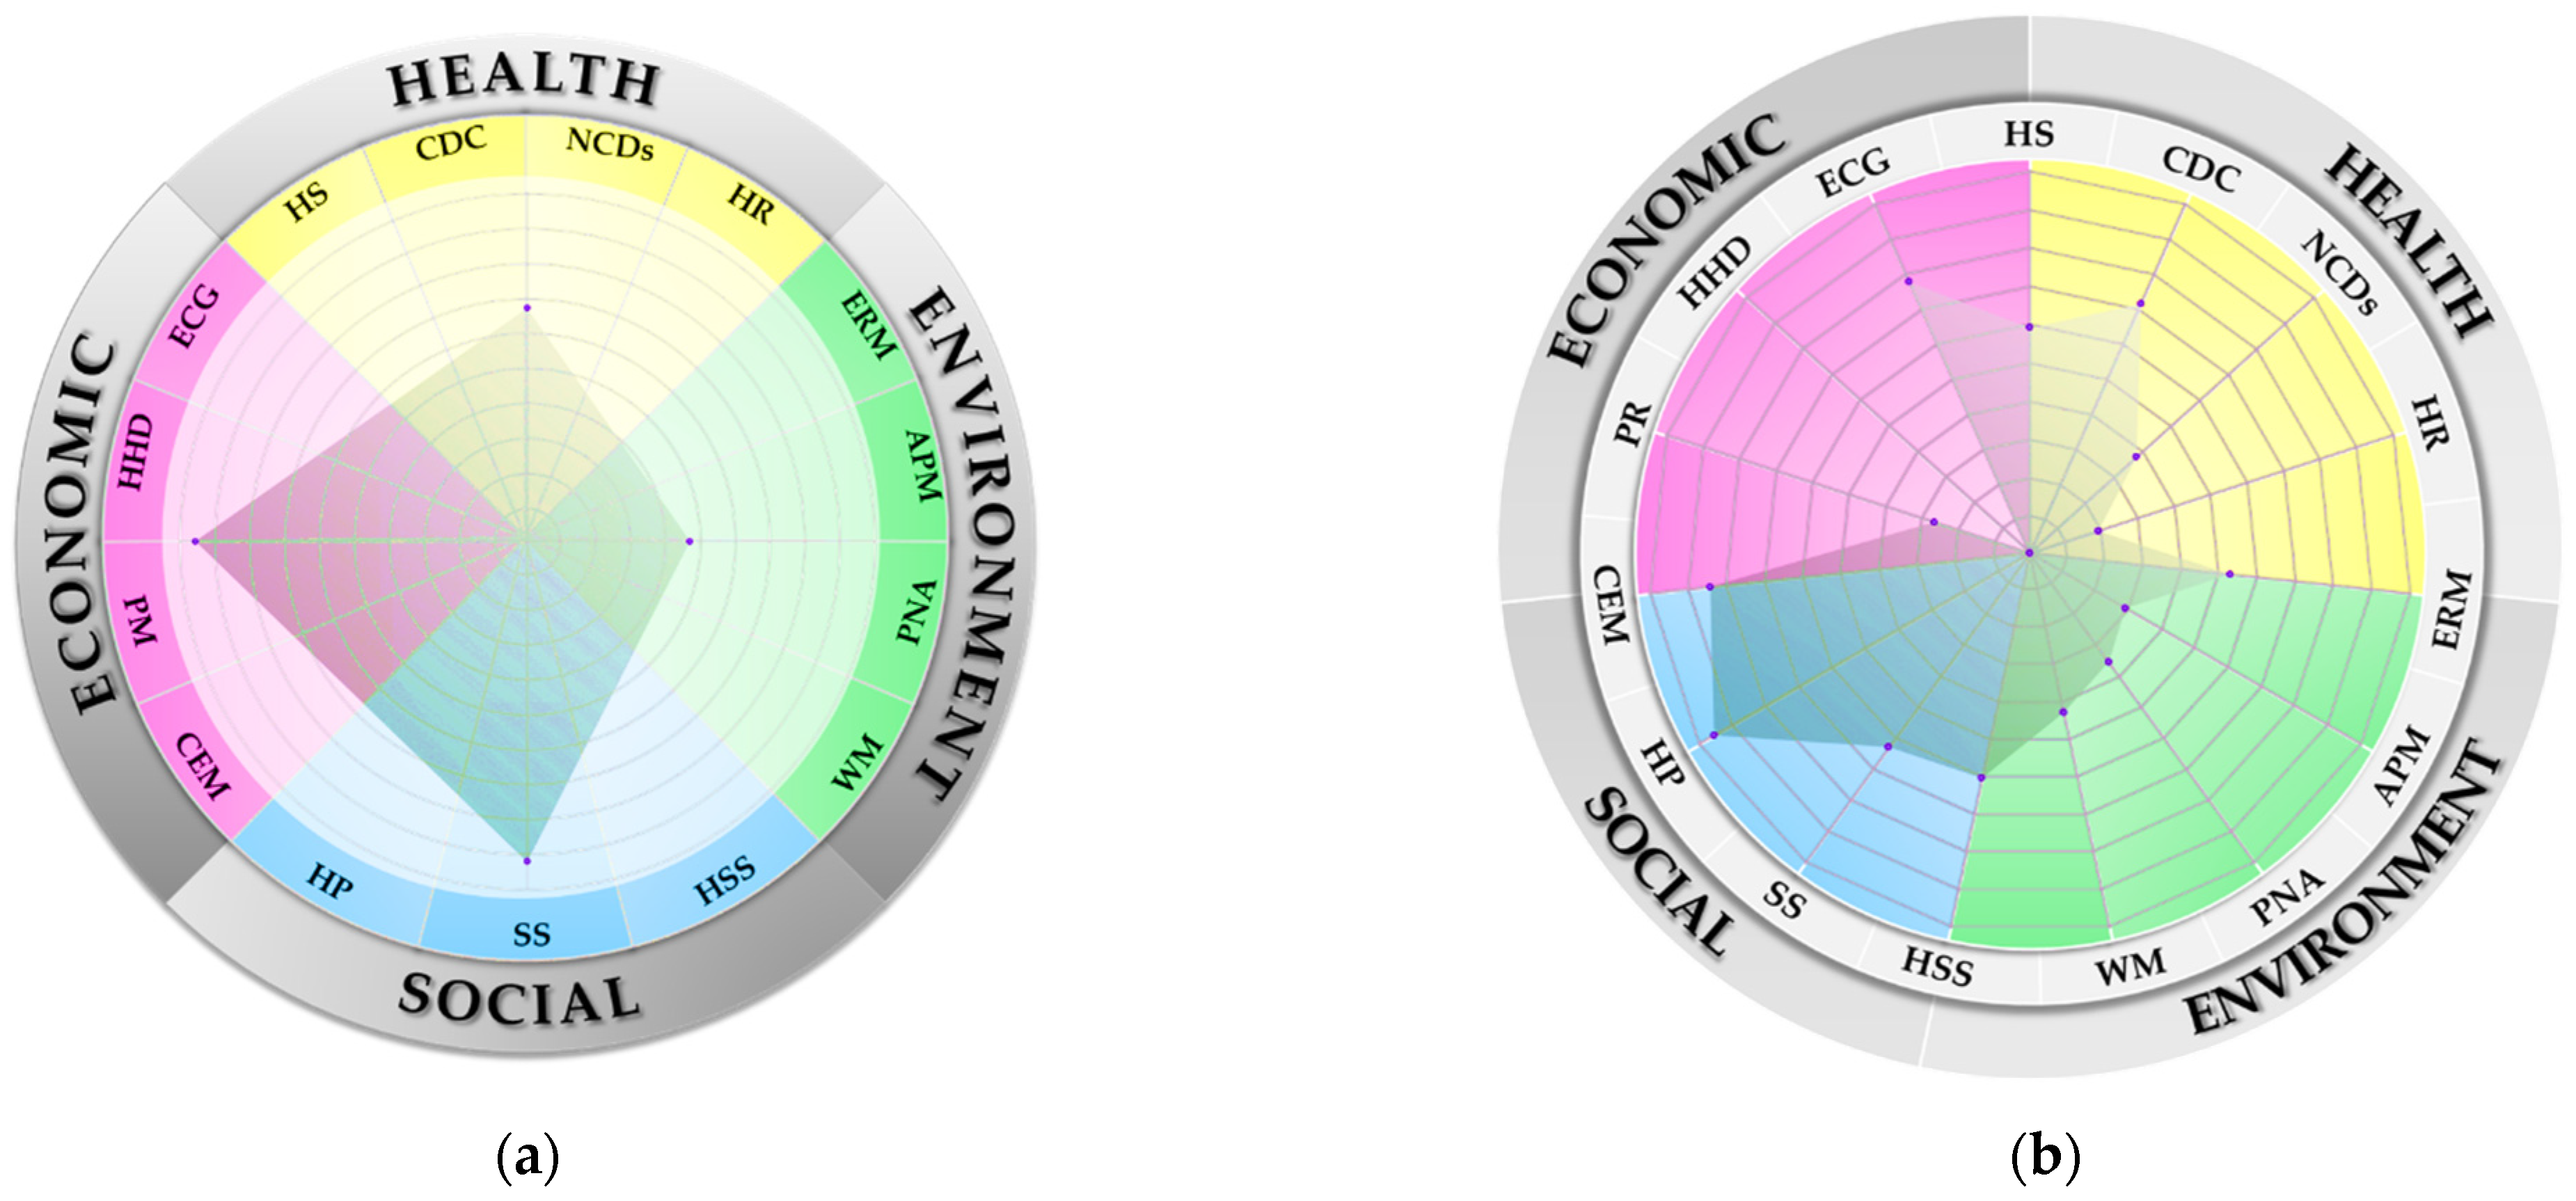
3.3.3. Calculation of Relative Closeness and Ranking of Each Element and Dimension
3.4. Analysis and Strategies
3.4.1. Environment
- Air pollution management: The air pollution management has the lowest . Currently, CSP has moderate air quality that allows people to do outdoor activities, but the air quality is not suitable for members of sensitive groups. CSP should invest in technology to provide information and send real-time alerts on air conditions for people to be on guard in a timely manner.
- Protected natural areas: The Thai royal forest department has formulated a strategy for each city to have natural and artificial forests in at least 40% of their total area. At present, CSP has forested areas in only 11.91% of its total area with 4 national parks, 2 forest parks, 22 national forest reserves and 206 community forests. The forest biomes include hill evergreen forest, dry evergreen forest, mixed deciduous forest and dry deciduous dipterocarp forest. Within the forest are important plants and wild plants, which are invaluable natural resources. The plants categorized as important plants are Pradu, Makha Mong, Tabaek, Hieng, Antimony, Daeng, Teng and Rang while wild sprouts, wild galangal, peg, rattan, wild orchids, vetiver grass are categorized as wild plants. Due to high demand, the majority of inhabitants engage in agriculture, hunting and forestry, leading to issues in the demand on farming areas, forest degradation and forest encroachment. While forest degradation is caused by a lack of public understanding in related laws, forest encroachment is caused by harmful activities, such as illegal logging and clearing as well as slash and burn agriculture, without the awareness to preserve the forest. Moreover, the situation is worsened from insufficient wildfire-controlling equipment. As a result, forests are diminished every year, and wildfires also affect air conditions in the city.
- Authorities must raise awareness on the significance of forests and ecosystems by vigorously enforcing laws against intruders, educating about and clearly allocating farming area and land usage rights as well as formulating a policy to increase greenery, namely natural forests, urban forests or parks in the city. The city can also collaborate with universities to invest in sensor technology, such as heat detection to alert people of a wildfire occurrence. Forests also help reduce air pollution by photosynthesis, thus regaining environmental balance. In particular, seed-bearing plants can convert carbon monoxide into carbon dioxide, which is a necessary resource for photosynthesis; hence, it can be seen that forests can help reduce both carbon monoxide and carbon dioxide in the atmosphere.
- Water management: The CSP covers five river basins, namely the Churn River basin, Phong River basin, Chi River basin, Huai Aak River basin and Lum Phung Choo River basin. The most-utilized areas for agriculture and industry are in the Phong River basin and Chi River basin, respectively. Such usage leads to releases of industrial wastewater, especially in the Lam Nam Phong area where the water quality is critically damaged. Inspections have found that only 7% of water was in good quality, whereas another 53% was in fair condition and the other 40% was in a deteriorated state. Moreover, the quality of water during a drought is relatively deteriorated, affecting the livelihood of aquatic organisms as well as human consumption. Furthermore, contaminated water was also found, particularly in the Chi River flowing through Chonnabot district, Manchakhiri district and Muang district at the area of Tha Phra subdistrict, with high electrical conductivity caused by salinity leaching. Urban expansion also worsens water quality from the release of untreated wastewater into natural resources, as found in Huai Chik in Ban Phai district, Lam Huai Phra Khue district and Nong Khot swamp in Mueang district. With regards to Nam Phong River, water quality is deteriorated by two factors: wastewater from large factories producing pulp mills, sugar, liquor and alcohol and the expansion of fish farming. Water quality in drought is dramatically diminished in accordance with the WMI of CSP, which was found to be at a moderate level. Detailed study has found that an improved balance in resources and usage is needed urgently, and that the policymaker should plan for drought in summer and prepare for flood in rainy season. Previously, to solve the issue, the Kaem Ling Project was initiated by His Majesty Rama IX to address the flooding problem in Thailand and prevent the intrusion of saltwater during drought into rivers, canals and agricultural areas. As the project stores freshwater above floodgates, people can utilize water for agriculture, industrial usage and consumption. At the same time, the project also indirectly helps preserve water and the environment, as the water from reservoirs dilutes sewage when released into ditches and pushes effluent into the sea.
- Environment risk management: Even environmental elements were assessed with the highest . When comparing with the standards set by MOPH that each province must have ERM more than 60%, CSP was found to have attained only 25%. As a result, responsible agencies should implement measures as follows. (1) Basic level: launch a measure to accurately identify environmental issues affecting health within the area together with an action plan at the local level. (2) Intermediate level: establish a working group at the provincial level to manage environmental problems and a team of specialists to investigate occupational and environmental diseases with at least one team per province. In addition, the team should manage environmental problems concretely affecting health as well as emphasizing at least two environmental elements for health promotion. (3) Advanced level: the city should be able to accommodate 50% of the population in relation to risk management and health protection.
3.4.2. Health
- Health resource: The assessment has shown that the health resource element has the lowest value. CSP is equipped with the most complete and abundant public health resources in northeastern Thailand. Such resources include 32 hospitals which can be categorized by their lines of management as follows: 23 hospitals under provincial public health offices, 2 university hospitals in Khon Kaen province, 1 hospital under the Ministry of Defense, 1 hospital under the Department of Health, 1 hospital under the Department of Mental Health, 1 hospital under the medical department and 3 private hospitals. All of these hospitals, with 248 subdistrict health-promoting hospitals, are responsible for caring for the people living in the area. While CSP is geared to be a national center of excellence for medical services in the future—or Medicopolis, as defined by the Thailand Center of Excellence for Life Sciences (TCELS)—with efforts to create an ecosystem among academies, researchers and startups with a regulatory sandbox in the area, the present capability of public health resources, as discussed in VR16–VR20, is under international standards. Hence, CSPs should improve those IDCs to meet the criteria stipulated by the WHO, such as the requirement for physician ratios to be between the minimum of 10 physicians and the maximum of 170 physicians per 100,000 population, the hospital bed ratio to be between 110 beds at minimum and 300 beds at maximum per 100,000 population, the number of nursing and midwifery personnel to be between 60 persons at minimum and 380 persons at maximum per 100,000 population, the number of psychiatrists to be between 1.7 persons at minimum and 6 persons per 100,000 population at maximum and the total health workers to be between 210 persons at minimum and 780 persons at maximum per 100,000 population to achieve the target of being a holistic medical center in the future.
- Non-communicable disease control: It is found that management of all IDCs in CSP is lower than the HIS value shown in Table 2 except VR13, or diabetes mellitus mortality rate. Diabetes is caused by many factors, including genetic factors and environmental factors with increased risk for people over 45 years, people with genetic inheritances, Asians with a body mass index (BMI) from 25 to 23, people with high blood pressure of 140/90 mm Hg and people who are physically inactive. MOPH should provide more information on self-monitoring, preliminary diabetes risk assessment and the communal level of screening. To detect the issue early, it is necessary to coordinate with village health volunteers and medical volunteers on screenings to access the at-risk groups and register them into the healthcare system to control the severity of the illness before it induces other complications.
- Communicable disease control: All IDCs were found to be lower than the HIS values listed in Table 2 except VR08, or pneumonia mortality rate. Pneumonia can occur within the general public, especially in young children under two years old and people over 65 years old. The disease is also found in hospitalized patients, especially in the intensive care unit (ICU) or for people with chronic diseases such as diabetes, asthma, chronic obstructive pulmonary disease and heart disease as well as patients who are immunocompromised, such as HIV-infected or AIDS patients, organ transplant recipients, patients receiving chemotherapy or taking immunosuppressants for a long period. To address the issue, the MOPH must allocate vaccination to these groups, including young children, people over 65 years old and people with low immunity or certain congenital diseases. Treatments include providing flu vaccination to reduce occurrences of infectious pneumonia, pneumococcal vaccine to prevent infection in adults and streptococcus pneumonia vaccine to prevent infection in children.
3.4.3. Social
- Health service standard: The results show that all IDCs had attained a value above HIS except in VR28, or transparency in public health, and VR32, or control of acute infectious diseases. The units under the Office of the Permanent Secretary for Public Health that did not pass the Integrity and Transparency Assessment (ITA) must be inspected and have the following requirements enforced: (1) periodically disclose active procurement information to the public on websites to ensure transparency in procurement each month and fiscal year; (2) implement policies on human resource management and development with respect to human rights and dignity; (3) provide channels for complaints with statistical reports of said complaints; (4) formulate a preventive action plan on anti-corruption, anti-misconduct and ethics promotion with reports of activities not in compliance with the code of ethics; (5) stimulate measures to prevent and solve issues on harassment, including sexual harassment in the workplace.
- Social safety: All IDCs were found to be above HIS except VR34, or alcohol drinking mortality, and VR35, or traffic accident mortality. Based on the result, the MOPH should establish a unit properly providing guidance on ending alcoholism. The unit should be privately and easily accessed, and counselees should be able to be regarded as anonymous. To address the problem in VR35, infrastructures should be taken into consideration, as CSP is a transportation hub with the highest population in the country and an increasing number of cars every year regardless of the fact that infrastructure has not been upgraded or improved. As a result, existing infrastructure cannot sufficiently support rising numbers of vehicles, thus causing road accidents. The government should assign importance to infrastructure projects for accident prevention such as (1) installation of flexible posts instead of steel poles to reduce impulse of force; (2) installation of road studs to visibly show lane lines at night; (3) provision of speed humps to slow down vehicles, especially in crowded areas; (4) installation of curved glass to reduce accidents in blind spots; (5) installation of solar street lights that can function even in electricity-inaccessible areas and curved warning lights to increase visibility both during the day and at night; (6) installation of Euro Smart crash cushions to absorb forces from collisions at speeds of 50–110 km/h in dangerous areas such as traffic islands, merge lanes and the beginnings and ends of bridges; (7) provision of safety islands in areas with heavy traffic to raise safety and reduce road accidents; (8) installation of overpasses, U-turn bridges and smart traffic lights.
- Health promotion: The assessment has shown that all IDCs are above HIS except VR40, or management of glycemic control, and VR41, or management of blood pressure control. The result is consistent with causes from factors in NCDs that cause the diabetes mortality rate to exceed the world average in CSP. VR40 and VR41 are important tools for screening people at risk of diabetes and high blood pressure so they may register and receive proper treatment. Responsible agencies should accelerate the screening as much as possible to reduce the mortality rate caused by the disease by first seeking cooperation with medical volunteers to hold preliminary screenings for the groups and register them into the system, and then conducting detailed examinations at hospitals to properly treat these groups before the disease becomes more severe.
3.4.4. Economic
- Household debt: the assessment has found that the value exceeds the standard, which is in line with the CPS data that the number of households with low incomes is increasing annually. Hence, the government should provide assistance with debt reduction as follows: (1) improve repayment methods on education loans, reordering the order of debt written-off and lowering the default interest rate; (2) take debt restructuring as its main agenda to reduce the burdens of debtors; (3) solve issues around hire purchase debt of automotive by appropriately supervising fair conduct in vehicle leasing businesses; (4) solve debt problems of civil servants; (5) reduce and review structures and ceilings of interest rates and fees to help people and SMEs access credit at an appropriate rate; (6) implement the BOT’s Debt Clinic project to encourage the conversion of nonmortgage debt from credit cards, cash cards and personal loans into long-term credit with low interest; (7) improve judicial processes to facilitate debt litigation.
- Economic growth: Despite the assessment result that economic growth has the highest , the growth rate, which considered to be acceptable, is still lower than expected, which is mainly due to the pandemic at the end of the year. The government should take measures to preliminarily stimulate the economy, especially after the pandemic, as CSP is a province with high economic sustainability because of its location in the East–West Economic Corridor and at the junction of the north–south economic links to the eastern seaboard. When considering gross provincial product (GPP), the main income of CSP largely comes from the nonagricultural sector, contributing 88.37% of the total GPP. Detailed statistics show that 36.56% comes from manufacturing, while services account for 49.48% of the total GPP. Within the service sector, educational services account for 11.34%, while trade and automotives account for 11.27%. Hence, it can be concluded that CSP has outstanding capabilities in the manufacturing, education, trade and automotive sectors consistent with its location close to the cross-border trade area in Mukdahan province with abundant opportunity to export products to neighboring countries.
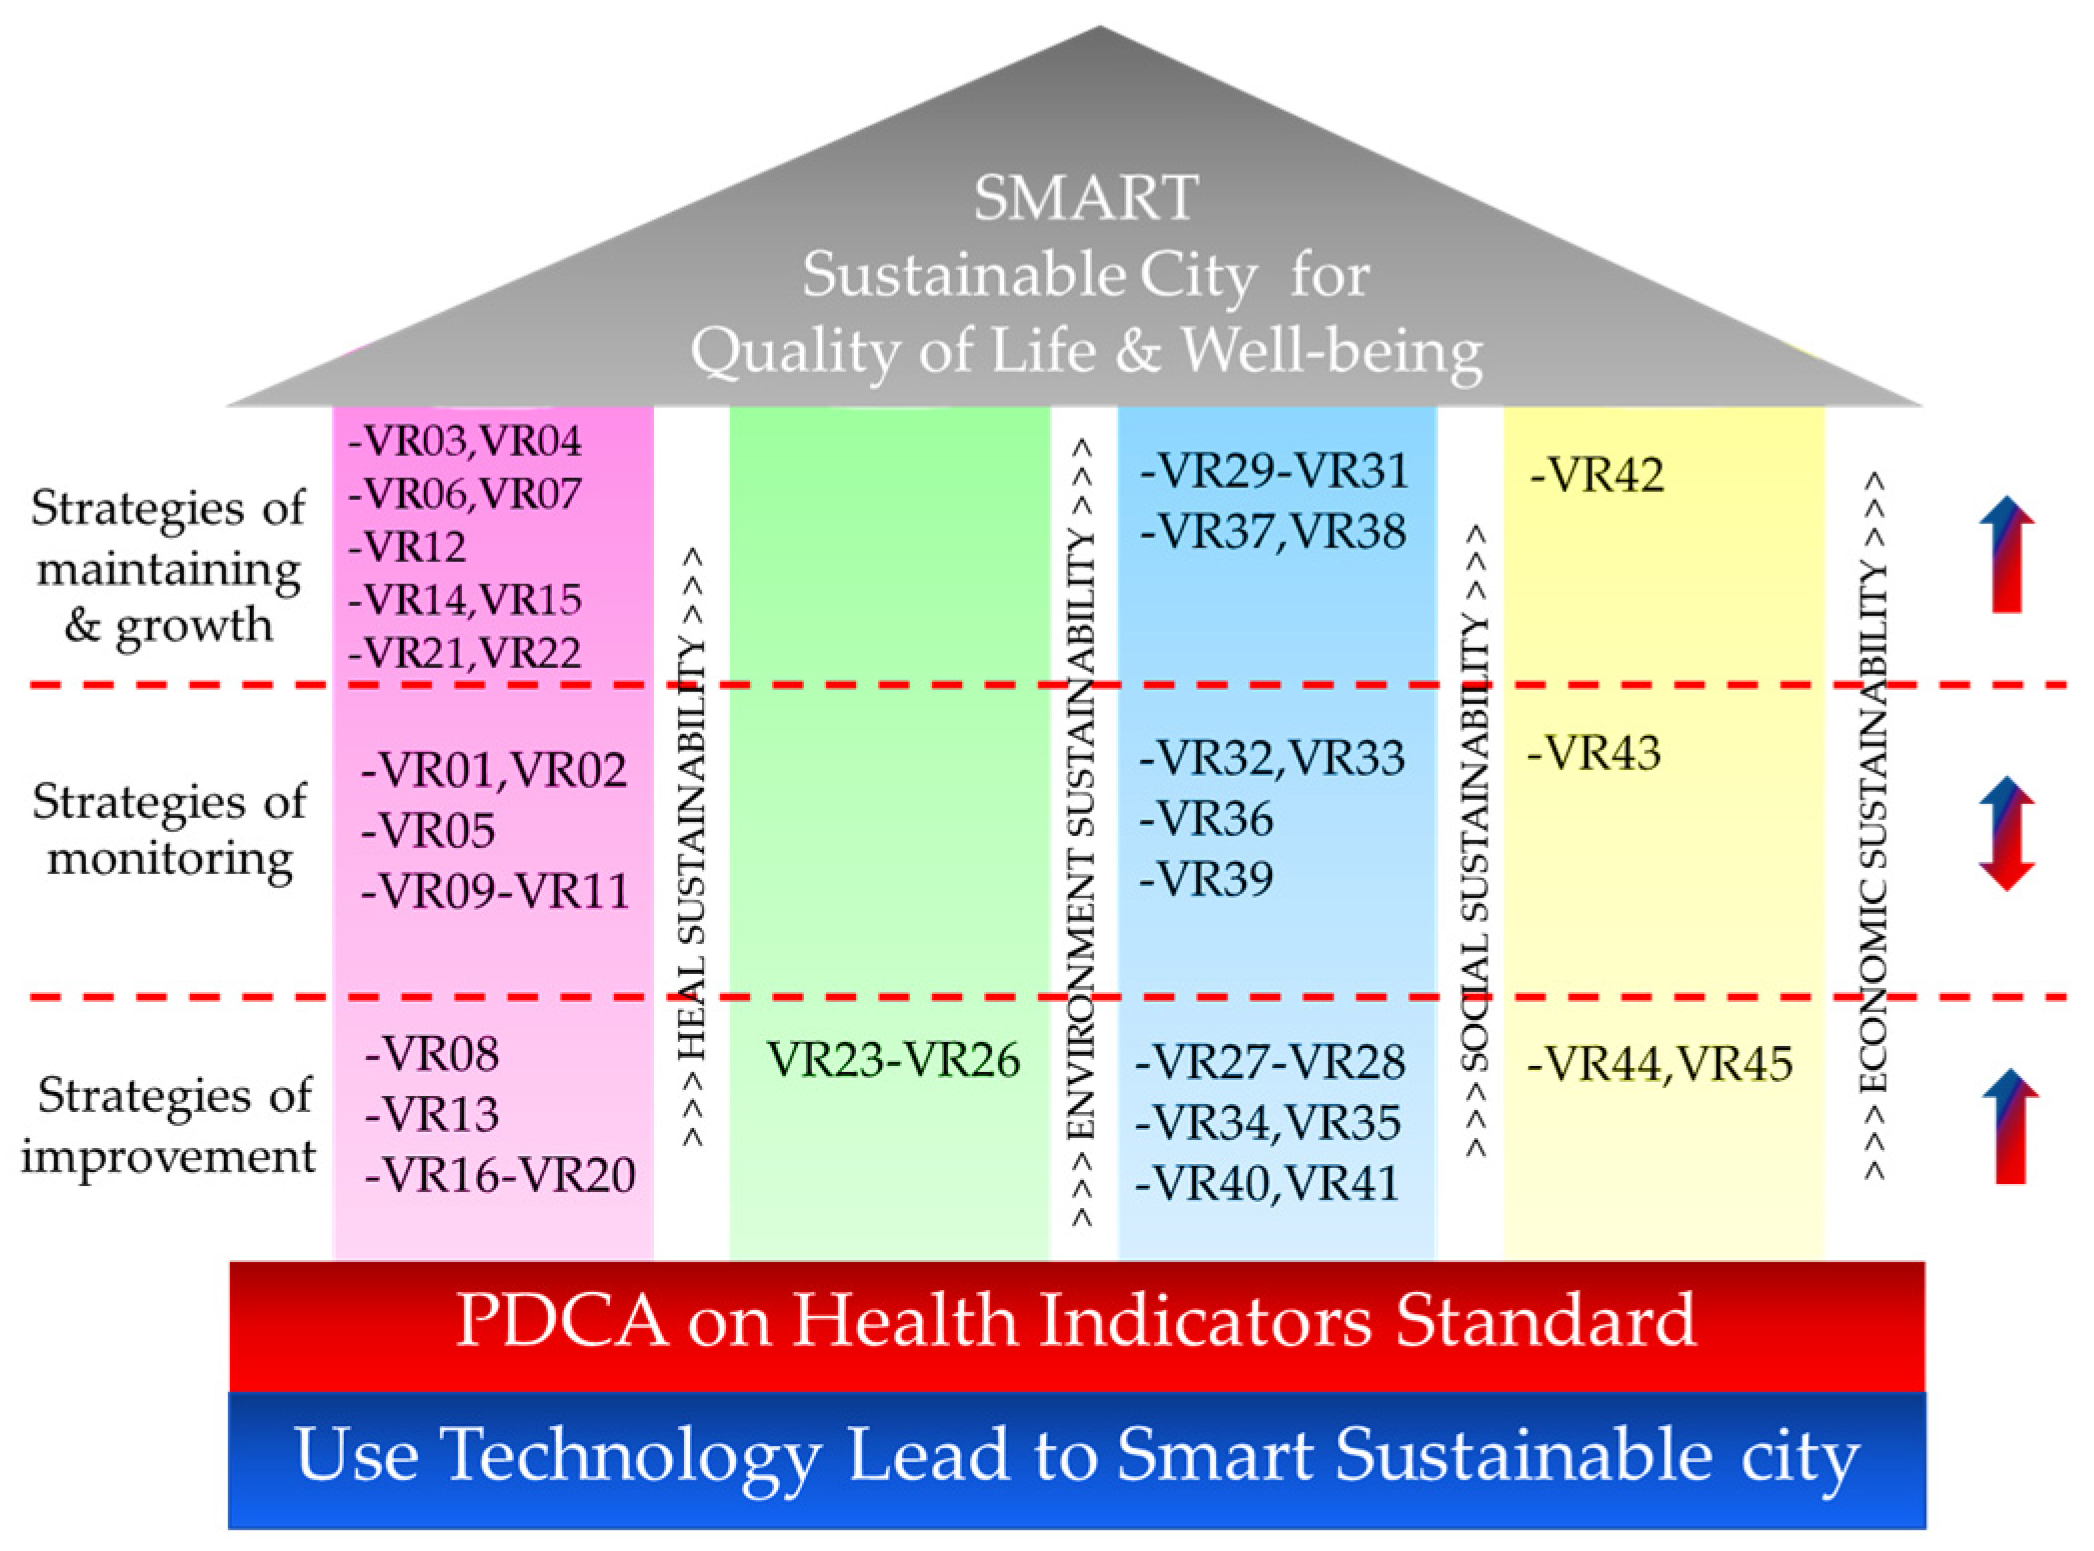
- The first pillar, or health sustainability: As the analysis has found a number of areas with room for improvement, the elements applicable to this strategy include VR03, or number of deaths, VR04, or infant mortality livebirth, VR06, or HIV/AIDS mortality, VR07, or Tuberculosis mortality, VR12, or ischemic heart disease mortality, VR14, or chronic obstructive pulmonary disease mortality, VR15, or kidney disease mortality, VR21, or ambulance, and VR22, or electronic medical records.
- The third pillar, or social sustainability: three elements are applicable to this strategy, which are VR29, or green and clean hospital administration, VR30, or management of public health crises, and VR31, or community hospital quality.
- The fourth pillar, or economic sustainability: only VR42, or unemployment rate, is applicable to the strategy.
- The first pillar, or health sustainability: there are five elements that are applicable to this strategy, including VR01, or life expectancy, VR02, or low-birth-weight newborns, VR05, or suicide mortality, VR09, or diarrhea mortality, and VR11, or stroke mortality.
- The third pillar, or social sustainability: four elements are applicable to this strategy, including VR32, or control of acute infectious diseases, VR33, or smoking mortality rate, VR36, or crime mortality rate, and VR39, or obesity (BMI > 30 kg/m2).
- The fourth pillar, or economic sustainability: only VR43, or population living in poverty, is applicable to this strategy.
- The first pillar, or health sustainability: there are seven elements applicable to this strategy, including VR08, or pneumonia mortality, VR13, or diabetes mellitus mortality, VR16, or physicians per 100,000 population, VR17, or hospital beds per 100,000 population, VR18, or nursing and midwifery personnel per 100,000 population, VR19, or psychiatrists per 100,000 population, and VR20, or total health workers per 100,000 population.
- The second pillar, or environmental sustainability: only four elements are applicable to this strategy. The elements are VR23, or environmental risk management, VR24, or average of AQI index, VR25, or forest area rate, and VR26, or water management index.
- The third pillar, or social sustainability: there are six elements applicable to this strategy. The elements are VR27, or health resource management, VR28, or transparency in public health, VR34, or alcohol drinking mortality rate, VR35, or traffic accident mortality rate, VR40, or management of glycemic control, and VR41, or management of blood pressure control.
- The fourth pillar, or economic sustainability: only VR44, or household debt per income ratio, and VR45, or gross provincial product growth rate, are applicable to this strategy.
4. Discussion
Limitations and Future Research
- Although 15 experts providing opinions are suitable for using AHP analysis in this research, future research may require a larger number of experts from different fields such as city development, economy, social development and environment to gather more opinions from multiple aspects.
- This research was conducted at provincial level, while future research can extend the scope to a regional or national level to identify and address issues on a macro level.
- Since this research uses HIS values as a basis of comparison, it is necessary to update data to reflect the latest conditions.
- While this research focuses on assessing and prioritizing indicators as well as the city in their current conditions, it does not indicate precedent conditions or consequences.
- Future research should incorporate other analyses such as regression analysis to compare and identify causes and effects of each indicator that may change in the future.
5. Conclusions
- Health indicator standards from this research can be used to establish goals for urban development in various dimensions of sustainable city development to comply with international standards.
- The IDC weight obtained from the AHP technique can be used to determine the level of importance of each IDC. It may be determined from the IDC results which city has the potential to conduct an assessment first. The IDCs are not necessarily to be conducted concurrently, as it may affect the efficiency of budget management of the city. On the other hand, it is also possible to adjust IDCs and HISes to fit with secondary data of the city before usage; even so, such adjustments should be within the objectives.
- At present, local leaders in Thailand often make decisions based on personal opinions, thus resulting in a lack of information on the real problems and urgent needs of the city. The result is inefficient investments that may not match actual expectations at the time.
- This research shall enable policymakers and decision-makers in budget planning at both at the national and local level to assess and select strategies for urban development. With indicators in 4 dimensions and 15 elements, weaknesses and strengths are shown and utilized in budget planning to precisely develop sustainability from the health aspect, leading to efficient and effective budget utilization and tremendous improvement in the quality of life of the people in the city.
Author Contributions
Funding
Institutional Review Board Statement
Informed Consent Statement
Data Availability Statement
Acknowledgments
Conflicts of Interest
Abbreviations
| STD | Sustainable development |
| SDGs | Sustainable development goals |
| HIS | Health indicator standard |
| WHO | World Health Organization |
| HEDm | Health dimension |
| SODm | Social dimension |
| ENDm | Environmental dimension |
| ECDm | Economic dimension |
| MCDM | Multi criteria decision making |
| AHP | Analytic hierarchy process |
| TOPSIS | Technique for order preference by similarity to the ideal solution |
| IDC | Indicators for evaluation |
| C.R. | Consistency ration |
| Weight of significance | |
| PCM | Pairwise comparison matrix |
| EV | Eigenvector |
| C.I. | Consistency index |
| R.I. | Random consistency index |
| IS | Ideal solution |
| PI | Positive ideal |
| NI | Negative ideal |
| A+ | Positive ideal solution |
| A− | Negative ideal solution |
| The deviation from the positive ideal solution | |
| The deviation from the negative ideal solution | |
| Relative closeness | |
| OD | Objective of each IDC for a decision |
| MOPH | Ministry of Public Health |
| WMI | Water management index |
| CSP | Case study province |
| DM | Decision matrix |
Appendix A

| Number | Title | Experience | Expertise |
|---|---|---|---|
| 1 | M.D. |
| Pulmonary medicine and pulmonary critical care, emergency medicine, community medicine, environmental medicine, internal medicine, specialty in respiratory disease |
| 2 | M.D. |
| Surgery, emergency medicine, pathology |
| 3 | M.D. |
| Maternal nursing infants and midwifery, community medicine, environmental medicine |
| 4 | M.D. |
| Internal medicine, rheumatology and rheumatism, community medicine |
| 5 | M.D. |
| Emergency management, disease control planning, animal science |
| 6 | Dr. |
| Health promotion, community health |
| 7 | Dr. |
| Nutrition and dietetics, food science for health, sanitary |
| 8 | Dr. |
| Macro- and microeconomic policies analysis, international economy |
| 9 | Dr. |
| Analyze and plan work to drive economic and social development |
| 10 | Mr. |
| Social welfare system, human and social development policy |
| 11 | Mr. |
| City planning analysis and development |
| 12 | Dr. |
| Smart sustainable city, smart city, sustainability, economic, sustainable development |
| 13 | Dr. |
| Smart city, smart city characteristics, smart city project analysis, economic |
| 14 | Dr. |
| Carbon footprint, water quality, air quality, noise, toxic substances, environmental quality standards |
| 15 | Dr. |
| Plan and control environment, environment risk factor examination |
| Element | IDC | Unit | Khon Kaen | Data Source | CODE |
|---|---|---|---|---|---|
| Health status | Life expectancy | Year | 75.20 | H.INFO | VR01 b |
| Low-birth-weight newborns | % | 6.28 | HDC | VR02 a | |
| Number of deaths (rate) | 1K | 7.12 | NSO | VR03 a | |
| Infant mortality livebirth (rate) | 1K | 1.92 | H.INFO | VR04 a | |
| Suicide mortality (rate) | 100K | 13.09 | H.INFO | VR05 a | |
| Communicable disease control | HIV/AIDS mortality (rates) | 100K | 4.29 | H.INFO | VR06 a |
| Tuberculosis mortality (rates) | 100K | 9.69 | H.INFO | VR07 a | |
| Pneumonia mortality (rates) | 100K | 61.72 | H.INFO | VR08 a | |
| Diarrhea mortality (rates) | 100K | 2.67 | H.INFO | VR09 a | |
| Non-communicable disease control | Cancer mortality (rates) | 100K | 127.39 | H.INFO | VR10 a |
| Stroke mortality (rate) | 100K | 50.91 | H.INFO | VR11 a | |
| Ischemic heart disease mortality (rate) | 100K | 24.01 | H.INFO | VR12 a | |
| Diabetes mellitus mortality (rate) | 100K | 30.52 | H.INFO | VR13 a | |
| Chronic obstructive pulmonary disease mortality (rate) | 100K | 4.90 | H.INFO | VR14 a | |
| Chronic kidney disease mortality (rate) | 100K | 20.05 | H.INFO | VR15 a | |
| Health resource | Physicians (rate) | 100K | 84 | GISH | VR16 b |
| Hospital beds (rate) | 100K | 280 | GISH | VR17 b | |
| Nursing and midwifery personnel (rate) | 100K | 310 | GISH | VR18 b | |
| Psychiatric physicians (rate) | 100K | 1.50 | GISH | VR19 b | |
| Total Health worker (rate) | 100K | 381.80 | GISH | VR20 b | |
| Ambulance (rate) | 100K | 8.80 | GISH | VR21 b | |
| Electronic Medical Records | % | 99.62 | HDC | VR22 a | |
| Environment risk management | Environmental risk Management | % | 25 | HKPI | VR23 a |
| Air pollution management | Average of AQI Index | Index | 77.71 | AQI | VR24 b |
| Protected natural areas | Forest area rate | % | 11.23 | NSO | VR25 b |
| Water management | Water management Index | Index | 3.03 | WTC | VR26 a |
| Health service standard | Health resource management | % | 3.55 | HKPI | VR27 a |
| Transparency in public health | % | 79.11 | HKPI | VR28 a | |
| Green and clean hospital administration | % | 100 | HKPI | VR29 a | |
| Management of public health crises | % | 100 | HKPI | VR30 a | |
| Community hospital quality | % | 95.08 | HKPI | VR31 a | |
| Control of acute infectious diseases | % | 1 | HKPI | VR32 a | |
| Social security | Smoking mortality (rate) | 100K | 17.10 | H.INFO | VR33 a |
| Alcohol drinking mortality (rate) | 100K | 39.90 | H.INFO | VR34 a | |
| Traffic accident mortality (rate) | 100K | 28.85 | H.INFO | VR35 a | |
| Crime mortality (rate) | % | 0.56 | H.INFO | VR36 a | |
| Health promotion | Universal Health Coverage Service | % | 79.96 | HDC | VR37 a |
| Desirable health behaviors | % | 82.87 | HKPI | VR38 a | |
| Obesity (BMI > 30.0 kg/m2) | % | 2.27 | HDC | VR39 a | |
| Management of Glycemic control | % | 17.97 | HDC | VR40 a | |
| Management of Blood pressure control | % | 46.37 | HDC | VR41 a | |
| City’s employment | Unemployment rate | % | 2.15 | NSO | VR42 a |
| Poverty reduction | Population living in poverty | % | 6.63 | NSO | VR43 a |
| Household debt | Household debt per income ratio | % | 44.99 | NSO | VR44 b |
| Economic growth | Gross Provincial Product growth rate | % | 2.04 | NSO | VR45 a |
References
- Larson, W.E. World conservation strategy. Environ. Polidy Law 1980, 6, 102. [Google Scholar]
- Ding, L.; Shao, Z.; Zhang, H.; Xu, C.; Wu, D. A Comprehensive Evaluation of Urban Sustainable Development in China Based on the TOPSIS-Entropy Method. Sustainability 2016, 8, 746. [Google Scholar] [CrossRef] [Green Version]
- Kjӕrgård, B.; Land, B.; Pedersen, K.B. Health and sustainability. Health Promot. Int. 2013, 29, 558–568. [Google Scholar] [CrossRef] [Green Version]
- Fukuda-Parr, S. From the Millennium Development Goals to the Sustainable Development Goals: Shifts in purpose, concept, and politics of global goal setting for development. Gend. Dev. 2016, 24, 43–52. [Google Scholar] [CrossRef]
- Stachura, P.; Kuligowska, K. Multi-criteria analysis of urban policy for sustainable development decision-making: A case study for Warsaw city, Poland. Procedia Comput. Sci. 2021, 192, 259–269. [Google Scholar] [CrossRef]
- Mori, K.; Christodoulou, A. Review of sustainability indices and indicators: Towards a new City Sustainability Index (CSI). Environ. Impact Assess. Rev. 2012, 32, 94–106. [Google Scholar] [CrossRef]
- Hutyra, L.R.; Yoon, B.; Alberti, M. Terrestrial carbon stocks across a gradient of urbanization: A study of the Seattle, WA region. Glob. Chang. Biol. 2011, 17, 783–797. [Google Scholar] [CrossRef]
- Childers, D.L.; Pickett, S.T.A.; Grove, J.M.; Ogden, L.; Whitmer, A. Advancing urban sustainability theory and action: Challenges and opportunities. Landsc. Urban Plan. 2014, 125, 320–328. [Google Scholar] [CrossRef]
- Mohtashami, N.; Mahdavinejad, M.; Bemanian, M. Contribution of City Prosperity to Decisions on Healthy Building Design: A case study of Tehran. Front. Arch. Res. 2016, 5, 319–331. [Google Scholar] [CrossRef] [Green Version]
- Vasuaninchita, M.; Vongmanee, V.; Rattanawong, W. The Novel Paradigm of Economics Driven for Local Smart Sustain Cities Modeling Using Exploratory Factor Analysis and Planning Technique Using Fuzzy Evaluation Decision Making. Sustainability 2020, 12, 793. [Google Scholar] [CrossRef] [Green Version]
- Vasuaninchita, M.; Vongmanee, V.; Rattanawong, W. The Novel Paradigm of “Economic Driven Smart City” to the Sustainability. In Proceedings of the 6th Asian Academic Society International Conference (AASIC), a Transformative Community: Asia in Dynamism, Innovation and Globalization, Chiang Rai, Thailand, 8–10 November 2018. [Google Scholar]
- Vasuaninchita, M.; Vongmanee, V.; Rattanawong, W. The Local and Sustainability Context of Smart Cities Model; Thailand Prototype, Structure Formation by EFA-CFA Method. In Proceedings of the Universal Academic Cluster International Autumn Conferences, Kyoto, Japan, 16–18 October 2019; pp. 33–44. [Google Scholar]
- Yang, B.; Xu, T.; Shi, L. Analysis on sustainable urban development levels and trends in China’s cities. J. Clean. Prod. 2017, 141, 868–880. [Google Scholar] [CrossRef]
- Cease, B.; Kim, H.; Kim, D.; Ko, Y.; Cappel, C. Barriers and incentives for sustainable urban development: An analysis of the adoption of LEED-ND projects. J. Environ. Manag. 2019, 244, 304–312. [Google Scholar] [CrossRef]
- Zhou, D.; Xu, J.; Wang, L.; Lin, Z. Assessing urbanization quality using structure and function analyses: A case study of the urban agglomeration around Hangzhou Bay (UAHB), China. Habitat Int. 2015, 49, 165–176. [Google Scholar] [CrossRef]
- Wątróbski, J.; Bączkiewicz, A.; Ziemba, E.; Sałabun, W. Sustainable cities and communities assessment using the DARIA-TOPSIS method. Sustain. Cities Soc. 2022, 83, 103926. [Google Scholar] [CrossRef]
- Zavadskas, E.K.; Cavallaro, F.; Podvezko, V.; Ubarte, I.; Kaklauskas, A. MCDM Assessment of a Healthy and Safe Built Environment According to Sustainable Development Principles: A Practical Neighborhood Approach in Vilnius. Sustainability 2017, 9, 702. [Google Scholar] [CrossRef] [Green Version]
- Tang, J.; Zhu, H.-L.; Liu, Z.; Jia, F.; Zheng, X.-X. Urban Sustainability Evaluation under the Modified TOPSIS Based on Grey Relational Analysis. Int. J. Environ. Res. Public Health 2019, 16, 3996. [Google Scholar] [CrossRef] [Green Version]
- Dang, W.V.-T.; Wang, J.; Dang, V.-T. An Integrated Fuzzy AHP and Fuzzy TOPSIS Approach to Assess Sustainable Urban Development in an Emerging Economy. Int. J. Environ. Res. Public Health 2019, 16, 2902. [Google Scholar] [CrossRef] [Green Version]
- Zhu, S.; Li, D.; Feng, H.; Gu, T.; Zhu, J. AHP-TOPSIS-Based Evaluation of the Relative Performance of Multiple Neighborhood Renewal Projects: A Case Study in Nanjing, China. Sustainability 2019, 11, 4545. [Google Scholar] [CrossRef] [Green Version]
- Paz, T.D.S.R.; Caiado, R.G.G.; Quelhas, O.L.G.; Gavião, L.O.; Lima, G.B.A. Assessment of sustainable development through a multi-criteria approach: Application in brazilian municipalities. J. Environ. Manag. 2021, 282, 111954. [Google Scholar] [CrossRef] [PubMed]
- Long, R.; Li, H.; Wu, M.; Li, W. Dynamic evaluation of the green development level of China’s coal-resource-based cities using the TOPSIS method. Resour. Policy 2021, 74, 102415. [Google Scholar] [CrossRef]
- Boggia, A.; Massei, G.; Pace, E.; Rocchi, L.; Paolotti, L.; Attard, M. Spatial multicriteria analysis for sustainability assessment: A new model for decision making. Land Use Policy 2018, 71, 281–292. [Google Scholar] [CrossRef]
- Paolotti, L.; Gomis, F.D.C.; Torres, A.A.; Massei, G.; Boggia, A. Territorial sustainability evaluation for policy management: The case study of Italy and Spain. Environ. Sci. Policy 2018, 92, 207–219. [Google Scholar] [CrossRef]
- Hély, V.; Antoni, J.-P. Combining indicators for decision making in planning issues: A theoretical approach to perform sustainability assessment. Sustain. Cities Soc. 2018, 44, 844–854. [Google Scholar] [CrossRef]
- Skvarciany, V.; Jurevičienė, D.; Volskytė, G. Assessment of Sustainable Socioeconomic Development in European Union Countries. Sustainability 2020, 12, 1986. [Google Scholar] [CrossRef] [Green Version]
- International Organization for Standardization. Sustainable Cities and Communities: Indicators for City Services and Quality of Life; International Organization for Standardizaiton: Geneva, Switzerland, 2018. [Google Scholar]
- International Organization for Standardization. Sustainable Cities and Communities—Indicators for Smart Cities; International Organization for Standardizaiton: Geneva, Switzerland, 2019. [Google Scholar]
- International Organization for Standardization. Sustainable Cities and Communities—Indicators for Resilient Cities; International Organization for Standardizaiton: Geneva, Switzerland, 2018. [Google Scholar]
- UNECE. The United for Smart Sustainable Cities: U4SSC. Collection Methodology for Key Performance Indicators for Smart Sustainable Cities; The United Nations Economic Commission for Europe: Geneva, Switzerland, 2017. [Google Scholar]
- Ritmak, N.; Vongmanee, V.; Rattanawong, W. The new thinking for the urbanization design to the sustainable smart city with health driven context under pandemics situation. In Proceedings of the 5th International Conference on Future Smart Cities: Smart Manufacturing, Sepang, Malaysia, 18–20 November 2022; p. 33. [Google Scholar]
- Rovinelli, R.J.; Hambleton, R.K. On the use of content specialists in the assessment of criterion-referenced test item validity. ERIC Inst. Educ. Sci. 1976, ED121845. Available online: https://eric.ed.gov/?id=ED121845 (accessed on 16 October 2022).
- Saaty, T.L. What is the Analytic Hierarchy Process? In Mathematical Models for Decision Support; Springer: Berlin/Heidelberg, Germany, 1988; pp. 109–121. [Google Scholar]
- Hwang, C.L.; Yoon, K. Methods for Multiple Attribute Decision Making. In Multiple Attribute Decision Making; Springer: Berlin/Heidelberg, Germany, 1981; pp. 58–191. [Google Scholar]
- United Nations. Life Expectancy of the World Population 1950–2020. Available online: https://www.worldometers.info/demographics/life-expectancy/ (accessed on 16 October 2022).
- UNICEF. Low birthweight. Available online: https://data.unicef.org/topic/nutrition/low-birthweight/ (accessed on 16 October 2022).
- Knoema. World—Crude death rate. Available online: https://knoema.com/atlas/World/Death-rate (accessed on 16 October 2022).
- United Nations. Good Health and Well-Being Goal Targets. Available online: https://www.undp.org/sustainable-development-goals#good-health (accessed on 16 October 2022).
- World Health Organization; Global Health Observatory Data Repository. Suicide Mortality Rate Per 100,000 Population in 2019. Available online: https://data.worldbank.org/indicator/SH.STA.SUIC.P5 (accessed on 16 October 2022).
- Govender, R.D.; Hashim, M.J.; Khan, M.A.; Mustafa, H.; Khan, G. Global Epidemiology of HIV/AIDS: A Resurgence in North America and Europe. J. Epidemiol. Glob. Health 2021, 11, 296–301. [Google Scholar] [CrossRef]
- World Health Organization; Global Tuberculosis Report. Incidence of Tuberculosis Per 100,000 People in 2020. Available online: https://data.worldbank.org/indicator/SH.TBS.INCD?end=2020&start=2020&view=map (accessed on 16 October 2022).
- Institute for Health Metrics and Evaluation; Global Burden of Disease. Pneumonia. Available online: https://ourworldindata.org/pneumonia (accessed on 16 October 2022).
- Institute for Health Metrics and Evaluation; Global Burden of Disease. Diarrheal Diseases. Available online: https://ourworldindata.org/diarrheal-diseases (accessed on 16 October 2022).
- Institute for Health Metrics and Evaluation; Global Burden of Disease. Cancer. Available online: https://ourworldindata.org/cancer (accessed on 16 October 2022).
- Institute for Health Metrics and Evaluation; Global Burden of Disease. Death Rate from Stoke, 1990 to 2019. Available online: https://ourworldindata.org/grapher/stroke-death-rates?tab=table&yScale=log (accessed on 16 October 2022).
- Tsao, C.W.; Aday, A.W.; Almarzooq, Z.I.; Alonso, A.; Beaton, A.Z.; Bittencourt, M.S.; Boehme, A.K.; Buxton, A.E.; Carson, A.P.; Commodore-Mensah, Y.; et al. Heart Disease and Stroke Statistics—2022 Update: A Report from the American Heart Association. Circulation 2022, 145, e153–e639. [Google Scholar] [CrossRef]
- Safiri, S.; Karamzad, N.; Kaufman, J.S.; Bell, A.W.; Nejadghaderi, S.A.; Sullman, M.J.M.; Moradi-Lakeh, M.; Collins, G.; Kolahi, A.-A. Prevalence, Deaths and Disability-Adjusted-Life-Years (DALYs) Due to Type 2 Diabetes and Its Attributable Risk Factors in 204 Countries and Territories, 1990-2019: Results from the Global Burden of Disease Study 2019. Front. Endocrinol. 2022, 13, 838027. [Google Scholar] [CrossRef]
- Safiri, S.; Carson-Chahhoud, K.; Noori, M.; Nejadghaderi, S.A.; Sullman, M.J.M.; Heris, J.A.; Ansarin, K.; Mansournia, M.A.; Collins, G.S.; Kolahi, A.-A.; et al. Burden of chronic obstructive pulmonary disease and its attributable risk factors in 204 countries and territories, 1990-2019: Results from the Global Burden of Disease Study 2019. BMJ 2022, 378, e069679. [Google Scholar] [CrossRef]
- World Life Expectancy. Cause of Death. Available online: https://www.worldlifeexpectancy.com/cause-of-death/ (accessed on 17 October 2022).
- World Health Organization. Health Workforce Requirements for Universal Health Coverage and the Sustainable Development Goals.(Human Resources for Health Observer, 17); World Health Organization: Geneva, Switzerland, 2016. [Google Scholar]
- Akhter, S. The New Healthcare Policy Mandates a Minimum of 2 Beds per 1000: Sumeet Aggarwal. Available online: https://health.economictimes.indiatimes.com/news/industry/the-new-healthcare-policy-mandates-a-minimum-of-2-beds-per-1000-sumeet-aggarwal/62992210 (accessed on 16 October 2022).
- World Health Organization. Hospital Beds Per 1000 People. Available online: https://data.worldbank.org/indicator/SH.MED.BEDS.ZS (accessed on 16 October 2022).
- Garg, K.; Kumar, C.N.; Chandra, P.S. Number of psychiatrists in India: Baby steps forward, but a long way to go. Indian J. Psychiatry 2019, 61, 104–105. [Google Scholar] [CrossRef]
- Michas, F. Rate of Global Mental Health Workforce in 2020, by Type. Available online: https://0-www-statista-com.brum.beds.ac.uk/statistics/796082/mental-health-workforce-per-population-rate-worldwide-by-type/ (accessed on 16 October 2022).
- Kobusingye, O.C.; Hyder, A.A.; Bishai, D.; Joshipura, M.; Hicks, E.R.; Mock, C. Emergency Medical Services. In Disease Control Priorities in Developing Countries, 2nd ed.; World Bank Publications: Washington, DC, USA, 2006. [Google Scholar]
- Singh, J. Ambulance Emergency. Available online: https://www.downtoearth.org.in/coverage/ambulance-emergency-40605 (accessed on 16 October 2022).
- Ministry of Public Health. Health Data Center (HDC) & Health Information Exchange (HIE). Available online: https://hdcservice.moph.go.th/hdc/main/index.php# (accessed on 16 October 2022).
- Ministry of Public Health. Health KPI. Available online: http://healthkpi.moph.go.th/kpi2/kpi/index2/ (accessed on 16 October 2022).
- The World Air Quality Index Project. About the Air Quality and Pollution Measurement 2008–2022. Available online: https://aqicn.org//here/ (accessed on 16 October 2022).
- Ministry of Natural Resources and Environment. Royal Forest Department Strategy 20 Years 2017–2036. 2017. Available online: https://www.sme.go.th/en/page.php?modulekey=378 (accessed on 16 October 2022).
- National Statistical Office. Water Management Index. 2020. Available online: http://wtc.nso.go.th/#/info-first (accessed on 16 October 2022).
- Bamrungwong, N.; Vongmanee, V.; Rattanawong, W. The Development of a CO2 Emission Coefficient for Medium- and Heavy-Duty Vehicles with Different Road Slope Conditions Using Multiple Linear Regression and Considering the Health Effects. Sustainability 2020, 12, 6994. [Google Scholar] [CrossRef]
- Institute for Health Metrics and Evaluation; Global Burden of Disease. Death Rate from Smoking, 1990 to 2019. Available online: https://ourworldindata.org/grapher/death-rate-smoking?tab=table (accessed on 16 October 2022).
- Institute for Health Metrics and Evaluation; Global Burden of Disease. Death Rate from Alcohol Use Disorders, 1990 to 2019. Available online: https://ourworldindata.org/grapher/death-rates-from-alcohol-use-disorders?tab=chart (accessed on 16 October 2022).
- Institute for Health Metrics and Evaluation; Global Burden of Disease. Death Rate from Road Injuries, 1990–2019. Available online: https://ourworldindata.org/grapher/death-rates-road-incidents?tab=table (accessed on 17 October 2022).
- Institute for Health Metrics and Evaluation; Global Burden of Disease. Homicides. Available online: https://ourworldindata.org/homicides (accessed on 17 October 2022).
- Institute for Health Metrics and Evaluation; Global Burden of Disease. Obesity. Available online: https://ourworldindata.org/obesity (accessed on 17 October 2022).
- United Nations. Promote Sustained, Inclusive and Sustainable Economic Growth, Full and Productive Employment and Decent Work for All. Available online: https://unstats.un.org/sdgs/report/2021/goal-08/ (accessed on 17 October 2022).
- Hassel, J. World Bank Data are Based on Primary Household Survey Data Obtained from Government Statistical Agencies and World Bank Country Departments. Share of Population Living in Extreme Poverty, 1990 to 2019. Available online: https://ourworldindata.org/extreme-poverty (accessed on 17 October 2022).
- Murphy, C.B. Debt-to-Income (DTI) Ratio: What’s Good and How To Calculate It. Available online: https://www.investopedia.com/terms/d/dti.asp (accessed on 17 October 2022).
- Bank of Thailand. Thai Economic Forecast. Available online: https://www.bot.or.th/Thai/Segmentation/Business/Pages/GDP.aspx# (accessed on 17 October 2022).


| Objective | DM/NOC | NOA | ET | WT | CW | LOA | Ref | ||
|---|---|---|---|---|---|---|---|---|---|
| DM | EM | RK | |||||||
| Evaluate the level of sustainable development with the phenomenon of spatial clustering: a case study in China | Env. = 7 | 287 | TOPSIS | ETP | Alt | 3 | [2] | ||
| Soc. = 10 | |||||||||
| Econ. = 6 | |||||||||
| Evaluate urban sustainability where grey relation analysis is used to reduce uncertainty in the process of evaluation: a case study in China | Env. = 12 | 16 | TOPSIS | ETP | Alt | 3 | [18] | ||
| Soc. = 15 | |||||||||
| Econ. = 12 | |||||||||
| Assess sustainable urban development in an emerging economy with fuzzy-TOPSIS where there is a lack of clear data: a case study in Vietnam | Env. = 7 | 4 | TOPSIS | Fuzzy-AHP | Alt | 3 | [19] | ||
| Soc. = 7 | |||||||||
| Econ. = 6 | |||||||||
| Assess a healthy and safe built environment with integrated MCDM methods: a case study in Lithuania | Env. = 4 | 21 | MCDM | EP | Alt | 3 | [17] | ||
| Soc. = 5 | |||||||||
| Econ. = 5 | |||||||||
| Build a framework to assess the relative performances of multiple neighborhood renewal projects through a hybrid AHP-TOPSIS method: a case study in China | Env. = 6 | 18 | TOPSIS | EP | Alt | 1 | ✓ | [20] | |
| Soc. = 3 | -AHP | ||||||||
| Econ. = 2 | |||||||||
| Etc. = 2 | |||||||||
| Assess a sustainability assessment method that integrates the MCDM approach with the variability of the alternatives’ performance measurements: a case study in Europe | Env. = 4 | 26 | TOPSIS | CRITIC | Alt | ✓ | [16] | ||
| Soc. = 3 | |||||||||
| Econ. = 3 | |||||||||
| Verify the performance of Brazilian municipalities in three dimensions of sustainability: a case study in Brazil | Env. = 5 | 217 | TOPSIS | - | Alt | 3 | 4 | ✓ | [21] |
| Soc. = 20 | |||||||||
| Econ. = 6 | |||||||||
| Develop an evaluation index system that satisfies the requirements of green development in coal resource-based cities by considering four dimensions: a case study in China | Env. = 9 | 30 | TOPSIS | ETP | Alt | 4 | ✓ | [22] | |
| Soc. = 9 | -AHP | ||||||||
| Econ. = 5 | |||||||||
| Etc. = 6 | |||||||||
| Evaluate the progress of a single city towards the concept of sustainable development: a case study in Poland | Env. = 14 | 1 | TOPSIS | DMK | YS | 3 | ✓ | [5] | |
| Soc. = 18 | |||||||||
| Econ. = 16 | |||||||||
| Present a new model called Geo Umbria SUIT that integrates multicriteria analysis and geographic information systems and is specifically developed to help decision-makers make policy decisions about sustainability in planning: a case study in Malta | Env. = 6 | 6 | TOPSIS | DMK | Alt | 3 | ✓ | [23] | |
| Soc. = 6 | |||||||||
| Econ. = 6 | |||||||||
| Test the Geo Umbria SUIT model, found very suitable for territorial sustainability assessment, for evaluating sustainability at the territorial level of two different European countries: Italy and Spain | Env. = 6 | 17/20 | TOPSIS | DMK | Alt | 3 | ✓ | [24] | |
| Soc. = 6 | |||||||||
| Econ. = 6 | |||||||||
| Assessment of localizations in the Besancon area in terms of sustainable urban development: a case study in France | Env. = 3 | 8 | SAW | Equal | Alt | 3 | 3 | ✓ | [25] |
| Soc. = 3 | |||||||||
| Econ. = 3 | |||||||||
| Assessment of sustainable socioeconomic development in European Union countries | Soc. = 4 | 13 | EDAS | - | Alt | ✓ | [26] | ||
| Econ. = 9 | |||||||||
| Evaluate the sustainability of four dimensions towards the concept of sustainable development with the Dynamic Evaluation Model of Health Sustainability Under MCDM Benchmarking Health Indicator Standard: a case study in Thailand | Health = 4 | Single or more | TOPSIS | AHP | HIS | 4 | 15 | ✓ | This paper |
| Env. = 4 | |||||||||
| Soc. = 3 | |||||||||
| Econ. = 4 | |||||||||
| 1 | 2 | 3 | 4 | 5 | 6 | 7 | 8 | 9 | 10 | 11 | 12 | 13 | 14 | 15 | |
|---|---|---|---|---|---|---|---|---|---|---|---|---|---|---|---|
| 0.0 | 0.0 | 0.58 | 0.90 | 1.12 | 1.24 | 1.32 | 1.41 | 1.45 | 1.49 | 1.51 | 1.48 | 1.56 | 1.57 | 1.59 |
| Dimension | Element | IDC | Unit | OD | PI | NI | CODE | Ref |
|---|---|---|---|---|---|---|---|---|
| Health | Health Status | Life expectancy | Year | MAX | 85.29 | 73.2 | VR01 | [35] |
| Low-birth-weight newborns | % | MIN | 5 | 20 | VR02 | [36] | ||
| Number of deaths | 1K | MIN | - | 7.6 | VR03 | [37] | ||
| Infant mortality livebirth | 1K | MIN | 12 | 25 | VR04 | [38] | ||
| Suicide mortality | 100K | MIN | 5.60 | 23.5 | VR05 | [39] | ||
| Communicable Disease Control | HIV/AIDS mortality | 100K | MIN | 8.5 | 11 | VR06 | [40] | |
| Tuberculosis mortality | 100K | MIN | 38 | 319 | VR07 | [41] | ||
| Pneumonia mortality | 100K | MIN | 5.20 | 34.31 | VR08 | [42] | ||
| Diarrhea mortality | 100K | MIN | 0.09 | 20.95 | VR09 | [43] | ||
| Non-communicable Disease Control | Cancer mortality | 100K | MIN | 71.26 | 131.53 | VR10 | [44] | |
| Stroke mortality | 100K | MIN | 21.77 | 308.08 | VR11 | [45] | ||
| Ischemic heart disease Mortality | 100K | MIN | - | 112.37 | VR12 | [46] | ||
| Diabetes mellitus mortality | 100K | MIN | - | 18.5 | VR13 | [47] | ||
| Chronic obstructive pulmonary disease mortality | 100K | MIN | - | 46.3 | VR14 | [48] | ||
| Kidney disease mortality | 100K | MIN | - | 77.01 | VR15 | [49] | ||
| Health resource | Physicians | 100K | MAX | 170 | 10 | VR16 | [50] | |
| Hospital beds | 100K | MAX | 300 | 110 | VR17 | [51,52] | ||
| Nursing and midwifery personnel | 100K | MAX | 380 | 60 | VR18 | [50] | ||
| Psychiatrist | 100K | MAX | 6 | 1.7 | VR19 | [53,54] | ||
| Total Health worker | 100K | MAX | 780 | 210 | VR20 | [50] | ||
| Ambulance | 100K | MAX | 3.3 | 1 | VR21 | [55,56] | ||
| Electronic Medical Records | % | MAX | 100 | 90 | VR22 | [57] |
| Dimension | Element | IDC | Unit | OD | PI | NI | CODE | Ref |
|---|---|---|---|---|---|---|---|---|
| Environment | Environment risk management | Environmental risk management | % | MAX | 60 | - | VR23 | [58] |
| Air pollution management | Average of AQI index | Index | MIN | 1 | 100 | VR24 | [59] | |
| Protected natural areas | Forest area rate | % | MAX | 40 | - | VR25 | [60] | |
| Water management | Water management index | Index | MAX | 5 | 2 | VR26 | [61] |
| Dimension | Element | IDC | Unit | OD | PI | NI | CODE | Ref |
|---|---|---|---|---|---|---|---|---|
| Social | Health Service Standard | Health resource management | % | MIN | 1 | 4 | VR27 | [58] |
| Transparency in public health | % | MAX | 92 | - | VR28 | [58] | ||
| Green and clean hospital administration | % | MAX | 98 | - | VR29 | [58] | ||
| Management of public health crises | % | MAX | 100 | - | VR30 | [58] | ||
| Community hospital quality | % | MAX | 90 | - | VR31 | [58] | ||
| Control of acute infectious diseases | % | MAX | 100 | - | VR32 | [58] | ||
| Social security | Smoking mortality | 100K | MIN | 14.02 | 95.61 | VR33 | [63] | |
| Alcohol drinking mortality | 100K | MIN | 0.16 | 2.01 | VR34 | [64] | ||
| Traffic accident mortality | 100K | MIN | 2.64 | 14.99 | VR35 | [65] | ||
| Crime mortality | 100K | MIN | 0.4 | 5.4 | VR36 | [66] | ||
| Health Promotion | Universal health coverage Service | % | MAX | 80 | - | VR37 | [58] | |
| Desirable health behaviors | % | MAX | 80 | - | VR38 | [57] | ||
| Obesity (BMI > 30 kg/m2) | % | MIN | 1.82 | 8.52 | VR39 | [67] | ||
| Management of glycemic control | % | MAX | 80 | - | VR40 | [57] | ||
| Management of blood pressure control | % | MAX | 80 | - | VR41 | [57] |
| Dimension | Element | IDC | Unit | OD | PI | NI | CODE | Ref |
|---|---|---|---|---|---|---|---|---|
| Economic | City’s employment | Unemployment rate | % | MIN | - | 6.5 | VR42 | [68] |
| Poverty reduction | Population living in poverty | % | MIN | - | 8.44 | VR43 | [69] | |
| Household debt | Household debt per income ratio | % | MIN | - | 43 | VR44 | [70] | |
| Economic growth | Gross provincial product growth rate | % | MAX | 3.3 | - | VR45 | [71] |
| Pairwise Comparison Matrix (PCM) | Normalized-Pairwise Comparison Matrix (NPCM) | |||||||||||||||
|---|---|---|---|---|---|---|---|---|---|---|---|---|---|---|---|---|
| CODE | VR01 | VR02 | VR03 | VR04 | VR05 | CODE | VR01 | VR02 | VR03 | VR04 | VR05 | SUM (EV) | ||||
| VR01 | 1 | 5 | 3 | 5 | 4 | VR01 | 0.50 | 0.50 | 0.56 | 0.45 | 0.40 | 0.48 | ||||
| VR02 | 1/5 | 1 | 1/3 | 2 | 2 | VR02 | 0.10 | 0.10 | 0.06 | 0.18 | 0.20 | 0.13 | ||||
| VR03 | 1/3 | 3 | 1 | 2 | 2 | VR03 | 0.17 | 0.30 | 0.19 | 0.18 | 0.20 | 0.21 | ||||
| VR04 | 1/5 | ½ | ½ | 1 | 1 | VR04 | 0.10 | 0.05 | 0.09 | 0.09 | 0.10 | 0.09 | ||||
| VR05 | ¼ | ½ | ½ | 1 | 1 | VR05 | 0.13 | 0.05 | 0.09 | 0.09 | 0.10 | 0.09 | ||||
| SUM | 1.98 | 10 | 5.33 | 11 | 10 | SUM | 1 | 1 | 1 | 1 | 1 | 1 | ||||
| PCM: Health status (HS) | NPCM: HS/N = 5, C.I. = 0.06, R.I. = 1.12, C.R. = 0.04 < 0.1 | |||||||||||||||
| CODE | VR06 | VR07 | VR08 | VR09 | CODE | VR06 | VR07 | VR08 | VR09 | SUM(EV) | ||||||
| VR06 | 1 | 3 | 4 | 5 | VR06 | 0.56 | 0.65 | 0.47 | 0.42 | 0.53 | ||||||
| VR07 | 1/3 | 1 | 3 | 4 | VR07 | 0.19 | 0.22 | 0.35 | 0.33 | 0.27 | ||||||
| VR08 | ¼ | 1/3 | 1 | 2 | VR08 | 0.14 | 0.07 | 0.12 | 0.17 | 0.12 | ||||||
| VR09 | 1/5 | ¼ | ½ | 1 | VR09 | 0.11 | 0.05 | 0.06 | 0.08 | 0.08 | ||||||
| SUM | 1.78 | 4.58 | 8.50 | 12.00 | SUM | 1 | 1 | 1 | 1 | 1 | ||||||
| PCM: Communicable disease control (CDC) | NPCM: CDC/N = 4, C.I. = 0.06, R.I. = 0.90, C.R. = 0.04 < 0.1 | |||||||||||||||
| CODE | VR10 | VR11 | VR12 | VR13 | VR14 | VR15 | CODE | VR10 | VR11 | VR12 | VR13 | VR14 | VR15 | SUM (EV) | ||
| VR10 | 1 | 5 | 3 | 1 | 5 | 5 | VR10 | 0.34 | 0.31 | 0.38 | 0.34 | 0.31 | 0.31 | 0.33 | ||
| VR11 | 1/5 | 1 | 1/3 | 1/5 | 1 | 1 | VR11 | 0.07 | 0.06 | 0.04 | 0.07 | 0.06 | 0.06 | 0.06 | ||
| VR12 | 1/3 | 3 | 1 | 1/3 | 3 | 3 | VR12 | 0.11 | 0.19 | 0.13 | 0.11 | 0.19 | 0.19 | 0.15 | ||
| VR13 | 1 | 5 | 3 | 1 | 5 | 5 | VR13 | 0.34 | 0.31 | 0.38 | 0.34 | 0.31 | 0.31 | 0.33 | ||
| VR14 | 1/5 | 1 | 1/3 | 1/5 | 1 | 1 | VR14 | 0.07 | 0.06 | 0.04 | 0.07 | 0.06 | 0.06 | 0.06 | ||
| VR15 | 1/5 | 1 | 1/3 | 1/5 | 1 | 1 | VR15 | 0.07 | 0.06 | 0.04 | 0.07 | 0.06 | 0.06 | 0.06 | ||
| SUM | 2.93 | 16.00 | 8.00 | 2.93 | 16.00 | 16.00 | SUM | 1 | 1 | 1 | 1 | 1 | 1 | 1 | ||
| PCM: Non-communicable disease control (NCDs) | NPCM: NCDs/N = 6, C.I. = 0.02, R.I. = 1.24, C.R. = 0.01< 0.1 | |||||||||||||||
| CODE | VR16 | VR17 | VR18 | VR19 | VR20 | VR21 | VR22 | CODE | VR16 | VR17 | VR18 | VR19 | VR20 | VR21 | VR22 | SUM (EV) |
| VR16 | 1 | 4 | 3 | 1 | 5 | 5 | 3 | VR16 | 0.30 | 0.38 | 0.28 | 0.29 | 0.25 | 0.22 | 0.32 | 0.29 |
| VR17 | ¼ | 1 | 1 | 1/3 | 3 | 5 | 1 | VR17 | 0.08 | 0.09 | 0.09 | 0.10 | 0.15 | 0.22 | 0.11 | 0.12 |
| VR18 | 1/3 | 1 | 1 | 1/3 | 3 | 3 | 0.5 | VR18 | 0.10 | 0.09 | 0.09 | 0.10 | 0.15 | 0.13 | 0.05 | 0.10 |
| VR19 | 1 | 3 | 3 | 1 | 5 | 5 | 3 | VR19 | 0.30 | 0.28 | 0.28 | 0.29 | 0.25 | 0.22 | 0.32 | 0.28 |
| VR20 | 1/5 | 1/3 | 1/3 | 1/5 | 1 | 1 | 0.5 | VR20 | 0.06 | 0.03 | 0.03 | 0.06 | 0.05 | 0.04 | 0.05 | 0.05 |
| VR21 | 1/5 | 1/5 | 1/3 | 1/5 | 1 | 1 | 0.33 | VR21 | 0.06 | 0.02 | 0.03 | 0.06 | 0.05 | 0.04 | 0.04 | 0.04 |
| VR22 | 1/3 | 1 | 2 | 1/3 | 2 | 3 | 1 | VR22 | 0.10 | 0.09 | 0.19 | 0.10 | 0.10 | 0.13 | 0.11 | 0.12 |
| SUM | 3.32 | 10.53 | 10.67 | 3.40 | 20.00 | 23.00 | 9.33 | SUM | 1 | 1 | 1 | 1 | 1 | 1 | 1 | 1 |
| PCM: Health resource (HR) | NPCM: HR/N = 7, C.I. = 0.02, R.I. = 0.90, C.R. = 0.02 < 0.1 | |||||||||||||||
| CODE | VR23 | VR24 | VR25 | VR26 | CODE | VR23 | VR24 | VR25 | VR26 | SUM (EV) | ||||||
| VR23 | 1 | 1/3 | 1/5 | 1/3 | VR23 | 0.08 | 0.06 | 0.10 | 0.08 | 0.08 | ||||||
| VR24 | 3 | 1 | 1/3 | 1 | VR24 | 0.25 | 0.19 | 0.16 | 0.23 | 0.21 | ||||||
| VR25 | 5 | 3 | 1 | 2 | VR25 | 0.42 | 0.56 | 0.49 | 0.46 | 0.48 | ||||||
| VR26 | 3 | 1 | ½ | 1 | VR26 | 0.25 | 0.19 | 0.25 | 0.23 | 0.23 | ||||||
| SUM | 12.00 | 5.33 | 2.03 | 4.33 | SUM | 1 | 1 | 1 | 1 | 1 | ||||||
| PCM: Environment dimension (ENDm) | NPCM: ENDm/N = 4, C.I. = 0.05, R.I. = 1.32, C.R. = 0.01 < 0.1 | |||||||||||||||
| CODE | VR27 | VR28 | VR29 | VR30 | VR31 | VR32 | CODE | VR27 | VR28 | VR29 | VR30 | VR31 | VR32 | SUM (EV) | ||
| VR27 | 1 | 3 | 5 | 5 | 4 | 4 | VR27 | 0.45 | 0.59 | 0.29 | 0.29 | 0.41 | 0.40 | 0.41 | ||
| VR28 | 1/3 | 1 | 5 | 5 | 3 | 3 | VR28 | 0.15 | 0.20 | 0.29 | 0.29 | 0.31 | 0.30 | 0.26 | ||
| VR29 | 1/5 | 1/5 | 1 | 1 | 1/3 | ½ | VR29 | 0.09 | 0.04 | 0.06 | 0.06 | 0.03 | 0.05 | 0.06 | ||
| VR30 | 1/5 | 1/5 | 1 | 1 | 1/3 | ½ | VR30 | 0.09 | 0.04 | 0.06 | 0.06 | 0.03 | 0.05 | 0.06 | ||
| VR31 | ¼ | 1/3 | 3 | 3 | 1 | 1 | VR31 | 0.11 | 0.07 | 0.18 | 0.18 | 0.10 | 0.10 | 0.12 | ||
| VR32 | ¼ | 1/3 | 2 | 2 | 1 | 1 | VR32 | 0.11 | 0.07 | 0.12 | 0.12 | 0.10 | 0.10 | 0.10 | ||
| SUM | 2.23 | 5.07 | 17 | 17 | 9.67 | 10 | SUM = 1 | 1 | 1 | 1 | 1 | 1 | 1 | 1 | ||
| PCM: Health service standard (HSS) | NPCM: HSS/N = 6, C.I. = 0.06, R.I. = 1.24, C.R. = 0.03 < 0.1 | |||||||||||||||
| CODE | VR33 | VR34 | VR35 | VR36 | CODE | VR33 | VR34 | VR35 | VR36 | SUM (EV) | ||||||
| VR33 | 1 | 1/3 | 1/5 | 1/5 | VR33 | 0.07 | 0.05 | 0.08 | 0.08 | 0.07 | ||||||
| VR34 | 3 | 1 | 1/3 | 1/3 | VR34 | 0.21 | 0.14 | 0.13 | 0.13 | 0.15 | ||||||
| VR35 | 5 | 3 | 1 | 1 | VR35 | 0.36 | 0.41 | 0.39 | 0.39 | 0.39 | ||||||
| VR36 | 5 | 3 | 1 | 1 | VR36 | 0.36 | 0.41 | 0.39 | 0.39 | 0.39 | ||||||
| SUM | 14.00 | 7.33 | 2.53 | 2.53 | SUM | 1 | 1 | 1 | 1 | 1 | ||||||
| PCM: Social security (SS) | NPCM: SS/N = 4, C.I. = 0.02, R.I. = 0.90, C.R. = 0.01 < 0.1 | |||||||||||||||
| CODE | VR37 | VR38 | VR39 | VR40 | VR41 | CODE | VR37 | VR38 | VR39 | VR40 | VR41 | SUM (EV) | ||||
| VR37 | 1 | 2 | 2 | 2 | 2 | VR37 | 0.33 | 0.44 | 0.33 | 0.25 | 0.25 | 0.32 | ||||
| VR38 | ½ | 1 | 2 | 2 | 2 | VR38 | 0.17 | 0.22 | 0.33 | 0.25 | 0.25 | 0.24 | ||||
| VR39 | ½ | ½ | 1 | 2 | 2 | VR39 | 0.17 | 0.11 | 0.17 | 0.25 | 0.25 | 0.19 | ||||
| VR40 | ½ | ½ | ½ | 1 | 1 | VR40 | 0.17 | 0.11 | 0.08 | 0.13 | 0.13 | 0.12 | ||||
| VR41 | ½ | ½ | ½ | 1 | 1 | VR41 | 0.17 | 0.11 | 0.08 | 0.13 | 0.13 | 0.12 | ||||
| SUM | 3 | 4.5 | 6 | 8 | 8 | SUM | 1 | 1 | 1 | 1 | 1 | 1 | ||||
| PCM: Health promotion (HP) | NPCM: HP/N = 5, C.I. = 0.04, R.I. = 1.12, C.R. = 0.03 < 0.1 | |||||||||||||||
| CODE | VR42 | VR43 | VR44 | VR45 | CODE | VR42 | VR43 | VR44 | VR45 | SUM (EV) | ||||||
| VR42 | 1 | 3 | 1 | 1/3 | VR42 | 0.19 | 0.27 | 0.18 | 0.18 | 0.21 | ||||||
| VR43 | 1/3 | 1 | ½ | 1/5 | VR43 | 0.06 | 0.09 | 0.09 | 0.11 | 0.09 | ||||||
| VR44 | 1 | 2 | 1 | 1/3 | VR44 | 0.19 | 0.18 | 0.18 | 0.18 | 0.18 | ||||||
| VR45 | 3 | 5 | 3 | 1 | VR45 | 0.56 | 0.45 | 0.55 | 0.54 | 0.52 | ||||||
| SUM | 5.33 | 11 | 5.50 | 1.87 | SUM = 1 | 1 | 1 | 1 | 1 | 1 | ||||||
| PCM Economic dimension (ECDm) | NPCM: ECDm/N = 4, C.I. = 0.01, R.I. = 0.09, C.R. = 0.01 < 0.1 | |||||||||||||||
| CODE | OD | Unit | PI | NI | Khon Kaen | CODE | OD | Unit | PI | NI | Khon Kaen |
|---|---|---|---|---|---|---|---|---|---|---|---|
| VR01 | MAX | Year | 85.29 | 73.2 | 75.20 | VR23 | MAX | % | 60 | - | 25 |
| VR02 | MIN | % | 5 | 20 | 6.28 | VR24 | MIN | Index | 1 | 100 | 77.71 |
| VR03 | MIN | 1K | - | 7.6 | 7.12 | VR25 | MAX | % | 40 | - | 11.23 |
| VR04 | MIN | 1K | 12 | 25 | 1.92 | VR26 | MAX | Index | 5 | 2 | 3.03 |
| VR05 | MIN | 100K | 5.6 | 23.5 | 13.09 | VR27 | MIN | % | 1 | 4 | 3.55 |
| VR06 | MIN | 100K | 8.5 | 11 | 4.29 | VR28 | MAX | % | 92 | - | 79.11 |
| VR07 | MIN | 100K | 38 | 319 | 9.69 | VR29 | MAX | % | 98 | - | 100 |
| VR08 | MIN | 100K | 5.2 | 34.31 | 61.72 | VR30 | MAX | % | 100 | - | 100 |
| VR09 | MIN | 100K | 0.09 | 20.95 | 2.67 | VR31 | MAX | % | 90 | - | 95.08 |
| VR10 | MIN | 100K | 71.26 | 131.53 | 127.39 | VR32 | MAX | % | 100 | - | 1 |
| VR11 | MIN | 100K | 21.77 | 308.08 | 50.91 | VR33 | MIN | 100K | 14.02 | 95.61 | 17.10 |
| VR12 | MIN | 100K | - | 112.37 | 24.01 | VR34 | MIN | 100K | 0.16 | 2.01 | 39.90 |
| VR13 | MIN | 100K | - | 18.5 | 30.52 | VR35 | MIN | 100K | 2.64 | 14.99 | 28.85 |
| VR14 | MIN | 100K | - | 46.3 | 4.90 | VR36 | MIN | % | 0.4 | 5.4 | 0.56 |
| VR15 | MIN | 100K | - | 77.01 | 20.05 | VR37 | MAX | % | 80 | - | 79.96 |
| VR16 | MAX | 100K | 170 | 10 | 84 | VR38 | MAX | % | 80 | - | 82.87 |
| VR17 | MAX | 100K | 300 | 110 | 280 | VR39 | MIN | % | 1.82 | 8.52 | 2.27 |
| VR18 | MAX | 100K | 380 | 60 | 310 | VR40 | MAX | % | 80 | - | 17.97 |
| VR19 | MAX | 100K | 6 | 1.7 | 1.50 | VR41 | MAX | % | 80 | - | 46.37 |
| VR20 | MAX | 100K | 780 | 210 | 381.80 | VR42 | MIN | % | - | 6.5 | 2.15 |
| VR21 | MAX | 100K | 3.3 | 1 | 8.80 | VR43 | MIN | % | - | 8.44 | 6.63 |
| VR22 | MAX | % | 100 | 90 | 99.62 | VR44 | MIN | % | - | 43 | 44.99 |
| VR45 | MAX | % | 3.3 | - | 2.04 | ||||||
| CODE | A+ | A− | CODE | A+ | A− | CODE | A+ | A− |
|---|---|---|---|---|---|---|---|---|
| VR01 | 0.30 | 0.26 | VR16 | 0.29 | 0.00 | VR31 | 0.00 | 0.09 |
| VR02 | 0.03 | 0.10 | VR17 | 0.08 | 0.06 | VR32 | 0.00 | 0.10 |
| VR03 | 0.02 | 0.15 | VR18 | 0.10 | 0.01 | VR33 | 0.01 | 0.07 |
| VR04 | 0.00 | 0.09 | VR19 | 0.27 | 0.04 | VR34 | 0.00 | 0.15 |
| VR05 | 0.02 | 0.08 | VR20 | 0.05 | 0.00 | VR35 | 0.03 | 0.34 |
| VR06 | 0.04 | 0.49 | VR21 | 0.04 | 0.00 | VR36 | 0.03 | 0.39 |
| VR07 | 0.02 | 0.19 | VR22 | 0.06 | 0.07 | VR37 | 0.23 | 0.00 |
| VR08 | 0.01 | 0.10 | VR23 | 0.07 | 0.00 | VR38 | 0.17 | 0.00 |
| VR09 | 0.01 | 0.07 | VR24 | 0.00 | 0.17 | VR39 | 0.04 | 0.18 |
| VR10 | 0.08 | 0.24 | VR25 | 0.46 | 0.00 | VR40 | 0.12 | 0.00 |
| VR11 | 0.00 | 0.06 | VR26 | 0.19 | 0.07 | VR41 | 0.10 | 0.00 |
| VR12 | 0.00 | 0.15 | VR27 | 0.08 | 0.30 | VR42 | 0.00 | 0.20 |
| VR13 | 0.01 | 0.28 | VR28 | 0.20 | 0.00 | VR43 | 0.00 | 0.07 |
| VR14 | 0.01 | 0.05 | VR29 | 0.04 | 0.00 | VR44 | 0.00 | 0.13 |
| VR15 | 0.00 | 0.05 | VR30 | 0.00 | 0.04 | VR45 | 0.44 | 0.00 |
| CODE | S+ | S− | CODE | S+ | S− | CODE | S+ | S− |
|---|---|---|---|---|---|---|---|---|
| VR01 | 0.001 | 0.000 | VR16 | 0.063 | 0.001 | VR31 | 0.037 | 0.001 |
| VR02 | 0.000 | 0.005 | VR17 | 0.001 | 0.000 | VR32 | 0.001 | 0.029 |
| VR03 | 0.015 | 0.000 | VR18 | 0.005 | 0.001 | VR33 | 0.000 | 0.002 |
| VR04 | 0.000 | 0.007 | VR19 | 0.040 | 0.000 | VR34 | 0.002 | 0.000 |
| VR05 | 0.001 | 0.001 | VR20 | 0.002 | 0.000 | VR35 | 0.008 | 0.000 |
| VR06 | 0.022 | 0.090 | VR21 | 0.000 | 0.001 | VR36 | 0.000 | 0.010 |
| VR07 | 0.029 | 0.000 | VR22 | 0.000 | 0.000 | VR37 | 0.000 | 0.003 |
| VR08 | 0.003 | 0.002 | VR23 | 0.002 | 0.001 | VR38 | 0.022 | 0.000 |
| VR09 | 0.001 | 0.001 | VR24 | 0.016 | 0.001 | VR39 | 0.098 | 0.000 |
| VR10 | 0.016 | 0.001 | VR25 | 0.110 | 0.017 | VR40 | 0.000 | 0.120 |
| VR11 | 0.000 | 0.001 | VR26 | 0.005 | 0.001 | VR41 | 0.000 | 0.051 |
| VR12 | 0.001 | 0.014 | VR27 | 0.037 | 0.001 | VR42 | 0.004 | 0.018 |
| VR13 | 0.074 | 0.000 | VR28 | 0.001 | 0.029 | VR43 | 0.003 | 0.000 |
| VR14 | 0.001 | 0.001 | VR29 | 0.000 | 0.002 | VR44 | 0.017 | 0.000 |
| VR15 | 0.002 | 0.000 | VR30 | 0.002 | 0.000 | VR45 | 0.029 | 0.075 |
| Dimension | Element | CODE | S+ | S− | Rank | |
|---|---|---|---|---|---|---|
| HS | VR01–VR05 | 0.13 | 0.11 | 0.47 | 2 | |
| CDC | VR06–VR09 | 0.23 | 0.30 | 0.57 | 1 | |
| NCDs | VR10–VR15 | 0.31 | 0.13 | 0.30 | 3 | |
| HR | VR16–VR22 | 0.33 | 0.06 | 0.15 | 4 | |
| HEDm | - | VR01–VR22 | 0.52 | 0.36 | 0.40 | (3) |
| ERM | VR23 | 0.04 | 0.03 | 0.42 | 1 | |
| APM | VR24 | 0.13 | 0.04 | 0.23 | 4 | |
| PNA | VR25 | 0.33 | 0.13 | 0.28 | 3 | |
| WM | VR26 | 0.07 | 0.04 | 0.34 | 2 | |
| ENDm | - | VR23–VR26 | 0.37 | 0.14 | 0.28 | (4) |
| HSS | VR27–VR32 | 0.22 | 0.20 | 0.48 | 3 | |
| SS | VR33–VR36 | 0.35 | 0.35 | 0.50 | 2 | |
| HP | VR37–VR41 | 0.10 | 0.32 | 0.76 | 1 | |
| SODm | - | VR27–VR41 | 0.42 | 0.52 | 0.55 | (2) |
| CEM | VR42 | 0.07 | 0.13 | 0.67 | 1 | |
| PR | VR43 | 0.06 | 0.02 | 0.21 | 3 | |
| HHD | VR44 | 0.13 | 0.00 | 0.00 | 4 | |
| ECG | VR45 | 0.17 | 0.27 | 0.62 | 2 | |
| ECDm | - | VR42–VR45 | 0.23 | 0.30 | 0.57 | (1) |
Disclaimer/Publisher’s Note: The statements, opinions and data contained in all publications are solely those of the individual author(s) and contributor(s) and not of MDPI and/or the editor(s). MDPI and/or the editor(s) disclaim responsibility for any injury to people or property resulting from any ideas, methods, instructions or products referred to in the content. |
© 2022 by the authors. Licensee MDPI, Basel, Switzerland. This article is an open access article distributed under the terms and conditions of the Creative Commons Attribution (CC BY) license (https://creativecommons.org/licenses/by/4.0/).
Share and Cite
Ritmak, N.; Rattanawong, W.; Vongmanee, V. The Dynamic Evaluation Model of Health Sustainability under MCDM Benchmarking Health Indicator Standards. Int. J. Environ. Res. Public Health 2023, 20, 259. https://0-doi-org.brum.beds.ac.uk/10.3390/ijerph20010259
Ritmak N, Rattanawong W, Vongmanee V. The Dynamic Evaluation Model of Health Sustainability under MCDM Benchmarking Health Indicator Standards. International Journal of Environmental Research and Public Health. 2023; 20(1):259. https://0-doi-org.brum.beds.ac.uk/10.3390/ijerph20010259
Chicago/Turabian StyleRitmak, Nutthawut, Wanchai Rattanawong, and Varin Vongmanee. 2023. "The Dynamic Evaluation Model of Health Sustainability under MCDM Benchmarking Health Indicator Standards" International Journal of Environmental Research and Public Health 20, no. 1: 259. https://0-doi-org.brum.beds.ac.uk/10.3390/ijerph20010259