
Performance Management for Growth: A Framework Based on EVA


1
Engineering and Management Department, Faculty of Industrial Design and Business Management, Gheorghe Asachi Technical University of Iasi, Bulevardul Profesor Dimitrie Mangeron 29, 700050 Iasi, Romania
2
Social Sciences and Humanities Research Department, Institute of Interdisciplinary Research, Alexandru Ioan Cuza University of Iasi, Lascar Catargi Street 54, 700107 Iasi, Romania
*
Author to whom correspondence should be addressed.
J. Risk Financial Manag. 2021, 14(3), 102; https://0-doi-org.brum.beds.ac.uk/10.3390/jrfm14030102
Submission received: 26 January 2021
/
Revised: 26 February 2021
/
Accepted: 28 February 2021
/
Published: 4 March 2021
(This article belongs to the Special Issue Corporate Finance, Governance, and Social Responsibility)
Abstract
:Some of the constructs in the field of performance management are intuitive or not empirically validated. This study provides a data-driven framework for measuring and improving the performance through synchronized strategies. The ultimate goal was to provide support for increasing business performance. Empirical research materializes in an exploratory case study and a statistical analysis with econometric models. The case study revealed that a company can improve its performance, even in periods of growth, being characterized by consistent investments. The statistical analysis, performed on a restricted sample of companies, confirmed the results that were provided by the case study. The measurement of performance was made by capitalizing on financial and non-financial data precisely to intensify the interest for corporate sustainability. The obtained results, contrary to previous research that showed that economic value added (EVA) is negatively influenced by the increase in invested capital, open up new research perspectives to find out whether, at the industry level, performance appraisal that is based on EVA stimulates the development of a business’s economic capital. The research has a double utility: scientific (by providing an overview of the state of the art in the field of performance management) and practical (by providing a reference model for measuring and monitoring performance).
1. Introduction
Business success depends on the quality of methods and techniques used for performance measurement, as well as on the ability of managers to manage the internal state and results of a company. Although increasingly complex methods have been developed, they failed to fully integrate (scientifically and practically) the ‘multidimensional’ feature of performance. Performance management has been accepted as a holistic process put at the disposal of managers due to diversity of elements defining high overall performance. Although scientific research is generous on methods of measuring performance, the companies are far from harnessing on the positive effects of implementing different methods. For performance measurement to become a good practice within companies, more awareness is needed regarding the role of measuring business performance. This is because performance measurement systems not only have an evaluative purpose, but they also help organizations to establish and use the most appropriate set of measurement indicators that reflect their objectives (Kennerley and Neely 2003). At the same time, measuring and monitoring performance facilitates the implementation of organizational strategy (Rodrigues 2010) and strengthens business confidence (Vukšić et al. 2013).
This study focuses on customizing and detailing the performance measurement methodology that is based on EVA for companies in the automotive industry, while taking the strength of this industry (Adane and Nicolescu 2018) in the national and international economic context into account (Bostan et al. 2018). The choice for this research direction was justified from two points of view. First, we took the fact that, in the research on corporate performance, the traditional system of performance measurement indicators (focused on profit and return on assets/capital) is mainly used into account (Geng et al. 2021; Tudose and Avasilcai 2020). In this context, the research methodology focuses on the analysis of financial ratios (Batchimeg 2017; Luo et al. 2017; Egbunike and Okerekeoti 2018; Xu and Wang 2018; Kassi et al. 2019), which does not take all the costs of a business (such as the costs of capitals) into account and that allows for distorting or hiding of the real performance (Novyarni and Ningsih 2020). Second, out of all the modern methods for measuring performance, we considered the method that is based on the EVA because it allows the analysis of the results, but also of the way in which these results are obtained, being useful to both shareholders (for measuring real performance) and potential investors (in selecting investment opportunities). It is also a relatively simple method, and it can be implemented without incurring additional costs (that are related to the purchase of software or the investment of a person with exclusive monitoring responsibilities). Further proof of the reliability of this method is given by the fact that many organizations (such as Coca Cola, DuPont, Eli Lilly, Polaroid, Pharmacia and Whirlpool) have adopted EVA as a method of measuring performance (Annamalah et al. 2018).
Empirical research is focused on companies in the Romanian automotive industry. The arguments for this direction of research were multiple. First, because it has been reported that performance analysis depends on a multitude of factors that make it difficult to generalize results (Aguinis et al. 2012; Kijewska 2016), we opted for a case study and an econometric analysis for a restricted sample that was exposed to a common macroeconomic context. Second, many of the Romanian companies have not yet adopted a performance measurement model. Moreover, some authors (Crisan et al. 2010) opine that the problem for Romanian companies is not whether or not they have implemented a performance measurement system, but whether they make general measurements of business performance. Therefore, a reference model for measuring and monitoring performance is useful for both researchers and practitioners.
This study contributes to the existing literature in the following ways. First, it presents an original review of the management and performance measurement literature. Secondly, it presents the peculiarities of performance evaluation that is based on EVA for the automotive industry. Third, the paper provides evidence of the dynamics of performance (as assessed by EVA) during periods of growth throughout the company’s life cycle. Because the results of our research are in contrast with the results of previous research, it is evidence that this area of research is far from exhausted; therefore, this study fills the research gap that is generated by the differences between theory and practice. The work was organized, so that the research has a double utility: scientific (by providing an overview of the state of the art in the field) and practical (by providing a reference model for measuring and monitoring performance). Therefore, the second section presents the results of the bibliographic research regarding the main methods of measuring performance and the specific features of EVA-based performance measurement. Afterwards, the research methodology and details the terminology used in this paper are presented. The next section presents the analysis, interprets the results of the performance measurement, and initiates discussions so that the case study and econometric analysis can be used as reference models for measuring and monitoring performance for companies in the automotive industry (to obtain higher earnings, to reduce the cost of capital, and to create value for stakeholders). The last section presents the conclusions and considerations on future research directions.
2. Materials and Methods
2.1. State of the Art Regarding Performance Measurement
The interest in performance measurement has intensified since 1980. In the early stage, efforts were made to measure the performance of the entire business. Later research placed performance measurement among the priorities of managers at all levels, so that its scope widened, covering such issues as decision-making process, organizational roles, work maturity, business environment, increased competition, and advanced technology (Schläfke et al. 2013; Bhasin 2017; Taouab and Issor 2019).
Performance management aims to align performance (individual and team) with the strategic objectives of the organization, and performance management systems have multiple purposes (strategic, administrative, informational, developmental, organizational maintenance, and documentational purposes), according to Aguinis (2013) and Armstrong (2015). In the context of this research, the focus is mainly on the strategic purpose of performance management systems, which provide support for the design and adoption of growth strategies along the life cycle of the company.
Modern methods of performance measurement included various financial and non-financial indicators and provided organizations the support that is needed for their orientation (Searcy 2012). Growth in the number of stakeholders interested in the performance of an organization (Lozano 2015) and the growth of interdependencies of determining factors of performance increased the difficulty of measuring performance of an organization (Sorooshian et al. 2016). This is the context in which accurate measurement of performance became the main condition for growth of performance (Taticchi et al. 2010). The first modern methods of performance measurement were built around four items: economic added value, activity-based costing, market, and shareholder added value. Subsequently, other methods have been developed, such as: the methods that are based on the concept of ‘total quality management’ (ISO standards model, European model of quality management, model of service quality, ‘six sigma’ model); the methods based on the theory of causal relations (method of success critical factors and factor-results model); the measurement methods that are centered on processes (such as the reference model for supply chain operations and pyramid of performance measurement); the methods based on system balancing (Balance Score Card; performance prism; model of dynamic multidimensional performance); and, the multicriterial methods (such as TOPSIS, ELECTRE, PROMETHEE, VIKTOR, and COPRAS) (Narkunienė and Ulbinaitė 2018).
The modern methods pointed out that the companies do not have to sacrifice long-term growth to maximize current earnings (O’Byrne 2016). They also emphasized that there is a significant positive relationship between the quality of management tools and techniques that are utilized and organizational performance (Afonina 2015). Moreover, the use of performance appraisal methods depends on the management structure (Suriyankietkaew and Avery 2016; Dobija and Kravchenko 2017), the structure of the board of shareholders (Liu et al. 2019), and size of business (Lee 2009). Researchers have also shown that the use of certain methods allow for reaching higher performance (Rajnoha et al. 2016) and the positive perception of companies on their business environment may stimulate their financial performance and accelerate their positive influence on the whole society (Belas et al. 2015).
2.2. State of the Art Regarding EVA
In its initial form, the measure EVA stipulated that a company can create wealth if it generates real economic profit and if its earnings in a business deal (respectively, net operation profits) are higher than the remuneration expected by funders. One hundred years later, the method was developed by the consultancy firm Stern Value Management (which owns the brand name EVA™) (SVM 2016) by moving it to the area of performance measurement from the perspective of company’s ability to generate value for the shareholders. According to the methodological framework, performance as a measure of economic profit is determined as a difference between net operation profit after tax and opportunity cost of capital investment. If EVA is positive, then it is accepted that an organization creates value. Otherwise (net operating profit lower than the opportunity cost of capital investment), it is accepted that an organization (through its management) loses value. Therefore, the rate of growth of wealth should be higher than the rate of growth of invested capital in order to create value.
Some researchers (O’Byrne 2016; Daraban 2018; Jankalová and Kurotová 2020) revealed that EVA differs from other traditional performance values (such as gain per share, gross operating surplus, and return on sales), as it measures all company administration costs (operational costs and funding costs) and focuses on the control of production time, as well as operational and capital costs. Others report that EVA is an efficient measure for evaluating performance, as it: (a) involves all used resources and decentralizes management decision-making (Morard and Balu 2010; Malichova et al. 2017); (b) neutralizes differences in the level of risk of each strategic business unit (Mocciaro Li Destri et al. 2012); improves the quality of decisions taken at the managerial level, which facilitates the harmonization of interests of parties involved in the creation of value (Hasani and Fathi 2012); allows the performance of such managerial functions as monitoring, planning and signaling of strategic changes (Alam and Nizamuddin 2012); is useful to both shareholders (for measuring real performance) and potential investors (in selecting investment opportunities) (Novyarni and Ningsih 2020); is a relatively mature tool for evaluating listed companies (Geng et al. 2021); and, reflects the true economic profit of a business (Orazalin et al. 2019).
Recent research that is based on the use of EVA as a performance measurement tool has resulted in analyzes being performed on a single company (Wang and Yang 2014; Ion and Man 2019; Jankalová and Kurotová 2020; Novyarni and Ningsih 2020; Radneantu et al. 2010) or in sample-level analyzes (Pavelková et al. 2018; Geng et al. 2021). From the point of view of the analyzed field of activity, these studies focused on various fields, such as: tourism and hotel industry (Trandafir 2015; Geng et al. 2021), construction (Horak et al. 2020) oil industry (Wang and Yang 2014), steel industry (Ion and Man 2019), banking industry (Owusu-Antwi et al. 2015), IT sector (Radneantu et al. 2010), and the sale of spare parts (Jankalová and Kurotová 2020). The conclusions of this research are very diverse. Some authors have reported that the use of EVA requires an adaptation of strategies according to the specifics of companies (Geng et al. 2021). At the same time, it has been reported that EVA is more comprehensive than other performance indicators (Panigrahi et al. 2014), but it does not fully capitalize on the non-financial factors of performance (Wang and Yang 2014).
The literature search provided few evidences on the use of EVA to assess the performance of companies in the automotive sector. The only study identified (Pavelková et al. 2018) showed that the automotive industry is highly sensitive to business cycles. While separately analyzing the behaviors of manufacturers and suppliers in the automotive sector (2005–2012), the authors showed that added value was a key factor with the greatest positive impact on performance (as assessed by EVA) in all investigated periods—pre- and post-crisis).
Analyzing its limits, Bhusan Sahoo and Kumar Pramanik (2016) report that EVA analysis: (a) does not include such important determinants of performance as brand capital and human resources, etc.; (b) does not provide information about financial performance of companies affected by variations of business cycles; and, (c) does not stimulate growth of company wealth (as it is believed that the acquisition of fixed assets has a negative impact on performance measured by EVA).
Without neglecting the mentioned limits, we considered measuring the performance through EVA, because managers (concerned about efficient use of capital and growth of company value) can perform four types of interventions (Kijewska 2016): (a) the growth of net profit margin that would generate improvement of operations and efficiency; in this sense, production costs reduction and improvement of processes are most important; (b) growth of sales by identifying the market trends and quick response to needs/expectations/desires of clients); (c) a decrease of invested capital when it is not fully used (whether by selling assets, or reduction of administrative costs); (d) optimization of capital structure, i.e., the calculation of the combination of own-borrowed capital that minimizes the costs of resource purchase without affecting company’s financial autonomy and flexibility; and, (e) the latter intervention reduction of costs that are associated with tax burden (including tax burden related to various methods of financing) and allocation of capital to profitable investments allowing value creation.
Moreover, we justify this choice by the fact that the experts have admitted that measuring performance through EVA intensifies interest in corporate sustainability. They showed that ‘the link between the sustainable value and EVA provides a huge potential for synergy’ (Jankalová and Kurotová 2020) and EVA translates the indicator of financial performance into today’s corporate language (Bhusan Sahoo and Kumar Pramanik 2016).
The empirical research was conducted on the example of Romanian companies that usually use the traditional performance measurement indicators (indicators integrated in the annual financial statements). Unlike traditional indicators of measuring financial performance (which allow for the direct processing of the information that is available in annual reports), the methodology for determining EVA requires adjustments to eliminate the influence of various national accounting practices (especially those on creative accounting). Therefore, we synthesized the results of the main studies that were based on the use of EVA to assess the performance of Romanian companies in order to facilitate the proximity between theory and practice.
Brad and Munteanu (2012) looked for a link between the process of value creation in financial and non-financial companies; they started from the premise that the performance of companies is influenced by performance of financial institutions (a key role being attributed to financial leverage); although the authors could not validate their hypothesis, they showed that the macroeconomic environment has a significant influence on the results of their research.
Some authors (Radneantu et al. 2010) conducted a deep diagnosis of a company (the IT sector) during economic crisis, showing that the use of EVA improves a company’s capacity to manage the financial and non-financial factors that facilitates the development of growth strategies and reduces risks. Trandafir (2015) provides an example of added economic value analysis for companies in the hotel industry; the results of analysis (negative values for EVA) are explained by the specificity of operations, being highly marked by seasonality; although high profits were generated at the end of financial year, turnover had not been high enough to cause the creation of value for shareholders. Ion and Man (2019) researched the relevance of the economic added value (EVA) for stakeholders. Analyzing one Romanian steel company, they showed that EVA (calculated while considering the overall result) provides a more accurate image of company’s overall performance (when compared to situation when EVA is calculated based on net profit from operation and total net profit). When comparing EVA with MVA (market value added, determined as difference between the market value per share, and the book value per share), other authors (Sichigea and Vasilescu 2015) showed that the best way to grow MVA is to maximize EVA, which is only possible if EVA is treated as a target of internal and external decisions.
2.3. Research Methodology
We opted for the analysis of added economic value for only one company (case study), respectively, for a restricted sample of companies with the same object of activity (econometric analysis), as some authors argued that the results of studies on EVA differ significantly by country, by sector, or even by company (Kijewska 2016). Because previous studies have shown that large and performing companies have a higher sensitivity to the business cycle (Pavelková et al. 2018), we have reduced the analysis period to five years (2014–2018). Moreover, taking the importance of this industry into account, but also the fact that Romanian literature does not provide an example for this field, we decided to analyze the economic added value for a company in the field of the automotive industry.
The choice of the company for the case study was random. The selected company (in the field of automotive manufacturing) has been listed on the Bucharest Stock Exchange until 2016, and it was delisted in 2017, as it could not meet the criteria that were related to the number of publicly distributed shares. Even so, the company continued to disclose its financial statements and annual reports, which allowed for the collection of data for analysis. In building the sample for econometric analysis, we had, as a benchmark, the adjustments made to the variables based on which EVA was determined (in the case study). In order to have access to information, such as current depreciation, advertising costs, research and development costs (R&D costs), advance expenses, shares held, and loans granted, our attention was directed to listed companies, which publish not only financial statements, but also explanatory notes and audited reports, and that detail the indicators mentioned. Out of the total number of companies listed on the regulated market, we only identified three companies that are producing spare parts for cars (CANE code 2392—Manufacture of parts and accessories for cars and car engines). Taking the recommendations of our research predecessors (indicated at the start of this section) into account, we decided to perform the econometric analysis on a pilot sample. Therefore, the final sample was represented by four companies: one unlisted company (on the example of which the case study was also performed) and three listed companies. Being a mixed sample (with listed and unlisted companies), the analysis was based on the capitalization of accounting information, which was collected from the financial statements and annual reports (available on the stock exchange website or on the website of each company).
Indicators used to analyze the dynamics of economic added value were:
- -
- net operation profit after tax (NOPat) as a measure of company’s capacity to generate cash based on recurrent operations; it shows the operational income of a company (without being encumbered by income from financial operations);
- -
- weighted average cost of capital (WACC) depends on the cost of different financing resources (it represents the remuneration expected by founders/creditors of invested capital) and their share in total funding; and,
- -
- return of investment (ROI) is a net economic return rate of business and it is calculated as a ratio between net operation profit after tax and invested capital; this indicator was used as a measure of own capital cost.
Although the calculation of EVA seems to be relatively simple, it is, in practice, more complex, as several adjustments are needed to eliminate the influence of different accounting practices. Studies show that, out of 160 likely adjustments (Stewart 1999; Francisco de Almeida et al. 2016), only 10 have a more significant influence on NOPat and WACC (Brad and Munteanu 2012). These adjustments refer to: depreciation; research, development, and training expenses; promotional costs (advertising costs); deferred taxes; intangible assets (such as goodwill); non-interest-bearing debts (such as advances received from customers, salaries, and their related expenses); etc. In this context, we support the opinion, according to which the EVA method is usefulness due to its robustness and its immunity from creative accounting (Bhasin 2013).
In this study, NOPat was adjusted taking the following elements into account: current depreciation, research and development, and advertising expenses (Table 1). In order to calculate the invested capital (Ic), we used the elements of liabilities and assets from the balance sheet. Out of total external financing sources, we eliminated the non-cost debts (such as advances paid by clients, commercial debts and salaries, and their related payments). Next, net asset value purchased using financial leasing was seen as a long-term debt, and the related costs (annual expenses for lease payments) were treated as the elements of capital costs. The research and development and advertising expenses were also seen as belonging to invested capital, as they have effects over several years and contribute to business development. Additionally, we have deducted (of total invested capital) the assets not related to the fiscal year (such as prepaid expenses). Regarding the non-operating assets, as a novelty element in our research, we have extended the adjustment of the invested capital by deducting not only the owned securities, but also the granted loans. This adjustment is justified due to the fact that both investments in securities, as well as granted loans, are cash outflows reducing the company’s possibilities to finance its current operations. In terms of financial management, these operations are associated with higher yield investments. As for operational management, these are viewed as a reduction of resources that are allocated for current operations.
Concerning WACC, the calculation method took the features of different sources of funding into account. For higher accuracy of results, we opted for separate calculation of costs, as there were significant differences in the cost of own capitals and cost of borrowed capital for the analyzed company.
We determined the compound annual growth rate (CAGR) to identify the trend and significance of the data used in the analysis. Subsequently, we drew two performance profiles, one at the end of the five years analyzed and one at the end of the five years of forecast. The model of analysis that we proposed was intended to be a simple one to allow its practical operationalization. This was also the reason why the data processing was done using the analysis toolkit that was provided by Excel. Thus, based on information from the five years of analysis, the annual compound growth rate was determined using the “XIRR” function and the trends were identified using the “Trendline options” function.
Based on the obtained data, we reconstructed the integrated framework of decision-making that enabled economic value creation during the five years of analysis. When compared to other performance measurement tools, we showed that EVA has the advantage that it includes, in the analysis, all costs that are related to the business, regardless of whether they appear in the income statement, balance sheet, or in the financial statements (Annamalah et al. 2018), allows for an analysis of results and highlights how these results are obtained and improves the quality of management decision-making.
The econometric analysis was performed on a sample of four companies in the same field of activity (automotive), having adjustments that were comparable to the company on which the case study was performed (also included in the sample), in order to ensure the representativeness of the data. Data were collected from secondary sources (for the same period for which the case study was conducted, 2014–2018). Eviews 9 software was used to perform statistical analyses with econometric models that estimate the impact of a set of variables on EVA. The analyses are based on the panel data method, which is a specific method of generating equations for data containing both time series and cross sections.
3. Results
Recent studies report that the adoption of EVA method by increasing companies worldwide is a proof of the fact that it provides an integrated decision-making framework for creating sustainable value for companies, clients, employees, shareholders, and management (Bhasin 2013; Bhusan Sahoo and Kumar Pramanik 2016).
In order to support companies wishing to adopt EVA as a performance measure, we will be presenting the features of this method (Table 2). The first step in measuring the added economic value includes the calculation of operational profit after tax (NOPat_a). The analysis shows that, in just five years, the company managed to double its gross operational profit. Yearly current depreciation was around half of NOPat_a due to the high value of fixed assets. For the five analyzed years, the total value of net fixed assets grew by 22.4%; mainly technical installations, machinery, and working equipment had been purchased; therefore, as reported by earlier studies (Bhusan Sahoo and Kumar Pramanik 2016), growth in the fixed assets purchase could have a negative impact on performance that was measured by EVA. An increase in sales volume is attributed to the increase in advertising costs by 51% in 2018 as compared to 2014, and an increase in research and development costs by 40.6%. Therefore, by accepting that these costs contributed to business development, it is expected that NOPat_a will grow.
The second step in measuring the performance based on economic added value is the calculation of invested capitals and their adjustment in accordance with method’s rigor. Table 2 shows that the company was mainly financed by own capitals. The external capital includes financial debts (mainly agreements within the group) and a financial leasing for a logistic deposit for a period of 15 years. In order to adjust the invested capital, we added the advertising costs and the R&D costs (seen as capital allocations for long-term business development) and we subtracted the value of shares held and loans granted as well as the expenses in advance. The increase in the invested capital may indicate a decrease of EVA (Ic that is multiplied by WACC is subtracted from NOPat_a, decreasing the prospects of growth for EVA).
The strategic financial structure was used as a reference point to calculate the weighted average cost of capital. As it also results from Table 2, the company was mainly financed by its own funds (the average share—along all years—of these funding amounts to 84.4%). The cost of own capitals was calculated by relating the net dividends to own capitals. The cost of indebtedness (corresponding to external capitals) was calculated considering the deductibility of interest expenses. During 2014–2018, the interest expenses were fully deductible (because the interest expenses were lower than the income from interest).
The increase of weighted cost of capital (from 9.0% in 2014 to 13.2% in 2018), correlated with the increase of invested capital, may be linked to the negative impact on EVA (if the rate of growth of NOPat_a is lower than the rate of growth of invested capital opportunity cost). Economic Value Added asserts that businesses should create returns at a rate that is above their cost of capital (EVA 2019).
Table 3 presents the summary of results. In all five years of the analyzed period (2014–2018), the company had a positive EVA, which means that the rate of growth of income was higher than the rate of growth of capital that was allocated to production processes. By analyzing the rate of annual variation of added economic value, we have found an alternation between the annual decreases and increases.
Strategically, for the five analyzed years (from the perspective of the initial and final situation), we observe two important aspects: (a) each year the company increased the invested capital; and, (b) EVA has been positive and has increased.
We performed an econometric analysis, according to the coordinates established in the Research methodology section because the case study showed that a company can increase EVA, even if the invested capital increase. The dependent variable of econometric analysis is EVA. The independent variables are: adjusted invested capital (Ic_a); return on assets (ROA) determined as the ratio between gross profit and total assets; fixed assets volume (FA); return on fixed assets (Raf), determined as the ratio between gross profit and total fixed assets); and, level of indebtedness (LI), determined as the ratio between debt and total financing.
The indicators determined on the basis of fixed assets (FA and Raf) were included in the analysis precisely to identify the link between their dynamics and EVA dynamics. Subsequently, because the case study indicated that part of the investments was financed on the basis of external capital (financial debts), the influence of this variable was also analyzed.
Based on the identified interdependencies, we proposed testing the following hypothesis:
Hypothesis 1 (H1).
Adjusted invested capital (Ic_a) is positively correlated with EVA.
This first hypothesis was based on the results of the case study indicating that EVA increased due to the increase in investments in fixed assets. The confirmation of this hypothesis may bring an element of novelty in scientific research, as previous studies have reported opposite results (Bhusan Sahoo and Kumar Pramanik 2016).
The ROA variable was introduced, because, at the sample level, it was observed that a company registers a positive EVA while the gross result is negative. This situation justified the testing of the interdependencies between the return on assets (ROA) and EVA, for which the following hypothesis was formulated:
Hypothesis 2 (H2).
There is a direct determination relationship between EVA and the rate-based performance indicator (ROA).
The confirmation of this hypothesis may be further evidence to support the superiority of EVA over traditional performance measures (accused of not reflecting economic reality) (Novyarni and Ningsih 2020).
The analysis at the level of descriptive statistics (Table 4) indicated that the indebtedness level is the variable with the highest variation. Thus, the indebtedness level of the companies from our sample varied between a minimum of 29% and a maximum of almost 55%. The return on fixed assets is another variable that also varied significantly, which took values between a minimum of −3.69% and a maximum of 10.4%. ROA also recorded significant variations (between 9.4 and −2.1). We calculated the natural logarithm for these indicators (Logarithm of EVA, Logarithm of Ic_a, and Logarithm of FA) due to the fact that EVA, Ic_a, and FA are expressed in absolute dimensions (thousand euros), in order to obtain correct results in future analyzes. However, the number of observations obtained for Logarithm of EVA is 18 due to the fact that EVA also has two negative values (see Table 4). The econometric practice shows that, for obtaining the logarithm of the variables that also have negative values, either a constant value is added to the data prior to the log transformations. Additionally, the transformation becomes log (Y + a), where a is the constant. However, this is not always a good idea, because it might change the way that we interpret the results. Sometimes, a better way to handle negative values is to use the missing values for the logarithm of a non-positive number.
The correlation matrix shows that, from the independent variables chosen, some are highly correlated: fixed assets with invested capital adjusted, and ROA with a return on fixed assets (marked with bold in Table 5). Therefore, in the following analysis, we alternatively excluded the correlated variables.
The general equations of the regression model applied are as follows:
Model 1:
where: i represents the companies included in the analysis, t is time (2014, …, 2018); Logarithm of EVA𝑖𝑡 is the dependent variable and Logarithm of Ic_a it, ROAit, and LIit are the independent variables; β1, β2, β3, represent the coefficients; and, Uit is the error term.
Logarithm of EVAit = Logarithm of Ic_a it β1 + ROAit β2 + LIit β3 + Uit,
Model 2:
where: i represents the companies included in the analysis, t is time (2014, …, 2018); Logarithm of EVA𝑖𝑡 is the dependent variables and Logarithm of FAit, Rfait, and LIit are the independent variables; β1, β2, β3, represent the coefficients; and, Uit is the error term.
Logarithm of EVAit = Logarithm of FAit β1 + Rfait β2 + LIit β3 + Uit,
Table 6 centralizes the results of the regression analysis. The two regression models applied resulted in being statistically significant; the probability associated to F-statistic is higher than 0.01, showing that the predictors are related significantly with the dependent variable.
The coefficients that were obtained for Model 1 show that the invested capital adjusted and ROA are positively and statistically significantly related to EVA. For Model 2, only one variable has a positive and statistically significant coefficient: fixed assets.
4. Discussion
4.1. Discussions on the Case Study
The recorded performance (appreciated by EVA) is the result of the strategies adopted by the company, such as: growth of operational efficiency; growth of income from sales; and, adaptation of financial structure to support the two previously formulated strategies.
- The growth of operational activities efficiency was visible in the increase of gross operational profit (with an average annual rate of 20.7%). The effects of this strategy resulted in an average annual growth rate of operational expenses (6.8%) below the average annual growth rate of the volume of sales (7.1%). This strategy was based on:
- -
- Improvement of processes. For the analyzed period, the degree of automation of production lines grew. According to the management report, the company assumes the fact that a high degree of automation is a pre-requisite for shortening the production time and providing the highest level of quality.
- -
- Increasing the efficiency in the use of raw material. The products with the highest attractiveness on the market were targeted. In 2014, only one car model car amounted to 50% in total production. At the end of 2018, the share of this car model reached 79% (the highest demand came from the EU).
- -
- Increasing the efficiency in the use of human resources. The average sold production per employee grew from 12 to 15 million euro over five years. It could be explained by the changes in the structure of production; the company reducing the number of cars with a lower added value (and lower production cost) in favor of cars with higher added value (despite their higher cost). Evidence of the degree of accountability and involvement of human resource in the growth of performance lies in the fact that the average growth rate of human resource expense (6.9%) was below the average growth rate of production sold per employee (7.5%).
- Increasing income from sales. This strategy (that is closely linked to the strategy presented above) was implemented by identifying and exploiting market trends and by a prompt response to the needs of car users. According to the Romanian catalogue for the depreciation period of fixed assets, cars have a depreciation period between four and six years, but the average age of car fleet in 2018 in Romania was 15.4 years (and the average in the European Union was 11 years). In sustaining the sale strategy, the company used the opportunity that was provided by the market and undertook the goal to increase the volume of its production. When the sales strategy was formulated, it has been taken into account that 92% of sales in 2014 were on foreign markets. The company succeeded in only five years to reduce its dependence on foreign markets (the volume of sales from export reaching 85% in 2018) and focus on closer markets. In 2018, 66% of exports oriented towards Europe, 15% towards Asia, 12% towards Africa, and 7% towards America. This redefining in the share of markets is justified by high expenses that are related to car deliveries on different continents.
- Adaptation of the financial structure. Although the costs are high, own capitals prevail in a company’s strategic financial structure. The existence of just one majority shareholder (that owns 99.43% of shares) facilitated the implementation of a consistent policy of own capital consolidation (for the analyzed period, its share in the financial structure grew from 84.7% to 86.9%, especially on the account of reinvested profits and the development of business at the level of the group). The consequences of this policy (that resulted in the decrease of amounts allocated for dividends and/or delay of dividend payment owed for previous years) was accepted by the majority shareholder, mainly for business development and an increase of its future performance. To control and minimize the costs of financing, most of the financial resources allocated to operational activities were attracted from within the group. Even if this strategy of financing mainly from own funds (without making the most of tax benefits of indebtedness) led to a growth of the weighted average cost of capital, it facilitated the growth of business performance (as measured by EVA).
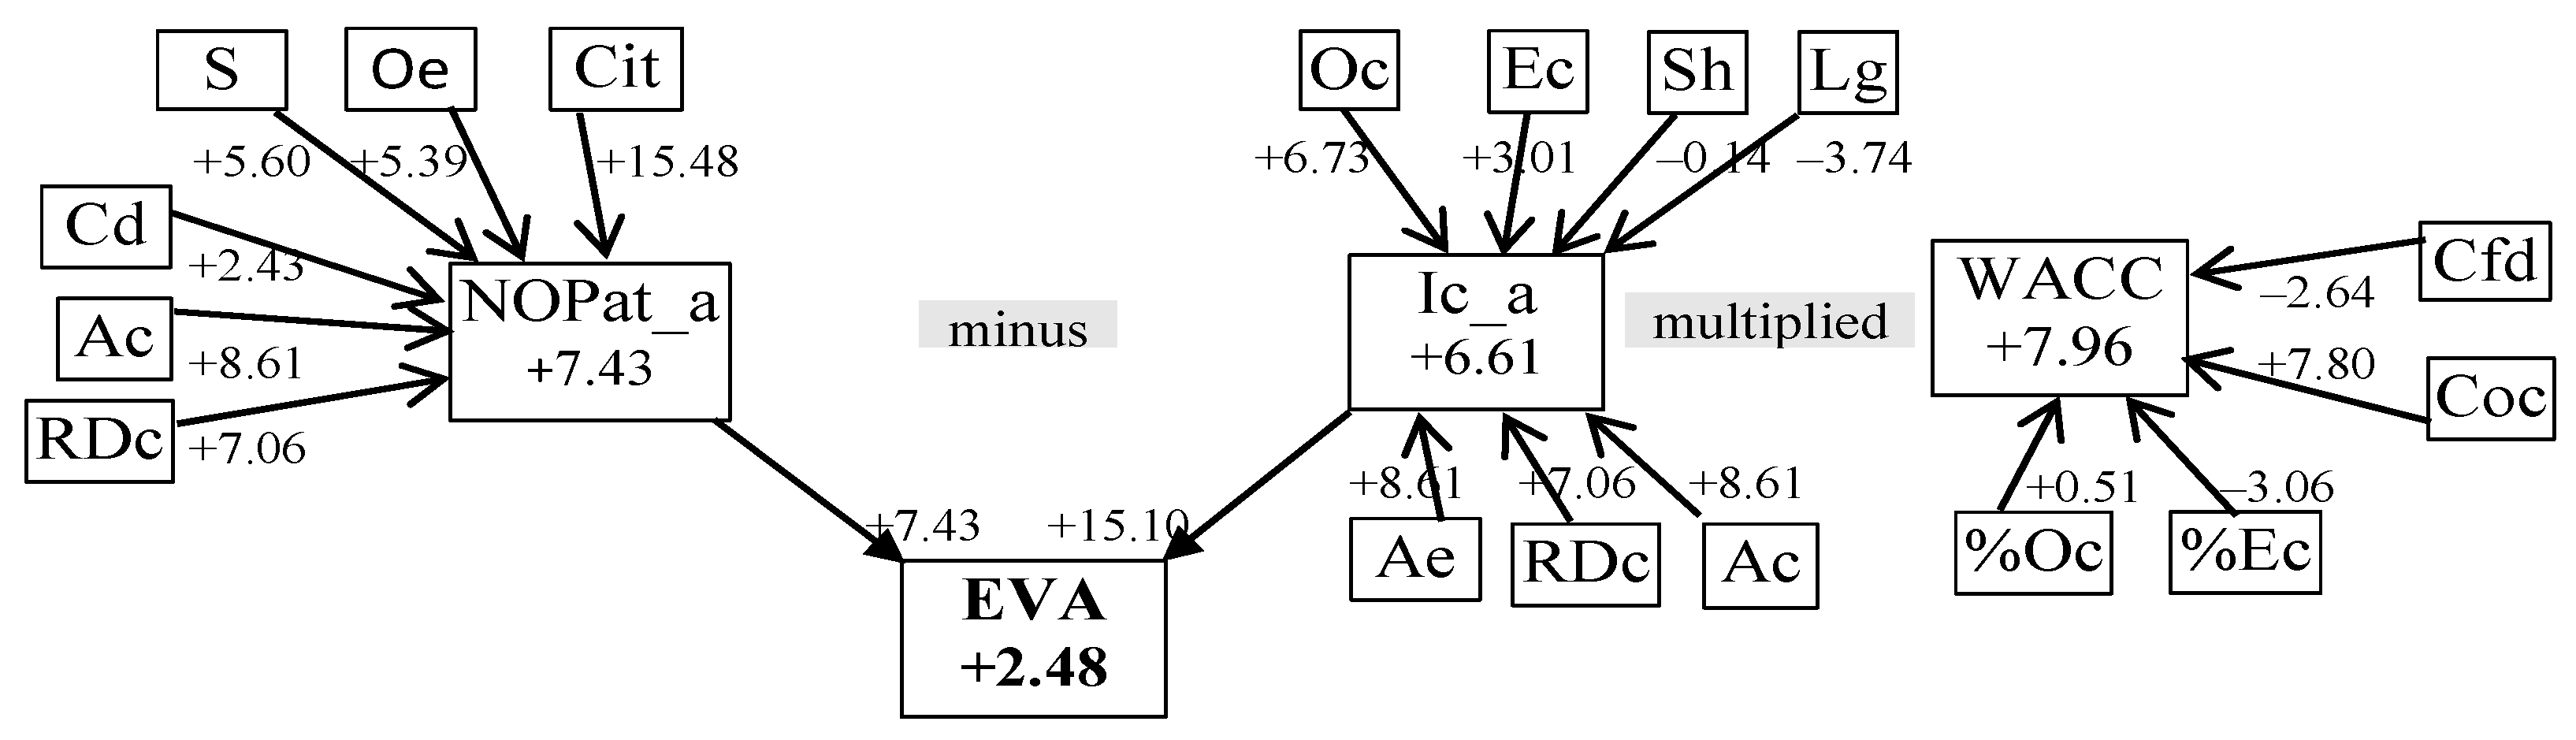
- Dynamic analysis of the added economic value. We determined (based on the information in Table 2) the compound annual growth rate (CAGR) (Table 7) and constructed the tree of decomposition of influences to identify the interdependencies and significance of the variables included in the analysis (Figure 1).
During the five years of the analysis, the adjusted NOPat had a compound annual growth rate of 7.43%. During the same period, adjusted invested capital (6.61%), the weighted average cost of capital (7.96%), and fixed assets (3.46%) have increased. The cumulative effect of these changes materialized in an annual compound growth rate of EVA of 2.48%. These results empirically prove that EVA can grow, even in the face of increased investment in fixed assets.
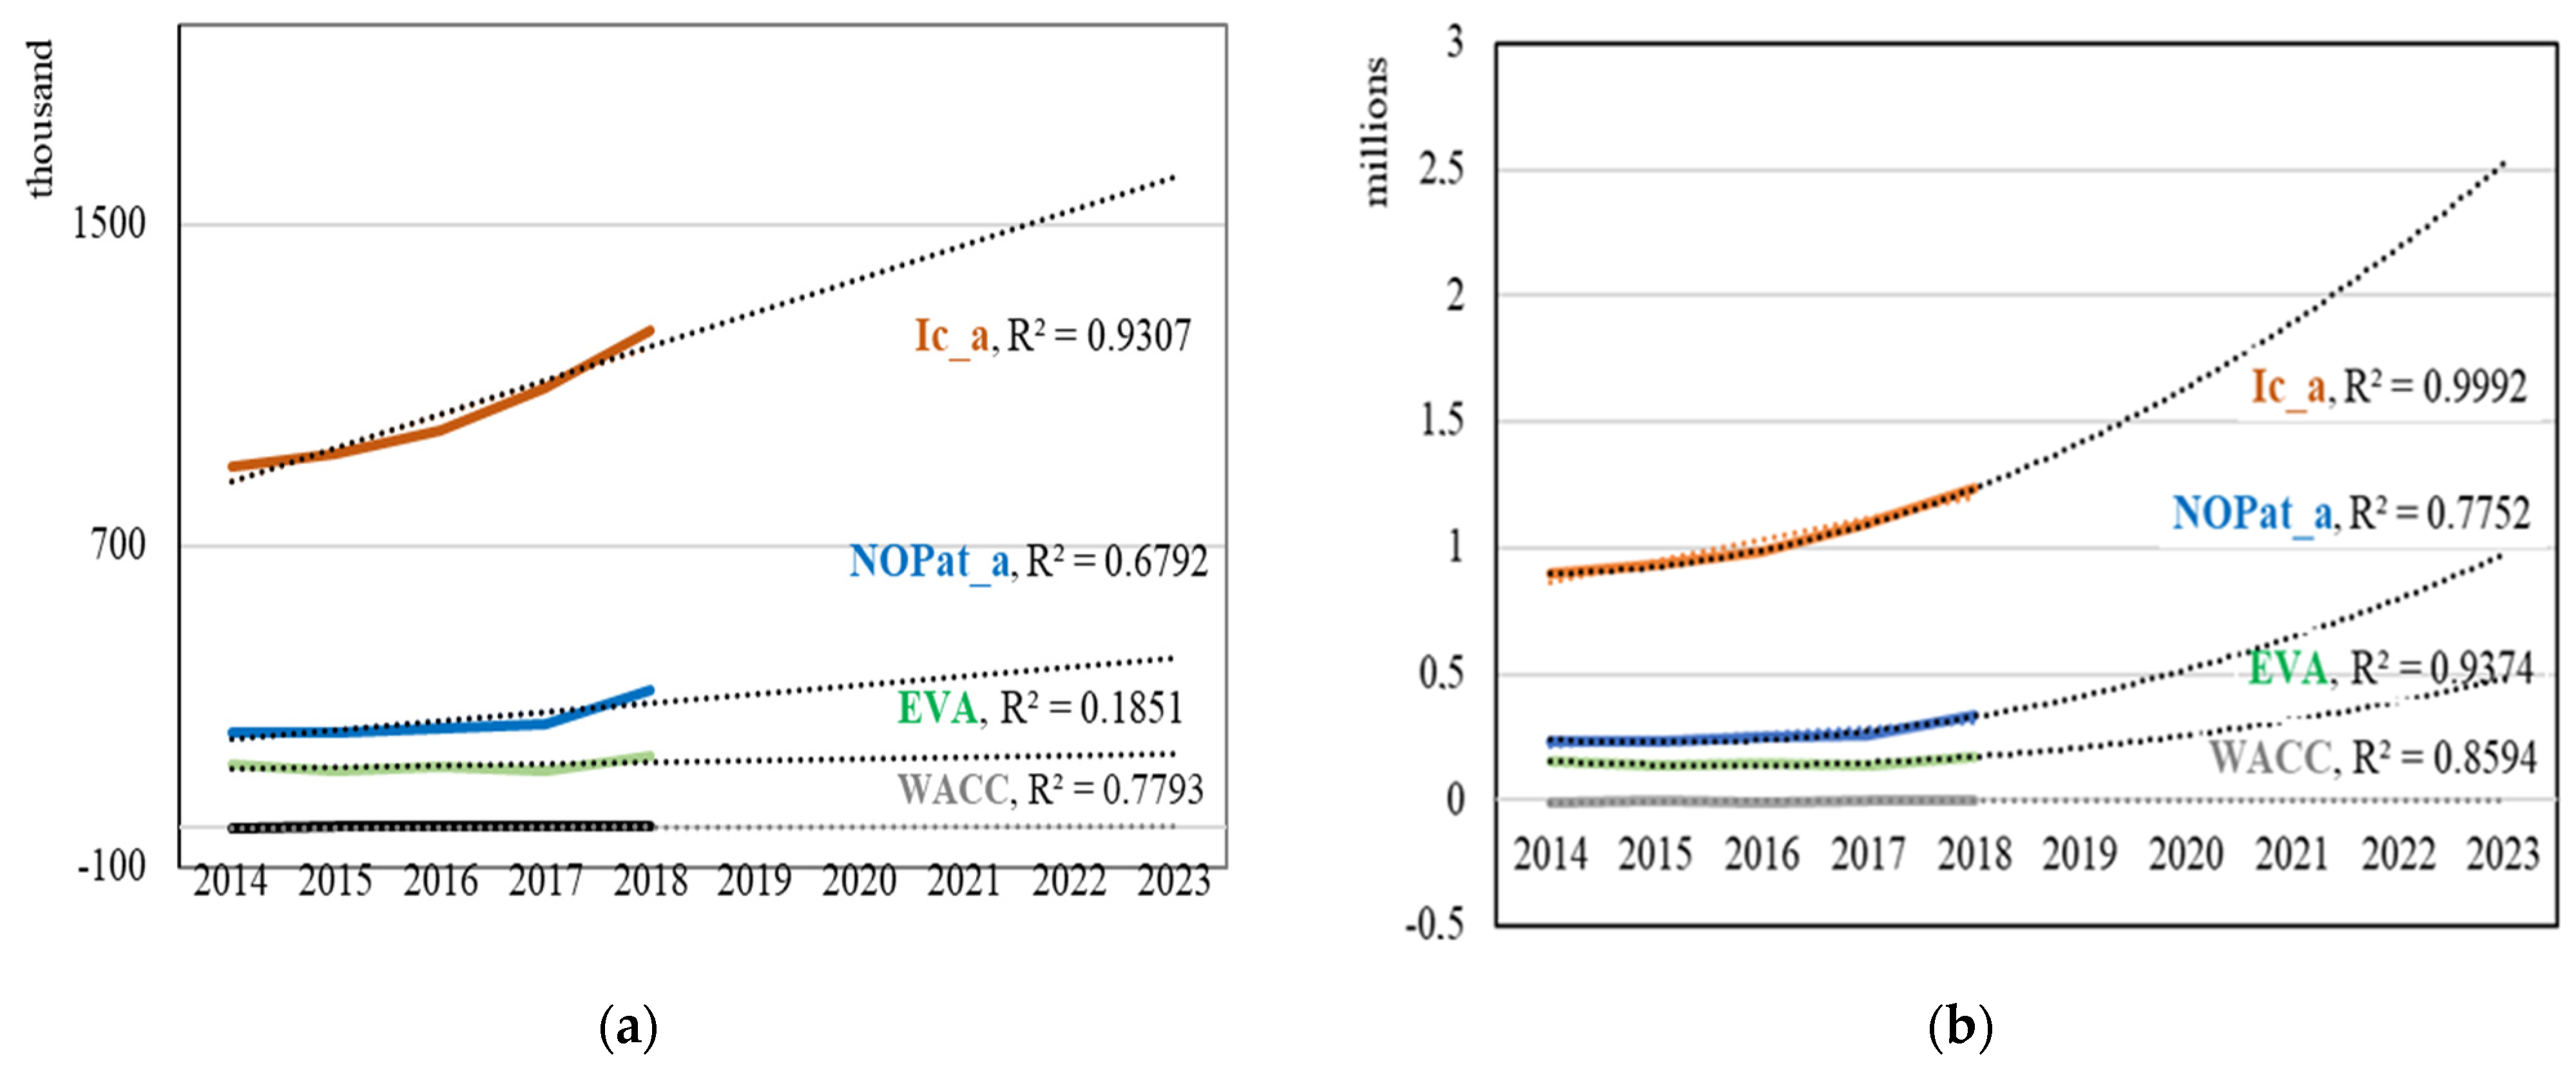
We determined the trends for the analyzed indicators (for a forecast horizon of five years) in order to obtain significant conclusions regarding the efficiency of management and the trends of the future evolution, based on the information in Table 2. Based on the least squares method, we looked for a suitable trend line. We tested the types of trends that best fit the data set analyzed. Figure 2 indicates that the polynomial model fits the data best, because R-square has the best values (closer to 1).
A polynomial trend line indicates that the data vary (as confirmed by previous annual analyses), being recommended by the Excel package to describe the relationship between two variables with different trends up to a certain point, beyond which their trends synchronize. Therefore, we can admit that, for the forecast period, the increase of invested capital (adjusted) and net operating profit (adjusted) will generate a higher economic value. These increases will amplify over time, due to operating expenses (such as research and development or promotion) that generate benefits in future financial years.
4.2. Discussions on the Econometric Analysis
The invested capital adjusted and ROA are positively and statistically significant related to EVA, according to Model 1. Therefore, an increase of investments in total assets will lead to an increase in EVA. Additionally, higher rates of ROA will determine an increase of EVA. These results are in contradiction with previously research results which shown that EVA does not provide information regarding the financial performance of companies affected by variations of business cycles and does not stimulate growth of company wealth (Bhusan Sahoo and Kumar Pramanik 2016). The lack of congruence of the research results is further evidence that this area of research is far from exhausted; therefore, this study fills the research gap that is generated by the differences between theory and practice.
The second hypothesis was assumed to test the extent to which different performance indicators are correlated, as we mentioned in the previous section. Because the increase in ROA (as an independent variable) contributes to the increase in EVA (as a dependent variable), the superiority of EVA over traditional performance measures is confirmed (Novyarni and Ningsih 2020). Subsequently, when considering the situation identified at the level of the primary analysis data (for one of the companies in the sample the ROA was negative during the analyzed period while EVA was positive) it is confirmed that EVA reflects the true economic profit of a business (Orazalin et al. 2019).
Only one variable has a positive and statistically significant coefficient: fixed assets, according to Model 2. This result shows that increasing the level of fixed assets will determine an increase of EVA. Therefore, the acquisition of fixed assets (in the business growth phase) has a positive impact on performance that is measured by EVA. In other words, a company can improve its performance, even in periods of growth, which are characterized by consistent investments.
The other two variables considered (return on fixed assets and level of indebtedness) did not result in being statistically significant with EVA for the case of the companies considered. The value obtained for R-square adjusted indicates that over 95% of the variation of EVA is explained by the variation of the independent variables.
4.3. Practical Implication
The results of this study are of interest to both investors and managers, because they improve on the understanding of the variables that influence EVA. A positive and growing EVA (in the conditions of growth the invested capital) provides evidence to investors regarding the business’s ability to generate superior performance in the future. Subsequently, the clarification of the methodology for determining the EVA, adapted to the Romanian companies in the automotive industry, facilitates the decision-making process of the managers, preventing any possible distortions in the performance evaluation. Thus, managers gain additional information regarding the performance and position of the company they manage. Following the EVA methodology, managers can know whether or not the investments made create value, if the weighted average cost of capital is lower than the internal rate of return of the business (respectively, if the absorption of financing is positive), whether the growth rate of sales is lower than the growth rate of operational expenses, etc. A skilled manager can turn this information into real competitive advantages.
5. Conclusions
EVA, as a measure of performance, provides managers the opportunity and motivation to take decisions growing the value of business in both the interests of shareholders and other stakeholders. Although the center of decision-making, which is responsible for monitoring and measuring performance, is placed in the area of financial management, it does not neglect the non-financial issues. The method’s accuracy makes it easy to be understood by managers at all levels (including the non-financial managers) and makes it possible to measure the performance of the entire business.
Our literature reviews have found a growing interest in using EVA as a performance measure. Although empirical research focused on various areas, few evidences were identified on the use of EVA to assess the performance of companies in the automotive sector. For example, Pavelková et al. (2018) showed that the car industry is very sensitive to economic cycles, and value added is a factor with a major positive impact on performance in both the pre- and post-crisis period. This paper summarizes the advantages and disadvantages of using EVA as a tool for measuring performance, presents the peculiarities of its determination, analyzes the dynamics (relative to other variables), and points out its usefulness for shareholders, investors, and managers.
The case study provides an original methodological framework for applying this method of performance measurement, which is adapted to companies in the automotive industry. In an original manner, we have considered not only the calculation of indicators specific to EVA (based on past events), but also the presentation of arguments that lied at the basis of business decisions that led to the growth of performance. Thus, we have shown that EVA-based performance management depends not only on accounting information, but also on the way that the information from outside the company is used. Moreover, the study confirms that EVA has the ability to provide investors and corporate managers the information regarding to the company’s prospects for higher earnings in the future (Bhasin 2013).
Additionally, the empirical research provides evidence fighting one of the criticisms brought to this method, namely that the EVA methodology does not stimulate the development of economic capital of a business due to the fact that the purchase of fixed assets has a negative impact on performance (Bhusan Sahoo and Kumar Pramanik 2016). Our study has shown that a company can increase EVA, even under conditions of growth of invested capital, respectively, fixed assets if: (a) the rate of remuneration growth that is required by funders is lower than the rate of net operational profit growth; and, (b) there is a consensus among funders on the reduction of current remuneration over higher future financial remuneration. At the same time, the results confirmed that EVA is superior to traditional performance indicators (Novyarni and Ningsih 2020), and that it reflects the true economic profit of a business (Orazalin et al. 2019).
The increase in economic value added was possible due to the division of the company mission into synchronized strategies. This way, the strategy of growing the efficiency of operational activities allowed for the improvement of processes (by automation of production lines and improving quality), the growth of efficiency in the use of material resources (by their allocation to products with the highest attractiveness on the market), and growth of efficiency in the use of human resources (by increasing work productivity and the degree of accountability and involvement of human resources in growth of performance). Subsequently, the strategy of growth of income from sales focused on identifying and favorable exploitation of opportunities (the average age of car fleet in Romania and the EU, restrictions on imports and on polluting vehicles, the degree of competitive pressure) and of the needs of car users. To create value for clients, the company adapted its production lines in such a way as to them to produce the most solid model. The two strategies (growth of operations efficiency and sales growth) were supported by financial strategy centered mainly on the consolidation of own capital. From the perspective of shareholders, financial autonomy was more important than the opportunities for integral use of fiscal benefits that are related to indebtedness.
The study has some limitations. The adjustment of NOPat and Ic was made according to the most relevant elements that were identified in the case study, but they are not generally valid for all companies. In econometric analysis, only accounting financial data were used (not all companies in the sample are listed, which made it difficult to determine the real cost of equity from the perspective of shareholder expectations). The restricted sample on which the situations identified in the case study were tested allows for a limited generalization of the results. In order to ensure a greater representativeness of the results, we are considering an extensive research development (by enlarging the sample, so that the results are representative at the industry level, but without losing sight of the specificity of EVA determination) and an intensive development (by analyzing the performance in the different stages of economic growth/decline). We strongly believe that theory and practice from the performance management field (including performance measurement methods such as EVA) may be continuously improved, according to changes in the business environment. By providing support for putting the methods of performance measurement into practice, we aim to adapt the scientific methods of performance measurement to practical specificity of company performance measurement and validate these methods in practice.
Author Contributions
All authors contributed equally to the writing of the paper. Conceptualization, M.B.T., V.D.R. and S.A. Formal analysis, M.B.T., V.D.R. and S.A. Methodology, M.B.T., V.D.R. and S.A. Writing—review & editing, M.B.T., V.D.R. and S.A. All authors have read and agreed to the published version of the manuscript.
Funding
This research received no external funding.
Data Availability Statement
Not applicable.
Conflicts of Interest
The authors declare no conflict of interest.
References
- Adane, Tigist Fetene, and Cornel Mihai Nicolescu. 2018. Towards a generic framework for the performance evaluation of manufacturing strategy: An innovative approach. Journal of Manufacturing and Materials Processing 2: 23. [Google Scholar] [CrossRef] [Green Version]
- Afonina, Anna. 2015. Strategic Management tools and techniques and organizational performance: Findings from the Czech Republic. Journal of Competitiveness 7: 19–36. [Google Scholar] [CrossRef] [Green Version]
- Aguinis, Herman, Harry Joo, and Ryan Gottfredson. 2012. Performance management universals: Think globally and act locally. Business Horizons 55: 385–92. [Google Scholar] [CrossRef]
- Aguinis, Herman. 2013. Performance Management, 3rd ed. Upper Saddle: Prentice Hall. [Google Scholar]
- Alam, Perways, and Mohammed Nizamuddin. 2012. Performance measures of shareholders wealth: An application of economic value added. International Journal of Applied Financial Management Perspectives 1: 160–67. [Google Scholar]
- Annamalah, Sanmugam, Murali Raman, Govindan Marthandan, and Aravindan Kalisri Logeswaran. 2018. Implementation of enterprise risk management (ERM) Framework in enhancing business performances in oil and gas sector. Economies 6: 4. [Google Scholar] [CrossRef] [Green Version]
- Armstrong, Michael. 2015. Armstrong’s Handbook of Performance Management: An Evidence Based Guide to Delivering High Performance, 5th ed. London: Kogan Page. [Google Scholar]
- Batchimeg, Bayaraa. 2017. Financial Performance Determinants of Organizations: The Case of Mongolian Companies. Journal of Competitiveness 9: 22–33. [Google Scholar]
- Belas, Jaroslav, Valér Demjan, Jozef Habánik, Mária Hudáková, and Juraj Sipko. 2015. The business environment of small and medium-sized enterprises in selected regions of the Czech Republic and Slovakia. Economics and Management 18: 95–110. [Google Scholar] [CrossRef]
- Bhasin, Madan Lal. 2013. Economic value added and shareholders’ wealth creation: Evidence from a developing country. International Journal of Finance and Accounting 2: 185–98. [Google Scholar]
- Bhasin, Madan Lal. 2017. A study of economic value-added disclosures in the annual reports: Is EVA a superior measure of corporate performance? East Asian Journal of Business Management 5: 10–26. [Google Scholar] [CrossRef]
- Bhusan Sahoo, Bharata, and Alok Kumar Pramanik. 2016. Economic value added: A better technique for performance measurement. International Journal of Advances in Management and Economics 5: 1–12. [Google Scholar]
- Bostan, Ionel, Carmen Toderașcu, and Anca Florentina Gavriluţă (Vatamanu). 2018. Challenges and vulnerabilities on public finance sustainability. A Romanian case study. Journal of Risk and Financial Management 11: 55. [Google Scholar] [CrossRef] [Green Version]
- Brad, Laura, and Anca Munteanu. 2012. An adjustment model for EVA computation in financial institutions and non-financial companies. Paper presented at 7th International Conference Accounting and Management Information Systems, Bucharest, Romania, June 13–14; pp. 1368–83. [Google Scholar]
- Crisan, Emil Lucian, Liviu Ilies, and Ioana Muresan. 2010. Six Sigma: A metric, a methodology and a management system. Annals of Faculty of Economics 1: 651–56. [Google Scholar]
- Daraban, Marius Costin. 2018. Business value created by management accounting. Paper presented at CBU International Conference on Innovations in Science and Education, Prague, Czech Republic, March 23–25; pp. 1–6. [Google Scholar]
- Dobija, Dorota, and Grygorii Kravchenko. 2017. Supervisory Board composition and firm financial performance: A case of companies listed on the Warsaw stock exchange. Journal of Management and Business Administration. Central Europe 25: 75–95. [Google Scholar] [CrossRef]
- Egbunike, Chinedu Francis, and Chinedu Uchenna Okerekeoti. 2018. Macroeconomic factors, firm characteristics and financial performance: A study of selected quoted manufacturing firms in Nigeria. Asian Journal of Accounting Research 3: 142–68. [Google Scholar] [CrossRef] [Green Version]
- EVA. 2019. Economic Value Added. Available online: https://investinganswers.com/dictionary/e/economic-valueadded-eva (accessed on 18 April 2020).
- Francisco de Almeida, Leonardo Soares, Julio Vieira Neto, Mara Telles Salles, Carlos Alberto Pereira Soares, and Yohans de Oliveira Esteves. 2016. Comparative analysis between EVA and traditional financial (accounting) indicators in Brazilian civil construction companies: A documentary study. Gestão & Produção, 23. [Google Scholar] [CrossRef]
- Geng, Songtao, Suyu Liu, and Xuelin Liao. 2021. Operating Performance of Tourism Listed Companies in China: The Perspective of Economic Value Added. SAGE Open, 1–10. [Google Scholar] [CrossRef]
- Hasani, Syed Mojtaba, and Zahra Fathi. 2012. Relationship between the economic value added (EVA) with stock market value (MV) and profitability ratios. Interdisciplinary Journal of Contemporary Research in Business 4: 406–15. [Google Scholar]
- Horak, Jakub, Petr Suler, Jaroslav Kollmann, and Jan Marecek. 2020. Credit Absorption Capacity of Businesses in the Construction Sector of the Czech Republic—Analysis Based on the Difference in Values of EVA Entity and EVA Equity. Sustainability 12: 9078. [Google Scholar] [CrossRef]
- Ion, Elena Iuliana, and Mariana Man. 2019. Economic value added relevance for stakeholders regarding the quality of performance analysis of Romanian metallurgical companies. Quality-Access to Success 20: 417–22. [Google Scholar]
- Jankalová, Miriam, and Jana Kurotová. 2020. Sustainability assessment using economic value added. Sustainability 12: 318. [Google Scholar] [CrossRef] [Green Version]
- Kassi, Diby François, Dilesha Nawadali Rathnayake, Pierre Axel Louembe, and Ning Ding. 2019. Market Risk and Financial Performance of Non-Financial Companies Listed on the Moroccan Stock Exchange. Risks 7: 20. [Google Scholar] [CrossRef] [Green Version]
- Kennerley, Mike, and Andy Neely. 2003. Measuring performance in a changing business environment. International Journal of Operations & Production Management 23: 213–29. [Google Scholar]
- Kijewska, Anna. 2016. Causal analysis of determinants influencing the economic value added (EVA)—A case of Polish entity. Journal of Economics and Management 26: 52–71. [Google Scholar] [CrossRef]
- Lee, Jim. 2009. Does size matter in firm performance? Evidence from US public firms. International Journal of the Economics of Business 16: 189–203. [Google Scholar] [CrossRef]
- Liu, Tiansen, Yufeng Zhang, and Dapeng Liang. 2019. Can ownership structure improve environmental performance in Chinese manufacturing firms? The moderating effect of financial performance. Journal of Cleaner Production 225: 58–71. [Google Scholar] [CrossRef] [Green Version]
- Lozano, Rodrigo. 2015. A holistic perspective on corporate sustainability drivers. Corporate Social Responsibility and Environmental Management 22: 32–44. [Google Scholar] [CrossRef]
- Luo, Changqing, Siyuan Fan, and Qi Zhang. 2017. Investigating the Influence of Green Credit on Operational Efficiency and Financial Performance Based on Hybrid Econometric Models. International Journal of Financial Studies 5: 27. [Google Scholar] [CrossRef] [Green Version]
- Malichova, Eva, Maria Durisova, and Emese Tokarcikova. 2017. Models of application economic value added in automotive company. Transport Problems 12: 93–102. [Google Scholar] [CrossRef]
- Mocciaro Li Destri, Arabella, Pasquale Massimo Picone, and Anna Mina. 2012. From ‘strategic fit’ to synergy evaluation in M&A Deals. Caspian Journal of Applied Sciences Research 1: 25–38. [Google Scholar]
- Morard, Bernard, and Florentina-Olivia Balu. 2010. Developing a practical model for economic value added. Economic Computation and Economic Cybernetics Studies and Research 43: 107–22. [Google Scholar]
- Narkunienė, Judita, and Aurelija Ulbinaitė. 2018. Comparative analysis of company performance evaluation methods. International Journal Entrepreneurship and Sustainability 6: 125–38. [Google Scholar] [CrossRef]
- Novyarni, Nelli, and Lavita Nur Ayu Ningsih. 2020. Comparative Analysis of Financial Ratios and Economic Value Added Methods in Assessing Company Financial Performance. In Advances in Economics, Business and Management Research. Paper presented at the Annual International Conference on Accounting Research, Jakarta, Indonesia, November 6–7, vol. 127, pp. 137–42. Available online: https://www.atlantis-press.com/proceedings/aicar-19/125936065 (accessed on 26 January 2021).
- O’Byrne, Stephen. 2016. A better way to measure operating performance (or Why the EVA math really matters). Journal of Applied Corporate Finance 28: 68–86. [Google Scholar] [CrossRef]
- Orazalin, Nurlan, Monowar Mahmood, and Timur Narbaev. 2019. The impact of sustainability performance indicators on financial stability: Evidence from the Russian oil and gas industry. Environmental Science and Pollution Research 26: 8157–68. [Google Scholar] [CrossRef] [PubMed]
- Owusu-Antwi, George, Lord Mensah, Margret Crabbe, and James Antwi. 2015. Determinants of Bank Performance in Ghana, the Economic Value Added (EVA) Approach. International Journal of Economics and Finance 7: 203–15. [Google Scholar] [CrossRef] [Green Version]
- Panigrahi, Shrikant Krupasindhu, Yuserrie Zainuddin, and Azzlina Azizan. 2014. Comparing Traditional and Economic Performance Measures for Creating Shareholder’s Value: A Perspective from Malaysia. International Journal of Academic Research in Accounting, Finance and Management Sciences 4: 280–89. [Google Scholar] [CrossRef]
- Pavelková, Drahomíra, Lubor Homolka, Adriana Knápková, Karel Kolman, and Ha Pham. 2018. EVA and Key Performance Indicators: The Case of Automotive Sector in PreCrisis, Crisis and Post-Crisis Periods. Economics and Sociology 11: 78–95. [Google Scholar] [CrossRef] [PubMed]
- Radneantu, Nicoleta, Emilia Gabroveanu, and Elena Roxana Stan. 2010. Is EVA an important forecasting tool for knowledge-based organizations in economic crises time? Romanian Economic Business Review 5: 88–196. [Google Scholar]
- Rajnoha, Rastislav, Petra Lesníková, and Anton Koraus. 2016. From financial measures to strategic performance measurement system and corporate sustainability: Empirical Evidence from Slovakia. Economics & Sociology 9: 134–52. [Google Scholar]
- Rodrigues, Jorge. 2010. Avaliação do Desempenho das Organizações. Lisboa: Escolar Editora. [Google Scholar]
- Schläfke, Marten, Riccardo Silvi, and Klaus Möller. 2013. A framework for business analytics in performance management. International Journal of Productivity and Performance Management 62: 110–22. [Google Scholar]
- Searcy, Cory. 2012. Corporate sustainability performance measurement systems: A review and research agenda. Journal of Business Ethics 107: 239–53. [Google Scholar] [CrossRef]
- Sichigea, Nicolae, and Laura Vasilescu. 2015. Economic value added and market value added-modern indicators for assessment the firm’s value. Annals of the “Constantin Brâncuşi”. Economy Series, ECO-TREND 2: 488–93. [Google Scholar]
- Sorooshian, Shahryar Nor Filianie Aziz, Asraf Ahmad, Syafiah Norsyahira Jubidin, and Nor Mahirah Mustapha. 2016. Review on performance measurement systems. Mediterranean Journal of Social Sciences 7: 123–32. [Google Scholar] [CrossRef] [Green Version]
- Stewart, Bennett. 1999. The Quest for Value. A Guide for Senior Managers, 2nd ed. New York: Harper Business. [Google Scholar]
- Suriyankietkaew, Suparak, and Gayle C. Avery. 2016. Sustainable leadership practices driving financial performance: Empirical evidence from Thai SMEs. Sustainability 8: 327. [Google Scholar] [CrossRef] [Green Version]
- SVM. 2016. Who are we? In Stern Value Management. Available online: http://sternvaluemanagement.com/who-we-are-consulting-firm/ (accessed on 25 May 2019).
- Taouab, Omar, and Zineb Issor. 2019. Firm performance: Definition and measurement models. European Scientific Journal 15: 1857–81. [Google Scholar] [CrossRef] [Green Version]
- Taticchi, Paolo, Flavio Tonelli, and Luca Cagnazzo. 2010. Performance measurement and management: A literature review and a research agenda. Measuring Business Excellence 14: 4–18. [Google Scholar] [CrossRef] [Green Version]
- Trandafir, Raluca Andreea. 2015. The economic value added (EVA)—A measurement indicator of the value creation within a company from the Romanian seaside hotel industry. Annals of the Constantin Brâncuşi University of Târgu Jiu. Economy Series 1: 36–40. [Google Scholar]
- Tudose, Mihaela Brindusa, and Silvia Avasilcai. 2020. A Review of the Research on Financial Performance and Its Determinants. In Innovation in Sustainable Management and Entrepreneurship. SIM 2019. Springer Proceedings in Business and Economics. Edited by Gabriela Prostean, Juan Jose Lavios Villahoz, Laura Brancu and Gyula Bakacsi. Cham: Springer. [Google Scholar] [CrossRef]
- Vukšić, Vesna Bosilj, Mirjana Pejić Bach, and Aleš Popovič. 2013. Supporting performance management with business process management and business intelligence: A case analysis of integration and orchestration. International Journal of Information Management 33: 613–19. [Google Scholar] [CrossRef]
- Wang, Yan-Qi, and Jiu-Xiang Yang. 2014. Study on the application of the EVA performance evaluation system in petroleum and petrochemical enterprises-taking the JX petrochemical company as an example. Economic Management 4: 94–105. [Google Scholar]
- Xu, Jian, and Binghan Wang. 2018. Intellectual Capital, Financial Performance and Companies’ Sustainable Growth: Evidence from the Korean Manufacturing Industry. Sustainability 10: 4651. [Google Scholar] [CrossRef] [Green Version]
Figure 1.
The impact of the variation of economic added value (EVA) determinants (compound annual growth rate (CAGR) [%]). Source: Authors own representation.
Figure 1.
The impact of the variation of economic added value (EVA) determinants (compound annual growth rate (CAGR) [%]). Source: Authors own representation.

Figure 2.
Trend testing. (a) Linear trend lines; (b) Polynomial trend lines. Source: Authors own representation.
Figure 2.
Trend testing. (a) Linear trend lines; (b) Polynomial trend lines. Source: Authors own representation.


Table 1.
Indicators used in analysis.
| Indicators | Computation Method (the Symbols Are Shown in Parentheses) |
|---|---|
| Net operation profit after tax_adjusted (NOPat_a) | NOPat_a = sales (S) − operational expenses (Oe) + current depreciation (Cd) + advertising costs (Ac) + research and development costs (RDc) − corporate income tax (Cit) |
| Invested capital_adjusted (Ic_a) | Ic_a = own capital (Oc) + external capital (Ec) + advertising costs (Ac) + research and development costs (RDc) − advance expenses (Ae) − shares held (Sh) − loans granted (Lg) Financial structure: 100% = weight of Oc + weight of Ec |
| Weighted average cost of capital (WACC) | WACC = cost of Oc × weight Oc + cost of Ec × weight of Ec × [1 − tax rate] |
Source: Authors own elaboration according to Pavelková et al. (2018); Jankalová and Kurotová (2020).
Table 2.
Net operation profit after tax, invested capital, and weighted average cost of capital.
| Indicators. | 2014 | 2015 | 2016 | 2017 | 2018 |
|---|---|---|---|---|---|
| (thousand euros) | |||||
| Sales (S) | 3,952,769 | 4,022,281 | 4,358,176 | 4,857,448 | 5,189,945 |
| Operational expenses (Oe) | 3,873,640 | 3,939,203 | 4,259,972 | 4,765,066 | 5,036,971 |
| Gross operation profit (Gop = S − Oe) | 79,129 | 83,078 | 98,204 | 92,382 | 152,974 |
| Current depreciation (Cd) | 118,927 | 114,474 | 108,078 | 105,520 | 134,078 |
| Advertising costs (Ac) | 13,198 | 13,847 | 15,388 | 18,235 | 19,945 |
| Research and development costs (RDc) | 31,693 | 33,467 | 36,205 | 42,833 | 44,575 |
| Corporate income tax (Cit) | 6195 | 10,177 | 10,362 | 2400 | 12,720 |
| (1) Net operation profit after tax_adjusted (NOPat_a) | 236,753 | 234,688 | 247,514 | 256,571 | 338,852 |
| Own capital (Oc) | 773,854 | 798,092 | 816,651 | 913,882 | 1,071,795 |
| External capital (Ec): | 139,263 | 145,702 | 177,379 | 180,403 | 161,494 |
| +financial debts (Fd) | 104,396 | 111,286 | 138,939 | 145,803 | 127,370 |
| +financial leasing (Fl) | 34,867 | 34,416 | 38,440 | 34,600 | 34,124 |
| Advertising costs (Ac) | 13,198 | 13,826 | 15,388 | 18,235 | 19,945 |
| Research and development costs (RDc) | 31,693 | 33,467 | 36,205 | 42,833 | 44,575 |
| Advance expenses (Ae) | 1577 | 1383 | 1347 | 1738 | 2843 |
| Shares held (Sh) | 57,600 | 57,197 | 57,197 | 57,197 | 57,197 |
| Loans granted (Lg) | 651 | 636 | 636 | 638 | 538 |
| (2) Invested capital_adjusted (Ic_a) | 898,182 | 931,870 | 986,444 | 1,095,781 | 1,237,230 |
| Own capital (Oc) | 773,854 | 798,092 | 816,651 | 913,882 | 1,071,795 |
| External capital, financial debts (Fd) | 139,263 | 145,702 | 177,379 | 180,403 | 161,494 |
| Cost of own capital (Cost of Oc) | 78,007 | 94,014 | 95,818 | 113,140 | 157,913 |
| Cost of financial debts (Cost of Fd) | 3980 | 3794 | 3701 | 3811 | 4203 |
| Fiscal advantage of debt (fa) | 637 | 607 | 592 | 610 | 672 |
| Real cost of financial debts (R_Cost of Fd) | 3343 | 3187 | 3109 | 3201 | 3530 |
| (%) | |||||
| Indicators | 2014 | 2015 | 2016 | 2017 | 2018 |
| Share of own capital (Oc) (%) | 84.7 | 84.6 | 82.2 | 83.5 | 86.9 |
| Share external capital (Ec) (%) | 15.3 | 15.4 | 17.8 | 16.5 | 13.1 |
| Cost of own capital (Coc) (%) | 10.1 | 11.8 | 11.7 | 12.4 | 14.7 |
| Real cost of financial debts (Cfd) (%) | 3.2 | 2.9 | 2.2 | 2.2 | 2.8 |
| 3) Weighted average cost of capital (WACC) (%) | 9.0 | 10.4 | 10.0 | 10.7 | 13.2 |
Source: Authors own calculation.
Table 3.
Economic value added (thousand euro).
| Indicators | 2014 | 2015 | Δ2015/2014 | 2016 | Δ2016/2015 | 2017 | Δ2017/2016 | 2018 | Δ2018/2017 |
|---|---|---|---|---|---|---|---|---|---|
| NOPat_adjusted | 236,753 | 234,688 | −2065 | 247,514 | 12,826 | 256,571 | 9057 | 338,852 | 82,281 |
| Ic_adjusted | 898,182 | 931,870 | 33,688 | 986,444 | 54,574 | 1,095,781 | 109,337 | 1,237,230 | 141,449 |
| WACC (%) | 9.00 | 10.40 | 1.40 | 10.00 | −0.40 | 10.70 | 0.70 | 13.20 | 2.50 |
| EVA | 155,635 | 137,742 | −17,893 | 148,488 | 10,746 | 139,310 | −9178 | 175,945 | 36,635 |
Source: Authors own calculation.
Table 4.
Descriptive statistics of the variables included in the analysis.
| Mean | Maximum | Minimum | Std. Dev. | Observations | |
|---|---|---|---|---|---|
| EVA 1 | 191.76 | 834.23 | −3.18 | 313.64 | 20 |
| Logarithm of EVA | 17.56 | 20.54 | 14.96 | 1.95 | 18 |
| EVA 2 | 39.37 | 171.30 | −0.65 | 64.40 | 20 |
| Ic_a 1 | 1397.87 | 5894.91 | 81.03 | 2106.18 | 20 |
| Logarithm of Ic_a | 19.80 | 22.50 | 18.21 | 1.62 | 20 |
| Ic_a 2 | 287.04 | 1210.45 | 16.64 | 432.48 | 20 |
| ROA (%) | 4.03 | 9.42 | −2.12 | 3.32 | 20 |
| FA 1 | 1109.19 | 4465.38 | 54.37 | 1701.12 | 20 |
| Logarithm of FA | 19.44 | 22.22 | 17.81 | 1.73 | 20 |
| FA 2 | 287.04 | 1210.45 | 16.64 | 432.48 | 20 |
| Rfa (%) | 5.27 | 10.40 | −3.69 | 4.41 | 20 |
| LI (%) | 41.54 | 54.55 | 29.39 | 8.24 | 20 |
Note: 1 Values in millions of RON (national currency of Romania); 2 Values in millions of EURO. Source: Processed by the authors.
Table 5.
Correlation matrix.
| Variables | Logarithm of EVA | Logarithm of Ic_a | ROA | Logarithm of FA | Rfa | LI |
|---|---|---|---|---|---|---|
| Logarithm of EVA | 1.000 | |||||
| Logarithm of Ic_a | 0.974 (0.000) | 1.000 | ||||
| ROA | 0.577 (0.012) | 0.598 (0.008) | 1.000 | |||
| Logarithm of FA | 0.976 (0.000) | 0.997 (0.000) | 0.590 (0.009) | 1.000 | ||
| Rfa | 0.322 (0.191) | 0.341 (0.165) | 0.892 (0.000) | 0.324 (0.189) | 1.000 | |
| LI | 0.353 (0.150) | 0.296 (0.232) | −0.410 (0.085) | 0.312 (0.207) | −0.604 (0.007) | 1.000 |
Note: probability in parenthesis. Source: Processed by the authors.
Table 6.
Regression analysis.
| Model 1 | Model 2 | |
|---|---|---|
| Intercept | −4.171 *** (0.801) | −3.581 *** (0.664) |
| Logarithm of Ic_a | 0.997 *** (0.089) | - |
| ROA | 0.077 * (0.041) | - |
| Logarithm of FA | - | 0.986 *** (0.070) |
| Rfa | - | 0.057 (0.035) |
| LI | 0.036 (0.023) | 0.035 (0.024) |
| R-squared | 0.959 | 0.961 |
| Adjusted R-squared | 0.950 | 0.953 |
| F-statistic | 110.73 *** | 117.58 *** |
Note 1: Standard error in parenthesis; Note 2: * and *** represents significant values at 1% and 10%. Source: Processed by the authors.
Table 7.
Compound Annual Growth Rate.
| Indicators | CAGR [%] | Indicators | CAGR [%] | Indicators | CAGR [%] |
|---|---|---|---|---|---|
| S | 5.60 | Oc | 6.73 | %Oc | 0.51 |
| Oe | 5.39 | Ec | 3.01 | %Ec | −3.06 |
| GOP | 14.09 | Ac | 8.61 | Coc | 7.80 |
| Cd | 2.43 | RDc | 7.06 | Cfd | −2.64 |
| Ac | 8.61 | Ae | 12.51 | WACC | 7.96 |
| RDc | 7.06 | Sh | −0.14 | Ic_a × WACC | 15.10 |
| Cit | 15.48 | Lg | −3.74 | Fixed assets | 3.46 |
| NOPat_a | 7.43 | Ic_a | 6.61 | EVA | 2.48 |
Source: Authors own calculation.
Publisher’s Note: MDPI stays neutral with regard to jurisdictional claims in published maps and institutional affiliations. |
© 2021 by the authors. Licensee MDPI, Basel, Switzerland. This article is an open access article distributed under the terms and conditions of the Creative Commons Attribution (CC BY) license (http://creativecommons.org/licenses/by/4.0/).
Share and Cite
MDPI and ACS Style
Tudose, M.B.; Rusu, V.D.; Avasilcai, S. Performance Management for Growth: A Framework Based on EVA. J. Risk Financial Manag. 2021, 14, 102. https://0-doi-org.brum.beds.ac.uk/10.3390/jrfm14030102
AMA Style
Tudose MB, Rusu VD, Avasilcai S. Performance Management for Growth: A Framework Based on EVA. Journal of Risk and Financial Management. 2021; 14(3):102. https://0-doi-org.brum.beds.ac.uk/10.3390/jrfm14030102
Chicago/Turabian StyleTudose, Mihaela Brindusa, Valentina Diana Rusu, and Silvia Avasilcai. 2021. "Performance Management for Growth: A Framework Based on EVA" Journal of Risk and Financial Management 14, no. 3: 102. https://0-doi-org.brum.beds.ac.uk/10.3390/jrfm14030102