
Tax Rates and Tax Revenues in the Context of Tax Competitiveness


Department of Finance, Faculty of Economics, Technical University of Košice, Boženy Němcovej 32, 040 01 Košice, Slovakia
*
Author to whom correspondence should be addressed.
J. Risk Financial Manag. 2021, 14(7), 284; https://0-doi-org.brum.beds.ac.uk/10.3390/jrfm14070284
Submission received: 22 May 2021
/
Revised: 16 June 2021
/
Accepted: 17 June 2021
/
Published: 22 June 2021
(This article belongs to the Special Issue Economic Forecasting)
Abstract
:The diverse tax burdens and economic situations of EU member states are causing investors to relocate their investments to countries that offer better tax conditions and a better economic environment. The total amount of corporate tax revenue is therefore influenced by tax, macroeconomic and other indicators. This paper assesses the importance of tax revenues and tax rates in the context of tax competitiveness in EU states. The aim of the paper is to determine the impact of selected indicators on corporate tax revenues in EU states for the period 2004 to 2019. The source data were drawn from the databases of the European Commission (2021) and The World Bank (2021). The set goal was complemented by an analysis of tax rates and subsequent comparison with corporate tax revenues. Multiple regression analysis was performed to achieve the goal. Two econometric models were compiled that followed the same variables, with the EU13 model dealing with the new member states and the EU15 model dealing with the old EU member states. The results showed that the variables statutory and average effective tax rate do not have a decisive influence on corporate tax revenues in either model. In the new states, the unemployment rate has the most statistically significant effect, while in the old countries GDP has the biggest effect. The result of this work is that there are differences between the new and old member states at different levels, which was ultimately reflected in the different impact of tax and macroeconomic indicators on corporate tax revenues.
1. Introduction
Gradual globalization can be attributed to the increasing interconnection of individual states and their economies. The rapid development of mutual interactions between states has created an environment for the emergence of tax competitiveness, through which states seek to attract foreign investment. Each state strives to create an attractive environment that would provide the macroeconomic and legislative environment, the economic situation, the workforce and the tax burden that would favor itself over another. States also want to achieve changes in the amount of tax revenues through individual government steps and legislative changes. The accession of new member states to the EU in 2004 caused an increase in tax competitiveness in EU states. In particular, the new member states strive for economic growth and an increase in GDP per capita through lower taxation, with which they lag behind the old member states. On the contrary, before the accession of new EU member states, this was different. The authors Garrett (1995), Rodrik (1998) and Swank (2001) examined the impact of globalization and found that there is not a sufficient degree of competitiveness between states. They have shown that globalization raises tax rates, it also deepens the tax burden and leads to lower corporate revenues.
The values of tax, macroeconomic and other indicators represent the condition of the state’s economy and affect tax competitiveness, thereby affecting the amount of corporate tax revenues in EU member states. The amount of income from corporate tax depends on the tax policy of both domestic and foreign states. In his study, Slemrod (2004) argued that the level of corporate tax revenues is also affected by foreign tax rates. Authors Dalton (2003) and Rosen and Gayer (2010) emphasized fiscal policy and argued that every government should conscientiously formulate tax policy. This should positively influence economic activity, lead to its growth and, at the same time, support healthy business, which would lead to the growth of tax revenues (Nerudová 2008; Bayer 2011; Remeur 2015). One of the main fiscal instruments is the statutory tax rate set by legislation by which governments strive to achieve balance, efficiency and fairness. The level of the tax rate significantly contributes to the location of the investment (Barrios et al. 2009), on which the resulting amount of tax revenues from corporations also depends. This discourages investors from placing capital in states with higher statutory tax rates, which results in a decline in companies’ net profits (Hines 2003). In the states concerned, the outflow of foreign investment caused by higher rates will be reflected in a decline in tax revenues. In addition to this rate, a comprehensive investor also focuses on the effective corporate rate. This rate more specifically expresses the tax burden in a given state, as it takes into account, inter alia, depreciation policy, the extent of tax relief and other factors.
When comprehensively monitoring changes in corporate tax revenues, it is important to focus not only on the impact of tax rates but also on the impact of macroeconomic indicators. Gropp and Kostial (2000) and Clausing (2007) addressed the impact of macroeconomic indicators on tax revenues. In their regression analyzes, they found that gross domestic product and foreign direct investment have a positive effect on corporate income. Conversely, higher unemployment in the country will reduce corporate incomes. The negative impact of unemployment on corporate income was also confirmed by Kubátová and Řihová (2009). The unemployment rate can be seen as an indicator of the efficiency and effectiveness of a state’s economy, as the government deficit combined with higher tax rates may lead to rising unemployment, which may be reflected in declining tax revenues (Fedeli and Forte 2012). Karpowicz and Majewska (2018) demonstrated the dependence of GDP on tax revenues. Kubátová and Řihová (2009) dealt with the influence of factors on the share of corporate income in GDP within OECD states. Among other things, the analysis found that GDP and inflation rate are statistically significant and have a positive effect on corporate revenues. Barro and Furman (2018) chose inflation and GDP as the factors in corporate income, reaffirming their positive impact. Previously, Gravelle (1994) had pointed to the increase in the tax burden, which is also caused by the rising rate of inflation. On the other hand, Lee and Gordon (2005) examined the impact of the tax indicator, namely the statutory corporate tax rate, on economic growth in the state. They found that it had a negative impact and that a 10% reduction in corporate tax would lead to a 1% increase in economic growth, which would ultimately increase corporate revenues. Tax competitiveness between states, including new and old EU member states, is of interest to investors. Teather (2005), Ganghof and Genschel (2008) and Guziejewska et al. (2015) found that the reduction of corporate taxes does not result in a decrease in tax revenues but rather an increase. At the same time, it evokes competitiveness among domestic companies as they strive to create and improve processes in companies (Glova and Mrázková 2018; Glova et al. 2018). A different conclusion was reached by Clausing (2007) who demonstrated a positive impact between tax rates and corporate tax revenues.
2. Materials and Methods
The aim of this paper was to verify the impact of selected tax rates and macroeconomic indicators on corporate tax revenues in 28 EU states. The states were divided into new and old EU member states. By analysis, we wanted to find out whether incomes in the new and old member states are affected by the same variables or if there are differences. The first part of the research focused on the analysis of tax rates and corporate tax revenues. In the second part, two econometric models were compiled, where the impact of selected indicators on corporate tax revenues was tested with the help of regression analysis.
The following hypotheses were established to confirm the goal:
Hypothesis 1 (H1).
The change in the amount of the statutory tax rate affects the tax competitiveness, which affects the amount of income from corporate tax.
Hypothesis 2 (H2).
Tax rates are the most important variables affecting corporate tax revenues.
The basis for the analysis is the annual data of 28 EU member states for the period from 2004 to 2019. A large number of states joined the EU in 2004, and for this reason we are dividing the EU states into new and old member states. The 13 new member states are Bulgaria, the Czech Republic, Estonia, Croatia, Cyprus, Latvia, Lithuania, Hungary, Malta, Poland, Romania, Slovenia and Slovakia. The 15 old member states include Belgium, Denmark, Germany, Ireland, Greece, Spain, France, Italy, Luxembourg, the Netherlands, Austria, Portugal, Finland, Sweden and the United Kingdom. We determined the year 2004 as the beginning of the monitored period due to the accession of new member states to the EU. Based on available data, 2019 represents the end of the period under review. The paper included data on the statutory tax rate (STR), average effective tax rate (EATR), gross domestic product (GDP) and corporate tax revenue (CIT) drawn from the European Commission’s database (2021). Data on net foreign direct investment expressed as % of GDP (FDI), inflation rate (INF) and unemployment rate (UN) were obtained from the World Bank website (2021). Multiple linear regression analysis, which determined the impact between the observed variables, was performed using the econometric program R.
The choice of indicators was conditioned by authors such as Gropp and Kostial (2000); Lee and Gordon (2005); Clausing (2007); Kubátová and Řihová (2009); Bayer (2011); Castro and Camarillo (2014); Karpowicz and Majewska (2018); Barro and Furman (2018), who analyzed the impact of various indicators on corporate tax revenues. At the same time, they claim that corporate tax revenues are affected both by the level of the statutory and effective tax rate and by macroeconomic indicators affecting the investment environment.
Changes in corporate tax revenues are affected by the size of the tax burden, which can be measured and monitored using tax rates. Based on this, an analysis of the statutory and average effective tax rate on corporations and corporate tax revenues for the period 2004 to 2019 was performed. Subsequently, these were compared, to find out out how changes in tax rates affect corporate tax income.
Using multiple linear regression analysis, we compiled two econometric models that determined the dependence and impact of selected tax rates (statutory tax rate, average effective tax rate) and macroeconomic indicators (gross domestic product, foreign direct investment, inflation rate and unemployment rate) on corporate tax revenues. The values in both models are expressed as an arithmetic mean, with the first model, which we call Model EU13, representing the 13 new EU member states and the second model, which we call Model EU15, representing the 15 old EU member states. The reason for the division of member states is the different rate of taxation, the value of indicators, as well as the different amount of corporate income between new and old states. Additionally, by dividing the states, we wanted to find out how the same variables that are included in the models affect the amount of corporate tax revenues.
The relationship of multiple linear regression was used to compile both models
The created econometric model corresponds to relation (1), the shape of which is the basis for both models, namely Model EU13 and Model EU15
In both models, the dependent variable is explained:
- —average corporate tax revenues of member states in year .
The explanatory independent variables in the models are:
- —average statutory tax rate of member states in year ,
- —average effective average tax rate of member states in year ,
- —average gross domestic product of member states in year ,
- —average foreign direct investment of member states in year ,
- —average inflation rate of member states in year ,
- —average unemployment rate of member states in year .
Other variables in the models are:
- —level constant,
- —regression coefficients, i.e., model parameters that express the value of the change of the explanatory variable to the explained variable ,
- —random model error, i.e., a random variable that captures other influences that may affect the explanatory variable .
The assembled models were tested for the presence of residue normality, heteroskedasticity and autocorrelation. By testing and meeting the given assumptions, we can say that the models showed the correct results.
The Shapiro–Wilk test was used to test the normality of the residues. At the level of significance α = 0.05, the hypotheses were tested:
Hypothesis 3 (H3).
residue distribution was normal,
Hypothesis 4 (H4).
residue distribution was not normal.
If the resulting p-value is greater than the specified level of significance, then we do not reject hypothesis H3 and the model meets the assumption of residual normality.
Using the Breusch–Pagan test, the presence of heteroskedasticity in models where hypotheses were tested at the level of significance α = 0.05:
Hypothesis 5 (H5).
no heteroskedasticity present,
Hypothesis 6 (H6).
heteroskedasticity present.
We do not reject hypothesis H5 if the resulting p-value is greater than the determined level of significance, which indicates the presence of homoskedasticity in the model.
The presence of autocorrelation was tested by the Breusch–Godfrey test, where hypotheses were tested at the level of significance α = 0.05:
Hypothesis 7 (H7).
no autocorrelation present,
Hypothesis 8 (H8).
autocorrelation present.
If the resulting p-value is greater than the specified level of significance, then we do not reject hypothesis H7 and no autocorrelation is present in the model.
Table 1 summarizes the expected impact of the independent variables included in the models on corporate tax revenues in the new and old EU Member States.
3. Results and Discussion
3.1. Analysis and Comparison of Tax Indicators and Corporate Tax Revenues
The size of corporate tax revenues depends on the government decisions of individual states as well as the economic situation. Individual EU member states will reduce the tax burden through legislative changes, thus trying to attract foreign investors to the state. We can monitor and compare the tax burden in the state with the help of tax rates, namely the statutory tax rate and the average effective corporate tax rate.
Table A1, showing the values of the statutory and average effective tax rate, and the corporate tax revenues in EU states, is compiled on the basis of data obtained from the European Commission database (2021) and is part of the appendix (Appendix A). Significant differences in tax rates are visible between EU member states (Table A1), despite efforts to harmonize and integrate them. The different tax burdens between states and their annual reductions demonstrate the emergence of tax competitiveness. The value of the statutory corporate tax rate in 2004 ranged from 10% in Cyprus to 38.3% in Germany. The lowest rates, up to 26%, were reported by almost all new member states, with the exception of the Czech Republic and Malta. States maintained low rates in 2019. The interval in 2019 ranged from 10% in Bulgaria to 35% in Malta. If we compare the years 2004 and 2019, a decrease in statutory tax rates was observed in most states. The most significant decrease was in the United Kingdom, by 11% from 30% to 19%. Spain reduced rates by 10%, from 35% to 25%, due to tax reforms to reduce the tax burden on both legal and natural persons. Spain also uses a 15% statutory tax rate to attract foreign capital and foreign companies during the first two years of business. By contrast, the smallest decrease of 2% was in Croatia, from 20% to 18%m and in France by 1%, from 35.4% to 34.4%. In Ireland, Malta and Poland, the rate did not change for the entire reference period 2004–2019. In four states, namely Cyprus, Latvia, Portugal and Slovakia, an increase was recorded. If we compare the old and new member states, then in the new states the average value of the statutory tax rate for the whole period was lower, namely 18.8%, which represents their greater effort for tax competitiveness. In contrast, in the old member states, the value was 27.5%. However, when comparing the average values of 2004 and 2019, there was a larger decrease of 6.3%, from 31.4% to 25.1%, in the old states compared to the new member states where the decrease was 3%, from 21.1% to 18.1%. The reduction of statutory rates in the old member states indicates their efforts to reduce the tax burden and their manifestation of tax competitiveness, which began to be demonstrated with the accession of new member states to the EU in 2004 (Teather 2005).
The statutory tax rate set by legislation does not provide a real view of the real tax burden. Investors are also interested in other variables such as the scope of tax breaks, various benefits and tax incentives, as well as depreciation policy. Therefore, an analysis of the statutory tax rate is not enough for a comprehensive assessment of the tax burden. According to Kenny and Winner (2006), the above-mentioned variables, including the average effective tax rate, which more clearly represents the core of taxation and the consequent impact on the corporate tax revenues of EU member states, must also be taken into account.
The average effective tax rate, which takes into account the structure of the tax base (Table A1), is lower than the statutory tax rate for the period under review, with the exception of four states, namely Ireland, Spain, Cyprus and Hungary. The reason for the discrepancy in the level of rates is the different tax policy of the states. In 2004, average effective tax rates ranged from 12.7% in Latvia to 36.5% in Spain. The lowest values, ranging from 12.7% to 14.8%, were in Ireland, Cyprus, Latvia and Lithuania, with only Ireland among the old member states. On the other hand, in 2019 there was a clear decrease in average effective rates compared to 2004. The effective rate in 2019 ranged from 9% in Bulgaria to 33.4% in France. A comparison of the average effective tax rates in 2004 and 2019 revealed a clear decline in most states. As in the case of the statutory rate, the most significant decrease was in the United Kingdom, in this case a decrease of 9.1% from 29.3% to 20.2%. The exceptions were Latvia and Slovakia, where an increase was observed. In Latvia, the average effective rate increased by 2.4% and in Slovakia by 2.2%. The only unchanged average effective rate was 12.7% in Lithuania, although it had changed over the period. As with the statutory rate and the average effective tax rate, the average value for the whole period was higher in the old member states, namely 25.3%, compared to the new member states, where it reached 16.8%.
Despite the efforts of the old member states to reduce the tax burden, the average value of statutory tax rates in the new member states remains significantly lower, at 18.8%, compared to the average rates of 27.5% in the old member states. The results show that the member states reduced their statutory tax rates in the period under review, and the decrease also occurred at the average effective tax rate, calculated by adjusting the tax base. If we assumed that only the level of tax rates reflects tax competitiveness, then we could, on the basis of an analysis, claim that the new member states are more competitive than the old states. According to Výškrabka and Antalicová (2018) and Candau and Cacheux (2018), the decision of investors depends, among other indicators, on the average effective rate from corporations, and its lower value may be decisive. Mutual competition between countries leads to a lower tax burden that may be more attractive to the investor and cause a greater inflow of capital into the state, which affects the change in tax revenues. In addition, this helps sustain economic growth (Teather 2005). Guziejewska et al. (2015) suggested that states with an unstable economic situation, which do not have the opportunity to compete in terms of innovative technologies, economies or labor productivity, must secure fiscal sovereignty. Reducing corporate taxes could secure this and increase their tax competitiveness.
The governments of individual EU member states apply their own tax management. On this basis, the level of statutory tax rates as well as the level of average effective tax rates varies between member states, which is also reflected in the level of tax revenues. The corporate tax revenues (Table A1) at the beginning of the observed period in 2004 ranged from EUR 161.19 million in Estonia up to EUR 57,159.7 million in the United Kingdom. In the compared year 2019, the interval of corporate revenues was from EUR 47.69 million in Latvia up to EUR 93,586 million in Germany. In both years, 2004 and 2019, the new member states were in the lower interval of corporate tax revenues, while the upper interval was represented by the old EU member states. Almost all EU member states had seen an increase in corporate tax revenues. The average values of tax revenues of the new member states increased from EUR 1220.03 million in 2004 to the value of EUR 2711.47 million in 2019. The average revenues in the old member states also increased from the value of EUR 18,199.09 million in 2004 to EUR 26,519.50 for the year 2019. A decrease in corporate tax revenues was observed in Hungary and Latvia, which are ranked among the new member states and in two old member states, namely Greece and Spain. In Spain, there was a decline in revenues in 2019 compared with 2004, but over the period under review, there was an annual increase in corporate revenues, with the exception of the period of economic crisis, which affected their overall amount. In Greece, both the level of tax rates and the level of corporate tax revenues fluctuated over the period under review. The sharpest decline was from 2011 to 2012, but with an unchanged statutory tax rate of 20% and an average effective tax rate of 17.5%. Greece introduced various tax reforms in the period under review to improve the state’s economic situation. Hungary has maintained its tax competitiveness in recent years due to its low tax burden, and yet corporate revenues fluctuate from year to year. In the period under review, Latvia recorded the most significant decline in corporate tax revenues in 2019 compared to the previous year. Revenue decreased by EUR 259.9 million, from EUR 307.59 million to EUR 47.69 million. The reason for the extreme decline was the legislative change in corporate income tax in 2018, on the basis of which a 0% tax rate was applied to re-invested profit. The 20% rate continued to be levied on redistributed profits in the payment of dividends or by non-resident companies. Since this change, Latvia has been one of the states with the highest level of economic freedom. The change in the tax system also attracted foreign capital, as evidenced by the increase in foreign direct investment at 3.11% in 2019 compared to 1.25% in 2018. From the average values of corporate income for the period 2004 to 2019, it is clear that the new member states achieved a significantly lower value of income, namely EUR 2002.38 million compared to the old member states with a value of EUR 22,106.31 million.
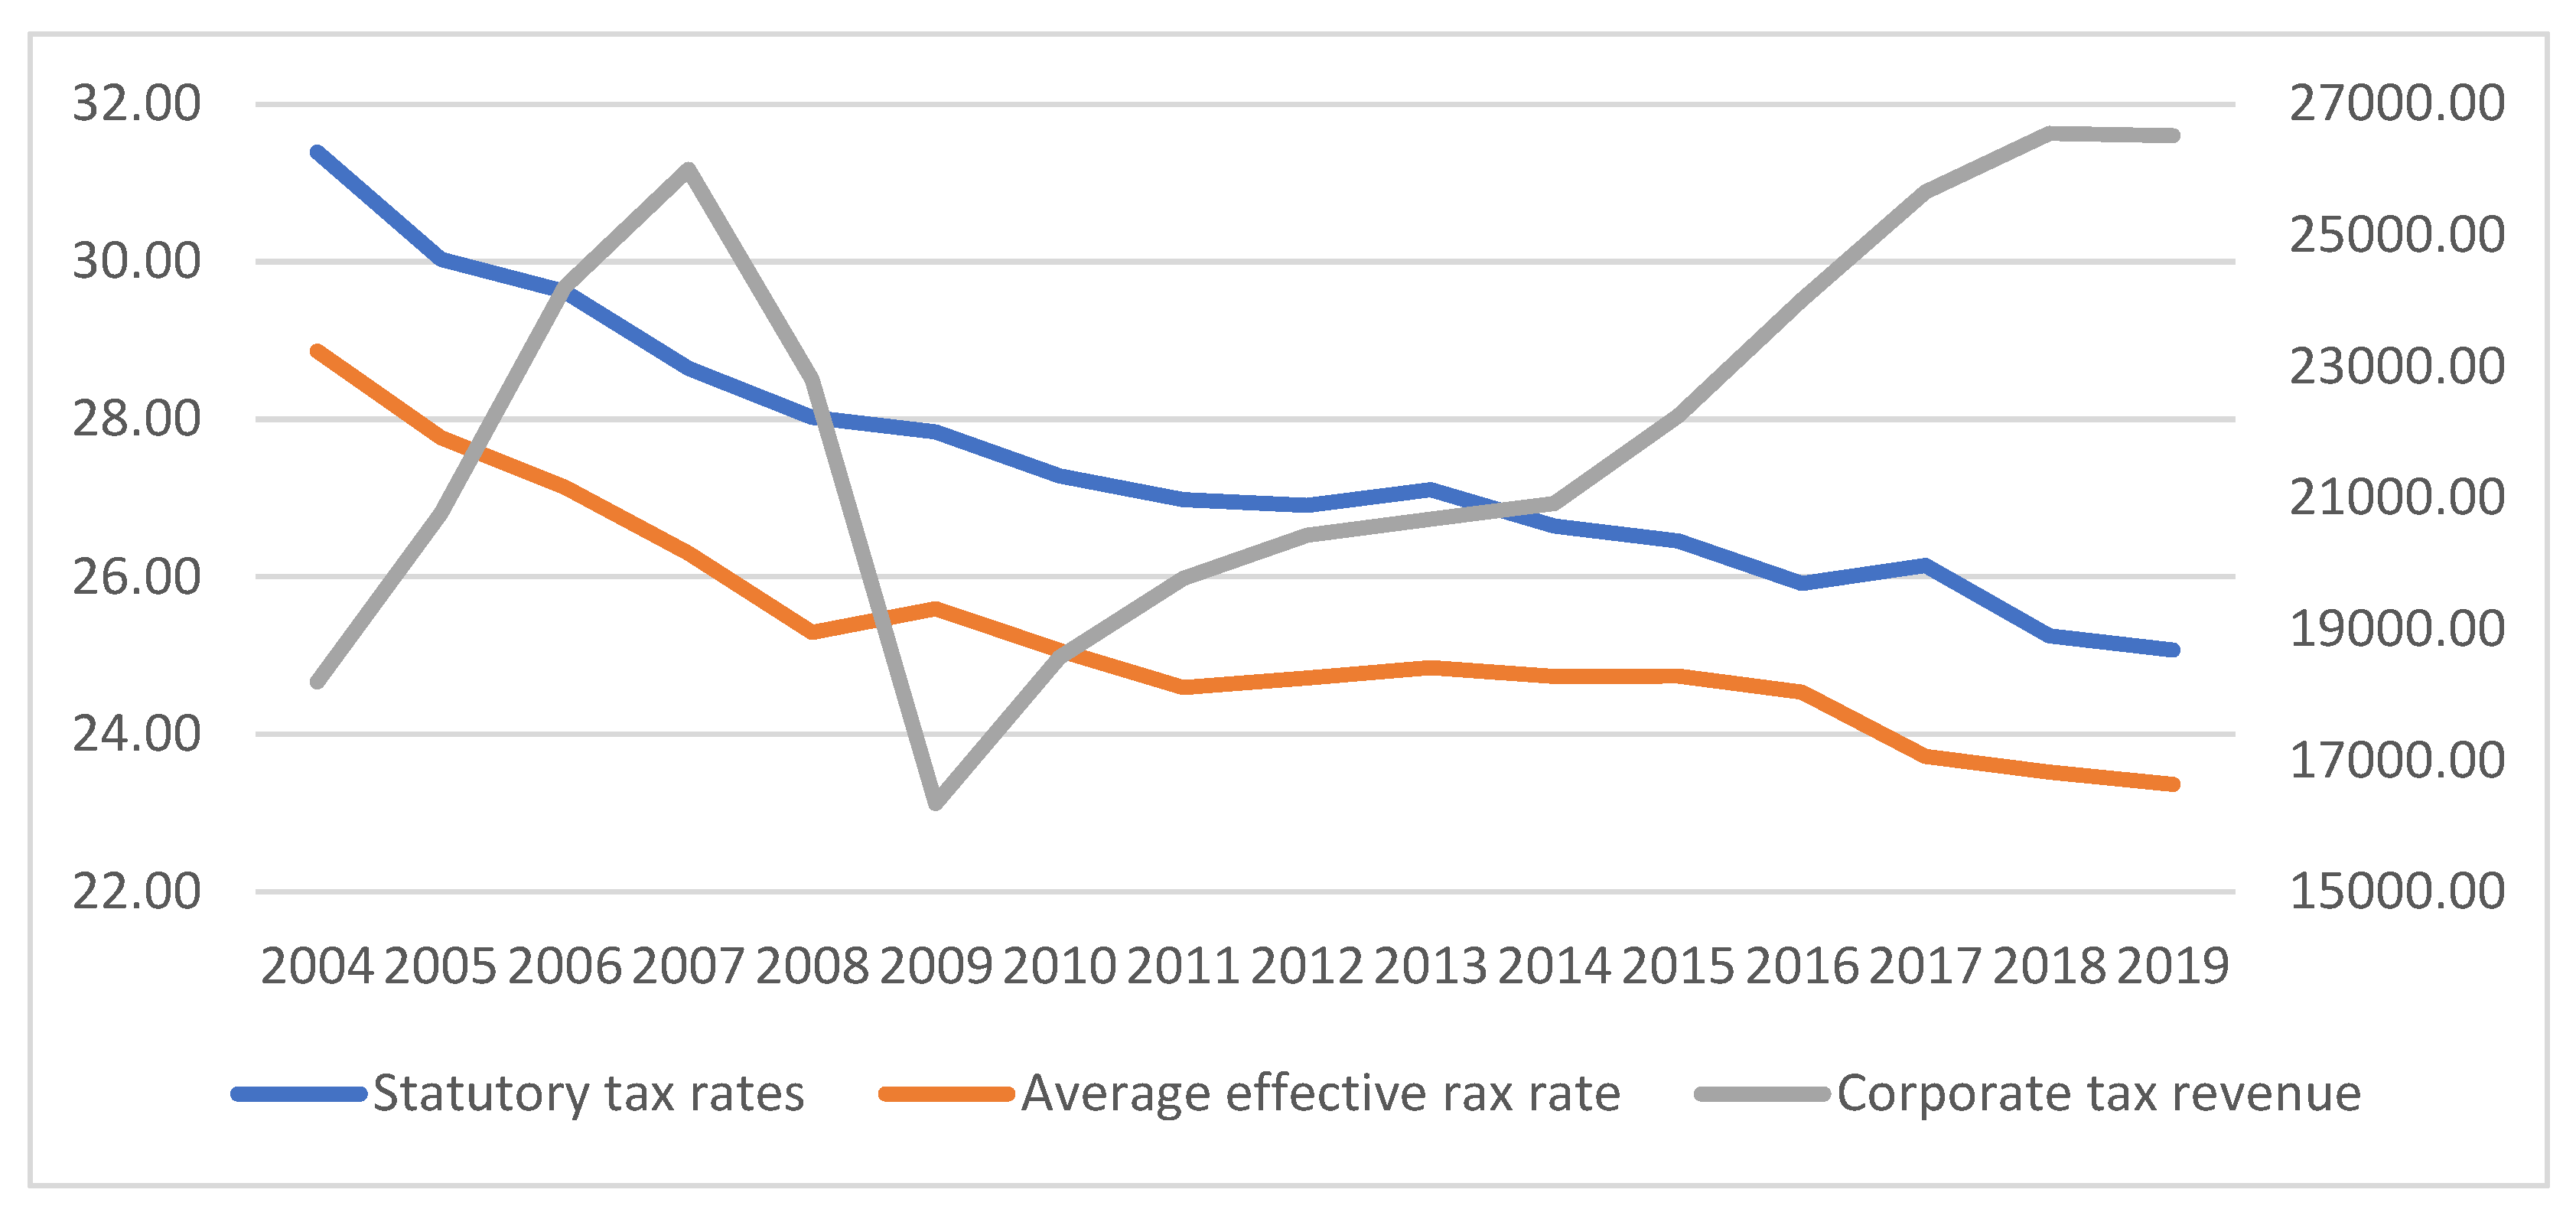
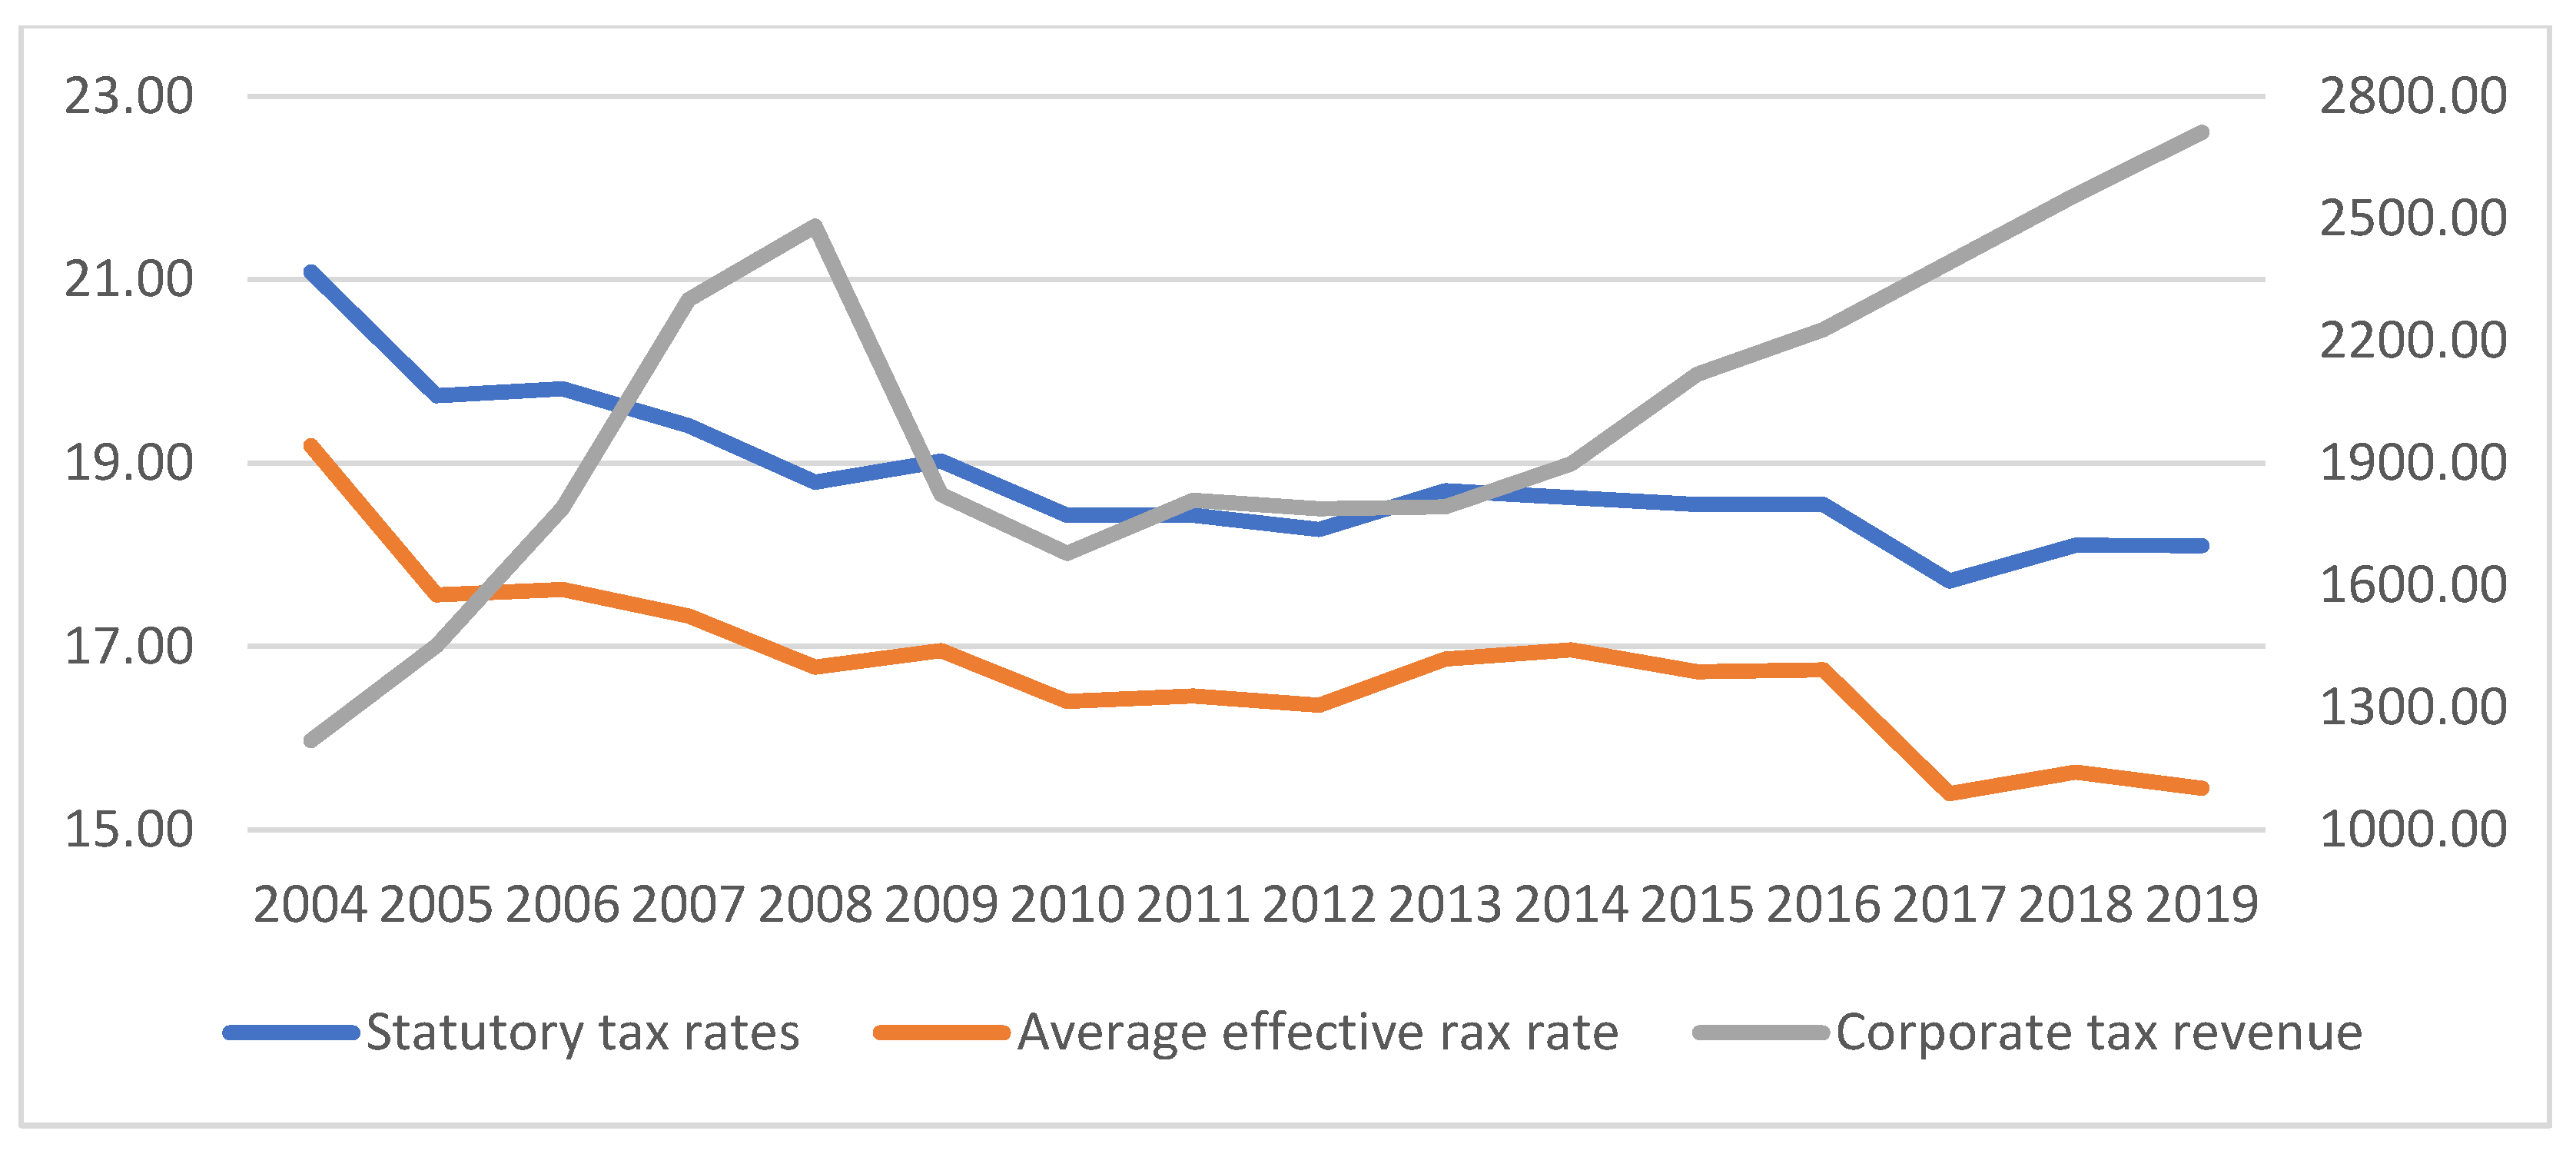
Figure 1 and Figure 2 show the development of the average values of tax indicators and corporate tax revenues in the division of states into new and old member states in the observed period from 2004 to 2019. Average values of statutory tax rates and average effective tax rates saw a relatively declining development in the observed period. The new member states recorded a smaller decrease of 3% in average statutory rates from 2004 to 2019 compared to the old member states, who reduced rates by 6.3%. However, the new member states maintain a lower level of value for both statutory and average effective rates. The decline in rates affected corporate tax revenues by an upward trend until the financial crisis. A significant decline in tax revenues occurred during the economic crisis between 2007 and 2009 in the old member states. In the new member states, a slower growth rate of tax revenues of 20.7% was observed between 2007 and 2008, while from 2008 to 2010 a sharper decline was observed. The increase in corporate tax revenues occurred again in the post-crisis period. The years 2012 and 2013 were marked by a slowdown in the growth rate of average tax revenues in the member states. In the two new member states, Cyprus and Slovakia, tax rates increased during this period, while in Slovenia they reduced the rate and in other states the tax rate remained unchanged. Additionally, in the old member states such as Greece, France, Portugal and Luxembourg, tax rates rose and in Finland, Sweden and the United Kingdom they fell. The remaining old member states did not change the rates. After these years, there was an increase in average income until the end of the period under review.
The analysis and subsequent comparison of tax rates and corporate tax revenues showed differences between new and old EU member states. It is clear from the analysis that, in addition to tax rates, the amount of corporate tax revenues is also affected by other indicators that entered and influenced the economic environment in the states during the period under review. The governments of the EU member states introduced various tax reforms during the period under review, which sought to improve the situation in the state by applying lower tax rates to reduce the tax burden or by adjusting the level of the corporate tax base. States sought to be more competitive than others in the field of taxation in order to attract new foreign investment to the state, which would increase the state’s capital, create new jobs and reduce unemployment, thereby resulting in rising GDP as well as growth of corporate tax revenues.
3.2. Regression Analysis
Using regression analysis, we wanted to demonstrate the impact of selected tax rates and macroeconomic indicators on corporate tax revenues. The values of the indicators contained in Table 2 are the result of empirical modeling in the program R. Table 2 shows that the compiled models, namely Model EU13 for the new EU member states and Model EU15 for the old EU member states, can be considered appropriate because they have been tested and meet the assumptions. Residues are from the normal distribution because the p-value is higher than the significance level α = 0.05. Heteroskedasticity is not confirmed because homoskedasticity is present in both models, where the p-value is higher than the significance level α = 0.05. The last test for autocorrelation showed its absence, because the p-value in both models is higher than the significance level α = 0.05. We can also consider both models as statistically significant, as evidenced by the p-value for the model, which is lower than the specified level of significance α = 0.05. At the same time, both models show a high % coefficient of determination. Model EU13 describes a higher degree of variability of the dependent variable, namely 98.13%. On the other hand, Model EU15 explains a lower degree of variability with a value of 90.78% of the dependent variable.
We included selected tax rates and macroeconomic indicators directly affecting corporate tax revenues in both models. These variables also affect the investment climate and the corporate sector. The expected effect, which we determined in Table 1, was confirmed for almost all variables in both models. The only exception was the variable statutory tax rate in Model EU13, the increase in which caused a decrease in corporate tax revenues in the new member states. This result differed from the results of Clausing (2007), which showed a positive effect of the statutory tax rate.
Model EU13 represents the impact of selected variables on corporate tax revenues in the new EU member states. Based on the p-values, which are lower for all variables than the specified level of significance α = 0.05, we can say that all variables in the model are statistically significant. The unemployment rate with a value of 2.27 × 10⁻⁵ p-value represents the most statistically significant variable. The estimated regression coefficient with the value −128.921 speaks of a negative effect on corporate tax income. The coefficient expresses that if the unemployment rate increases by 1%, the income from corporate tax will decrease by EUR 128.921 million. The resulting negative impact of the unemployment rate on corporate income is also confirmed by Clausing (2007) and Kubátová and Řihová (2009) with their regression analysis. According to Tosun (2006), the negative impact is caused by an aging population and a consequent decline in the economically active workforce, which is reflected in tax revenues. The statutory tax rate on corporations, whose regression coefficient acquired −472.974, also has a negative impact. This means that if the statutory tax rate increases by 1%, corporate income will fall by EUR 472.974 million. At the same time, the statutory rate is statistically significant with a p-value of 0.00167. This negative impact is confirmed by the findings of Lee and Gordon (2005), Ganghof and Genschel (2008) and Guziejewska et al. (2015). Clausing (2007) included the statutory and average effective tax rate in his regression model, where the result showed a positive effect on tax revenues for both variables. The remaining variables in Model EU13 have a positive effect on corporate tax revenue. The regression coefficient , with a value of 400.08, represents the average effective tax rate. This coefficient expresses that if the average effective rate increases by 1%, the income from corporate tax will increase by EUR 400.08 million. At the same time, statistical significance is confirmed by a p-value of 0.00107. The gross domestic product variable reached statistical significance with a p-value of 0.00660. The result of the regression coefficient is the finding that an increase in GDP by EUR 1 billion will cause an increase in corporate income by EUR 13.194 million. Our result is consistent with the statement made by Bayer (2011), who concluded that there is a positive relationship between GDP and corporate income. Another variable foreign direct investment with a value of the regression coefficient 4.575 is statistically significant at the level with a p-value of 0.04319. From this we can conclude that an increase in FDI by 1% will cause an increase in corporate tax revenue by EUR 4.575 million. The positive effect, as well as the statistical significance of FDI, are confirmed by Gropp and Kostial (2000). Foreign direct investment is the basis for additional capital; this increases corporate tax revenues in each state, which is why governments draw attention to it (Johansson et al. 2008). It is the new member states that are seeking to attract foreign investment through lower tax rates, the growth of which is causing an increase in tax revenues (Abbas and Klemm 2012). Similar to the already mentioned variables, the positive impact on corporate tax revenues with a value of the coefficient 28.331 was confirmed. It follows that an increase in the inflation rate by 1% will cause an increase in corporate revenues by EUR 28,331 million. Statistical significance reaches the p-value of 0.02414. The positive impact of GDP growth and inflation on corporate tax revenues came out in line with the statement of Kubátová and Řihová (2009). Rising GDP levels increase output, which has an impact on rising inflation and has a positive effect on the corporate sector and thus on corporate revenues (Barro and Furman 2018).
On the other hand, Model EU15 analyzes the impact of selected tax and macroeconomic variables on corporate tax revenues in the old EU member states. Statistical significance (Table 2) was confirmed only for the GDP variable, which reached a p-value of 0.000428. At the same time, the regression coefficient with a value of 62.35 represents a positive effect, which coincides with the results of Clausing (2007) and Karpowicz and Majewska (2018). This means that an increase in GDP by EUR 1 billion will cause an increase in corporate tax revenue by EUR 62.35 million. Castro and Camarillo (2014) also identify with a positive impact. The authors paid attention to the maturity of states and the relationship between GDP and corporate income. They demonstrated their positive interdependence, finding that GDP growth was positively affected by corporate earnings growth. Variables such as foreign direct investment, inflation and unemployment were just above statistical significance. The level of regression coefficients 208.15 for FDI and the level of coefficient 949.31 for INF represent that the variables have a positive effect on corporate income. This means that an increase in foreign direct investment by 1% will cause an increase in corporate revenues by EUR 208.15 million. An increase of 1% in the inflation rate will cause an increase in revenue of EUR 949.31 million. On the other hand, the negative impact on corporate tax revenues was confirmed by the unemployment rate. The regression coefficient reached the value −603.11. On the other hand, the variables statutory tax rate with a p-value of 0.493491 and the average effective rate with a p-value of 0.887021 came out as statistically insignificant. Kawano and Slemrod (2012) also found the statistical insignificance of the relationship between tax rates and corporate tax revenues. In the case of statistical significance, both variables would have a positive effect on corporate income based on regression coefficients. As a result, if the statutory rate was increased by 1%, there would be an increase in corporate tax revenues by EUR 1198.23 million and with an increase in the average effective tax rate by 1%, there would be an increase in corporate tax revenues by EUR 237.22 million.
Despite the fact that the new member states joined the old member states 16 years ago, inconsistencies in economic governance persist between them. Through regression analysis, we found that there is a certain dependence between selected indicators and corporate tax revenues. By comparing both models, we found the statistical significance of all variables only for Model EU13, which represented the new member states. In Model EU15, which depicted the old member states, statistical significance was demonstrated for only one variable, namely GDP, the size of which affects corporate revenues. Other variables in the model have a relatively insignificant effect on corporate income and are insignificant in their assessment. The significant differences in the results of both models testify to the existence of both tax competitiveness and differences in the economies of states. The old member states have tried to reduce statutory tax rates over the years, but their level is still high compared to the new ones. The greater effort for tax competitiveness on the part of the new member states is reflected precisely in the growth of tax revenues from corporations through the reduction of rates, which increase the state’s attractiveness to attract foreign investment. New investors create more jobs, which reduces the unemployment rate, resulting in an increase in gross domestic product in the state.
Following the paper, further research could be extended to microeconomic indicators, which would analyze and compare the impact of macroeconomic and microeconomic indicators on corporate tax revenues in new and old EU member states.
4. Conclusions
The presented paper points out the importance of tax revenues and tax rates in the context of tax competitiveness of EU member states. The level of income from corporate tax also depends on tax preferences. In 2004, many states joined the EU, which, with the help of a low level of tax burden, began to maintain tax sovereignty, thus beginning to show tax competitiveness between the new and old EU member states. The new member states are trying to attract foreign investment to the state with a lower level of taxation, as evidenced by the analysis we performed for the period 2004 to 2019. By comparing statutory and effective average tax rates with corporate tax revenues, we found that member states reduce tax rates. The tax burden is visibly lower in the new member states than in the old member states. The reduction of tax rates in most states did not result in a decrease in tax revenues, but on the contrary their increase. The analysis confirmed hypothesis H1, namely that the change in the statutory tax rate affects tax competitiveness, thereby affecting the amount of income from corporate tax.
The aim of the paper was to determine the impact of selected tax rates and macroeconomic indicators on corporate tax revenues. Each selected variable in the model represents an individual indicator that develops during the period. By a reverse analysis, we found that the variables directly affect the monitored corporate tax revenues. Two econometric models were compiled that followed the same variables, but with the division of countries into 13 new and 15 old EU member states. The results showed that the statutory and average effective tax rate is statistically significant only in the model including the new EU member states. At the same time, the average effective tax rate is statistically more significant, the increase of which will cause an increase in corporate revenues by EUR 400.08 million. Tax rates are not the most significant variable affecting corporate tax revenues, which did not confirm the established hypothesis H2, namely that tax rates are the most important variables affecting corporate tax revenues. Variables differed between the new and old member states with a decisive effect on corporate tax revenue. In the new member states, the unemployment rate has a decisive influence, an increase of 1% will cause a decrease in corporate income by EUR 128.921 million. On the other hand, in the old member states, only one indicator has a statistically significant effect, namely GDP, whose growth by EUR 1 billion will cause an increase in corporate tax revenues by EUR 62.35 million. In conclusion, the paper states that the impact of selected tax rates and macroeconomic indicators on corporate tax revenues varies significantly between new and old member states because it depends on the specific conditions of government decisions in a particular state. We propose to expand this research with microeconomic indicators, such as size, indebtedness, capital intensity, or to introduce longer time series, which may provide better reporting.
Author Contributions
Conceptualization, M.H. and A.A.; Formal analysis, M.H.; Funding acquisition, A.A.; Methodol-ogy, M.H. and A.A.; Resources, M.H.; Software, M.H.; Supervision, A.A.; Visualization, M.H.; Writing—original draft, M.H.; Writing—review & editing, A.A. Both authors have read and agreed to the published version of the manuscript.
Funding
This research was funded by the project VEGA “Analysis of Economic Perspectives of Industry 4.0 in Terms of the Impact of Intangibles on the Profitability and Market Value of Industrial Companies” from Slovak Grant Agency of the Ministry of Education of the Slovak Republic, and Slovak Academy of Sciences (VEGA), project No. 1/0673/21.
Institutional Review Board Statement
Not applicable.
Informed Consent Statement
Not applicable.
Conflicts of Interest
The authors declare no conflict of interest. The funders had no role in the design of the study; in the collection, analyses, or interpretation of data; in the writing of the manuscript, or in the decision to publish the results.
Appendix A

Table A1.
Values of statutory, average effective tax rate and corporate tax revenues in EU states.
| Country | Statutory Tax Rate (%) | Average Effective Tax Rate (%) | Corporate Tax Revenues (in EUR million) | ||||||
|---|---|---|---|---|---|---|---|---|---|
| 2004 | 2019 | Average 2004–2019 | 2004 | 2019 | Average 2004–2019 | 2004 | 2019 | Average 2004–2019 | |
| Belgium | 34.0 | 29.6 | 33.4 | 29.5 | 25.0 | 26.6 | 8985.90 | 17,684.50 | 12,607.73 |
| Bulgaria | 19.5 | 10.0 | 11.2 | 17.1 | 9.0 | 10.0 | 519.35 | 1212.25 | 901.71 |
| Czechia | 28.0 | 19.0 | 20.8 | 24.6 | 16.7 | 18.3 | 4034.52 | 7384.22 | 5663.25 |
| Denmark | 30.0 | 22.0 | 24.8 | 26.8 | 19.8 | 22.3 | 5879.85 | 9549.32 | 7193.90 |
| Germany | 38.3 | 29.9 | 31.9 | 35.8 | 28.9 | 30.2 | 46,067.00 | 93,586.00 | 68,795.81 |
| Estonia | 26.0 | 20.0 | 21.4 | 20.4 | 13.9 | 16.7 | 161.19 | 509.10 | 300.53 |
| Ireland | 12.5 | 12.5 | 12.5 | 14.3 | 14.1 | 14.3 | 5487.78 | 11,000.00 | 6184.54 |
| Greece | 35.0 | 28.0 | 28.2 | 30.4 | 26.6 | 24.9 | 5259.00 | 4071.00 | 4439.13 |
| Spain | 35.0 | 25.0 | 29.7 | 36.5 | 30.1 | 32.8 | 28,793.00 | 25,757.00 | 27,480.44 |
| France | 35.4 | 34.4 | 36.0 | 35.0 | 33.4 | 34.9 | 40,584.00 | 68,517.00 | 55,013.31 |
| Croatia | 20.0 | 18.0 | 19.6 | 18.1 | 14.8 | 16.3 | 611.97 | 1285.43 | 1020.89 |
| Italy | 37.3 | 27.8 | 32.2 | 31.8 | 24.6 | 26.8 | 33,149.00 | 34,708.00 | 37,853.13 |
| Cyprus | 10.0 | 12.5 | 11.1 | 14.8 | 13.4 | 12.4 | 468.10 | 1304.20 | 1050.17 |
| Latvia | 15.0 | 20.0 | 15.6 | 14.3 | 16.7 | 14.0 | 185.13 | 47.69 | 346.12 |
| Lithuania | 15.0 | 15.0 | 15.8 | 12.7 | 12.7 | 13.7 | 338.55 | 759.15 | 548.21 |
| Luxembourg | 30.4 | 24.9 | 28.7 | 26.5 | 21.8 | 25.1 | 1571.15 | 3761.12 | 2333.60 |
| Hungary | 17.6 | 10.8 | 18.3 | 17.8 | 11.1 | 17.3 | 1740.59 | 1728.47 | 1843.03 |
| Malta | 35.0 | 35.0 | 35.0 | 32.2 | 25.3 | 30.8 | 167.51 | 763.72 | 451.67 |
| Netherlands | 34.5 | 25.0 | 26.4 | 31.0 | 22.5 | 23.6 | 16,266.00 | 30,001.00 | 19,240.13 |
| Austria | 34.0 | 25.0 | 25.6 | 31.2 | 23.1 | 23.5 | 5607.00 | 10,983.76 | 7379.82 |
| Poland | 19.0 | 19.0 | 19.0 | 17.1 | 16.6 | 17.4 | 4003.71 | 11,775.64 | 7822.07 |
| Portugal | 27.5 | 31.5 | 29.1 | 24.6 | 21.4 | 24.9 | 4308.52 | 6662.13 | 5449.85 |
| Romania | 25.0 | 16.0 | 16.6 | 22.4 | 14.7 | 15.2 | 1934.93 | 4685.18 | 3258.50 |
| Slovenia | 25.0 | 19.0 | 20.3 | 21.5 | 17.3 | 18.3 | 522.89 | 953.54 | 715.14 |
| Slovakia | 19.0 | 21.0 | 20.2 | 16.5 | 18.7 | 17.9 | 1171.95 | 2840.53 | 2109.63 |
| Finland | 29.0 | 20.0 | 23.8 | 27.2 | 19.6 | 22.4 | 5357.00 | 6069.00 | 5206.50 |
| Sweden | 28.0 | 21.4 | 24.9 | 23.1 | 19.4 | 21.9 | 8511.45 | 14,169.19 | 11,705.26 |
| United Kingdom | 30.0 | 19.0 | 24.7 | 29.3 | 20.2 | 25.3 | 57,159.70 | 61,273.45 | 60,711.58 |
| Average EU-28 | 26.6 | 21.8 | 23.5 | 24.4 | 19.7 | 21.3 | 10,315.95 | 15,465.77 | 12,772.34 |
| Average EU-13 | 21.1 | 18.1 | 18.8 | 19.2 | 15.5 | 16.8 | 1220.03 | 2711.47 | 2002.38 |
| Average EU-15 | 31.4 | 25.1 | 27.5 | 28.9 | 23.4 | 25.3 | 18,199.09 | 26,519.50 | 22,106.31 |
Source: own processing according to European Commission (2021).
References
- Abbas, S. M. Ali, and Alexander Klemm. 2012. A Partial Race to the Bottom: Corporate Tax Developments in Emerging and Developing Economies. Washington, DC: International Monetary Fund. [Google Scholar]
- Barro, Robert J., and Jason Furman. 2018. Macroeconomic Effects of the 2017 Tax Reform. Brookings Papers on Economic Activity 49: 257–345. [Google Scholar] [CrossRef] [Green Version]
- Barrios, Salvador, Per Iversen, Magdalena Lewandowska, and Ralph Setzer. 2009. Determinants of intra-euro area government bond spreads during the financial crisis. In European Economy—Economic Papers. Brussels: European Commission, vol. 388, pp. 1–28. [Google Scholar] [CrossRef]
- Bayer, Ondřej. 2011. Vládní daňové predikce: Ex ante odhady expost hodnocení přesnosti v České Republice. Český Finanční a Účetní Časopis 6: 42–54. [Google Scholar] [CrossRef] [Green Version]
- Candau, Fabien, and Jacques Le Cacheux. 2018. Taming Tax Competition with a European Corporate Income Tax. Revue D’économie Politique 128: 575–611. [Google Scholar] [CrossRef]
- Castro, G. Ángeles, and D. B. Remírez Camarillo. 2014. Determinants of tax revenue in OECD countries over the period 2001–2011. Contaduría y Administración 59: 35–59. [Google Scholar] [CrossRef] [Green Version]
- Clausing, A. Kimberly. 2007. Corporate tax revenues in OECD countries. International Tax and Public Finance 14: 115–33. [Google Scholar] [CrossRef]
- Dalton, Hugh. 2003. Priciples of Public Finance, 1st ed. London: Routledge. [Google Scholar] [CrossRef]
- European Commission. 2021. Data on Taxation. Available online: https://ec.europa.eu/taxation_customs/business/economic-analysis-taxation/data-taxation_en (accessed on 3 March 2021).
- Fedeli, Silvia, and Francesco Forte. 2012. Public debt and unemployment growth: The need for fiscal and monetary rules. Evidence from OECD countries (1981–2009). Economia Politica 29: 409–38. [Google Scholar] [CrossRef]
- Ganghof, Steffen, and Philipp Genschel. 2008. Taxation and democracy in the EU. Journal of European Public Policy 15: 58–77. [Google Scholar] [CrossRef]
- Garrett, Geoffrey. 1995. Capital mobility, trade, and the domestic politics of economic policy. International Organization 49: 657–87. [Google Scholar] [CrossRef]
- Glova, Jozef, and Silvia Mrázková. 2018. Impact of Intangibles on Firm Value: An Empirical Evidence from European Public Companies. Ekonomický Časopis 66: 665–80. [Google Scholar]
- Glova, Jozef, Silvia Mrázková, and Darya Dancaková. 2018. Measurement of intangibles and knowledge: An empirical evidence. AD ALTA-Journal of Interdisciplinary Research 8: 76–80. [Google Scholar]
- Gravelle, G. Jane. 1994. The Economic Effects of Taxing Capital Income. Cambridge: MIT Press, 358p, ISBN 9780262071581. [Google Scholar]
- Gropp, Reint, and Kristina Kostial. 2000. The Disappearing Tax Base: Is Foreign Direct Investment(FDI) Eroding Corporate Income Taxes? IMF Working Paper. WP/00/173. Washington, DC: International Monetary Fund. [Google Scholar]
- Guziejewska, Beata, Wojciech Grabowski, and Szymon Bryndziak. 2015. Tax competition strategies in corporate income tax—The case of EU countries. Business and Economic Horizons 10: 253–71. [Google Scholar] [CrossRef] [Green Version]
- Hines, R. James. 2003. Sensible Tax Policies in Open Economies. Dublin. Journal of the Statistical and Social Inquiry Society of Ireland 33: 1–39. [Google Scholar]
- Johansson, Asa, Christopher Heady, Jens Arnold, Bert Brys, and Laura Varia. 2008. Taxation and economic growth. In OECD Economics Department. Working papers No. 620. Paris: OECD Publishing. [Google Scholar] [CrossRef]
- Karpowicz, Andrzej, and Elzbieta Majewska. 2018. Corporate Income Tax Determinants: How Important Is the Tax Rate? Paper presented at the 27th International Scientific Conference on Economic and Social Development, Rome, Italy, March 1. [Google Scholar]
- Kawano, Laura, and Joel Slemrod. 2012. The Effect of Tax Rates and Tax Bases on Corporate Tax Revenues: Estimates with New Measures of the Corporate Tax Base. NBER Working Paper 18440. Cambridge: National Bureau of Economic Research. [Google Scholar] [CrossRef]
- Kenny, W. Lawrence, and Stanley L. Winner. 2006. Tax Systems in the World: An Empirical Investigation Into the Importance of Tax Bases, Administration Costs, Scale and Political Regime. International Tax and Public Finance 13: 181–215. [Google Scholar] [CrossRef]
- Kubátová, Květa, and Lucie Řihová. 2009. Regresní analýza faktoru ovplyvňujícich výnosy korporativní daně v zemích OECD. Politická Ekonómie 4: 451–71. [Google Scholar] [CrossRef]
- Lee, Young, and Roger Gordon. 2005. Tax Structure and Economic Growth. Journal of Public Economics 89: 1027–43. [Google Scholar] [CrossRef]
- Nerudová, Danuše. 2008. Harmonizace Daňových Systémů Zemí EVROPSKÉ Unie. Praha: ASPI, 257p, ISBN 9788073573867. [Google Scholar]
- Remeur, Cécile. 2015. Tax Policy in the EU: Issues and Challenges. Luxembourg: EPRS|European Parliamentary Research Service. [Google Scholar] [CrossRef]
- Rodrik, Dani. 1998. Has Globalisation Gone Too Far? Challenge 41: 81–94. [Google Scholar] [CrossRef]
- Rosen, S. Harvey, and Ted Gayer. 2010. Public Finance. New York: The McGraw-Hill Companies. [Google Scholar]
- Slemrod, Joel. 2004. Are corporate tax rates, or countries, converging? Journal of Public Economics 88: 1169–86. [Google Scholar] [CrossRef]
- Swank, Duane. 2001. Mobile capital, democratic institutions, and the public economy in advanced industrial societies. Journal od Comparative Policy Analysis: Research and Practice 3: 133–62. [Google Scholar] [CrossRef]
- Teather, Richard. 2005. The Benefits of Tax Competition. London: The Institute of Economic Affairs, pp. 1–91. ISBN 0255365691. [Google Scholar]
- The World Bank. 2021. World Bank Open Data. Available online: https://data.worldbank.org/ (accessed on 8 March 2021).
- Tosun, Mehmet. 2006. Explaining the Variation in Tax Structures in the MENA Region. UNR Economics Working Paper. WP/06/018. Reno: University of Nevada. [Google Scholar]
- Výškrabka, Milan, and Jana Antalicová. 2018. Daňový report Slovenskej republiky. In Inštitút Finančnej Politiky. October. Available online: https://www.mfsr.sk/sk/financie/institut-financnej-politiky/publikacie-ifp/ekonomicke-analyzy/50-danovy-report-slovenskej-republiky-2018-oktober-2018-2.html (accessed on 15 March 2021).
Figure 1.
Average value of tax rates and corporate tax revenues in the old EU member states for the period from 2004 to 2019. Source: own processing according to European Commission (2021).
Figure 1.
Average value of tax rates and corporate tax revenues in the old EU member states for the period from 2004 to 2019. Source: own processing according to European Commission (2021).

Figure 2.
Average value of tax rates and corporate tax revenues in the new EU member states for the period from 2004 to 2019. Source: own processing according to European Commission (2021).
Figure 2.
Average value of tax rates and corporate tax revenues in the new EU member states for the period from 2004 to 2019. Source: own processing according to European Commission (2021).

Table 1.
Expected impact of selected variables on corporate tax revenues.
| Variable | Author (Year) | Relationship between Corporate Tax Revenue and Variable | Expected Relationship | Interpretation of Impact |
|---|---|---|---|---|
| Statutory tax rate and Average effective tax rate | Lee and Gordon (2005); Teather (2005); Ganghof and Genschel (2008); Guziejewska et al. (2015) | negative | + | An increase in the tax rate will increase income from corporate tax |
| Clausing (2007) | positive | |||
| Gross domestic product | Gropp and Kostial (2000); Clausing (2007); Kubátová and Řihová (2009); Bayer (2011); Karpowicz and Majewska (2018) | positive | + | Higher GDP leads to higher incomes from corporate tax |
| Net foreign direct investment | Gropp and Kostial (2000); Clausing (2007) | positive | + | The growth of foreign direct investment increases corporate tax revenues |
| Inflation rate | Kubátová and Řihová (2009); Barro and Furman (2018) | positive | + | Higher inflation rates lead to higher incomes from corporate tax |
| Unemployment rate | Gropp and Kostial (2000); Tosun (2006); Clausing (2007); Kubátová and Řihová (2009); Fedeli and Forte (2012) | negative | − | Higher unemployment rates reduce incomes from corporate tax |
Source: own processing.
Table 2.
Results of regression analysis of EU13 and EU15 models.
| Model EU13 | Model EU15 | |||||
|---|---|---|---|---|---|---|
| t Value | p-Value | t Value | p-Value | |||
| cit (Intercept ) | 4049.624 | 2.676 | 0.02539 * | −66,803.55 | −2.577 | 0.029826 * |
| STR | −472.974 | −4.422 | 0.00167 ** | 1198.23 | 0.714 | 0.493491 |
| EATR | 400.08 | 4.731 | 0.00107 ** | 237.22 | 0.146 | 0.887021 |
| GDP | 13.194 | 3.512 | 0.00660 ** | 62.35 | 5.409 | 0.000428 *** |
| FDI | 4.575 | 2.352 | 0.04319 * | 208.15 | 2.085 | 0.066702 |
| INF | 28.331 | 2.706 | 0.02414 * | 949.31 | 1.921 | 0.086970 |
| UN | −128.921 | −7.976 | 2.27 × 10⁻⁵ *** | −603.11 | −2.151 | 0.059900 |
| Coefficient of determination | 0.9888 | 0.9078 | ||||
| Corrected coefficient of determination | 0.9813 | 0.8464 | ||||
| p-value for the model | 2.97 × 10⁻⁸ | 0.0003347 | ||||
| Normatila residues shapiro.test(resid()) | 0.1684 | 0.8132 | ||||
| Heteroskedasticity bptest() | 0.2108 | 0.8995 | ||||
| Autocorrelation bgtest() | 0.3207 | 0.8206 | ||||
Source: own processing in the program R according to European Commission (2021) and The World Bank (2021). *, **, and *** report statistical significance at the 10%, 5%, and 1% levels, respectively.
Publisher’s Note: MDPI stays neutral with regard to jurisdictional claims in published maps and institutional affiliations. |
© 2021 by the authors. Licensee MDPI, Basel, Switzerland. This article is an open access article distributed under the terms and conditions of the Creative Commons Attribution (CC BY) license (https://creativecommons.org/licenses/by/4.0/).
Share and Cite
MDPI and ACS Style
Helcmanovská, M.; Andrejovská, A. Tax Rates and Tax Revenues in the Context of Tax Competitiveness. J. Risk Financial Manag. 2021, 14, 284. https://0-doi-org.brum.beds.ac.uk/10.3390/jrfm14070284
AMA Style
Helcmanovská M, Andrejovská A. Tax Rates and Tax Revenues in the Context of Tax Competitiveness. Journal of Risk and Financial Management. 2021; 14(7):284. https://0-doi-org.brum.beds.ac.uk/10.3390/jrfm14070284
Chicago/Turabian StyleHelcmanovská, Martina, and Alena Andrejovská. 2021. "Tax Rates and Tax Revenues in the Context of Tax Competitiveness" Journal of Risk and Financial Management 14, no. 7: 284. https://0-doi-org.brum.beds.ac.uk/10.3390/jrfm14070284