
Modelling Systemically Important Banks vis-à-vis the Basel Prudential Guidelines


1
Financial Services Authority, Jakarta 12710, Indonesia
2
School of Business, Western Sydney University, Penrith, NSW 2151, Australia
*
Author to whom correspondence should be addressed.
J. Risk Financial Manag. 2021, 14(7), 295; https://0-doi-org.brum.beds.ac.uk/10.3390/jrfm14070295
Submission received: 24 May 2021
/
Revised: 20 June 2021
/
Accepted: 21 June 2021
/
Published: 26 June 2021
(This article belongs to the Special Issue Economic Forecasting)
Abstract
:Our paper investigates Indonesia’s systemically important banks (SIBs) using theoretical approaches—CoVaR, marginal expected shortfall (MES), and SRISK—to compare with the Basel guidelines as benchmark. We use Indonesian banks’ market and supervisory data over the 2008–2019 period. The research aims to seek intertheoretical model interaction and SIB ranking in concordance with the Basel guidelines as applied by a bank supervisor. The findings show that SRISK produced a more consistent ranking compared with CoVaR and MES. CoVaR and MES had higher intermodel correlation converted to 59% similarity in rankings. Further, all theoretical models are in line with the Basel guidelines, where the closest approximation is at 47%. The results indicate that policy makers could use scholarly models as validation tools and help improve supervision decision to identify systemically important institutions.
JEL:
G21; G210; G28; G2801. Introduction
Banking crises are known to be one of the triggers of further financial instability and downturns in economic activity across countries. Research by the Basel Committee on Banking Supervision (BCBS 2010) revealed that, on average, banking crises occur once every 20–25 years, with the exception of the period after the end of the Second World War until the early 1970s–1980s. According to Reinhart and Rogoff (2008), there have been 34 banking crises over the last 25 years among BCBS member countries. Another study, by Laeven and Valencia (2013), found a similar result, with 24 banking crises experienced by BCBS member countries from 1985 to 2009.
Efforts to identify the number of systemically important banks (SIBs) and their systemic risk impact especially after the 2007–2008 global financial crisis have experienced significant growth. Despite the rising number of banks identified as SIBs, factors such as structures, activities, and degree of risks vary significantly across SIBs (BCBS 2018). Strenuous attempts from scholarly research summarized by Bisias et al. (2012) have analyzed supervisory scope, research methodology, and data perspectives, along with attempts to measure risk. A pioneering work by Allen and Gale (2000) published in several papers discusses the vulnerability of the financial system network to spillover effects. Adrian and Brunnermeier (2016) proposed conditional value at risk (CoVaR) to calculate the VaR of banks and its risk effect on other banks when the financial system is under stress. Acharya et al. (2012) proposed systemic expected shortfall using the stock price and credit default swap spread. Brownlees and Engle (2017) introduced the systemic risk measure (SRISK) method to predict the rankings of financial institutions at various stages of the 2008 financial crisis.
From the regulatory side, the first official guideline on SIBs issued by BIS appeared in November 2011 in response to the 2007–2008 global financial crisis (BCBS 2011). Standards were revised in July 2013 and further updated in July 2018 (BCBS 2013, 2018). Based on the current methodology, the global systemically important bank (G-SIB) score is calculated over selected indicators, which are grouped into categories of systemic importance. The score calculation is relatively simple, employing the weight proportion divided into indicators from the data, which are compiled at the micro level or from bank balance sheet data. For assessment down to country-level jurisdiction, BIS allows the local authority to make a discretionary adjustment of the principles with the purpose of capturing the country’s banking characteristics and negative externalities of the local economy (BCBS 2012).
However, none of the above research papers empirically examine a systemic financial institution using the theoretical model devised by BCBS. Several reasons for this can be posited, including limitations of data sources in order to perform the calculation, research scope, and technical issues involved in compiling both market and prudential data. This paper aims to fill this gap by comparing three representative models widely cited by academics to identify SIBs vis-à-vis the Basel-indicator-based methodology. This research approach contributes to the extant research by employing the BCBS methodology, which Basel claims is more robust than the approaches that rely on market variables (BCBS 2018). Our approach uses datasets from Indonesia, considered to be the largest economy in the Southeast Asian region and one of the G20 member countries. The Indonesian banking topography is diverse and attractive for exploration, with 115 commercial banks employed in the modelling. The outcomes of this research will be useful for academics in order to improve the estimation of models and provide policy makers with tools to improve supervisory activities.
Our research methodology is built on three widely cited models, namely, conditional value at risk (CoVaR; Adrian and Brunnermeier 2016), marginal expected shortfall (MES; Acharya et al. 2012), and systemic risk measure (SRISK; Brownlees and Engle 2017). The empirical evidence identified by each model is then compared with the Basel SIB list as benchmark. The study employs two different data sources: market or publicly available data and the balance sheet or prudential supervisory data submitted by the banks to the regulator. The observations use Indonesian commercial banks’ market and balance sheet data reported to the regulator during the period of 2008–2019.
The results suggest that regarding SIB ranking stability, SRISK outperforms CoVaR and MES over the sample period. Regarding intermodel correlation, CoVaR and MES have higher positive correlation that is converted to around 58% similarity in rankings. In addition, all three theoretical approaches have positive Kendall’s tau, where the highest association with Basel is counted at 47%. The number indicates that the scholar theoretical models’ SIB list would be similar to some extent to that of policy makers, where the Basel methodology is employed.
2. Literature Review
2.1. Theoretical Approaches on Systemically Important Banks
Studies on systemic risk encompass many aspects, and its immense dimension reflects on the definition stated by the regulator. Policy makers’ definition of systemic risk commonly does not explicitly point out specific variables as trigger, with examples such as FSB et al. (2009) defining systemic risk as a risk of disruption to financial services that causes an impairment of all or parts of the financial system and has the potential to have serious negative consequences on the real economy. ECB (2009) defines systemic risk as the risk of financial instability that impairs the functioning of a financial system where economic growth and welfare suffer significantly. Bank Indonesia (2014), as the macroprudential regulator of Indonesia, defines systemic risk as the potential for instability of a financial system as a result of exaggerated procyclical actions taken by financial institutions. The absence of specific factors in the definition of systemic risk implicitly shows the complexities of identifying, measuring, and mitigating risk itself.
The existing definition of systemic risk is mostly related to the research scope of work, data used, and methods. An example of such papers is that of De Bandt and Hartmann (2000), who define systemic risk as a systemic event that affects a considerable number of financial institutions or markets in a strong sense, thereby severely impairing the general functioning of the financial system. Others define systemic risk as arising from implications of imbalances (Caballero 2010) and correlated exposures (Acharya et al. 2017) to any set of circumstances that threatens the stability of public confidence in the financial system (Billio et al. 2012). Shortly, various indicators should simultaneously be considered by regulators and researchers to assess the complexity of systemic risk (Bengtsson et al. 2013).
Based on some studies, research studies on SIBs and systemic risk are classified according to statistical measures, methodologies, variables, and financial institution network interactions. Bisias et al. (2012) summarized research based on the supervisory scope, research methodology, and data perspectives in the main text and presented concise definitions of each risk measurement to include required inputs, expected outputs, and data requirements. They classified systemic risk research into five major categories: The first is probability distribution. An example under this is multivariate density function used by Segoviano and Goodhart (2009). Adrian and Brunnermeier (2016) proposed CoVaR to calculate the VaR of banks and its risk effect on other banks when the financial system is under stress. Others such Acharya et al. (2012, 2017) were calculated using marginal and systemic expected shortfall with the purpose of measuring financial institutions’ expected losses when the market falls below some predefined threshold over a given time horizon. Second, contingent claims and default and liquidity measure the likelihood of default of each institution and their link to the financial system through joint distribution. Example papers under this category are those of Jobst and Gray (2013) and Jobst (2014). Third, the network analysis method measures the connectedness between banks and failure’s impact on other banks and the financial system. Examples under this category are the papers of Allen and Gale (2000), Eisenberg and Noe (2001), Gai and Kapadia (2010), Gai et al. (2011), Krause and Giansante (2012), and Elsinger et al. (2006a, 2006b). Others, such as the paper of Brownlees and Engle (2017), introduced systemic risk measure (SRISK) to capture the expected capital shortage of a firm given its degree of leverage and marginal expected shortfall (MES) as the expected loss that an equity investor in a financial firm would experience if the overall market declines substantially. There are also alternatives using extreme value theory (EVT) to investigate contagion risk, such as the papers of Rocco (2014), Dias (2014), and Akhter and Daly (2017). Moreover, for comparison among models, Benoit et al. (2011) tried to compare the theoretical systemic risk measures, and others, such as Brämer and Gischer (2013), identified the domestic systemically important banks (D-SIBs) in the Australian context using a modified Basel-indicator-based guideline.
In contrast, despite Indonesia’s economic size and number of banking institutions, only a few studies have found Indonesia’s banking systemic risk. Some of the papers are those of Ayomi and Hermanto (2013), who applied the Merton model to identify the probability of default in over 30 banks in Indonesia during the period of 2002–2013; Fadhlan (2015), who used Granger causality analysis to investigate 37 listed banks in the Indonesia Stock Exchange; Muharam and Erwin (2017), who estimated the conditional value at risk (CoVaR) of the 9 biggest banks in Indonesia through quantile regression; Zebua (2011), who investigated Indonesian systemic risk using CAMELS ratios and the CoVaR concept of Adrian and Brunnermeier (2016), and Wibowo (2017) who used the Merton distance to default to measure the systemic risk.
Although efforts have been put by scholars on studying systemic risk, no paper directly compares the theoretical models’ results with Basel as benchmark to list SIBs or systemically important financial institutions (SIFIs) and the correlation among the outcomes. This absence could be postulated on the data sources to perform calculation, determine research scope, and identify technical issues to source both market and prudential data. This paper aims to bridge the gap by employing CoVaR (Adrian and Brunnermeier 2016), MES (Acharya et al. 2012), and SRISK (Brownlees and Engle 2017) with Basel (BCBS 2018). The results will be useful to see how close the scholars’ result is to predict the SIBs where market data are used with the policy makers’ outcome using prudential microdata.
2.2. Standards Guideline
The Basel Committee on Banking Supervision, for the first time in 2011, issued the standard for the regulator’s assessment of global systemically important banks (BCBS 2011).1 The rationale for adopting additional policy measures for G-SIBs is based on the “negative externalities” (i.e., bankruptcies, unemployment, economic crises, output losses) created by SIBs that current regulatory policies do not adequately address (BCBS 2012). Although BCBS admitted that the indicators do not measure precisely specific attributes of SIBs, the proxies are designed to identify the central aspect of SIB status, and Basel claims that it is more robust than the currently available model-based measurement approaches and methodologies that rely on only a small set of indicators or market variables (BCBS 2018). The Basel G-SIB guideline framework categorizes bank activities into five main groups, which in total consist of 13 indicators. The newest updated standard, among others, introduces a trading volume indicator, a modification of weights in the substitutability category, and an extension of the scope of consolidation to insurance subsidiaries (BCBS 2018). To bring the G-SIB context to the country-level jurisdiction, BIS allows the local authority to make a discretionary adjustment of the principles for the purpose of capturing the country’s banking characteristics and the negative externalities of the local economy (BCBS 2012).
Cascading down to the country level, Indonesian banking, where we apply estimation models and gather datasets, is divided into two mainstreams, which are commercial banks and rural banks. As of December 2018, there are 115 commercial banks and 1760 rural banks, where both numbers reflect the sums of the country’s conventional and sharia banks. Commercial banks are the key players in the Indonesian banking system, accounting for more than 98% market share in terms of total assets, sources of funds, and distributed fund. The Indonesian banking topography is mainly concentrated on the 30 biggest commercial banks. The main players hold more than 88% of the total country banking assets, third-party funds, and loans disbursed. For our research purposes, we analyzed all of the commercial banks listed with the Indonesia Stock Exchange for the theoretical model since the assumption and variables are available as market data. On the other hand, for the Basel methodology we analyzed all commercial banks in Indonesia (listed and not listed) using bank data reported to the banking regulator.
In the context of our research, we constructed SIB preliminary assessment based on the Basel guideline and adjusted it accordingly using bank balance sheet data submitted by the banks to Indonesia’s Financial Services Authority (OJK). OJK, as Indonesia’s banking regulator, issued POJK No. 2/POJK.03/2018, which serves as the guideline for SIB supervision and capital surcharge absorbency to safeguard the negative externalities of SIBs.
3. Data and Methodology
3.1. Source of Data
We grouped two separate datasets of samples for CoVaR, MES, and SRISK to cover all of the commercial banks listed with the Indonesia Stock Exchange in the period of 2008–2019. For the model calculation, the number of samples was 33 banks, which was then reduced to 27 banks after discarding some because of incomplete data or inactive trading. We sourced the market data on Indonesian banks from the Eikon Thomson Reuters databases.
On the other hand, for the Basel framework calculation, the micro or balance sheet data were sourced from monthly reports submitted to OJK. The sample covers all the 115–120 Indonesian commercial banks. The number of banks varies over time because of mergers and acquisition during the observation window. To test the theoretical approaches’ results, we compared them with the Basel outcome as benchmark. The comparison was made for 2015–2018, where the observation windows were assessed twice a year in June and December. The chosen time frame is in line with the Indonesian SIB regulations issued by OJK (OJK 2015), and it is also more current and improves the information made available to the regulator.
3.2. Model Estimation
The theoretical approaches for estimating and analyzing the network model use Adrian and Brunnermeier (2016):
- Conditional Value at Risk (CoVaR)
VaR is the most that the bank loses with a confidence level of 1 − α; the parameter of α is 1% or 5%, Pr(R < −VaRα) = α.
CoVaR corresponds to the VaR of the market return conditions for certain events of firms i.
CoVaR is the difference of the financial system’s VaR condition of firm i during financial distress and the financial system’s VaR when firm i is in median state. CoVaR represents the systemic risk contribution of firm i to the financial system.
- 2.
- Marginal Expected Shortfall (MES)
This model was proposed by Acharya et al. (2012), who used two standards to measure firm-level risk: value at risk (VaR) and expected shortfall (ES). VaR is the most that the bank loses with a confidence level of 1 − α; the parameter of α is 1% or 5%.
Pr(R < −VaRα) = α
The ES is the expected loss conditional on the loss, which is greater than the VaR or the average of returns on days when the portfolio’s loss exceeds its VaR limit.
ESα = −E[R/R ≤ −VaRα]
Acharya et al. (2017) focused on ES rather than VaR since it is not robust in the sense that a negative payoff below a threshold of 1% or 5% is not captured, and the sum of two portfolio VaRs could be higher than the sum of individual VaRs.
Further, to calculate the contribution of bankwide losses to groups or the trading desk contribution, the next step is to decompose the bank return R into the sum of each group’s return , that is,
where is the weight of group i in the total portfolio. Then,
R = ∑i = yi ri
ES = −∑i yi E(ri|R ≤ −VaR)
The sensitivity of the overall risk to exposure to each group i
where is group i’s losses or marginal expected shortfall when the firm as a whole is doing poorly.
- 3.
- Systemic Risk Measure (SRISK)
Following the study of Acharya et al. (2012), Brownlees and Engle (2017) develop the risk contribution of a financial firm to the systemic risk as a function of its size, leverage, and risk. Using the balance sheet and market data, they calculate the expected capital shortfall over a longer period of market decline called long-run marginal expected shortfall (LRMES). SRISK is counted to take into account not only the equity volatility, return distribution, and correlation but also the size and leverage level of the firms. The systemically important financial institutions are ranked according to the highest SRISK, and the total is the undercapitalization of the whole financial system.
SRISKi,t = Et−1 (Capital shortfalli|Crisis)
The estimation of capital shortfall uses bivariate daily equity returns of firms and the market index, where volatilities follow asymmetric GARCH and DCC correlation processes. To simulate the crisis, the market index is assumed to fall by 40% over a 6-month projection, and volatilities and correlation change over time in order to calculate the tail dependence.
where
CSi,t = kAi,t − Wi,t
CSi,t = k(Di,t + Wi,t) − Wi,t
- Wi,t = market value of equity;
- Di,t = book value of debt;
- Ai,t = book value of assets;
- k = prudential capital fraction, which is set to 8%.
Based on the formula, when the capital shortfall is negative, the firms have a positive or surplus working capital and can operate normally, but when the capital shortfall is positive, the firms are under distress. The firm capital shortfall causes negative externalities only if it occurs when the whole system is already under distress, the multiperiod market return of the periods t + 1 and t + h is Rmt+1:t+h, and the systemic event is reported when Rmt+1:t+h < C, where C is the market decline threshold.
SRISKi,t = Et (CSit+h|Rmt+1:t+h < C)
= k Et (Di,t+h|Rmt+1:t+h < C) − (1 − k)Et(Wit+h|Rmt+1:t+h < C)
A further assumption made by Brownlees and Engle (2017) is that debtors are unable to renegotiate their debts during the crisis:
where LVG = leverage ratio (Dit + Wit)/Wit;
SRISKi,t = kDit − (1 − k) Wit (1 − LRMES)
= Wi,t [kLVGit + (1 − k) LRMESit − 1]
LRMES = average of firm equity returns approximated as 1 − exp (−18 × MES) to represent the expected loss over a 6-month period conditional on 40% of market fall.
The contribution or systemic share of firm i SRISK is calculated as:
where J = firms with positive SRISK.
- 4.
- Basel-Indicator-Based Approach
The BCBS (2018) indicator-based approach values the institution size, interconnectedness, substitutability, global cross-jurisdictional activity, and complexity. Basel allows departure from the guideline asserted by BCBS (2012) with the purpose of better capturing specific domestic systemically important bank (D-SIB) characters and country externalities. For our dataset, we adjusted the formula composition and rearranged the indicators following OJK (2018). The SIB assessment indicators after country adjustment shown in Table 1, hence, are as follows:
To get the score value for a given indicator, we followed BCBS (2014), where the bank’s value is divided by the total of the banking system, where the results are conveyed in basis points (bps).
In order for us to get the scores for all three categories, the scores for the indicators under each category are averaged. As a sample, the interconnectedness score is the average of intrafinancial assets, intrafinancial liabilities, and securities outstanding.
4. Results
To validate the data’s integrity and calculation, data were grouped into several Excel worksheets: share price, market capitalization, total assets, total equity, state variables, and sample groups. Share prices, market capitalization, and state variables (7D repo rate, T-bill delta, credit spread, liquidity spread, yield spread, JSX LQ45 excess return, JSX financial sector excess return, and JSX VIX) were provided on a daily basis. Others, such as total assets and total equity, were on a quarterly basis. The datasets presented in Table 2 were 27 actively traded banks listed with the Jakarta Stock Exchange (JSX) during the period of 2008–2019. We classified the banks following OJK (2016a), where the regulation grouped commercial banks into four classes of BUKU based on the core capital. The classes determined allowed a business network and activities, where the most complex bank activities were licensed for banks under the BUKU 4 category, while BUKU 1 banks were only permitted to offer basic banking services. The sample banks for the theoretical approaches are in the table below:
In total, there were 2971 daily observations for each variable range from 2008 to 2019. However, there were some missing data for a 3-month T-bill, and to counter this, we used Stata multiple imputations with 669 verified results before going forward to the next step for model estimation using Matlab R2019b coding developed by Belluzzo (2020). Table 3 shows statistical summary of the results is as follows:
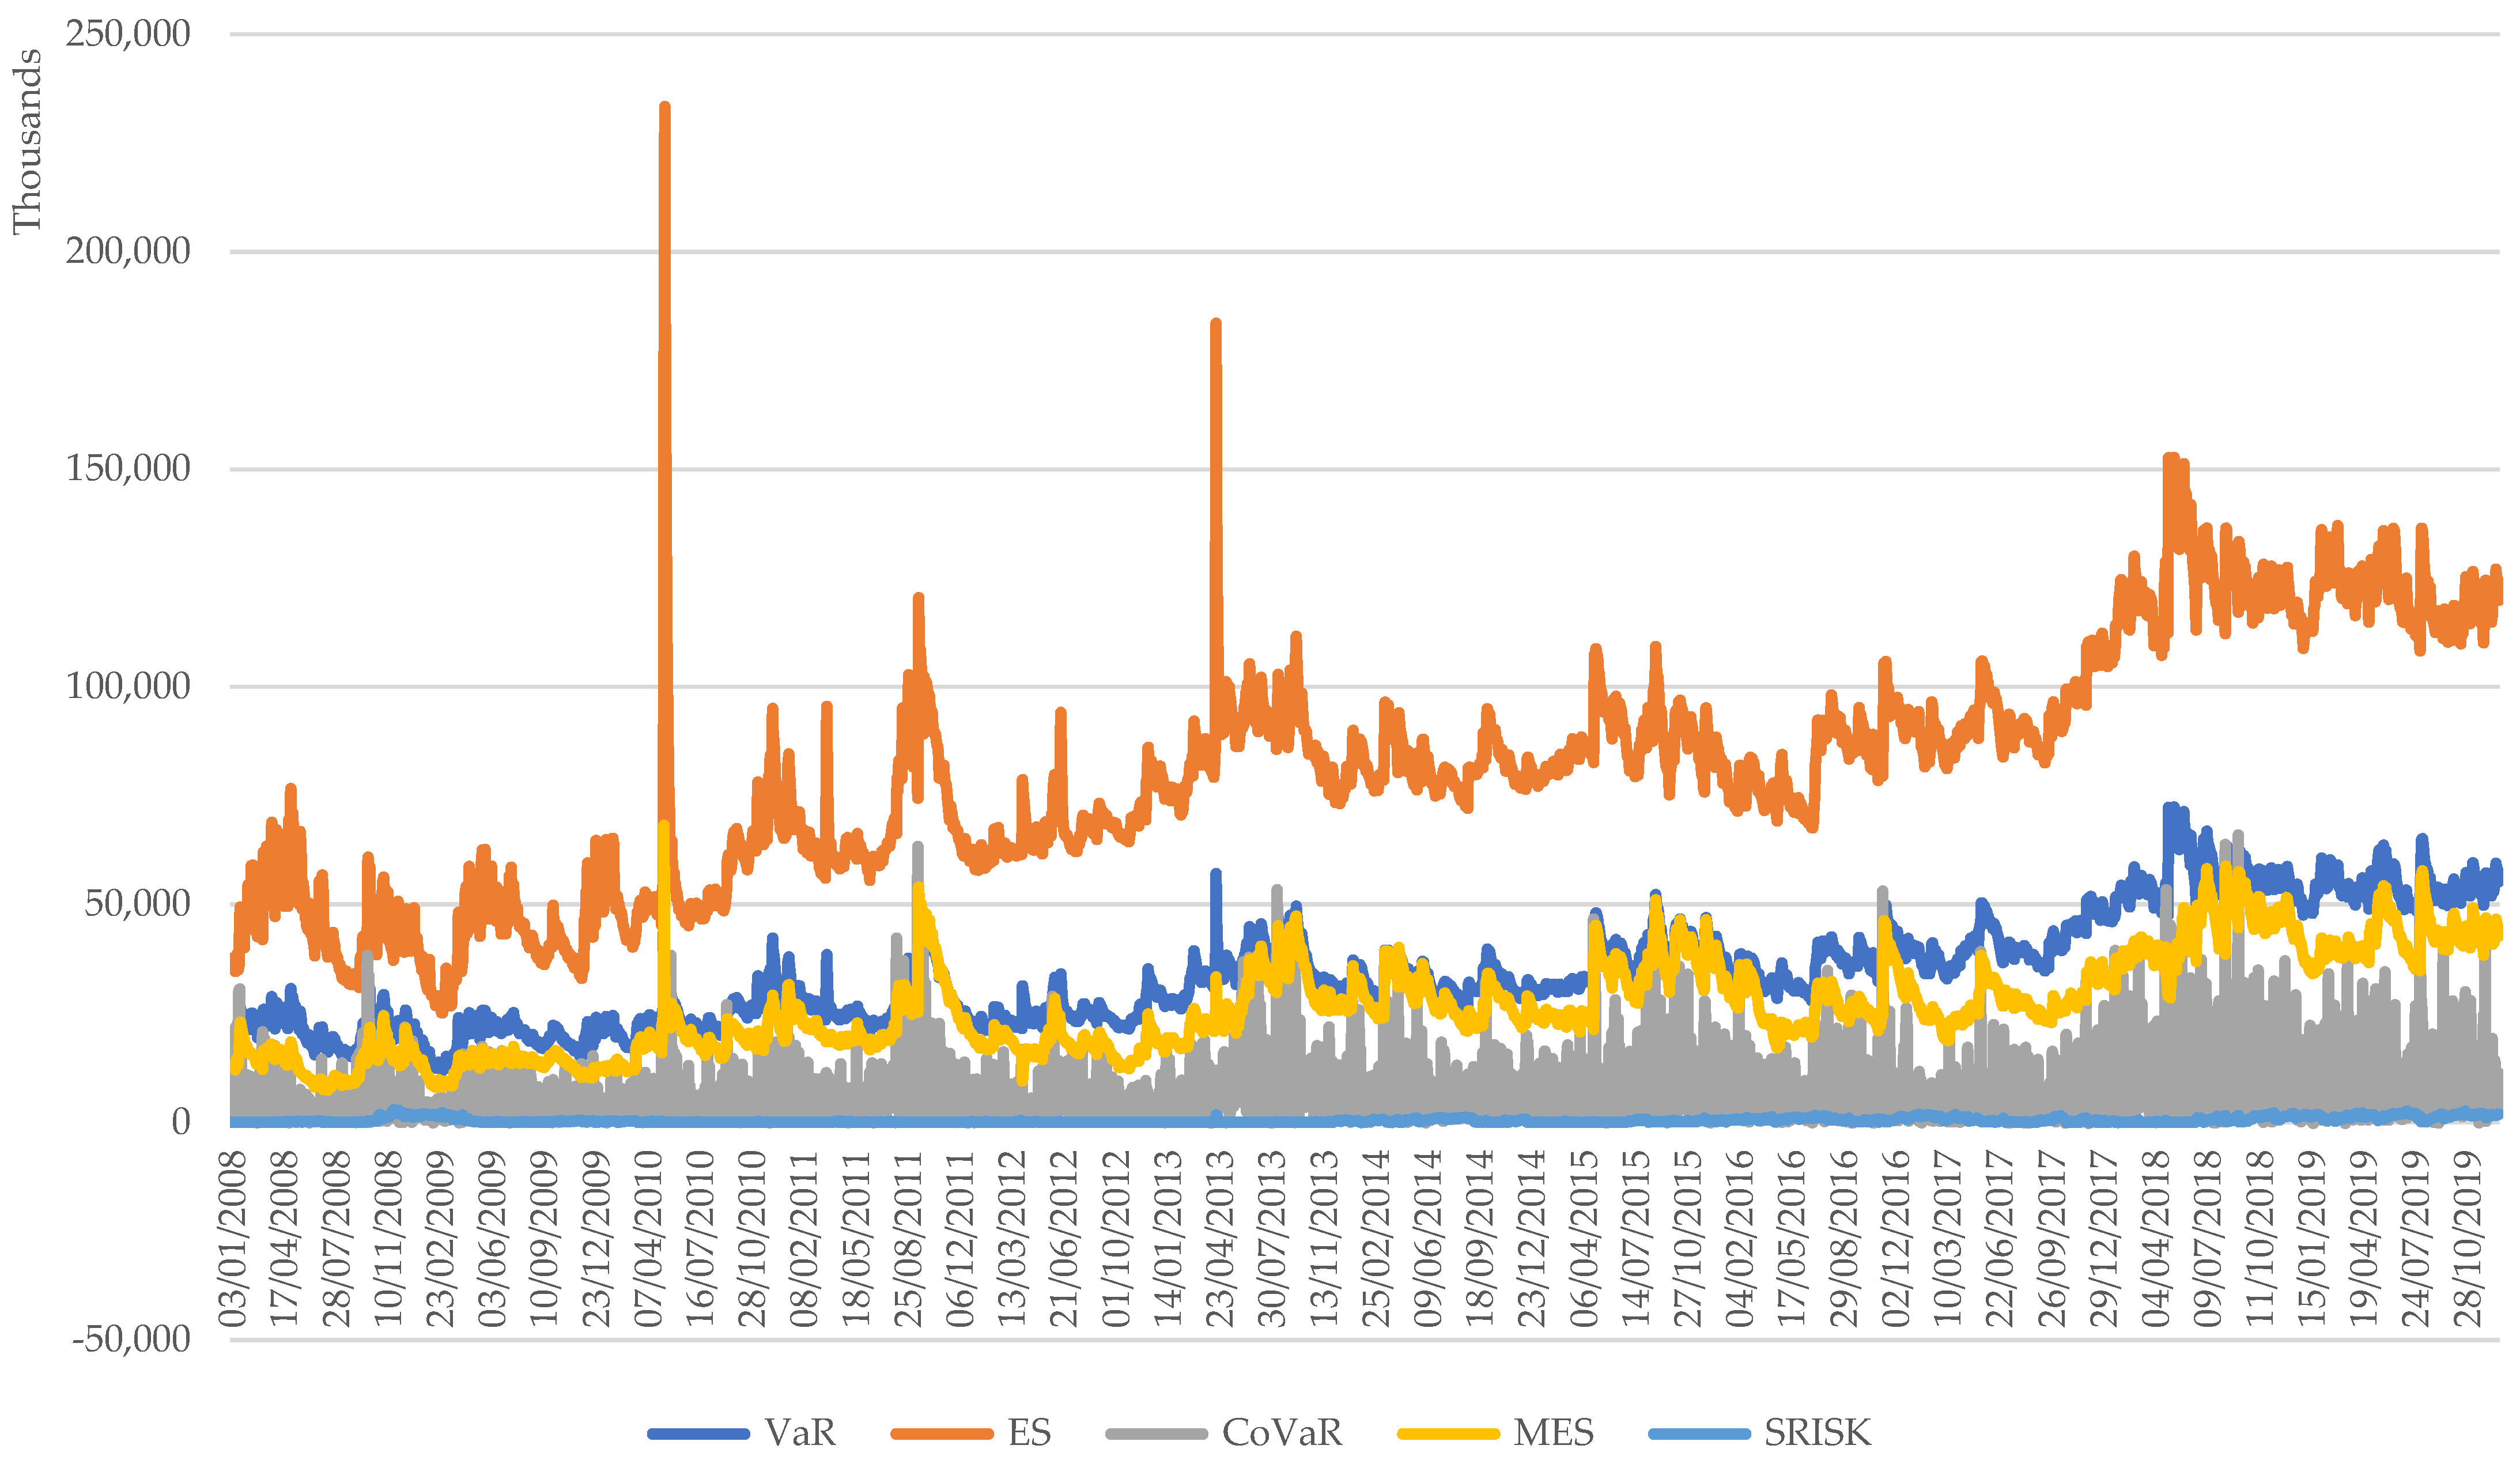
Figure 1 plotting the systemic averages across three estimated models in the line graph, the VaR averages were higher than the MES, CoVaR, and SRISK results. This reflects the amount of bank capital shortfall that should be injected to mitigate bank failure and trigger systemic risk. However, using VaR is misleading in the sense that a negative payoff below the threshold is not captured (Acharya et al. 2017). The different outcomes become a dilemma for policy makers since they determine the magnitude of higher loss absorbency requirement as required by Basel through the bucket approach (BCBS 2018).
4.1. CoVaR
A CoVaR systemic risk measure was introduced by Adrian and Brunnermeier (2016) rooted in the value at risk (VaR) concept stemming from the study of Jorion (2007), which measures the most investors can lose over a certain investment horizon. CoVaR measures individual bank contribution to the whole financial system’s systemic risk. CoVaR also puts into account the financial distress that seems relevant during the financial crisis compared with the Basel normal standard scenario. Based on model calculation as shown in Table 4, CoVaR SIB rankings over the sample window time are mostly dominated by big Indonesian banks classified as tier 4 commercial banks (BUKU 4) with a total equity of more than Rp 30 trillion and tier 3 commercial banks (BUKU 3) with a total equity in the range of Rp 5–30 trillion. For example, BBCA is one of the most systemic banks in the Indonesian banking system, which contributed 19.75%–20.55% in the last 3 years. The almost nonexistence of small and medium banks in the SIB list could give a false alarm to the bank supervisor. Network model proponents, such as Allen and Gale (2000), Gai et al. (2011), provide evidence of interbank placement creating a web of networks vital for a systemic risk study, which could also stem from nonbig banks. In terms of CoVaR outcome similarity to Basel, the highest is at 0.33 in 2015–2016.
4.2. Marginal Expected Shortfall (MES)
Using the model proposed by Acharya et al. (2017) with a confidence level of 95%, bank rankings based on their systemic contribution are shown in the Table 5.
The scenario of the MES base model originates from when crises hit the shareholders, who experience decline in their asset returns and market value of equity. To resemble the crisis scenario, the assumption made follows what was used by Acharya et al. (2017), where the index fell more than 40% over the next 6 months calculated as long-run marginal expected shortfall (LRMES). The MES model in application could supplement the bank regulator for the Basel required capital surcharge.
The MES model results in Table 5 shortlisted more banks in the list than CoVaR. It also noticeably shortlisted unstable bank rankings compared with CoVaR over the same sample window time. Using the MES framework, in the 2008 financial crisis the most systemic bank in Indonesia was BBRI with a 16.51% systemic risk contribution. Although BBRI’s systemic share contribution has been volatile over time, it is still one of the country’s SIBs. The ranking volatility is one of the MES model’s disadvantages compared with other theoretical models. The bank supervisor will have difficulty imposing the systemic capital charge since the capital shortage injection by the shareholders usually takes time to approve.
Additionally, the appearance of few relatively small banks or tier 2 commercial banks (BUKU 2), such as BVIC and AGRO, reflects the vulnerability of undercapitalization in case of crisis, and the possible capital injection will be done by the controlling shareholders. Further, for ranking correlation with Basel, the best approximation was in 2015 with 0.47.
4.2.1. Systemic Risk Measure (SRISK)
Brownlees and Engle (2017) offered the SRISK concept to measure systemic risk by combining the market and balance sheet data. The mixture of data used in the model balance of what Basel offers depends only on micro or bank data. SRISK integrates and complements other systemic estimation models by using bank size and degree of leverage. The total aggregate SRISK resembles the total amount of capital in relation to party or government need to rise from the financial crisis. SRISK = 0 means that the firms do not need to be injected with capital in case financial distress hits the economy based on severity assumptions, and negative SRISK shows that the firms have excess capital to counter and sustain during crisis. Table 6 exhibit SRISK estimation results are as follows:
The results exhibit the most stable ranking list compared with CoVaR and MES over the sampling period. The systemic share contribution also arguably concentrated on four banks with exception in 2015, where it was distributed to eight banks. Remember that SRISK = 0 means that the banks have enough capital even during crisis, where there is 40% market decline and the prudential capital regulation (CAR) is assumed to be 8%. The SRISK model is based on a correlation test that could predict up to 33% of Basel rankings in 2018. These results also show that Indonesian banks, based on the SRISK model, are mostly in a sound state with zero SRISK even in the face of financial distress. This could also be because of OJK conservatism as the banks’ regulatory institutions in Indonesia required banks to have 8%–11% minimum CAR depending on their risk profiles. OJK (2016b) also mandated all commercial banks in Indonesia to provide 2.5% capital conservation buffer plus 0%–2.5% countercyclical buffer, and banks in the D-SIB list have another mandatory extra 1%–2.5% capital surcharge.
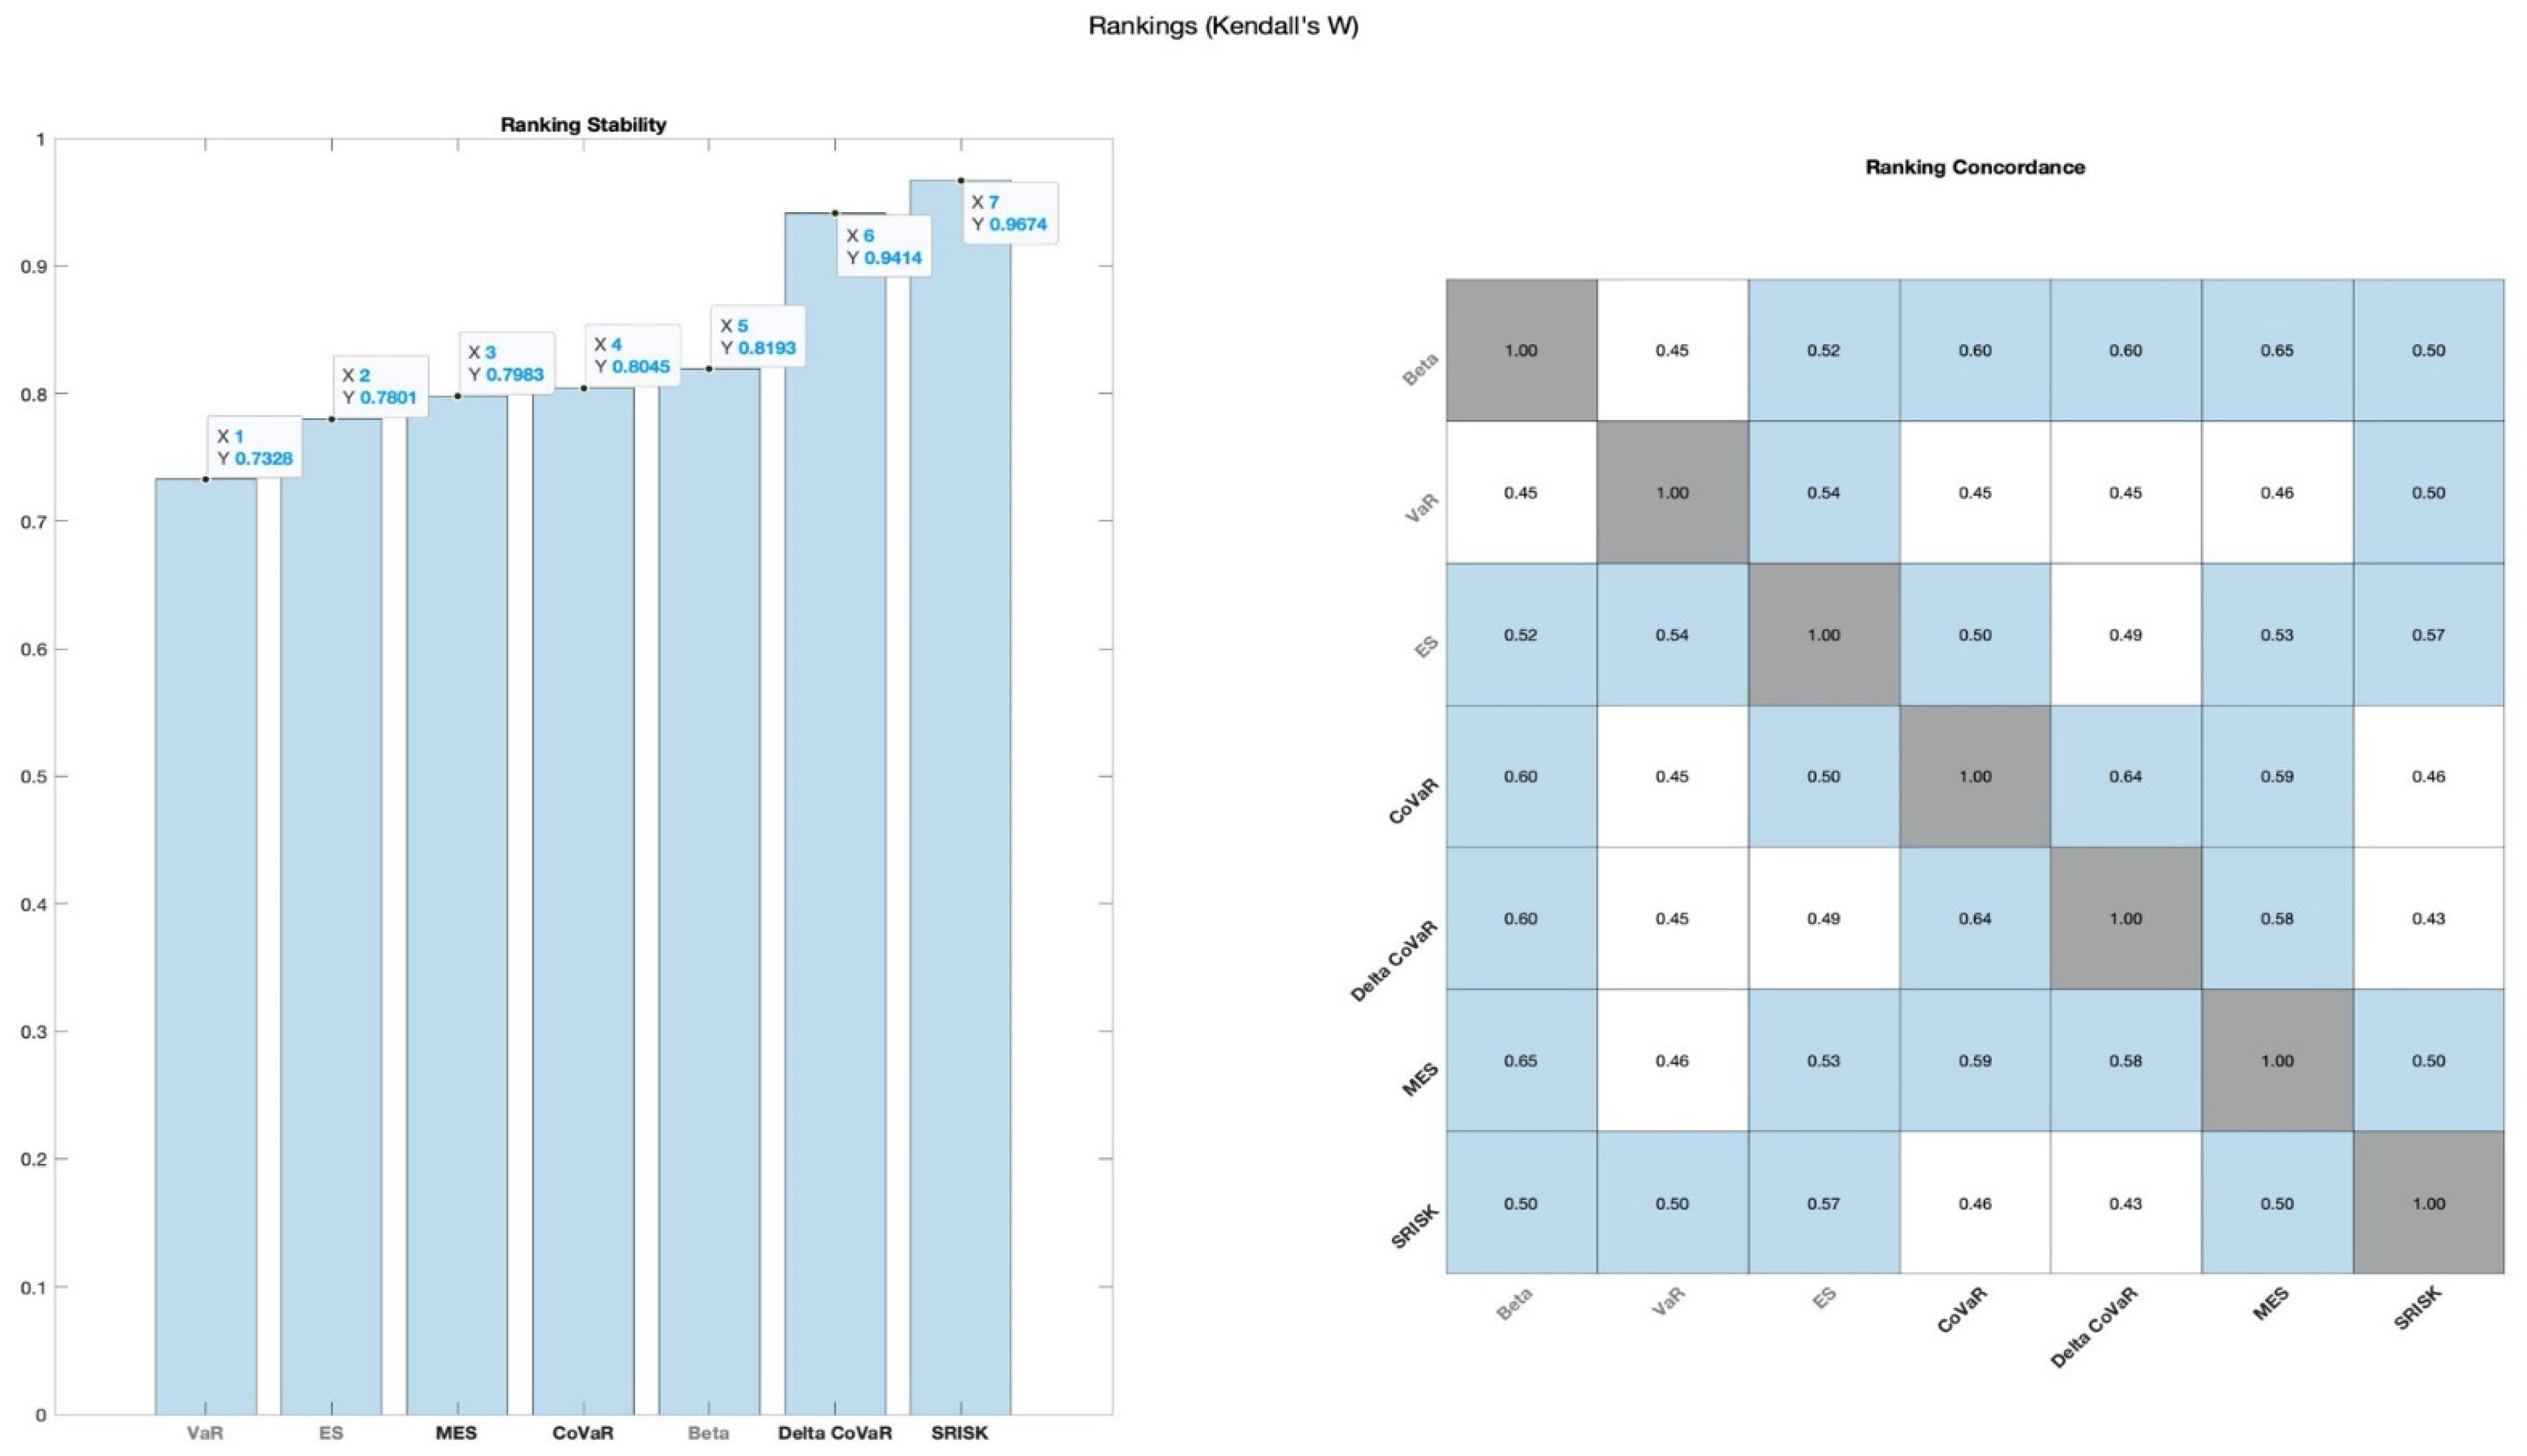
To step further, we tested the ranking stability and similarity among CoVaR, MES, and SRISK using Kendall’s tau. Kendall’s value of agreement when W = 1 indicates high agreement, and when W = 0, the opposite is true. The results are in line with and confirm our findings where the ranking stability, from most to least stable, is as follows: SRISK with 0.9674, CoVaR with 0.8045, and MES with 0.7983. Ranking stability is the key point used by the regulator to measure the SIB magnitude in the whole system. It is also a basis for requiring capital surcharge buffer as required by Basel (BCBS 2018).
Figure 2 plotting and exploring the model and variables in a ranking concordance matrix gives us a more detailed insight into where the highest agreement is, which is in MES and Beta with 0.65, followed by ΔCoVaR and CoVaR with 0.64. The findings point out that if we use simple Beta to rank the SIBs, then around 65% of the banks appearing in the list will be the same with MES. For intermodel ranking similarity, all models have a positive correlation with the highest being that of CoVaR –MES with 0.59, followed by SRISK–MES with 0.50, and SRISK–CoVaR with 0.46.
4.2.2. Basel-Indicator-Based Approach
To contrast the Basel SIBs with the theoretical approaches applied by scholars, we tested the correlation at four check points in 2015–2018. Considering the confidential data submitted to the regulator, we coded the firms using certain IDs but kept them traceable in order to make a comparison with the results of the theoretical approaches, CoVaR, MES, and SRISK. Results for the Basel-indicator-based approach shown in Table 7 are as follows:
Using Kendall’s tau nonparametric correlation test, it can be seen in Table 8 that the correlation of theoretical approaches with the Basel-indicator-based approach is positive at three out of four check points. However, the association number is quite low, ranging from 0 to 0.47. This number represents instances when academicians use a theoretical model to shortlist SIBs, whose results are similar to what policy makers have on their desks to a certain extent. The strongest association with a Basel ranking list was observed in 2015 using MES at 0.47. Further, Kendall’s correlation was highest at 0.33 in 2016 when using CoVaR and in 2018 when using SRISK. The results also indicate that policy makers could use the theoretical models to validate the Basel-indicator-based ranking to improve the supervision framework.
To validate Kendall’s tau, we ran a robustness test using Spearman rho correlation in Stata, and the outputs are in line with numbers that tend to be higher when we use Spearman rho. The strength and direction of the ranked banks were highest in 2015 when the scholars used MES at 0.60, followed by CoVaR at 0.40. SRISK ranking in the same year was contrary to the Basel shortlist at −1.00. In 2016, CoVaR was closest to Basel at 0.40, while in 2018 it was SRISK at 0.50 (see Appendix A).
4.2.3. Strengths and Weaknesses
The Basel-indicator-based guideline puts emphasis on the size of the institution magnitude in proportion to the whole industry. For instance, the interconnectedness subindicators reflect a bank share of interbank assets and liabilities in the system rather than pointing out how the distress of one institution is contagious to the others through interbank placement transactions. The logical thinking of the Basel methodology is daunting, whether researchers could simply shortlist banks and rank them simply utilizing the numbers in the published financial statements. The secrecy of prudential data is also a major handicap for scholars in exploring and giving inputs to improve the methodology. However, the Basel indicator approach is simple to use once all the supervisory data are collected and comparable among country jurisdictions.
On the other hand, theoretical models have a limited choice of publicly available data. Most models use market data, such as stock price, index, and global institution data (e.g., total assets, total equity, total debt). Market efficiency and transparency are also different among countries, and the stock price is a random walk where sometimes not all information is converted to the correct share price. Interconnectedness among financial institutions is also based on simple assumptions and not direct as the implication of global data used in the methodology. This condition could cause interference and make the models’ results biased. However, accessible public data could make many contribute to a discussion to come up with a better model and improve the results.
The current disruption caused by COVID-19 is also relevant to the systemic risk study, which is not covered in this paper’s data window. The pandemic not only causes problems in the health system but also poses threats to many countries’ economy and financial stability because of the spillover effect (Huang et al. 2009; Rizwan et al. 2020). Early responses show that policy makers are making policy mix intervention through both micro- and macroprudential regulations to contain the risks.
5. Conclusions and Policy Recommendation
This paper investigates how three widely cited theoretical approaches of estimation could mimic the Basel prudential methodology used by the regulator to shortlist SIBs. Using the Indonesian banking data over the period of 2008–2019, we ran CoVaR (Adrian and Brunnermeier 2016), MES (Acharya et al. 2012), and SRISK (Brownlees and Engle (2017) to shortlist Indonesian SIBs and compared them with the prudential Basel ranking list. The findings show that each theoretical model used by scholars displays specific characteristics and advantages for policy makers. CoVaR results could mislead the bank supervisor because it counts more based on bank size factor, where some studies, such as those of Allen and Gale (2000), Gai et al. (2011) proved that it is not always the case. On the other hand, MES shows more banks in the list under a certain constant scenario that might not be true over the forecast time.
In terms of SIB ranking stability, SRISK outperforms CoVaR and MES in an orderly manner. All three theoretical approaches have positive Kendall’s association with Basel as benchmark, where the in-line results recorded vary at 0–0.47. In other words, the scholar model’s SIB ranking result is similar to the Basel guideline outcome used by the bank supervisor by up to 47%. The results are also in line with the Spearman rho correlation in the robustness test. Policy makers can also use theoretical models to validate the Basel result in order to improve their monitoring tools’ framework.
Author Contributions
Conceptualization, M.Z.S. and K.D.; methodology, M.Z.S.; software, M.Z.S.; validation, M.Z.S.; formal analysis, M.Z.S. and K.D.; resources, M.Z.S. and K.D.; data curation, M.Z.S.; supervision, K.D.; writing-original draft, M.Z.S.; writing-review & editing, M.Z.S. and K.D.; project administration, M.Z.S. and K.D.; funding acquisition, M.Z.S. and K.D. All authors have read and agreed to the published version of the manuscript.
Funding
M.Z.S. acknowledges support from Australia government as the sponsor of Australia Awards scholarship ID No. 17/1126.
Institutional Review Board Statement
Not applicable.
Informed Consent Statement
Not applicable.
Data Availability Statement
Market data is from Eikon Thomson Reuters and prudential balance sheet data is from Indonesia Financial Services Authority.
Acknowledgments
This paper presents the authors’ views and will not be thought of as those of Indonesia’s Financial Services Authority. We would like to thank Qiongbing Wu (Western Sydney University) for the valuable discussion during the writing of this paper.
Conflicts of Interest
The authors declare no conflict of interest.
Appendix A. Robustness Test
- 1.
- Impute 3-month T-bill data
. summ
| Variable | Obs | Mean | Std. Dev. | Min | Max |
| Date | 2971 | 19,749.43 | 1269.313 | 17,533 | 21913 |
| MOLIBOR | 2971 | 1.024651 | 0.9536291 | 0.22285 | 4.81875 |
| MOTBILL | 2302 | 6.084313 | 1.474008 | 3.721 | 11.55471 |
| YRTBOND | 2971 | 8.188854 | 2.028928 | 5.047 | 20.955 |
| INDOJIBON | 2971 | 5.608955 | 1.373478 | 3.20861 | 11.97222 |
| JIBOR1W | 2971 | 5.944626 | 1.349811 | 3.8044 | 10.50028 |
| JIBOR1MO | 2971 | 6.590463 | 1.443273 | 3.9716 | 11.79167 |
| JIBOR3MO | 2971 | 6.986121 | 1.470088 | 4.19 | 12.59722 |
| JIBOR6MO | 2971 | 7.291413 | 1.503186 | 4.4196 | 13.44444 |
| JIBOR12MO | 2971 | 7.53949 | 1.530414 | 4.82 | 14.25 |
. mi misstable summarize, all
| Obs<. | ||||||
| Variable | Obs=. | Obs>. | Obs<. | Unique Values | Min | Max |
| Date | 2971 | >500 | 17,533 | 21,913 | ||
| MOLIBOR | 2971 | >500 | 22,285 | 4.8187 | ||
| MOTBILL | 669 | 2302 | >500 | 3.721 | 11.5547 | |
| YRTBOND | 2971 | >500 | 5047 | 20.955 | ||
| INDOJIBON | 2971 | >500 | 3.2086 | 11.9722 | ||
| JIBOR1W | 2971 | >500 | 3.8044 | 10.5002 | ||
| JIBOR1MO | 2971 | >500 | 3.9716 | 11.7916 | ||
| JIBOR3MO | 2971 | >500 | 4.19 | 12.5972 | ||
| JIBOR6MO | 2971 | >500 | 4.4196 | 13.4444 | ||
| JIBOR12MO | 2971 | >500 | 4.82 | 14.25 |
. mi impute regress MOTBILL JIBOR1W JIBOR1MO JIBOR3MO JIBOR6MO, add(660) rseed(1234)
| Univariate imputation | Imputations = | 660 |
| Linear regression | added = | 660 |
| Imputed: m = 1 through m = 660 | updated = | 0 |

| Variable | Observations per m | |||
|---|---|---|---|---|
| Complete | Incomplete | Imputed | Total | |
| MOTBILL | 2302 | 669 | 669 | 2971 |
(Complete + incomplete = total; imputed is the minimum across m of the number of filled-in observations).
- 2.
- Basel-indicator-based approach
Illustration—interconnectedness (securities outstanding)

Bank A’s securities outstanding score is the result of each component compared with the whole banking system in the country:
Secured debt (2000) + Senior unsecured (4000) + Subordinated (1000) + Equity market cap (2500)/Total in banking wide (127,500) = 745
Domestic Indicators


Systemic Score
| Bank | Size | Interconnectedness | Complexity | Total Systemic Score |
| 33.3% | 33.3% | 33.3% | ||
| A | 1732 | 937 | 705 | 1125 |
| B | 1030 | 341 | 273 | 548 |
| ….. | ….. | ….. | ….. | ….. |
| ….. | ….. | ….. | ….. | ….. |
| Z | 217 | 53 | 23 | 98 |
| Total system | 10,000 | 10,000 | 10,000 | 10,000 |
Bank A final systemic score is derived from:
Size (1732 × 33.3%) + interconnectedness (937 × 33.3%) + complexity (705 × 33.3%) = 1125
- 3.
- Spearman rho correlation
| CoVaR15 | CoVaR16 | CoVaR17 | CoVaR18 | Mes15 | Mes16 | Mes17 | Mes18 | Srisk15 | Srisk16 | Srisk17 | Srisk18 | Bsl15 | Bsl16 | Bsl17 | Bsl18 | |
| CoVaR15 | 1.0000 | |||||||||||||||
| CoVaR16 | −0.0857 | 1.0000 | ||||||||||||||
| CoVaR17 | 0.7714 | −0.2000 | 1.0000 | |||||||||||||
| CoVaR18 | 0.8286 | 0.0857 | 0.9429 | 1.0000 | ||||||||||||
| Mes15 | −1.0000 | −1.0000 | −0.8000 | −0.8000 | 1.0000 | |||||||||||
| Mes16 | −0.6000 | −0.7000 | −0.2000 | −0.6000 | 0.4000 | 1.0000 | ||||||||||
| Mes17 | −0.8000 | −0.8000 | −0.6000 | −0.6000 | −0.1000 | 0.8000 | 1.0000 | |||||||||
| Mes18 | −0.5000 | −0.5000 | −0.6000 | 0.5000 | 0.7000 | 0.6571 | 0.5000 | 1.0000 | ||||||||
| Srisk15 | −1.0000 | −1.0000 | 0.5000 | −1.0000 | 0.0000 | 0.8000 | 1.0000 | 1.0000 | 1.0000 | |||||||
| Srisk16 | 0.0000 | 0.0000 | 0.0000 | 0.0000 | 0.0000 | 0.5000 | 1.0000 | 0.5000 | −0.4000 | 1.0000 | ||||||
| Srisk17 | 0.0000 | 0.0000 | 0.0000 | 0.0000 | 0.0000 | −1.0000 | −1.0000 | −1.0000 | −1.0000 | −1.000 | 1.0000 | |||||
| Srisk18 | 0.0000 | 0.0000 | 0.0000 | 0.0000 | 0.0000 | 1.0000 | 1.0000 | 1.0000 | −0.2000 | 0.8000 | −1.0000 | 1.0000 | ||||
| Bsl15 | 0.4000 | 0.4000 | 0.0000 | 0.0000 | 0.6000 | −0.8000 | −0.3714 | 0.5000 | −1.0000 | 1.0000 | 0.0000 | 1.0000 | 1.0000 | |||
| Bsl16 | 0.4000 | 0.4000 | 0.0000 | 0.0000 | 0.6000 | −0.7000 | −0.9000 | 0.0286 | 0.5000 | −0.5000 | 0.0000 | 0.5000 | 0.9833 | 1.0000 | ||
| Bsl17 | 0.4000 | 0.4000 | 0.0000 | 0.0000 | 0.6000 | −0.7000 | −0.9000 | 0.2571 | 0.5000 | −0.5000 | 0.0000 | 0.5000 | 0.9500 | 0.9515 | 1.0000 | |
| Bsl18 | 0.4000 | 0.4000 | 0.0000 | 0.0000 | 0.6000 | −0.7000 | −0.9000 | 0.2571 | 0.5000 | −0.5000 | 0.0000 | 0.5000 | 0.9500 | 0.9515 | 1.0000 | 1.0000 |
| 1 | The Basel Committee on Banking Supervision agreed to review the framework every 3 years. As a result, the standard was revised in July 2013, and the latest update was issued in July 2018. |
References
- Acharya, Viral, Robert Engle, and Matthew Richardson. 2012. Capital Shortfall: A New Approach to Ranking and Regulating Systemic Risks. American Economic Review 102: 59–64. [Google Scholar] [CrossRef] [Green Version]
- Acharya, Viral V., Lasse H. Pedersen, Thomas Philippon, and Matthew Richardson. 2017. Measuring Systemic Risk. Review of Financial Studies 30: 2–47. [Google Scholar] [CrossRef]
- Adrian, Tobias, and Markus K. Brunnermeier. 2016. CoVaR. American Economic Review 106: 1705–41. [Google Scholar] [CrossRef]
- Akhter, Selim, and Kevin Daly. 2017. Contagion risk for Australian banks from global systemically important banks: Evidence from extreme events. Economic Modelling 63: 191–205. [Google Scholar] [CrossRef]
- Allen, Franklin, and Douglas Gale. 2000. Financial Contagion. Journal of Political Economy 108: 1–33. [Google Scholar] [CrossRef]
- Ayomi, Sri, and Bambang Hermanto. 2013. Systemic Risk and Financial Linkages Measurement in the Indonesian Banking. Bulletin of Monetary Economics and Banking 16: 91–114. [Google Scholar] [CrossRef]
- Bank Indonesia. 2014. PBI No.16/11/PBI/2014 Tentang Pengaturan dan Pengawasan Makroprudensial. Jakarta: Bank Indonesia. [Google Scholar]
- BCBS. 2010. An Assessment of the Long-Term Economic Impact of Stronger Capital and Liquidity Requirement. Basel: Bank for International Settlements. [Google Scholar]
- BCBS. 2011. Global Systemically Important Banks: Assessment Methodology and the Additional Loss Absorbency Requirement. Basel: Bank for International Settlements. [Google Scholar]
- BCBS. 2012. A Framework for Dealing with Domestic Systemically Important Banks. Basel: Bank for International Settlements. [Google Scholar]
- BCBS. 2013. Global Systemically Important Banks: Updated Assessment Methodology and the Higher Loss Absorbency Requirement. Basel: Bank for International Settlements. [Google Scholar]
- BCBS. 2014. The G-SIB Assessment Methodology—Score Calculation. Basel: Bank for International Settlements. [Google Scholar]
- BCBS. 2018. Global Systemically Important Banks: Revised Assessment Methodology and the Higher Loss Absorbency Requirement. Basel: Bank for International Settlements. [Google Scholar]
- Belluzzo, Tommaso. 2020. Systemic Risk. Available online: https://github.com/TommasoBelluzzo/SystemicRisk/releases/tag/v3.0.0 (accessed on 5 November 2020).
- Bengtsson, Elias, Ulf Holmberg, and Kristian Jonsson. 2013. Identifying Systemically Important Banks in Sweden—What do Quantitative Indicators Tell Us? Stockholm: Sveriges Riksbank. [Google Scholar]
- Benoit, Sylvain, Gilbert Colletaz, and Christophe Hurlin. 2011. A Theoretical and Empirical Comparison of Systemic Risk Measures: MES versus CoVaR. SSRN Electronic Journal. [Google Scholar] [CrossRef]
- Billio, Monica, Mila Getmansky, Andrew W. Lo, and Loriana Pelizzon. 2012. Econometric measures of connectedness and systemic risk in the finance and insurance sectors. Journal of Financial Economics 104: 535–59. [Google Scholar] [CrossRef]
- Bisias, Dimitrios, Mark Flood, Andrew W. Lo, and Stavros Valavanis. 2012. A Survey of Systemic Risk Analytics. Annual Review of Financial Economics 4: 255–96. [Google Scholar] [CrossRef] [Green Version]
- Brämer, Patrick, and Horst Gischer. 2013. An Assessment Methodology for Domestic Systemically Important Banks in Australia. The Australian Economic Review 46: 140–59. [Google Scholar] [CrossRef]
- Brownlees, Christian, and Robert F. Engle. 2017. SRISK: A Conditional Capital Shortfall Measure of Systemic Risk. Review of Financial Studies 30: 48–79. [Google Scholar] [CrossRef]
- Caballero, Ricardo. 2010. The “Other” Imbalance and The Financial Crisis. Cambridge, MA: National Bureau of Economic Research. [Google Scholar]
- Daly, Kevin, Jonathan A. Batten, Anil V. Mishra, and Tonmoy Choudhury. 2019. Contagion risk in global banking sector. Journal of International Financial Markets, Institutions and Money. [Google Scholar] [CrossRef]
- De Bandt, Olivier, and Philipp Hartmann. 2000. Systemic Risk: A Survey. St. Louis: Federal Reserve Bank of St Louis. [Google Scholar]
- Dias, Alexandra. 2014. Semiparametric estimation of multi-asset portfolio tail risk. Journal of Banking & Finance 49: 398–408. [Google Scholar] [CrossRef] [Green Version]
- ECB. 2009. Financial Stability Review. Frankfurt: European Central Bank, pp. 134–42. [Google Scholar]
- Eisenberg, Larry, and Thomas H. Noe. 2001. Systemic Risk in Financial Systems. Management Science 47: 236–49. [Google Scholar] [CrossRef]
- Elsinger, Helmut, Alfred Lehar, and Martin Summer. 2006a. Risk Assessment for Banking Systems. Management Science 52: 1301–14. [Google Scholar] [CrossRef] [Green Version]
- Elsinger, Helmut, Alfred Lehar, and Martin Summer. 2006b. Using Market Information for Banking System Risk Assessment. International Journal of Central Banking 2. [Google Scholar] [CrossRef] [Green Version]
- Fadhlan, Kandrika P. 2015. Risiko Sistemik Perbankan Indonesia: Kausalitas Granger dan Analisis Sentralitas. Yogyakarta: Skripsi, Universitas Gadjah Mada. [Google Scholar]
- FSB, IMF, and BIS. 2009. Guidance to Assess the Systemic Importance of Financial Institutions, Markets and Instruments: Initial Considerations. Washington, DC: International Monetary Fund, Basel: Bank for International Settlements and Financial Stability Board. [Google Scholar]
- Gai, Prasanna, and Sujit Kapadia. 2010. Contagion in financial networks. Proceedings of the Royal Society A: Mathematical, Physical and Engineering Sciences 466: 2401–23. [Google Scholar] [CrossRef] [Green Version]
- Gai, Prasanna, Andrew Haldane, and Sujit Kapadia. 2011. Complexity, concentration and contagion. Journal of Monetary Economics 58: 453–70. [Google Scholar] [CrossRef]
- Huang, Xin, Hao Zhou, and Haibin Zhu. 2009. A framework for assessing the systemic risk of major financial institutions. Journal of Banking & Finance 33: 2036–49. [Google Scholar] [CrossRef] [Green Version]
- Jobst, Andreas A. 2014. Measuring systemic risk-adjusted liquidity (SRL)—A model approach. Journal of Banking & Finance 45: 270–87. [Google Scholar] [CrossRef]
- Jobst, Andreas, and Dale Gray. 2013. Systemic Contingent Claims Analysis—Estimating Market-Implied Systemic Risk. Washington, DC: International Monetary Fund. [Google Scholar]
- Jorion, Philippe. 2007. Value at Risk: The New Benchmark for Managing Financial Risk, 3rd ed. New York: Mc-Graw-Hill. [Google Scholar]
- Krause, Andreas, and Simone Giansante. 2012. Interbank lending and the spread of bank failures: A network model of systemic risk. Journal of Economic Behavior & Organization 83: 583–608. [Google Scholar] [CrossRef] [Green Version]
- Laeven, Luc, and Fabián Valencia. 2013. Systemic Banking Crises Database. IMF Economic Review 61: 225–70. [Google Scholar] [CrossRef] [Green Version]
- Muharam, Harjum, and Erwin Erwin. 2017. Measuring Systemic Risk of Banking in Indonesia: Conditional Value at Risk Model Application. Signifikan: Jurnal Ilmu Ekonomi 6. [Google Scholar] [CrossRef]
- OJK. 2015. Determination of Systemically Important Banks and Capital Surcharges; POJK No. 46/POJK.03/2015; Edited by Otoritas Jasa Keuangan. Jakarta: Otoritas Jasa Keuangan.
- OJK. 2016a. Business Activities and Network of Commercial Banks based on Core Capital; POJK No. 6/POJK.03/2016; Edited by Otoritas Jasa Keuangan. Jakarta: Otoritas Jasa Keuangan.
- OJK. 2016b. Minimum Capital Requirement for Commercial Banks; POJK No. 11/POJK.03/2016; Edited by Otoritas Jasa Keuangan. Jakarta: Otoritas Jasa Keuangan.
- OJK. 2018. Systemic Bank and Capital Surcharge; POJK No. 2/POJK.03/2018; Edited by Otoritas Jasa Keuangan. Jakarta: Otoritas Jasa Keuangan.
- Reinhart, Carmen, and Kenneth Rogoff. 2008. Banking Crises: An Equal Opportunity Menace. Washington, DC: CEPR Centre for Economic Policy Research. [Google Scholar]
- Rizwan, Muhammad Suhail, Ghufran Ahmad, and Dawood Ashraf. 2020. Systemic risk: The impact of COVID-19. Finance Research Letters 36: 101682. [Google Scholar] [CrossRef]
- Rocco, Marco. 2014. Extreme Value Theory in Finance: A Survey. Journal of Economic Surveys 28: 82–108. [Google Scholar] [CrossRef] [Green Version]
- Segoviano, Miguel A., and Charles Goodhart. 2009. Banking Stability Measures. St. Louis: IMF. [Google Scholar]
- Wibowo, Buddi. 2017. Systemic risk, bank’s capital buffer, and leverage. Economic Journal of Emerging Markets 9: 150–58. [Google Scholar] [CrossRef] [Green Version]
- Zebua, Alfredo. 2011. Analisis Risiko Sistemik Perbankan Indonesia. Bogor: Institut Pertanian Bogor. [Google Scholar]
Figure 1.
Systemic risk averages.

Figure 2.
Kendall’s W rankings.

Table 1.
Basel Adjusted Indicators.
| Category and Weighting | BCBS G-SIB | Indicator Weighting | Category Weighting | Adjusted Indicators D-SIB | Indicator Weighting |
|---|---|---|---|---|---|
| Size (20%) | Total exposures | 20% | Size (33.3%) | Total exposures | 100% |
| Interconnectedness (20%) | Intrafinancial system assets | 6.67% | Interconnectedness (33.3%) | Intrafinancial system assets | 33.3% |
| Intrafinancial system liabilities | 6.67% | Intrafinancial system liabilities | 33.3% | ||
| Securities outstanding | 6.67% | Securities outstanding | 33.3% | ||
| Complexity (20%) | Notional amount of over-the-counter (OTC) derivatives | 6.67% | Complexity (33.3%) | Notional amount of over-the-counter (OTC) derivatives | 25% |
| Level 3 assets | 6.67% | Trading and available-for-sale securities | 25% | ||
| Trading and available-for-sale securities | 6.67% | Domestic indicators | 25% | ||
| Substitutability (payment system and custodian) | 25% | ||||
| Substitutability (20%) | Assets under custody | 6.67% | |||
| Payment activity | 6.67% | ||||
| Underwritten transactions in debt and equity markets | 3.33% | ||||
| Trading volume | 3.33% | ||||
| Cross-jurisdictional activity (20%) | Cross-jurisdictional claims | 10% | |||
| Cross-jurisdictional liabilities | 10% |
Table 2.
Sample banks.
| No. | TICKER | BANK | BUKU |
|---|---|---|---|
| 1 | BBCA | PT. Bank Central Asia Tbk. | 4 |
| 2 | BBRI | PT. Bank Rakyat Indonesia (Persero) Tbk. | 4 |
| 3 | BMRI | PT. Bank Mandiri (Persero) Tbk. | 4 |
| 4 | BBNI | PT. Bank Negara Indonesia (Persero) Tbk. | 4 |
| 5 | MEGA | PT. Bank Mega Tbk. | 3 |
| 6 | MAYA | PT. Bank Mayapada Internasional Tbk. | 3 |
| 7 | BNLI | PT. Bank Permata Tbk. | 3 |
| 8 | BDMN | PT. Bank Danamon Indonesia Tbk. | 3 |
| 9 | PNBN | PT. Bank Pan Indonesia Tbk. | 3 |
| 10 | NISP | PT. Bank OCBC NISP Tbk. | 3 |
| 11 | BNGA | PT. Bank CIMB Niaga Tbk. | 4 |
| 12 | BTPN | PT. Bank BTPN Tbk. | 3 |
| 13 | BNII | PT. Bank Maybank Indonesia Tbk. | 3 |
| 14 | BJBR | PT. Bank Pembangunan Daerah Jawa Barat Tbk. | 3 |
| 15 | BBTN | PT. Bank Tabungan Negara (Persero) Tbk. | 3 |
| 16 | BSIM | PT. Bank Sinarmas Tbk. | 2 |
| 17 | BJTM | PT. Bank Pembangunan Daerah Jawa Timur Tbk. | 3 |
| 18 | SDRA | PT. Bank Woori Saudara Indonesia Tbk. | 2 |
| 19 | BACA | PT. Bank Capital Indonesia Tbk. | 2 |
| 20 | AGRO | PT. BRI Agroniaga Tbk. | 2 |
| 21 | CCBI | PT. Bank China Construction Indonesia Tbk. | 2 |
| 22 | BBKP | PT. Bank Bukopin Tbk. | 3 |
| 23 | BABP | PT. Bank MNC Internasional Tbk. | 2 |
| 24 | BKSW | PT. Bank QNB Indonesia Tbk. | 2 |
| 25 | INPC | PT. Bank Artha Graha Internasional Tbk. | 2 |
| 26 | BNBA | PT. Bank Bumi Arta Tbk. | 2 |
| 27 | BVIC | PT. Bank Victoria Internasional Tbk. | 2 |
Table 3.
Descriptive statistics of systemic risk.
| Stats | Beta | VaR | ES | CoVaR | ΔCoVaR | MES | SRISK |
|---|---|---|---|---|---|---|---|
| mean | 1.129854 | 3.45 × 10⁷ | 8.06 × 10⁷ | 7,689,775 | 948.8452 | 2.67 × 10⁷ | 459,073.1 |
| max | 1.68771 | 7.60 × 10⁷ | 2.33 × 10⁸ | 6.73 × 10⁷ | 2200.084 | 6.82 × 10⁷ | 2,894,598 |
| min | 0.4221394 | 1.18 × 10⁷ | 2.51 × 10⁷ | −195,820 | 260.8946 | 7,327,341 | 0 |
| sd | 0.1931884 | 1.24 × 10⁷ | 2.65 × 10⁷ | 7,948,986 | 409.0613 | 1.10 × 10⁷ | 585,642.8 |
| variance | 0.0373217 | 1.54 × 10¹⁴ | 7.04 × 10¹⁴ | 6.32 × 10¹³ | 167,331.2 | 1.20 × 10¹⁴ | 3.43 × 10¹¹ |
| se(mean) | 0.0035461 | 227,512.5 | 486,926.4 | 145,908.2 | 7.508557 | 201,388.5 | 10,749.81 |
| cv | 0.1709853 | 0.3594899 | 0.3290485 | 1.033709 | 0.4311149 | 0.4114864 | 1.275707 |
| skewness | −0.6543876 | 0.5895252 | 0.2660278 | 2.260526 | 0.5894564 | 0.5057055 | 1.402021 |
Table 4.
CoVaR.
| Banks | 2008 | 2009 | 2010 | 2011 | 2012 | 2013 | ||||||
| % to sys | Rank | % to sys | Rank | % to sys | Rank | % to sys | Rank | % to sys | Rank | % to sys | Rank | |
| BCA | 30.0% | 2 | 25.4% | 1 | 26.6% | 1 | 21.7% | 2 | 30.9% | 1 | 25.1% | 1 |
| BRI | 15.8% | 3 | 9.0% | 4 | 9.7% | 4 | 10.1% | 5 | 6.4% | 6 | 10.7% | 3 |
| BMRI | 30.9% | 1 | 17.0% | 2 | 19.7% | 2 | 22.4% | 1 | 16.9% | 2 | 22.5% | 2 |
| BNI | 6.1% | 4 | 9.2% | 3 | 8.5% | 5 | 10.2% | 4 | 8.1% | 4 | 8.7% | 4 |
| MEGA | 1.1% | 8.0% | 5 | 1.8% | 2.0% | 2.1% | 1.7% | |||||
| BDMN | 1.5% | 1.6% | 2.0% | 1.7% | 1.4% | 2.1% | ||||||
| PNBN | 0.9% | 1.2% | 1.0% | 1.5% | 1.1% | 1.1% | ||||||
| BJBR | 3.5% | 5.7% | 6 | 10.5% | 3 | 10.3% | 3 | 11.4% | 3 | 7.3% | 5 | |
| BTN | 0.0% | 1.2% | 3.0% | 2.2% | 2.3% | 3.1% | ||||||
| BSIM | 0.4% | 0.6% | 5.0% | 6 | 3.2% | 1.2% | 0.8% | |||||
| BJTM | 0.1% | 0.1% | 0.1% | 0.2% | 7.1% | 5 | 6.2% | 6 | ||||
| SDRA | 1.4% | 2.9% | 2.1% | 2.9% | 2.4% | 2.3% | ||||||
| BACA | 2.1% | 3.6% | 3.5% | 4.1% | 2.6% | 2.5% | ||||||
| AGRO | 0.2% | 1.1% | 0.5% | 0.5% | 0.5% | 0.6% | ||||||
| CCBI | 1.5% | 4.4% | 0.7% | 0.4% | 0.3% | 0.7% | ||||||
| BBKP | 1.7% | 2.2% | 2.1% | 3.2% | 2.0% | 2.2% | ||||||
| MNC | 1.2% | 4.3% | 1.7% | 2.1% | 1.8% | 1.0% | ||||||
| Others—10 banks | 1.5% | 2.5% | 1.3% | 1.3% | 1.3% | 1.5% | ||||||
| Banks | 2014 | 2015 | 2016 | 2017 | 2018 | 2019 | ||||||
| % to sys | Rank | % to sys | Rank | % to sys | Rank | % to sys | Rank | % to sys | Rank | % to sys | Rank | |
| BCA | 19.0% | 2 | 24.7% | 1 | 14.9% | 3 | 20.1% | 1 | 20.6% | 1 | 19.7% | 1 |
| BRI | 9.9% | 4 | 11.3% | 3 | 7.0% | 5 | 9.3% | 5 | 7.9% | 5 | 7.5% | 5 |
| BMRI | 19.4% | 1 | 20.9% | 2 | 14.0% | 4 | 16.9% | 2 | 18.9% | 2 | 15.2% | 3 |
| BNI | 11.4% | 3 | 8.6% | 5 | 6.7% | 6 | 10.5% | 3 | 10.2% | 4 | 9.6% | 4 |
| MEGA | 2.2% | 1.6% | 1.3% | 3.2% | 2.4% | 1.9% | ||||||
| BDMN | 2.0% | 1.9% | 1.3% | 3.7% | 1.8% | 1.8% | ||||||
| PNBN | 1.4% | 1.1% | 0.9% | 1.3% | 1.6% | 1.4% | ||||||
| BJBR | 9.7% | 5 | 8.9% | 4 | 23.5% | 1 | 9.4% | 4 | 11.9% | 3 | 16.9% | 2 |
| BTN | 2.9% | 1.4% | 2.6% | 2.2% | 3.2% | 2.5% | ||||||
| BSIM | 1.5% | 1.4% | 0.8% | 5.0% | 2.5% | 2.6% | ||||||
| BJTM | 7.9% | 6 | 6.3% | 6 | 17.2% | 2 | 6.5% | 6 | 7.0% | 6 | 6.0% | 6 |
| SDRA | 2.8% | 2.2% | 1.7% | 2.6% | 3.3% | 5.7% | 7 | |||||
| BACA | 3.4% | 3.2% | 1.9% | 2.8% | 3.4% | 2.5% | ||||||
| BBKP | 2.3% | 1.8% | 2.3% | 2.6% | 2.5% | 2.7% | ||||||
| MNC | 1.3% | 1.2% | 1.1% | 1.0% | 0.8% | 0.8% | ||||||
| Others—12 banks | 2.9% | 3.5% | 2.6% | 2.8% | 2.2% | 3.1% | ||||||
Table 5.
Marginal expected shortfall (MES).
| Banks | 2008 | 2009 | 2010 | 2011 | 2012 | 2013 | ||||||
| % to sys | Rank | % to sys | Rank | % to sys | Rank | % to sys | Rank | % to sys | Rank | % to sys | Rank | |
| BCA | 10.77% | 3 | 8.00% | 4 | 7.12% | 5 | 5.29% | 8 | 9.79% | 1 | 6.77% | 6 |
| BRI | 16.51% | 1 | 6.99% | 6 | 8.00% | 2 | 6.52% | 6 | 5.62% | 7 | 8.45% | 2 |
| BMRI | 15.55% | 2 | 7.50% | 5 | 8.33% | 1 | 7.06% | 5 | 7.76% | 3 | 7.75% | 3 |
| BNI | 9.88% | 4 | 13.02% | 1 | 6.89% | 6 | 10.18% | 1 | 1.20% | 10.51% | 1 | |
| BDMN | 6.67% | 6 | 6.77% | 7 | 7.75% | 3 | 4.56% | 6.50% | 5 | 6.93% | 4 | |
| PNBN | 8.37% | 5 | 6.60% | 9 | 6.74% | 7 | 8.01% | 2 | 9.74% | 2 | 6.91% | 5 |
| BTPN | 1.20% | 5.10% | 11 | 3.31% | 5.77% | 7 | 4.05% | 4.23% | ||||
| Maybank | 1.38% | 5.01% | 12 | 3.61% | 4.16% | 3.34% | 2.56% | |||||
| BJBR | 0.64% | 0.95% | 6.42% | 8 | 4.99% | 5.80% | 6 | 3.14% | ||||
| BTN | 0.09% | 2.92% | 7.63% | 4 | 4.65% | 4.28% | 5.77% | 7 | ||||
| BSIM | 0.19% | 0.28% | −0.45% | 7.63% | 3 | 2.57% | 0.71% | |||||
| SDRA | 4.41% | 5.81% | 10 | 4.56% | 5.28% | 9 | 3.80% | 3.89% | ||||
| AGRO | 2.83% | 6.79% | 7 | 3.41% | 2.41% | 3.92% | 2.18% | |||||
| BBKP | 5.66% | 7 | 6.77% | 8 | 5.32% | 9 | 7.17% | 4 | 7.00% | 4 | 5.22% | 8 |
| MNC | 2.44% | 9.24% | 2 | 1.19% | 0.07% | 3.45% | 3.78% | |||||
| BAG | 0.98% | 4.98% | 3.59% | 5.16% | 10 | 1.78% | 2.08% | |||||
| BNBA | 3.94% | 3.47% | 2.11% | 2.27% | 2.25% | 1.65% | ||||||
| BVIC | 3.47% | 8.75% | 3 | 3.38% | 3.88% | 4.45% | 4.00% | |||||
| Others—9 banks | 8.92% | −5.51% | 13.17% | 7.22% | 13.43% | 12.30% | ||||||
| Banks | 2014 | 2015 | 2016 | 2017 | 2018 | 2019 | ||||||
| % to sys | Rank | % to sys | Rank | % to sys | Rank | % to sys | Rank | % to sys | Rank | % to sys | Rank | |
| BCA | 5.27% | 7 | 7.49% | 4 | 4.07% | 6.27% | 4 | 4.45% | 5.21% | 9 | ||
| BRI | 7.90% | 2 | 9.89% | 2 | 6.01% | 6 | 8.14% | 3 | 6.36% | 6 | 5.77% | 7 |
| BMRI | 7.02% | 3 | 8.72% | 3 | 5.58% | 8 | 5.83% | 6 | 7.33% | 3 | 5.50% | 8 |
| BNI | 12.10% | 1 | 10.80% | 1 | 8.33% | 1 | 12.23% | 2 | 11.22% | 1 | 10.36% | 2 |
| MEGA | 1.93% | 1.39% | 0.48% | 6.16% | 5 | 3.07% | 2.04% | |||||
| BDMN | 6.75% | 4 | 6.69% | 5 | 6.03% | 5 | 17.08% | 1 | 6.83% | 5 | 6.05% | 5 |
| PNBN | 6.54% | 5 | 5.14% | 8 | 4.94% | 1.81% | 5.99% | 7 | 6.88% | 4 | ||
| BTPN | 3.84% | 2.63% | 1.97% | 3.96% | 3.70% | 3.91% | ||||||
| BJBR | 4.68% | 4.75% | 5.10% | 9 | −0.61% | 2.61% | −0.28% | |||||
| BTN | 6.43% | 6 | 3.10% | 7.27% | 3 | 3.04% | 8.08% | 2 | 5.21% | 10 | ||
| BJTM | 2.57% | 3.19% | 7.01% | 4 | 0.73% | 1.91% | 1.79% | |||||
| SDRA | 4.12% | 2.65% | 2.03% | 2.79% | 1.97% | 3.92% | ||||||
| BACA | 1.62% | 5.18% | 7 | 4.12% | 2.38% | 2.55% | 2.17% | |||||
| BNGA | 2.55% | 1.67% | 3.20% | 2.26% | 3.69% | 3.95% | ||||||
| AGRO | 3.25% | 3.16% | 7.94% | 2 | 3.85% | 3.46% | 8.88% | 3 | ||||
| BBKP | 4.96% | 4.13% | 5.78% | 7 | 5.06% | 7 | 5.95% | 8 | 5.82% | 6 | ||
| MNC | 3.73% | 5.65% | 6 | 4.15% | 2.55% | 1.31% | 1.35% | |||||
| BVIC | 2.10% | 4.04% | 2.92% | 3.89% | 6.96% | 4 | 12.75% | 1 | ||||
| Others—9 banks | 12.64% | 9.71% | 13.06% | 12.60% | 12.56% | 8.70% | ||||||
Table 6.
SRISK.
| Banks | 2008 | 2009 | 2010 | 2011 | 2012 | 2013 | ||||||
| % to sys | Rank | % to sys | Rank | % to sys | Rank | % to sys | Rank | % to sys | Rank | % to sys | Rank | |
| BMRI | 31.14% | 1 | 0.00% | 0.00% | 0.00% | 0.00% | 0.00% | |||||
| BNI | 29.17% | 2 | 16.13% | 3 | 0.00% | 7.43% | 3 | 0.00% | 39.87% | 1 | ||
| BNLI | 11.30% | 4 | 24.24% | 2 | 31.85% | 2 | 27.93% | 2 | 0.00% | 0.00% | ||
| PNBN | 0.00% | 0.00% | 0.00% | 2.47% | 70.17% | 1 | 22.02% | 3 | ||||
| BNGA | 24.61% | 3 | 44.70% | 1 | 67.64% | 1 | 49.54% | 1 | 0.00% | 0.00% | ||
| BJBR | 0.00% | 13.67% | 4 | 0.00% | 0.00% | 3.83% | 0.00% | |||||
| BTN | 0.00% | 0.00% | 0.00% | 0.00% | 0.00% | 26.72% | 2 | |||||
| BJTM | 0.00% | 0.00% | 0.00% | 5.75% | 4 | 0.00% | 0.00% | |||||
| BBKP | 2.81% | 0.00% | 0.00% | 4.04% | 18.48% | 2 | 4.55% | |||||
| BAG | 0.88% | 1.26% | 0.51% | 2.45% | 1.95% | 2.56% | ||||||
| BVIC | 0.00% | 0.00% | 0.00% | 0.39% | 5.57% | 3 | 4.29% | |||||
| OTHERS—16 BANKS | 0.00% | 0.00% | 0.00% | 0.00% | 0.00% | 0.00% | ||||||
| Banks | 2014 | 2015 | 2016 | 2017 | 2018 | 2019 | ||||||
| % to sys | Rank | % to sys | Rank | % to sys | Rank | % to sys | Rank | % to sys | Rank | % to sys | Rank | |
| BNI | 0.00% | 23.91% | 2 | 26.65% | 2 | 26.11% | 2 | 40.78% | 1 | 49.14% | 1 | |
| BNGA | 19.62% | 2 | 26.94% | 1 | 12.77% | 4 | 0.00% | 11.45% | 4 | 10.52% | 4 | |
| BTPN | 0.00% | 0.00% | 0.00% | 0.00% | 0.00% | 1.97% | ||||||
| Maybank | 0.00% | 7.52% | 5 | 0.00% | 0.00% | 0.26% | 1.44% | |||||
| BJBR | 16.16% | 3 | 10.77% | 4 | 0.00% | 0.00% | 0.00% | 0.00% | ||||
| BTN | 43.27% | 1 | 13.48% | 3 | 28.09% | 1 | 0.00% | 28.55% | 2 | 20.15% | 2 | |
| BBKP | 1.84% | 6.62% | 6 | 13.36% | 3 | 52.75% | 1 | 13.36% | 3 | 10.94% | 3 | |
| BAG | 9.18% | 4 | 5.30% | 7 | 3.81% | 14.51% | 3 | 2.38% | 1.79% | |||
| BNBA | 0.93% | 0.32% | 0.46% | 0.00% | 0.00% | 0.00% | ||||||
| BVIC | 8.19% | 5 | 5.13% | 8 | 4.37% | 6.63% | 4 | 3.22% | 3.35% | |||
| BACA | 0.81% | 0.00% | 0.58% | 0.00% | 0.00% | 0.00% | ||||||
| AGRO | 0.00% | 0.00% | 0.00% | 0.00% | 0.00% | 0.70% | ||||||
| PNBN | 0.00% | 0.00% | 9.90% | 0.00% | 0.00% | 0.00% | ||||||
| OTHERS—14 BANKS | 0.00% | 0.00% | 0.00% | 0.00% | 0.00% | 0.00% | ||||||
Table 7.
Basel-indicator-based approach (top 25 banks).
| Jun-15 | Dec-15 | Jun-16 | Dec-16 | Jun-17 | Dec-17 | Jun-18 | Dec-18 | ||||||||
|---|---|---|---|---|---|---|---|---|---|---|---|---|---|---|---|
| Name | Systemic Score | Name | Systemic Score | Name | Systemic Score | Name | Systemic Score | Name | Systemic Score | Name | Systemic Score | Name | Systemic Score | Name | Systemic Score |
| BANK 2 | 1408 | BANK 2 | 1321 | BANK 2 | 1242 | BANK 2 | 1248 | BANK 2 | 1224 | BANK 2 | 1219 | BANK 2 | 1222 | BANK 2 | 1219 |
| BANK 1 | 1100 | BANK 1 | 1155 | BANK 1 | 1158 | BANK 1 | 1115 | BANK 1 | 1126 | BANK 1 | 1158 | BANK 1 | 1153 | BANK 1 | 1158 |
| BANK 6 | 957 | BANK 6 | 960 | BANK 6 | 1040 | BANK 6 | 1084 | BANK 6 | 1105 | BANK 6 | 1079 | BANK 6 | 1116 | BANK 6 | 1079 |
| BANK 3 | 564 | BANK 3 | 670 | BANK 3 | 694 | BANK 3 | 750 | BANK 3 | 733 | BANK 3 | 759 | BANK 3 | 798 | BANK 3 | 759 |
| BANK 9 | 376 | BANK 9 | 399 | BANK 9 | 379 | BANK 9 | 355 | BANK 9 | 347 | BANK 9 | 372 | BANK 9 | 364 | BANK 9 | 372 |
| BANK 4 | 309 | BANK 19 | 327 | BANK 19 | 316 | BANK 19 | 333 | BANK 19 | 328 | BANK 19 | 316 | BANK 19 | 330 | BANK 19 | 316 |
| BANK 18 | 301 | BANK 24 | 279 | BANK 24 | 279 | BANK 4 | 267 | BANK 73 | 268 | BANK 4 | 266 | BANK 73 | 274 | BANK 4 | 266 |
| BANK 24 | 296 | BANK 4 | 274 | BANK 4 | 275 | BANK 24 | 261 | BANK 4 | 255 | BANK 73 | 266 | BANK 4 | 248 | BANK 73 | 266 |
| BANK 19 | 285 | BANK 8 | 268 | BANK 8 | 274 | BANK 8 | 250 | BANK 8 | 254 | BANK 8 | 247 | BANK 32 | 232 | BANK 8 | 247 |
| BANK 5 | 273 | BANK 18 | 252 | BANK 5 | 242 | BANK 73 | 236 | BANK 24 | 250 | BANK 24 | 219 | BANK 11 | 230 | BANK 24 | 219 |
| BANK 29 | 246 | BANK 79 | 251 | BANK 7 | 226 | BANK 7 | 229 | BANK 7 | 226 | BANK 7 | 218 | BANK 12 | 219 | BANK 7 | 218 |
| BANK 8 | 243 | BANK 5 | 239 | BANK 73 | 224 | BANK 11 | 214 | BANK 32 | 224 | BANK 11 | 218 | BANK 7 | 213 | BANK 11 | 218 |
| BANK 11 | 224 | BANK 29 | 216 | BANK 29 | 221 | BANK 12 | 207 | BANK 12 | 215 | BANK 32 | 209 | BANK 24 | 211 | BANK 32 | 209 |
| BANK 12 | 223 | BANK 12 | 209 | BANK 18 | 215 | BANK 18 | 203 | BANK 11 | 213 | BANK 12 | 205 | BANK 8 | 200 | BANK 12 | 205 |
| BANK 73 | 207 | BANK 11 | 205 | BANK 11 | 210 | BANK 5 | 200 | BANK 29 | 194 | BANK 29 | 185 | BANK 5 | 187 | BANK 29 | 185 |
| BANK 7 | 193 | BANK 7 | 201 | BANK 12 | 193 | BANK 29 | 185 | BANK 5 | 173 | BANK 5 | 180 | BANK 29 | 184 | BANK 5 | 180 |
| BANK 79 | 171 | BANK 73 | 194 | BANK 79 | 186 | BANK 79 | 185 | BANK 81 | 165 | BANK 79 | 172 | BANK 20 | 165 | BANK 79 | 172 |
| BANK 37 | 146 | BANK 37 | 144 | BANK 21 | 142 | BANK 37 | 162 | BANK 79 | 158 | BANK 37 | 171 | BANK 21 | 161 | BANK 37 | 171 |
| BANK 21 | 132 | BANK 21 | 134 | BANK 37 | 142 | BANK 20 | 152 | BANK 20 | 153 | BANK 20 | 165 | BANK 79 | 150 | BANK 20 | 165 |
| BANK 81 | 129 | BANK 20 | 123 | BANK 20 | 127 | BANK 81 | 147 | BANK 37 | 151 | BANK 21 | 146 | BANK 37 | 147 | BANK 21 | 146 |
| BANK 10 | 113 | BANK 10 | 110 | BANK 10 | 109 | BANK 21 | 138 | BANK 21 | 140 | BANK 81 | 144 | BANK 10 | 105 | BANK 81 | 144 |
| BANK 20 | 113 | BANK 13 | 105 | BANK 13 | 107 | BANK 10 | 106 | BANK 10 | 103 | BANK 10 | 105 | BANK 75 | 100 | BANK 10 | 105 |
Table 8.
Kendall’s correlation of the theoretical and Basel models.
| CoVaR15 | CoVaR16 | CoVaR17 | CoVaR18 | Mes15 | Mes16 | Mes17 | Mes18 | Srisk15 | Srisk16 | Srisk17 | Srisk18 | |
|---|---|---|---|---|---|---|---|---|---|---|---|---|
| CoVaR15 | 1.0000 | |||||||||||
| CoVaR16 | 0.0667 | 1.0000 | ||||||||||
| CoVaR17 | 0.6000 | −0.0667 | 1.0000 | |||||||||
| CoVaR18 | 0.7333 | 0.0667 | 0.8667 | 1.0000 | ||||||||
| Mes15 | −1.0000 | −1.0000 | −0.6667 | −0.6667 | 1.0000 | |||||||
| Mes16 | −0.4000 | −0.6000 | −0.2000 | −0.4000 | 0.3333 | 1.0000 | ||||||
| Mes17 | −0.6667 | −0.6667 | −0.3333 | −0.3333 | 0.0000 | 0.6000 | 1.0000 | |||||
| Mes18 | −0.3333 | −0.3333 | 0.3333 | 0.3333 | 0.6000 | 0.6000 | 0.4000 | 1.0000 | ||||
| Srisk15 | . | . | . | . | . | 0.6667 | . | 1.0000 | 1.0000 | |||
| Srisk16 | . | . | . | . | . | 0.3333 | . | 0.3333 | −0.3333 | 1.0000 | ||
| Srisk17 | . | . | . | . | . | . | . | . | . | . | 1.0000 | |
| Srisk18 | . | . | . | . | . | 1.0000 | . | 1.0000 | 0.0000 | 0.6667 | . | 1.0000 |
| Bsl15 | 0.3333 | 0.3333 | 0.0000 | 0.0000 | 0.4667 | −0.6667 | −0.3333 | 0.4000 | . | . | . | . |
| Bsl16 | 0.3333 | 0.3333 | 0.0000 | 0.0000 | 0.4667 | −0.6000 | −0.8000 | 0.0667 | 0.3333 | −0.3333 | . | 0.3333 |
| Bsl17 | 0.3333 | 0.3333 | 0.0000 | 0.0000 | 0.4667 | −0.6000 | −0.8000 | 0.2000 | 0.3333 | −0.3333 | . | 0.3333 |
| Bsl18 | 0.3333 | 0.3333 | 0.0000 | 0.0000 | 0.4667 | −0.6000 | −0.8000 | 0.2000 | 0.3333 | −0.3333 | . | 0.3333 |
| Bsl15 | Bsl16 | Bsl17 | Bsl18 | |||||||||
| Bsl15 | 1.0000 | |||||||||||
| Bsl16 | 0.9444 | 1.0000 | ||||||||||
| Bsl17 | 0.8889 | 0.8667 | 1.0000 | |||||||||
| Bsl18 | 0.8889 | 0.8667 | 1.0000 | 1.0000 |
Publisher’s Note: MDPI stays neutral with regard to jurisdictional claims in published maps and institutional affiliations. |
© 2021 by the authors. Licensee MDPI, Basel, Switzerland. This article is an open access article distributed under the terms and conditions of the Creative Commons Attribution (CC BY) license (https://creativecommons.org/licenses/by/4.0/).
Share and Cite
MDPI and ACS Style
Salim, M.Z.; Daly, K. Modelling Systemically Important Banks vis-à-vis the Basel Prudential Guidelines. J. Risk Financial Manag. 2021, 14, 295. https://0-doi-org.brum.beds.ac.uk/10.3390/jrfm14070295
AMA Style
Salim MZ, Daly K. Modelling Systemically Important Banks vis-à-vis the Basel Prudential Guidelines. Journal of Risk and Financial Management. 2021; 14(7):295. https://0-doi-org.brum.beds.ac.uk/10.3390/jrfm14070295
Chicago/Turabian StyleSalim, M. Zulkifli, and Kevin Daly. 2021. "Modelling Systemically Important Banks vis-à-vis the Basel Prudential Guidelines" Journal of Risk and Financial Management 14, no. 7: 295. https://0-doi-org.brum.beds.ac.uk/10.3390/jrfm14070295