
Political Participation in the Risk Society: The Italian Case


1
Department of Political Science, University of Genoa, 16125 Genoa, Italy
2
C.I.E.L.I., The Italian Centre of Excellence on Logistics Transports and Infrastructures, 16126 Genoa, Italy
3
Centro de Investigaciones en Econometría, CIE University of Buenos Aires, Buenos Aires 1650, Argentina
*
Author to whom correspondence should be addressed.
J. Risk Financial Manag. 2021, 14(9), 435; https://0-doi-org.brum.beds.ac.uk/10.3390/jrfm14090435
Submission received: 7 August 2021
/
Revised: 19 August 2021
/
Accepted: 6 September 2021
/
Published: 9 September 2021
(This article belongs to the Special Issue Politics, Democracy and Participation: What Role in the Society of Risk)
Abstract
:The risk society has profoundly changed our way of life. Among the social phenomena most affected by its effects is undoubtedly political participation and the degree of trust in institutions. This work aims, through the construction of two different indices, to answer the question “How does the risk society influence conventional participation and trust in institutions?”. The Indagine Multiscopo sulle famiglie and the Benessere Equo Sostenibile surveys provide a complete set of indicators to assess specific aspects of Italian daily life and well-being. This work uses a series of data from these surveys to analyze political participation and trust in institutions in Italy in 2019 at regional level using two composite indices obtained through the application of the MPI method. The result of this paper shows no particular effects of the risk society on conventional forms of political participation. Instead, the effects of the risk society are fully visible on levels of trust in institutions.
1. Introduction
Globalization, in addition to changing our way of life, has brought new risks and dangers to different societies. Indeed, while it has fostered exponential economic growth, it has contributed to increased environmental degradation and social inequalities (Borghesi and Vercelli 2003). With regard to risk since the end of the last century, a line of studies has been established. These studies define risk as the automatic result of the production of goods and technological progress caused by the modern capitalist economic model. Industrialization, in fact, because of its logic of unlimited exploitation of resources, is posing a risk of catastrophic change in the Earth’s climate with incalculable costs for all humanity (Gennip 2005). The increasing intensification of these risks has led to the inefficiency of their management by national and international institutions. The consequence has been the inability to balance the current situation due to the lack of rational means (Harries-Jones 2004). The most authoritative scholar and inventor of the risk society, Ulrich Beck et al. (1992), argues that today the change caused by the acceleration of globalization has meant that risks are no longer properly identified and managed. This has led to a reduction in public confidence in state institutions and markets (Mutti 2003). The German sociologist and other researchers of this line of studies also underline how economic, cultural, political and social globalization (Steger 2016) has led to the disappearance of the historical bipolarism between West and East. This new integration between the two different realities combined with new technological changes has led to the birth of new risks. This situation, while benefiting a small group of people, weighs entirely on most of the population, generating strong global inequalities (Beck and Sandrelli 2016). As has already been said, today’s society is surrounded by new risks due to the intensification of globalization, risk which may jeopardize the lives of all the world’s population. Indeed, while on the one hand the improvement in the quality of life due to the decrease in the risk of morbidity and mortality has led to an increase in levels of health, prosperity and happiness (Pinker 2018), on the other hand, this has fostered the growth of risks not strictly related to primary needs.
These risks, defined by Beck et al. (1992) as mega-risks, concern the consequences on the environment caused by the development model adopted and of which today’s society is uninsured. These mega-risks are changing the international political framework. In fact, according to the German sociologist, new policies for life will soon spread, thanks to which civil society will seek to reaffirm its rights generated by the new global order. Thirty years have passed since Beck’s predictions, but they have been fully realized. Just think of the birth of movement such as Fridays for Future and the new international and European awareness on environmental issues and sustainable development, of which the Agenda 2030 and the European Green Deal are examples. According to sociologists of risk society, in fact, only local and multilateral bottom-up participation could neutralize and take control of the risks aggravated by neoliberal ideology (Harries-Jones 2004).
1.1. Political Participation
Firstly, however, it is necessary to define and analyze this bottom-up political participation in order to understand how this phenomenon could be the solution to the challenges posed by the risk society. Political participation is a multidimensional phenomenon rich in different facets and for this reason can be defined in different ways. In this study we will refer to the definition of Pasquino (1997): “We speak of political participation when within a given political system or organization—of which you are part or aspire to be part—through a set of attitudes and concrete behavior you take part, i.e., you try to influence (more or less legally) the decision of the holders of political power and their own selection with a view to preserving or modifying the structure, and therefore the values of the system of dominant interests”. It is now possible to proceed with the analysis of the fundamental components of this phenomenon. In the case of political participation, there are four components and they are: the forms, intensity, selectivity and motivation of participation (Calise et al. 2016). As for the first component, the forms of political participation, political involvement is expressed through different types. In fact, it is possible to participate in political life both directly (for example taking part in a political meeting or demonstration) and indirectly (for example, informing oneself of politics) (Cotta 1979; Raniolo 2007), but also in a conventional form or not (Milbrath 1977). In the following study, both direct and indirect forms of political participation will be taken into account to underline the importance of direct and indirect participation. However, only indicators of conventional participation will be analyzed, i.e., all those forms of participative, institutionalized action. Therefore, all forms of non-conventional participation will not be analyzed i.e., those forms of action that take place without the intermediation of institutional actors and that provide a certain degree of conflict (Quaranta 2012). Since they are not recognized by the institutions and often by law, they are difficult to measure in quantitative terms.
As for the intensity of the participatory phenomenon, over the years many researchers have carried out numerous studies to determine how many citizens take an active part in the political life of the community of reference. One of the most widely used ways is undoubtedly electoral participation. It is the way in which the individual freely chooses whether or not to participate. Recent quantitative studies have analyzed the relationship between political participation and electoral participation. These studies have shown that there is no correlation between, and therefore no link between, the two phenomena. Therefore, the citizens who actively participate in political life aren’t the same as those who go to vote (Ivaldi et al. 2016; Bartiromo 2021). Less recent studies in this field, on the other hand, focus mainly on the reason why people don’t go to vote. Many studies in fact argue that people do not go to the polling stations because they are convinced that they are not able to influence the political system (Downs 1957). Therefore, the elector—to remember the logical and non-logical action’s categories of Vilfredo Pareto (1935)—believes that there is no difference between voting and not voting because voting is a type of non-logical-action and, therefore, without instrumental consequences. Therefore, electoral participation is only one of the ways to measure political involvement, but not the only one. In this study, in fact, reference will be made to the concept of political participation in its broader definition—previously analyzed—and not to the electoral one specifically.
The selectivity of political participation, the third component of this phenomenon, has as its objective the construction of the identity of the citizen who takes an active part in political life. Numerous classifications have been made over the years, but the most famous are those operated by Milbrath (1977) and Almond and Verba (1965). Both classifications are based on an increasingly orderly scale of political commitment which corresponds to a progressive decrease of the people involvement. Finally, as concerns the motivations of participation, the objective is to find the answer to the question “Why don’t people participate?”. The most important study in this field of study is that carried out by Verba et al. (1995), who identified three different reasons: (a) they cannot; (b) they don’t want; (c) nobody asks them. Regarding the first category, they cannot, the researchers emphasize how deprived socio-economic conditions correspond to processes of depoliticization and alienation of individuals and groups (this theory is called socioeconomic status theory). As for the “don’t want”, instead, the motivations are linked to the individual psychological sphere. Individual attitudes and orientations, in fact, are the result of various factors such as, for example, the social context of reference and the processes of socialization carried out by the individual. Finally, people do not participate when “no one asks them” i.e., when individuals remain isolated from associations and organizational networks or even in the presence of political party de-structuring.
1.2. Trust in Institutions
As has already been said, however, the risk society has an impact not only on political participation, but also on the degree of trust in citizens’ institutions. In fact, trust in national institutions has been reduced due to the inability of government to respond to the increasing risks, but above all mega-risks. Consequently, it is necessary to define and analyze institutional trust in order to understand this dynamic as in the case of political participation. However, there are few studies on institutional as opposed to so-called interpersonal or social trust. Trust is any assessment that a rational actor makes to decide to place a bet (Coleman 1990). Because of its nature, it is considered as a sub-category of risk, and it is therefore calculated by applying probability theory (Hudson 2006). Therefore, an individual will trust a certain institution on the basis of the probability it will execute its mandate satisfactorily and not below a predetermined critical threshold (Mishler and Rose 2001). That said, institutional trust can be defined as the perception that everyone possesses about the credibility, equity, competence and accountability of state institutions (Zmerli et al. 2007; Sønderskov and Dinesen 2015). There are two different theories as regards the determination of institutional trust: cultural theories and institutional theories (Inglehart 1997). Cultural theories support the exogenous nature of the phenomenon i.e., it is based on interpersonal trust. This theory implicates the relationship between socioeconomic factors and levels of trust and, therefore, may reflect differences in socialization based on gender or education level (Hudson 2006). Institutional theories, on the other hand, see trust as something endogenous and therefore influenced by the institutions’ work (Hetherington 1998; Munger and North 1991). Consequently, Newton’s conclusion (Newton 1999) was that between institutional trust and social trust there is no relationship. By contrast, other researchers have remarked that social trust is often strongly influenced by institutional trust. Social trust, in fact, is mediate by the perception that individuals have towards the equity and effectiveness of state institutions (Rothstein and Stolle 2008; You 2012; Sønderskov and Dinesen 2014; Wang and Gordon 2011; Sønderskov and Dinesen 2015).
1.3. Literature Review
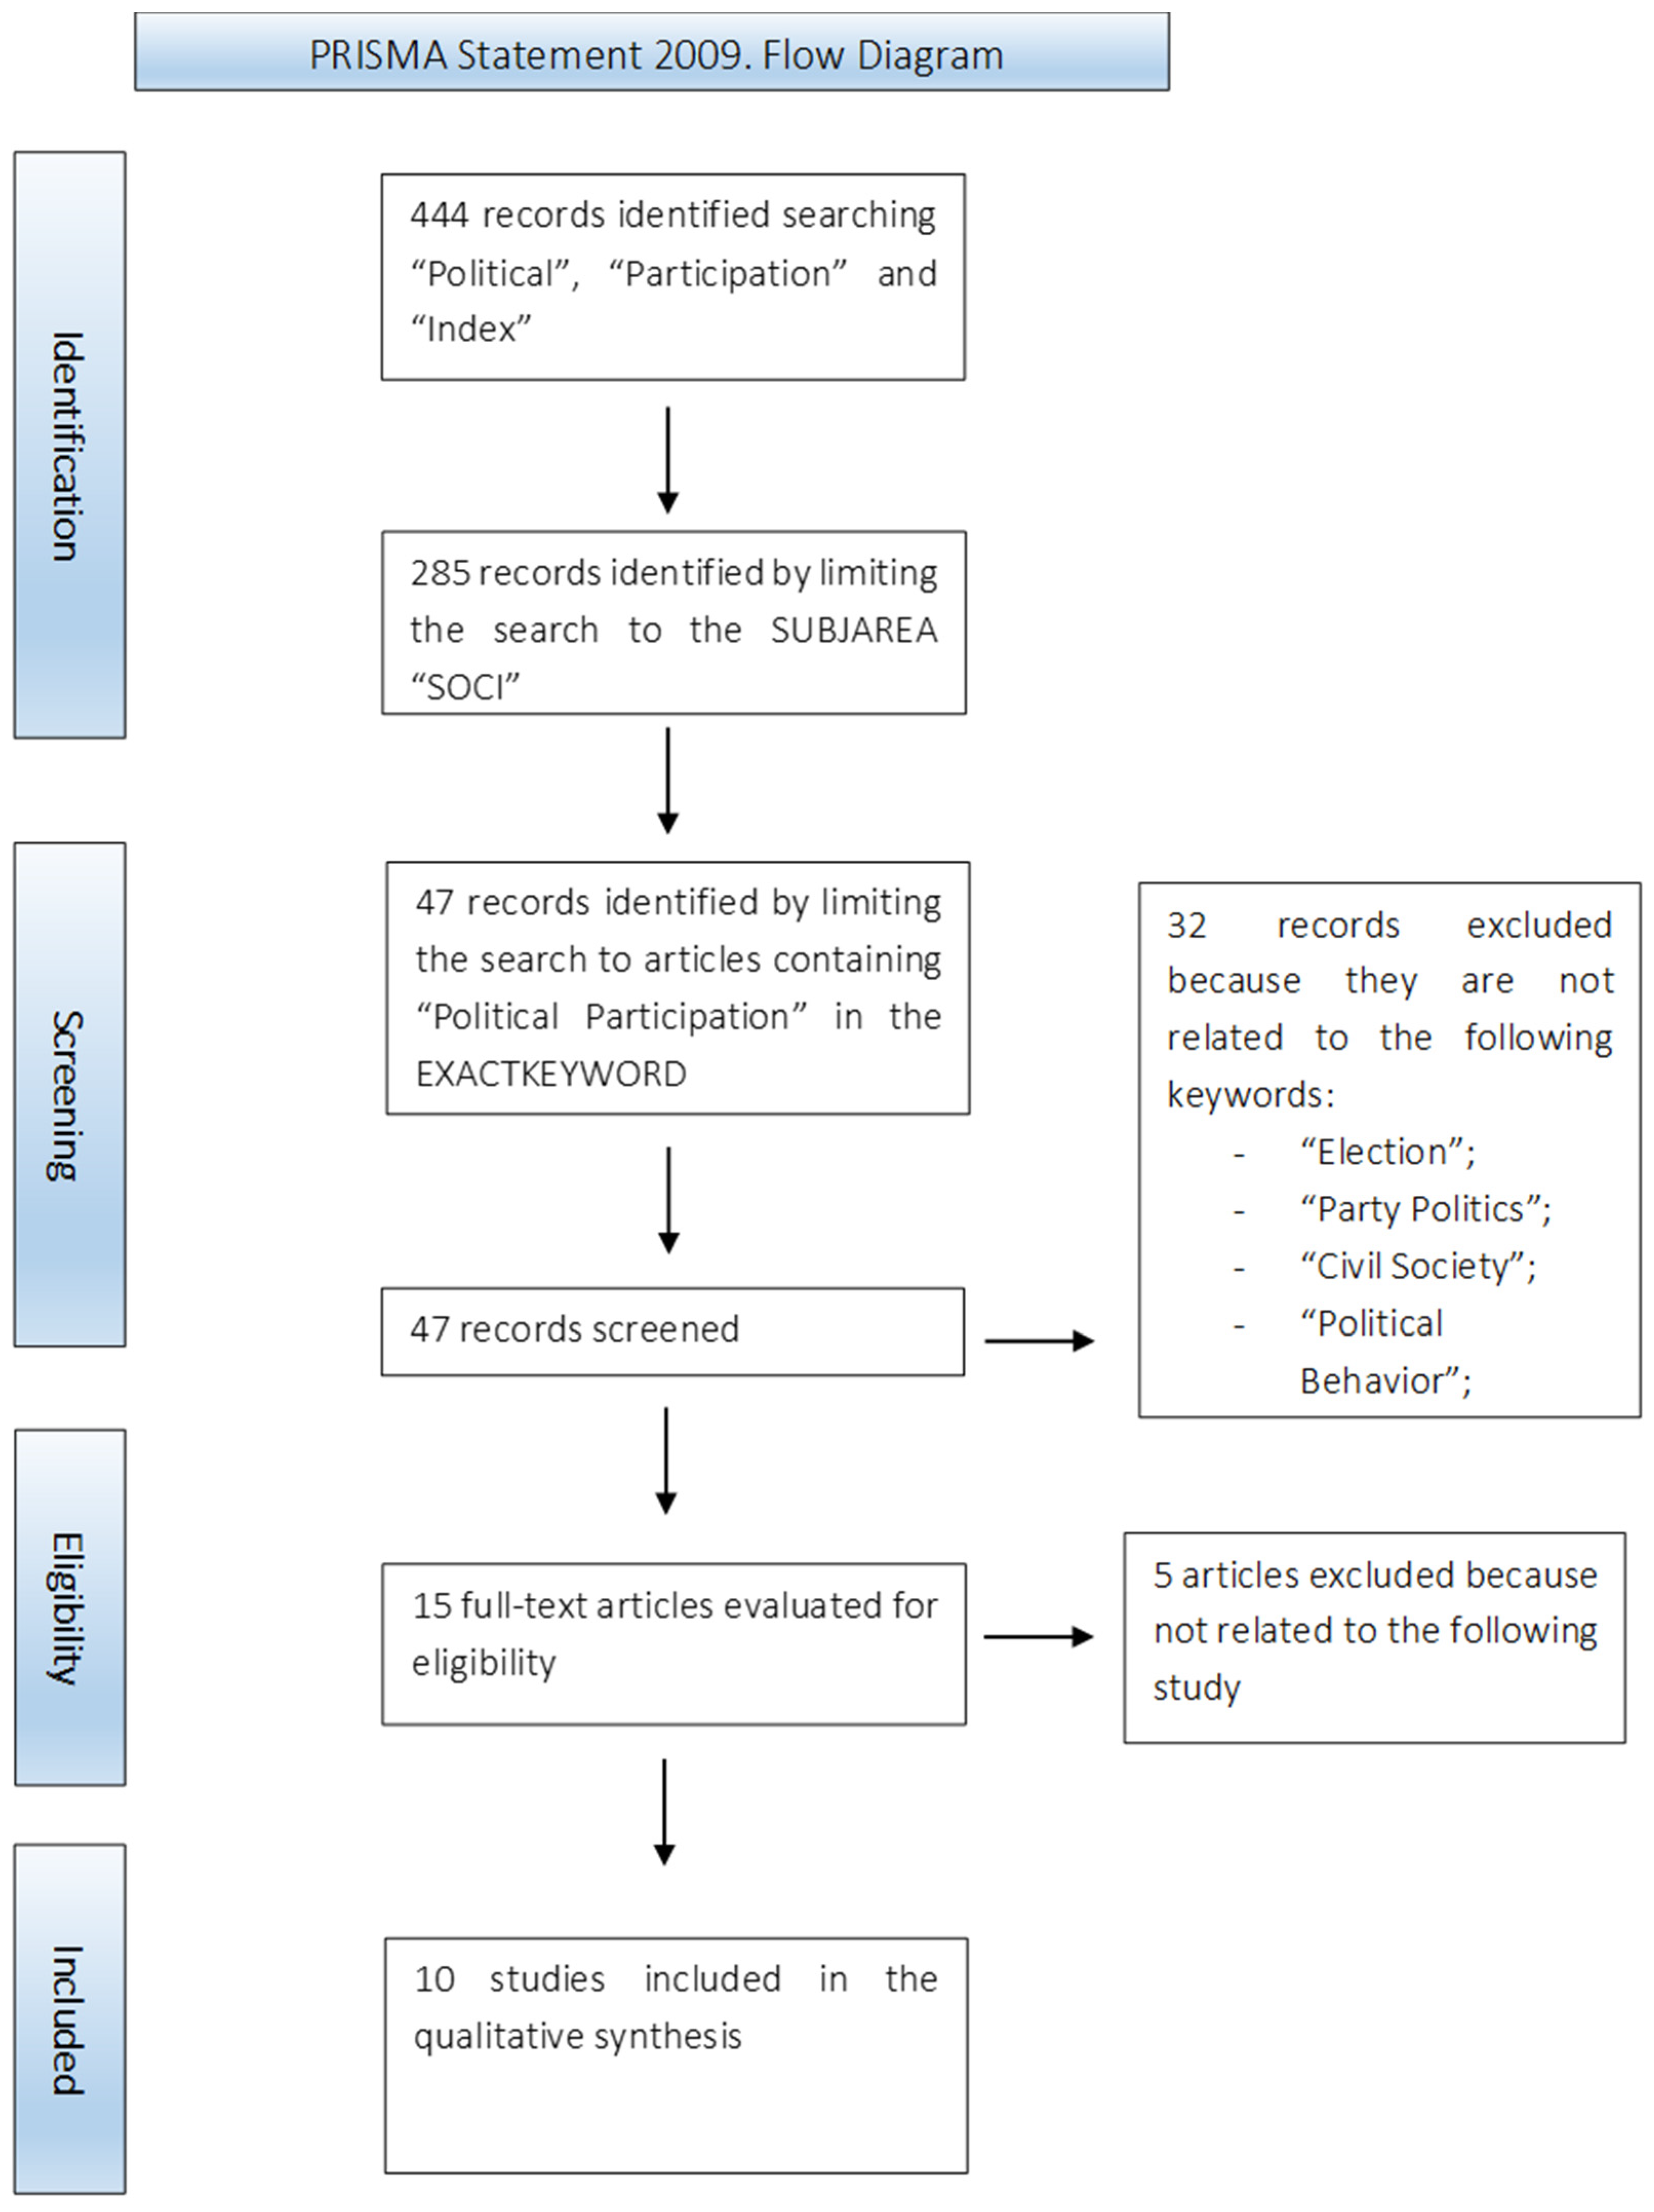
Once the participatory phenomenon has been defined, in order to be able to analyze it, it is necessary to use social indicators to study its complexity. The first phase to be followed in the construction of a social indicator is to have a solid theoretical framework, which allows us to have a clear view of the phenomenon to be measured (OECD 2008). This systematic research was carried out on the Scopus database, based on the approach proposed by the PRISMA Statement (Liberati et al. 2015), which allows us to trace all the steps of the selection of studies. The first phase followed was the identification of some keywords. These last ones have been chosen based on the scope of the search and, therefore, the following words have been inserted in the database “POLITICAL” AND “PARTICIPATION” AND “INDEX” narrowing the field to the articles containing such words in the title, the abstract and the keywords. This research returned 444 results. However, since they are so numerous that they cannot be analyzed in their entirety, the field has been further narrowed by limiting the research to the SUBJAREA “SOCI”. The following research yielded 285 results, showing that there are still too many papers to be examined. For this reason, the results were limited to those containing the term “POLITICAL PARTICIPATION” in the EXACTKEYWORD. Of the 47 resulting documents, 32 have been deleted, excluding all the works not related with the following keywords: “POLITICS”, “PARTY POLITICS”, “CIVIL SOCIETY”, “INDEX” and “POLITICAL BEHAVIOR”. Finally, of the 15 resulting documents, three were excluded as they were not related to the following study (Figure 1).
From the research on the Scopus database many studies have been obtained not strictly related to the following work and with the construction of indicators of political participation. However, it has been chosen to take them into account in the analysis of literature as they open up new interesting research scenarios. In general, research has shown that in recent years studies on political participation are focusing on gender and social inequalities (Amin and Sabermahani 2017; Koenen et al. 2006; Mlambo and Kapingura 2019; Sundström et al. 2017; Yadav 2009). Most of them, in order to measure the degree of political participation, define this phenomenon as the proportion of political office held by women (Amin and Sabermahani 2017; Koenen et al. 2006; Mlambo and Kapingura 2019; Sundström et al. 2017). Koenen et al. (2006), in addition to women in elected office, also consider women’s voter registration and women’s voter turnout. These studies also open up interesting reflections with a view to sustainable development, showing how much has been done to achieve Goals 5 of the Agenda 2030. In addition, it opens up new perspectives for research into the political condition of women, also with a view to sustainable development. Finally, Yadav (2009) provides an excellent picture of the political situation of women in Yemen by making the reader reflect on what is necessary to implement in order to try to change the situation and ensure equal opportunities. Another line of studies in recent years on political participation has focused on elections and on the political behavior of voters. As mentioned above, this study will not analyze electoral participation and, therefore, electoral behavior. However, the studies from the research on Scopus are useful to confirm the complexity and multidimensionality of the participatory phenomenon (Dash et al. 2019; Franko 2015; Madden 2020). Madden (2020) in particular builds an index of the degree of support of the political party by relating it to the variables of income, age and education classification to study the Irish elections of 2016. Dash et al. (2019) study three dimensions of electoral competition: (a) contestability in the struggle for governing power; (b) competition among candidates at the constituency level; (c) competition among existing parties at the level of the legislature. Finally, Franko (2015) studies the link between electoral participation and inequality. Like previous studies, this work is not closely linked to the concept of political participation as defined in this study. However, Franko deals with an interesting topic: income inequalities in relation to electoral participation. Walker et al. (2015) open with their study an interesting link between political participation, understood as a component of democracy, and accessibility to health services. Using the Economist Intelligence Unit Democracy Index, the Freedom House Freedom Scale, the Polity Democracy scale and the Polity Autocracy Scale, they demonstrate how political participation can affect the accessibility of health services. However, the most interesting study obtained from the research is that of Ivaldi et al. (2016), from which the indicators of this work have been chosen and which will be analyzed in the next section.
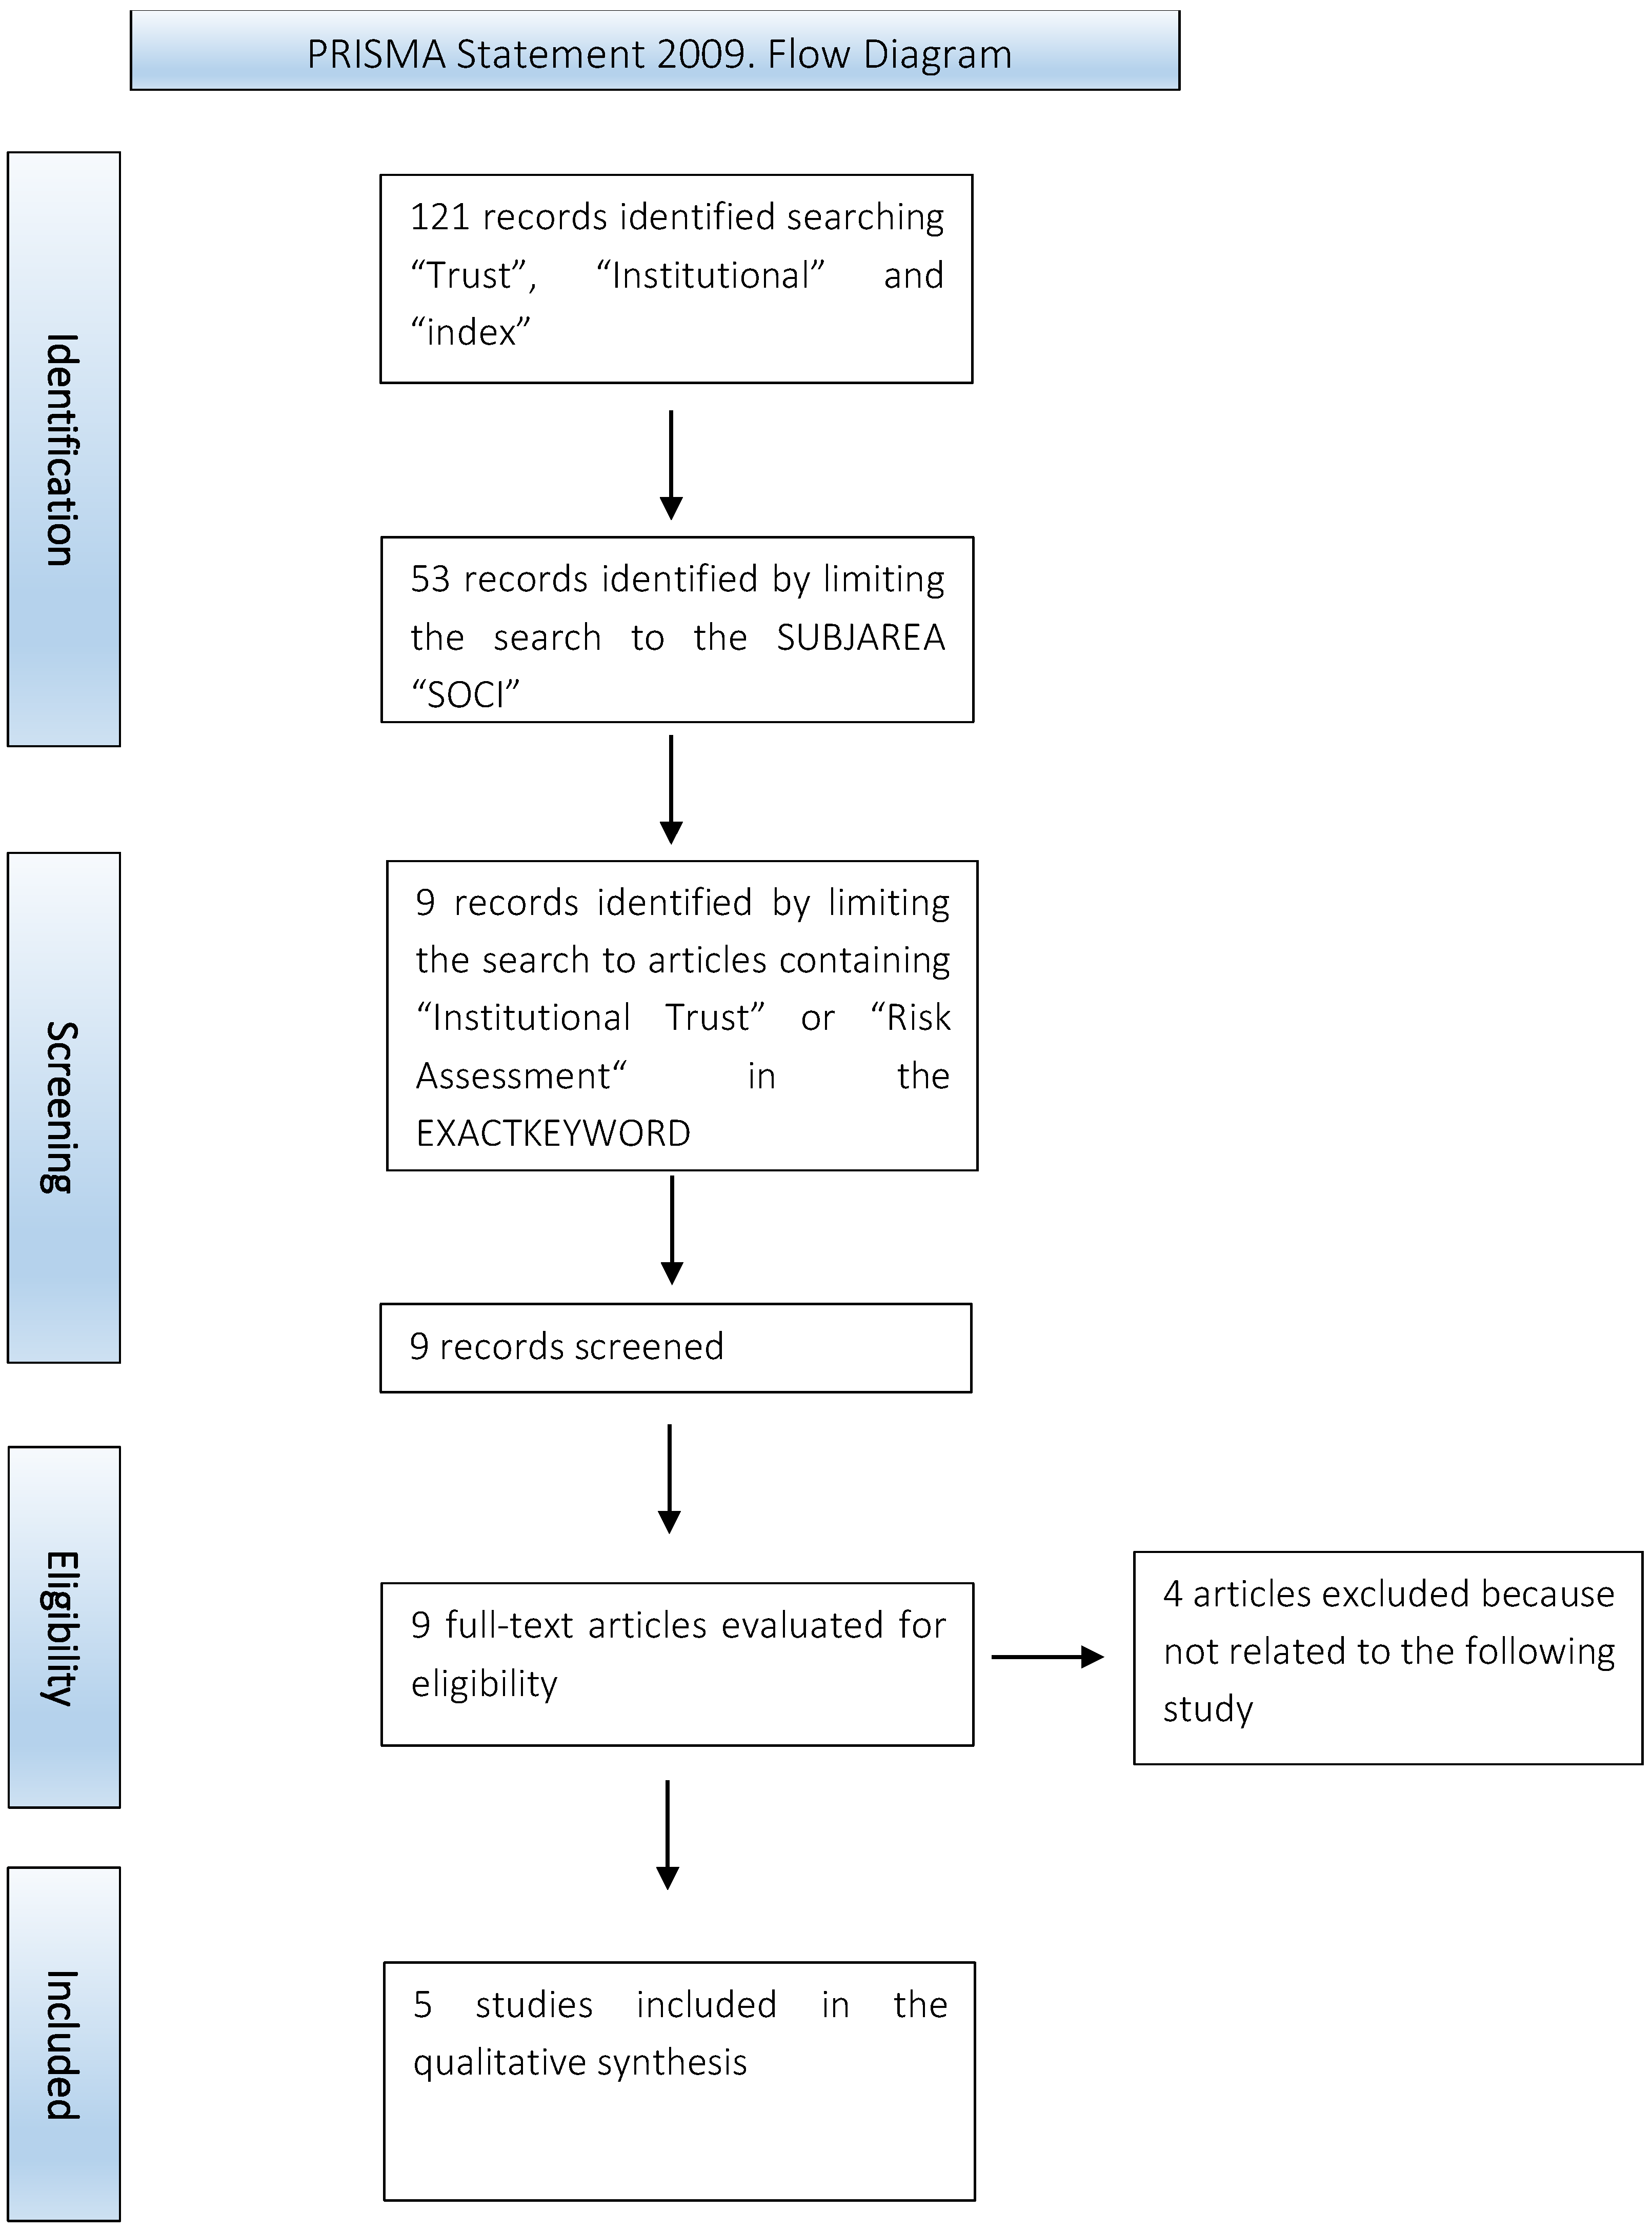
As already done for the political participation, some researches have been carried out on the database Scopus in order to construct the theoretical framework of reference. First, the following words “TRUST” and “INSTITUTIONAL” and “INDEX” were inserted into the Scopus database, narrowing the field to the title, abstract and keywords. In this way 121 results have been obtained: too many to be analyzed in its entirety. Therefore, the search was restricted to the SUBJAREA “SOCI”. The search yielded 53 results and, therefore, it has been limited further to the results containing the terms “INSTITUTIONAL TRUST” and “RISK ASSESSMENT” in the EXACTKEYWORD. Nine documents were thus obtained. Finally, four documents were excluded as they were not related to the following study (Figure 2).
There are different types of institutional trust (Rothstein and Stolle 2008). Buriak et al. (2019) in their study focus on institutional trust towards banks to study the relationship between it and interpersonal trust. This work, through the modeling of structural equations, has shown how there is correlation between interpersonal and institutional trust towards banks. Indeed, individual informal beliefs and perceptions determined by cooperative behavior can significantly stimulate trust in institutions even as a result of significant regulation. The interesting aspect of this study is undoubtedly that it used, to study the institutional environment, indexes such as GDP per capita, the level of education, Rule of Law index and the Gini Index. They demonstrate that in economically developed countries with good education, well-developed legal system and a fair distribution of income, the impact on trust will be greater and therefore the impact of interpersonal trust on institutional trust will be greater. Trust in institutions can also be seen as a dimension of social capital. Koivusilta (2017) uses institutional trust to study the health effects on individuals’ participation in cultural activities mediated by social capital. The scholar, in fact, starts from the idea of how the construction of social capital and in particular the dimension of institutional trust serves to connect the structures of cultural opportunities with health. The investment in culture, in fact, can according to the scholar create an environment suitable for the development of trust in institutions and such trust can have effects on the health of people. Trust in institutions has been studied through trust in the country’s and European parliament, the legal system, the police, politicians, political parties and the United Nations. As will be seen in the next section, this study takes up some of the indicators used by Koivusilta: trust in parliament, trust in political parties and trust in other types of institution. The author’s results show that there is no high correlation between institutional trust and cultural indicators. However, one interesting outcome is the relationship between institutional trust and GDP. Indeed, it is shown that economic factors increase both prosperity and social capital and that these together have effects on health. Another older study is that of Mitchell and Bossert (2007). This study, in fact, analyzes the relationship between belonging, interpersonal and institutional trust, social capital and civil and health behavior in Nicaragua. The trust in institutions indicator is constructed in a similar way to the previous one, but is expanded with the trust in teachers, doctors and nurses. The most interesting result of this study is undoubtedly the correlation between institutional trust and political involvement. It will be interesting to see if this correlation, present in Nicaragua, will be confirmed also for the Italian case analyzed in this study. The concept of trust in institutions has also been used recently to study the link with corruption in post-Soviet countries (Habibov et al. 2017). Scholars, in fact, using two different indices of institutional trust, show that the increase in corruption has “erosive effects” on trust, thus undermining the development of economic institutions and civil society. As in Koivusilta’s (2017) study, previously analyzed, they take into account the trust towards parliament, political parties, the legal system and the police, but they also add indicators of trust in central, regional and local government. Finally, institutional trust can be used to measure regional development. Kaliuzhnova (2011) measures the impact of the institutions and trust in them on regional development. Like Koivusilta’s (2017) study, Kaliuzhnova emphasizes the relationship between economic growth and institutional trust. However, the latter bases its analysis mainly on previous studies and therefore on empirical and non-practical assumptions.
1.4. Objectives of the Work
The risk society, therefore, is a complex and transversal phenomenon, which directly and indirectly influences many social phenomena such as political participation and trust in institutions. The aim of this study is to answer the following question: “How does the risk society influence conventional forms of political participation and trust in institutions?”. Therefore, the analysis will focus on the effects of the risk society, in the sense proposed by Ulrich Beck, on levels of political participation and trust in institutions. For this reason, a quantitative risk measure will not be provided, but the effects on a society based on them will be analyzed qualitatively.
Two different composite indices will be built to measure the level of political participation and institutional trust achieved by the different Italian regions. In addition, the composite indices obtained will be correlated from each other in such a way as to analyze whether there is a relationship between the two phenomena.
2. Materials and Methods
Political participation and trust in institutions are two extremely complex social phenomena. To analyze this complexity, two different composite indices will be constructed.
The indicators used refer to the year 2019 for both indices and were derived from the Indagine Multiscopo sulle famiglie as regards political participation indicators, while institutional trust indictors have been extrapolated from Benessere Equo Sostenibile (BES) project. Indagine Multiscopo sulle famiglie is a sample survey conducted since 1993 by ISTAT with the aim of knowing the habits of Italian families, their problems and the degree of satisfaction of their social and economic conditions. The BES project, instead, was launched in 2010 to evaluate the progress of Italian society from an economic, social and environmental point of view. In addition, since 2016 it has been accompanied by indicators for monitoring of the sustainable development goals (SDGs) present in the United Nations Agenda 2030.
The indicators used in this study are as follows (Table 1):
The indicators of political participation used refer to the previous study by Ivaldi et al. (2016). They classify the level of political participation in the different Italian territorial contexts identifying a close correlation between the participatory phenomenon and electoral participation.
Mazziotta-Pareto Index (MPI)
The method of Mazziotta and Pareto (2007) was used to build the two indices of this study. The chosen method aims at the elaboration of a synthetic measure of a multidimensional phenomenon according to the hypothesis that each component is not replaceable with the others. For this reason, a penalty is introduced for all units that do not have balanced values with the indicators. To achieve this index there are several requirements to be met: (a) the standardization of indicators through a transformation criterion that allows freeing oneself from the unit of measurement and from the variability of the indicators (Delvecchio 1995); (b) the synthesis independent of an ideal unit, in how much the definition of a set of objective values is subjective, not univocal and can vary over time (Aureli Cutillo 1996); (c) the ease of calculation; (d) the ease of interpretation. In order for all indicators to oscillate within the same scale, it is necessary to transform each individual indicator into a standardized variable with an average of 100 and a standard deviation of 10. By making this standardization is obtained values within the range (70–130), which—according to the Bienaymé–Chebyschev theorem (Bienaymé 1853; Chebyshev 1936)—constitute at least 89% of the total of the terms of the distribution. In addition, the replacement of the target vector by the set of average values as a result of standardization allows the identification of units that deviate from the average set to 100. Therefore, it is now possible to correct the aggregation function by means of a penalty coefficient depending on the horizontal variability, i.e., the variability of the indicators with respect to the average value. The horizontal variability allows the units that show an unbalanced score with respect to the values of the indicators to be penalized.
There are several steps to calculate the MPI (Mazziotta and Pareto 2011). The first step is to standardize indicators using the following formula:
The vector of the coefficients of variation is then calculated:
Finally, to obtain the synthetic index of the i-th unit the following formula is applied:
As can be seen from the formula, in the following study the negative penalty version is used as in both phenomena studied increasing variations of the indicators correspond to positive variations of the indicator (Mazziotta and Pareto 2007; Mazziotta and Pareto 2012). For this reason, high index values correspond to high levels of participation and trust. One of the limitations of the MPI is that it is not possible to make an absolute relative comparison. In fact, the comparison over time can be of two types: absolute and relative (Mazziotta and Pareto 2013). A relative comparison is made when the composite index values at time t depend on one or more endogenous parameters such as mean and variance. Therefore, there is an absolute comparison when the index values depend on exogenous values such as the minimum and maximum of the individual variables analyzed (Mazziotta and Pareto 2017). Furthermore, the comparability of an index depends primarily on the method of normalization used. In fact, methods such as standardization, used in the MPI, allow only relative comparisons to be implemented because they are based only on the values of individual indicators at time t. Instead, methods such as the Min-Max transformation—used in the Adjusted Mazziotta Pareto Index (AMPI)—since they require goalposts allow to compare the indices absolutely (Tarantola 2008). However, “the price to be paid for having comparable indicators with different variability are aggregated” (Mazziotta and Pareto 2017).
3. Results
This section will report the results obtained through the construction of the two different indices of political and trust in institutions.
3.1. Political Participation Index
With regard to political participation, the following results have been obtained thanks to the application of the Mazziotta–Pareto Index (Table 2):
Once a composite index has been constructed, it is necessary to examine whether the results of a composite index are excessively influenced by a few indicators and thus to explain the importance of the individual sub-components analyzed (OECD 2008). Therefore, the second step followed was the validation of the index obtained, which allowed the measurement of its solidity and its discriminating capacity (Mazziotta and Pareto 2017). An index will be more robust and, therefore, more able to explain the phenomenon the more the value of the average rank shift will be close to 0. The index validation is divided into several steps: (a) first it was necessary to calculate several MPI indices subtracting from time to time all the variables; (b) at this point the corresponding ranks were assigned; (c) then, rank shift was calculated by the following formula:
The following results have been obtained (Table 3):
Excluded indicators showing a higher variation from the average rank (1.31) are “No discussing politics facts” (rank shift = 1.7), “No giving money to a political party” (rank shift = 1.8) and “No seeking information on politics” (rank shift = 1.7); while the” No listening to political debate” indicator shows an average of less than 1 (rank shift = 0.7).
3.2. Trust in Institutions Index
The application of the Mazziotta and Pareto method, regarding the trust in institutions index, has given the following results (Table 4).
As in the case of the political participation index, the validation of the index was carried out, which gave the following results (Table 5).
The excluded indicator that shows a greater variation from the average rank (2.23) is “No trust in other institutions” (rank shift = 2.65). While the other two indicators considered, “No trust in Parliament” and “No trust in political parties”, show a variation less than change in the average rank (respectively 2.05 and 2.65).
Finally, graphically representing the phenomenon gives the following cartogram (Figure 4).
3.3. Descriptive Statistics
In order to better analyze the two created indices, a table containing the main descriptive statistics has been constructed (Table 6). As can be seen, the trust in institutions index has a higher standard deviation (6.3) and variance (39.76). Therefore, it has a greater variability from the average value than the political participation index. It can be seen that even if the mean between the two indices is practically equal (mean political participation index = 99.28; mean trust in institutions index = 99.37), the range of the trust in institutions index (25.76) is higher than that of the political participation index (19.84). It is also interesting to note that the two different indices are specular in terms of skewness. In fact, in the case of the political participation index, there is a slight positive skewness (0.20), while in the case of the trust in institutions index it is slightly negative (−0.26). Finally, both indices have a negative kurtosis. This means that there is the presence of platykurtic distributions and, therefore, more values can be found close to the means and less on the tails of the distribution.
3.4. Correlation Political Participation Index—Trust in Institutions Index
Kendall’s tau-b correlation was used to determine the relationship between the level of political participation and trust in institutions in the Italian Regions. There was a weak positive correlation between the level of political participation and trust in institutions (τb = 0.016, p = 0.922) (Table 7). In the next section this result will be commented on.
4. Discussion
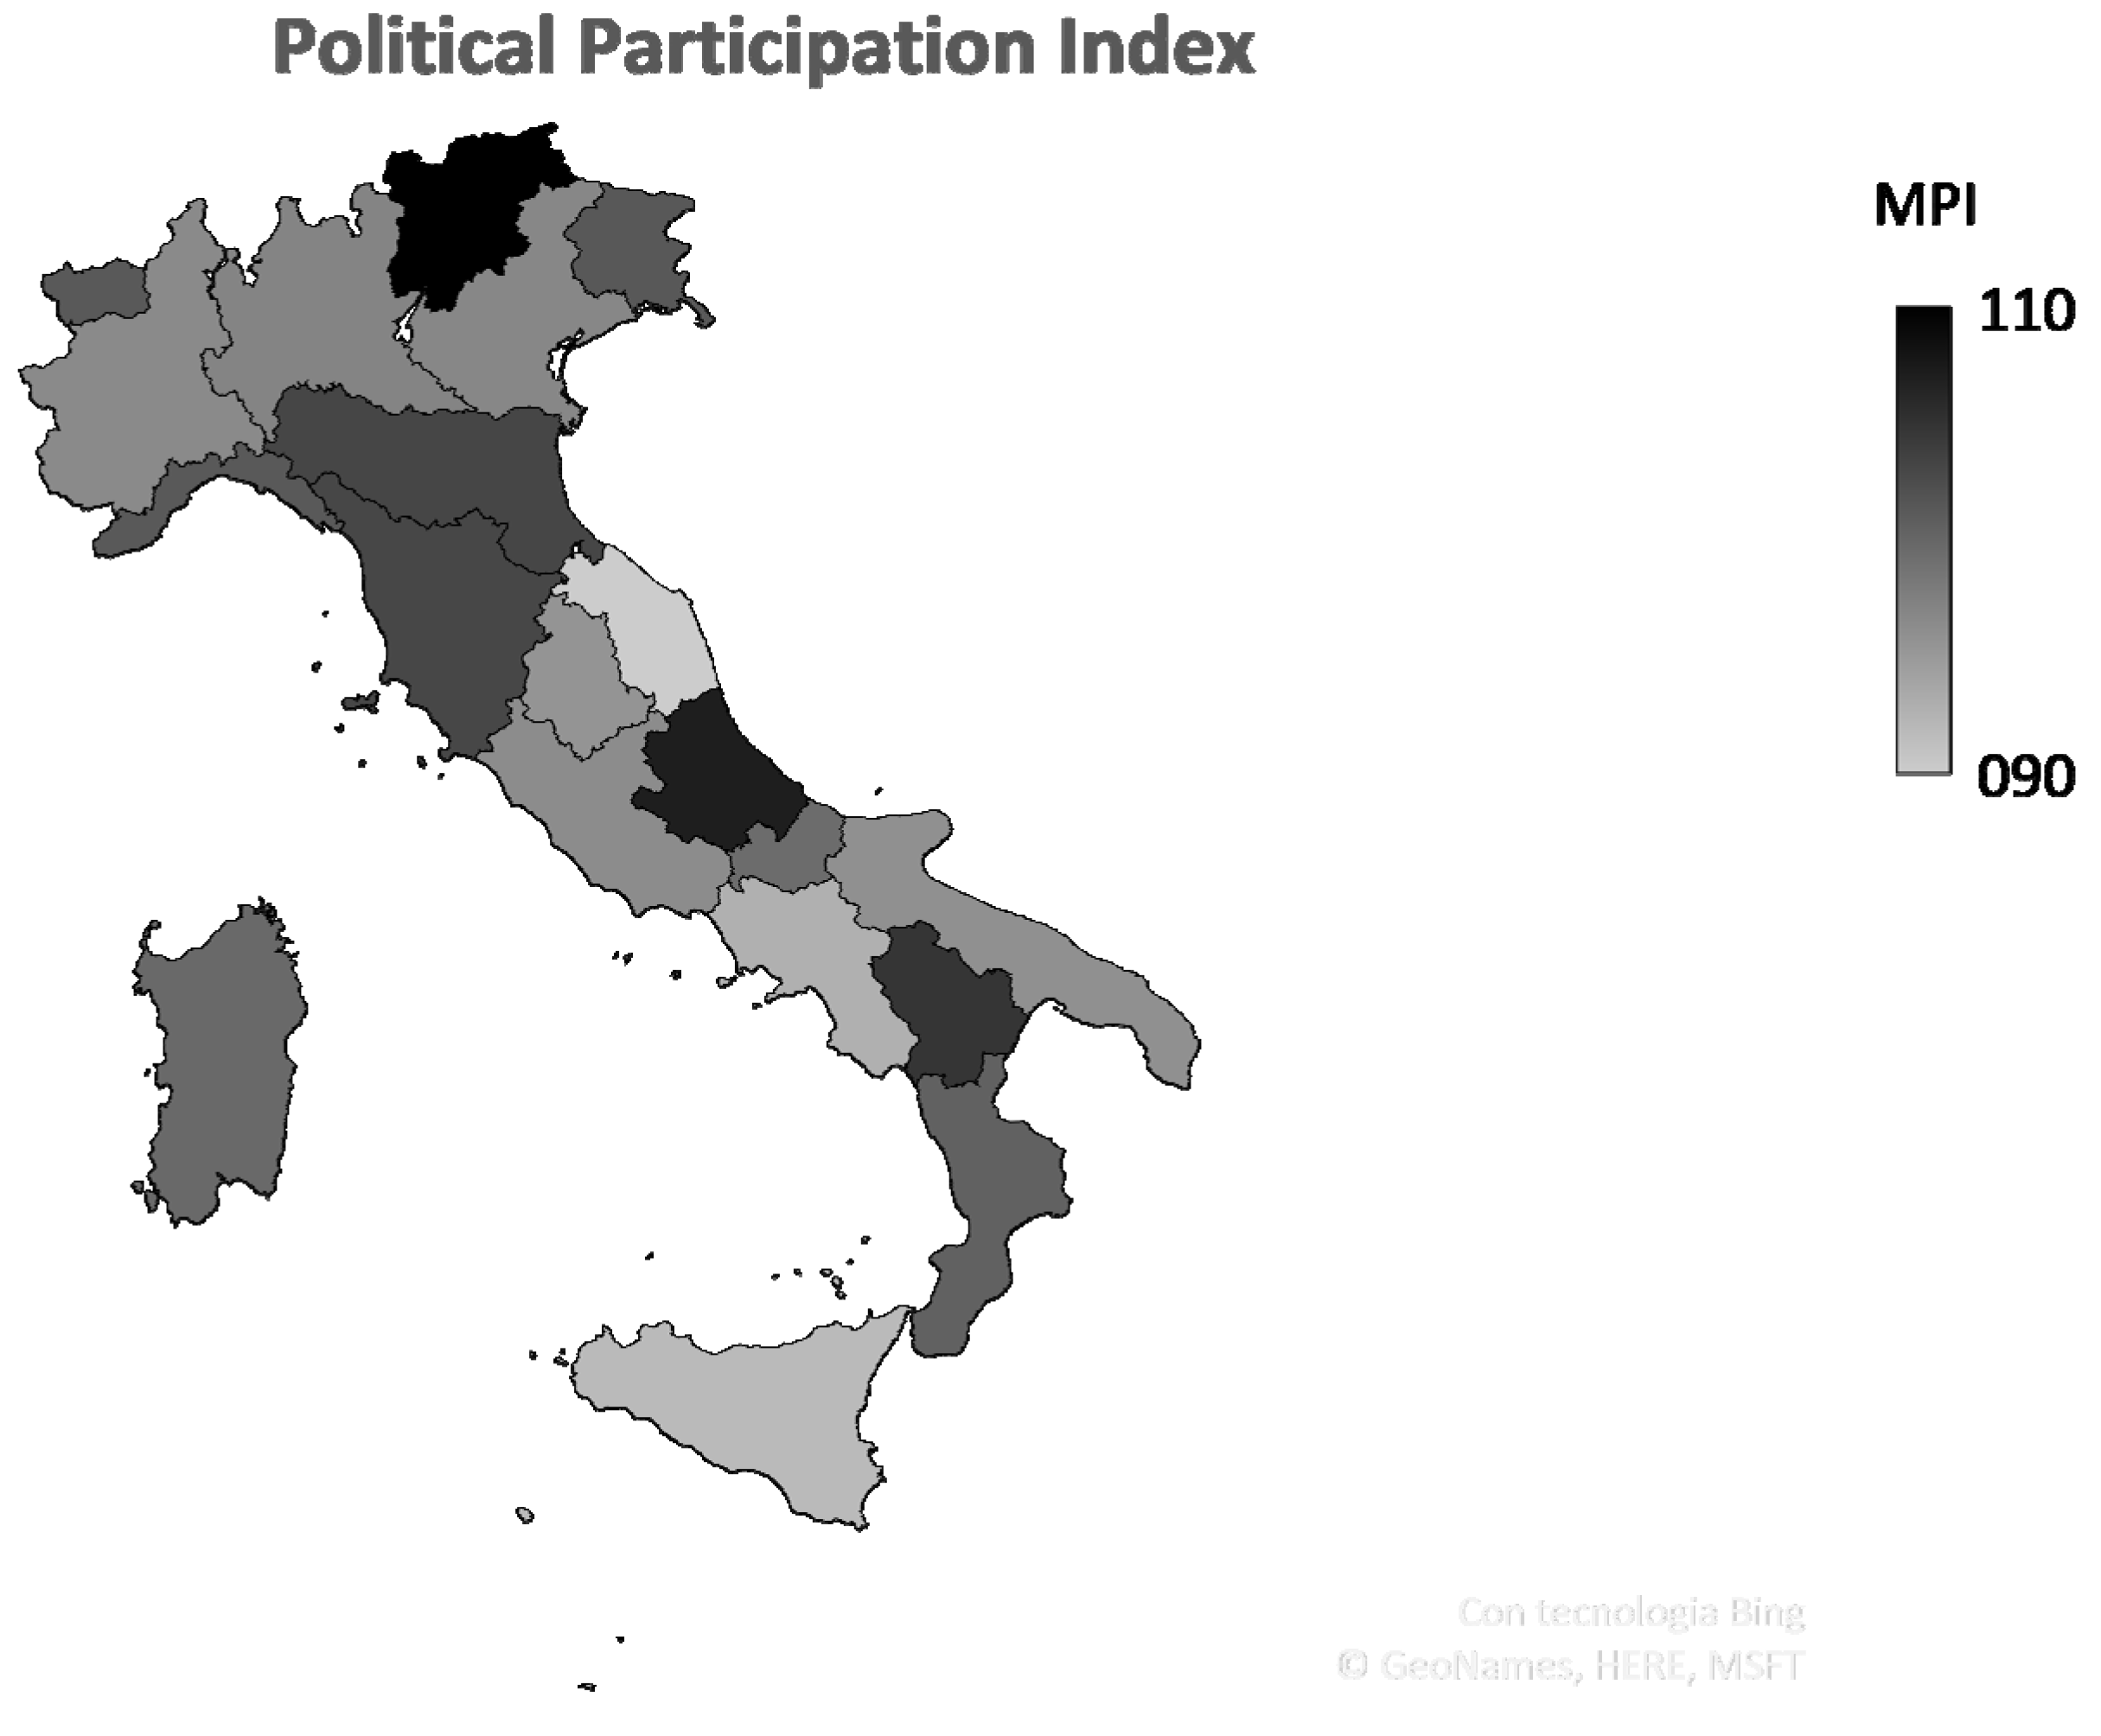
Both the Political Participation Index and the Trust in Institutions Index, as can be seen from Table 3 and Table 5, can be defined as robust because the values of the average rank shift are low. Therefore, both composite indices can fully explain the phenomena considered. Political participation, as can be seen in Figure 3 does not reflect the historical territorial gap between Center-North and South-Italy. In fact, there is no clear division, but apart from high concentrations in Trentino Alto-Adige, Abruzzo, Basilicata, Emilia-Romagna, and Tuscany there is a political involvement mostly uniform throughout Italian territory. The strong participation of Trentino-Alto Adige is due to the presence of strong parties and independence movements such as the Südtiroler Volkspartei (SVP) and Süd-Tiroler Freiheit. In Emilia-Romagna and Tuscany it is due to a solid leftist ideology that drives its citizens to actively participate in political life. As for the other two regions, Abruzzo and Basilicata, regional elections were held in 2019 and so high political participation can be explained by this political event. Moreover, the governor of Abruzzo Marcello Pittella had been the protagonist of a judicial case during 2018. For this reason, there were several political demonstrations and meetings organized by numerous student groups with the aim of invoking his resignation. This has led to an increase in the degree of regional political participation both directly and indirectly.
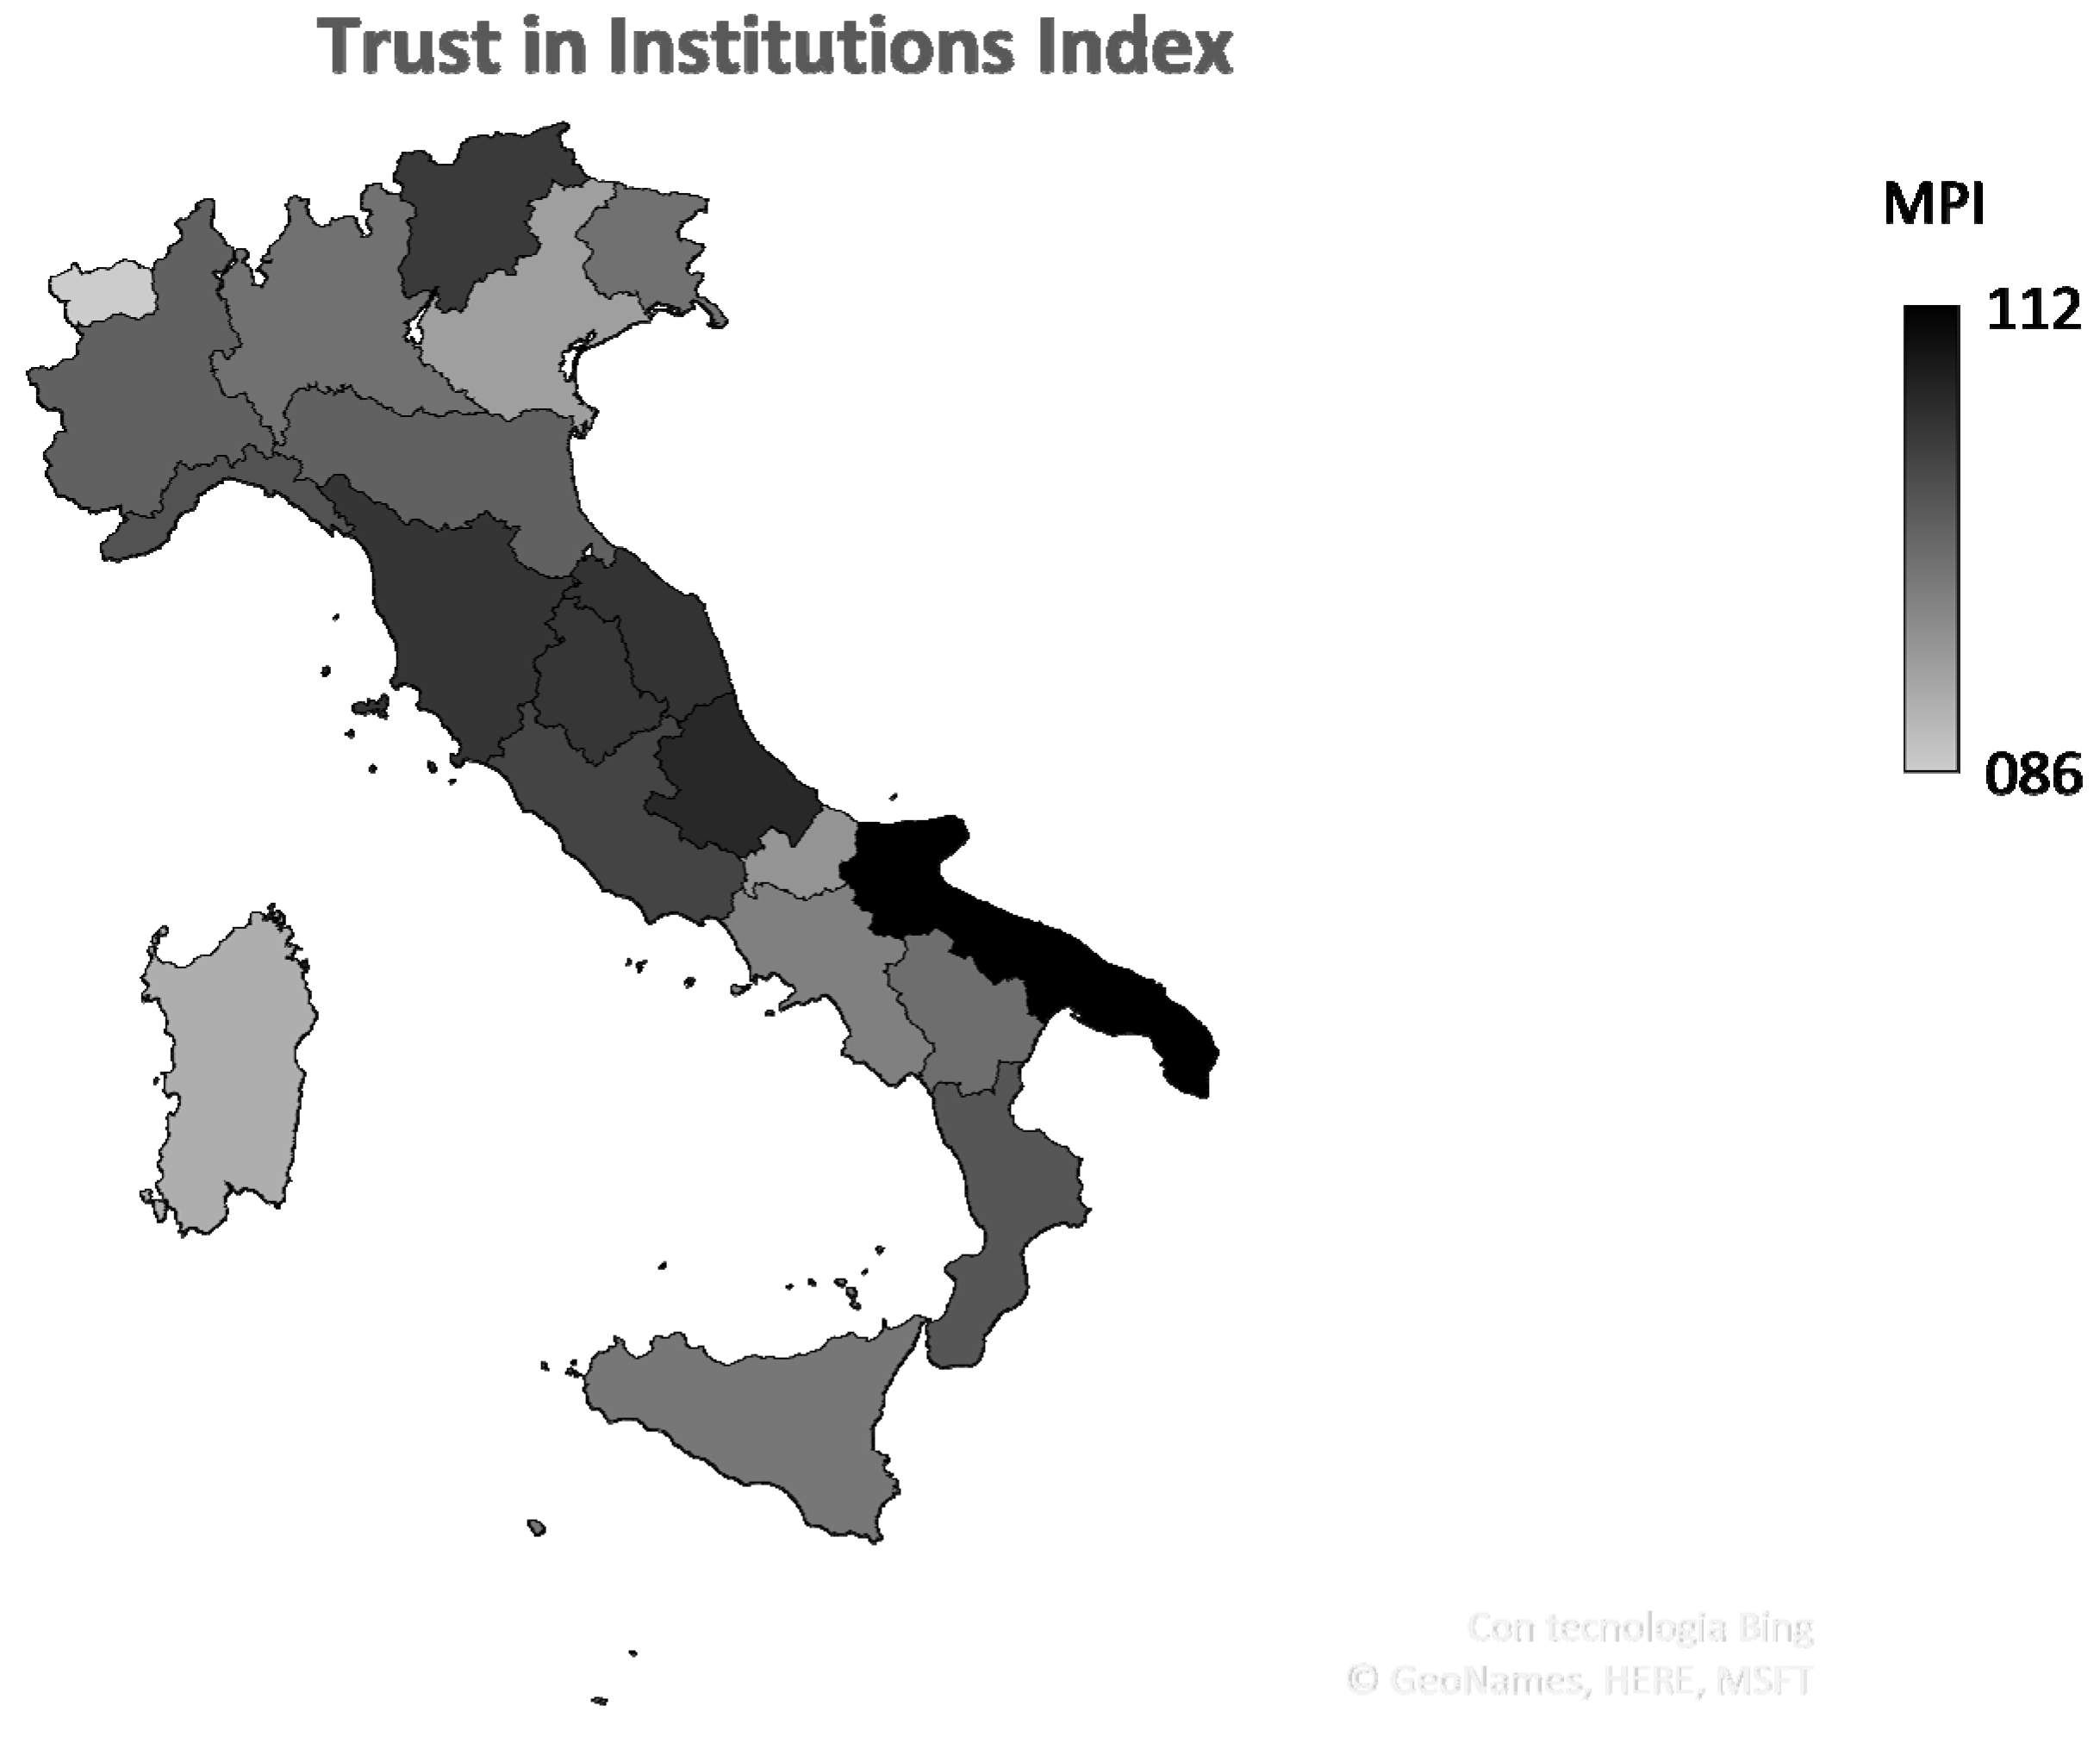
As with political participation, even in the case of trust in the institutions the territorial gap is not confirmed. In fact, as can be seen from Figure 4, the degree of trust in institutions is uniform in the Italian Peninsula. Although the values of the index may appear to show a high level of trust in institutions, if one analyzes the original data of ISTAT along with other reports such as the “Rapporto gli italiani e lo stato” (Rapporto 2019) it can be seen how the levels of trust in institutions are falling.
One thing that can be observed from the two cartograms (Figure 3 and Figure 4) is that there is no geographical continuity between the two phenomena. In fact, unlike political participation where, apart from some high concentrations in some Italian regions, there is a certain uniformity of the social phenomenon, in the case of trust in institutions the highest values of the index are concentrated in the regions of the Center of Italy.
However, the most interesting result of this study is undoubtedly the low correlation between political participation and trust in institutions (Table 7). Indeed, it would immediately be thought that there is a high correlation between the two phenomena and, therefore, high levels of political participation correspond to high levels of trust in institutions and vice versa. This would be perfectly in line with the theorizations of the risk society, which have shown that in contexts of low institutional trust conventional forms of participation are increasingly replaced by unconventional forms of participation. However, the Italian case is unique. In fact, unlike many countries, such as Switzerland, there is a strong political culture that pushes citizens to actively participate, especially electoral participation, in the political life of the country even if the trust in institutions, but especially in political parties, is in decline. Precisely because of its particularity in the last half century there have been several studies, with contrasting results, on Italian political culture and the relationship with political participation and associations (Pizzorno 1960; Spreafico and La Palombara 1963; Almond and Verba 1965; Pizzorno 1966; Banfield 1967). For this reason, it would appear that the risk society has no particular effect on conventional forms of political participation. Therefore, high levels of political participation are maintained throughout the Italian peninsula despite low levels of trust in institutions. However, the effects of the risk society could be relevant in unconventional forms of political participation. In fact, several studies have shown that at high levels of distrust there correspond more intense unconventional forms of political participation (Nye et al. 1997; Norris et al. 2005; Quaranta 2012).
However, the effects of the risk society are fully visible in the continuing decline in the levels of institutional trust.
5. Conclusions
In this paper, two different indices of political participation and trust in institutions have been proposed, which have allowed a study of the two phenomena in 2019 and an analysis from the perspective of a risk society. The results of this study partly confirm previous studies on the risk society. While it is true that, on the one hand, the increase in risk leads to a lowering of the degree of trust in institutions, on the other hand, this climate of growing distrust in institutions does not affect Italian political participation. Indeed, there is still a debate about the relationship between trust in the institutions and political participation. Some argue that without trust in institutions there can be no political participation, while others argue that low trust can lead to more intensive forms of political participation (Hooghe and Marien 2013). By this perspective, Bartiromo (2021) shows that studying the variability of political participation in the years of the Italian elections, as in the presence of adverse political events and therefore those prone to encourage increased distrust, there is an increase in levels of political participation. This can be demonstrated in this study by the fact that on the occasion of the judicial case of Governor Pittella and, therefore, an unfavorable situation in terms of trust in institutions, there was an increase in political participation in Abruzzo.
The Italian case is a very interesting case study from the point of view of political culture, because there is a strong culture that allows citizens to participate even in conditions of strong distrust. Over the years many international and national studies have been carried out according to this perspective, but with contrasting results.
The strength of this study lies in having created two different robust indices of political participation and trust in institutions and, therefore, being able to explain comprehensively the two different phenomena in a given year. In fact, in both indices the values of the average of the rank shift are low and therefore these indices can be considered valid.
The method chosen, therefore, was the Mazziotta and Pareto Index, which is based on endogenous parameters (mean and variance). For this reason, it has allowed a relative time comparison preferable, in this case, to other methods based on exogenous parameters (Mazziotta and Pareto 2013). In fact, the chosen method allowed indicators with equal variability to be aggregated (Mazziotta and Pareto 2017). In addition, this method was chosen and not other aggregative methods due to its high replicability. This may make it possible to apply this study to contexts other than the Italian case. It would be interesting to analyze whether these results are confirmed or not in different policy contexts. In addition, given the recent studies on gender inequalities in political participation, it may be interesting to investigate these two phenomena from a gender perspective. Therefore, in the hope that this study can be replicated in the future the best choice for the construction of the indices was the Mazziotta and Pareto Index.
This work also provides interesting food for thought about the possible link between unconventional forms of political participation and the risk society. This paper has shown that conventional forms of political participation are not particularly affected by the effects of the risk society. However, this does not mean that a close link between unconventional political participation and the risk society cannot occur. In fact, the role of distrust and the consequent political dissatisfaction on the unconventional forms of political participation has not yet been clarified (Quaranta 2012).
Author Contributions
Conceptualization, M.B. and E.I.; original draft preparation, M.B. and E.I.; writing—review and editing, M.B. and E.I. All authors have read and agreed to the published version of the manuscript.
Funding
This research received no external funding.
Institutional Review Board Statement
Not applicable.
Informed Consent Statement
Not applicable.
Data Availability Statement
Statistiche Istat; Gli indicatori del Bes (istat.it).
Conflicts of Interest
The authors declare no conflict of interest.
References
- Almond, Gabriel Abraham, and S. Verba. 1965. The Civic Culture: Political Attitudes and Democracy in Five Nations, An Analytic Study. Later Printing ed. Boston: Little, Brown & Company. [Google Scholar]
- Amin, Elham, and Asma Sabermahani. 2017. Gender Inequality Index Appropriateness for Measuring Inequality. Journal of Evidence-Informed Social Work 14: 8–18. [Google Scholar] [CrossRef]
- Aureli Cutillo, E. 1996. Lezioni di Statistica Sociale. Dati ed. Roma: CISU, Vol. 2. [Google Scholar]
- Banfield, Edward C. 1967. Moral Basis of a Backward Society. Underlining ed. New York: Free Press. [Google Scholar]
- Bartiromo, M. 2021. Aspetti Temporali Della Partecipazione Politica in Italia. Acqui Terme: Impressioni Grafiche, ISBN 978-88-6195-366-6. [Google Scholar]
- Beck, Ulrich, Scott Lash, and Brian Wynne. 1992. Risk Society: Towards a New Modernity. In Association with Theory, Culture & Society, 1st ed. New York: SAGE Publications Ltd. [Google Scholar]
- Beck, Ulrich, and C. Sandrelli. 2016. Disuguaglianza Senza Confini. Italian ed. Roma: Editori Laterza. [Google Scholar]
- Bienaymé, Irénée-Jules. 1853. Considérations à l’appui de la découverte de Laplace sur la loi de probabilité dans la méthode des moindres carrés. Comptes rendus de l’Académie des Sciences 37: 309–24. [Google Scholar]
- Borghesi, Simone, and Alessandro Vercelli. 2003. Sustainable globalisation. Ecological Economics 44: 77–89. [Google Scholar] [CrossRef]
- Buriak, Anna, Iveta Vozňáková, Joanna Sułkowska, and Yana Kryvych. 2019. Social trust and institutional (bank) trust: Empirical evidence of interaction. Economics and Sociology 12: 116–29. [Google Scholar] [CrossRef] [PubMed]
- Calise, Mauro, T. J. Lowi, and F. Musella. 2016. Concetti Chiave: Capire la Scienza Politica. Bologna: Il Mulino Itinerari. [Google Scholar]
- Chebyshev, P. L. 1936. Teoriia, Veroiatnostei. Lektsii Chitannye 1879-80. (Theory of Probabilities. Lectures 1879–80). Edited by A. M. Liapunov and A. M. Krylov. Moscow Leningrad: Izd. AN SSR. [Google Scholar]
- Coleman, Jim. 1990. Foundations of Social Theory. Cambridge: Belknap. [Google Scholar]
- Cotta, Maurizio. 1979. IL Concetto di partecipazione politica: Linee di un inquadramento teorico. Italian Political Science Review/Rivista Italiana Di Scienza Politica 9: 193–227. [Google Scholar] [CrossRef]
- Dash, Bharatee Bhusana, J. Stephen Ferris, and Stanley L. Winer. 2019. The measurement of electoral competition, with application to Indian states. Electoral Studies 62: 102070. [Google Scholar] [CrossRef]
- Delvecchio, F. 1995. Scale di Misura e Indicatori Sociali. Bari: Cacucci. [Google Scholar]
- Downs, Anthony. 1957. An Economic Theory of Democracy, 1st ed. New York: Harper and Row. [Google Scholar]
- Franko, William. W. 2015. More Equal than We Thought? Using Vote Validation to Better Understand Participation Inequality in the States. State Politics & Policy Quarterly 15: 91–114. [Google Scholar]
- Gennip, J. V. 2005. Implicazioni Politiche Della Societa’ del Rischio. Available online: http://www.senato.it/documenti/repository/lavori/affariinternazionali/nato/59_Economica_VanGennip_IT.pdf (accessed on 25 May 2021).
- Habibov, Nazim, Afandi Elvin, and Alex Cheung. 2017. Sand or grease? Corruption-institutional trust nexus in post-Soviet countries. Journal of Eurasian Studies 8: 172–84. [Google Scholar] [CrossRef]
- Harries-Jones, P. 2004. The ‘Risk Society’: Tradition, Ecological Order and Time-space Acceleration. In In the Way of Development: Indigenous Peoples, Life Projects and Globalization. Edited by Mario Blaser, Harvey A. Feit and Glenn McRae. London, New York and Ottawa: Zed Books in cooperation with the International Development Research Centre (IDRC). [Google Scholar]
- Hetherington, Marc J. 1998. The Political Relevance of Political Trust. American Political Science Review 92: 791–808. [Google Scholar] [CrossRef]
- Hooghe, Marc, and Sofie Marien. 2013. A Comparative Analysis of the Relation Between Political Trust and Forms of Political Participation in Europe. European Societies 15: 131–52. [Google Scholar] [CrossRef]
- Hudson, John. 2006. Institutional Trust and Subjective Well-Being across the EU. Kyklos 59: 43–62. [Google Scholar] [CrossRef]
- Inglehart, Ronald. 1997. Modernization and Postmodernization, Cultural Economic and Political Change in 41 Societies. Princeton: Princeton University Press. [Google Scholar]
- Ivaldi, Enrico, Guido Bonatti, and Riccardo Soliani. 2016. An Indicator for the Measurement of Political. Italy: Springer. [Google Scholar]
- Kaliuzhnova, N. Y. 2011. Institutes of regional development and competitiveness in the conditions of modernization. Economy of Region 2: 65–72. [Google Scholar] [CrossRef]
- Koenen, Karestan C., Alisa Lincoln, and Allison Appleton. 2006. Women’s status and child well-being: A state-level analysis. Social Science & Medicine 63: 2999–3012. [Google Scholar] [CrossRef]
- Koivusilta, Leena K. 2017. Country-Level Investment in Cultural Opportunity Structures. A Potential Source of Health Differences Between 21 European Countries. Social Indicators Research 137: 1091–118. [Google Scholar] [CrossRef] [Green Version]
- Liberati, Alessandro, Douglas G. Altman, Jennifer Tetzlaff, Cynthia Mulrow, Peter C. Gøtzsche, John P. A. Ioannidis, Mike Clarke, P. J. Devereaux, Jos Kleijnen, and David Moher. 2015. PRISMA Statement per il reporting di revisioni sistematiche e meta-analisi degli studi che valutano gli interventi sanitari: Spiegazione ed elaborazione. Evidence 7: e1000115. [Google Scholar]
- Madden, David. 2020. The base of party political support in Ireland: An update. Economic and Social Review 51: 93–104. [Google Scholar]
- Mazziotta, Matteo, and Adriano Pareto. 2007. Un indicatore sintetico di dotazione infrastrutturale: il metodo della penalità per coefficiente di variazione. Paper presented at Lo Sviluppo Regionale nell’Unione Europea-Obiettivi, Strategie, Politiche, Atti Della XXVIII Conferenza Italiana di Scienze Regionali, Bolzano, Italy, September 26–28. [Google Scholar]
- Mazziotta, Matteo, and Adriano Pareto. 2011. Un indice sintetico non compensativo per la misura della dotazione infrastrutturale: Un’applicazione in ambito sanitario. Rivista di Statistica Ufficiale 1: 63–79. [Google Scholar]
- Mazziotta, Matteo, and Adriano Pareto. 2012. A Non-compensatory approach for the measurement of the quality of life. In Quality of Life in Italy. Edited by F. Maggino and G. Nuvolati. Social Indicator Research Series 48; New York: Springer, pp. 27–40. [Google Scholar]
- Mazziotta, Matteo, and Adriano Pareto. 2013. Methods for constructing composite indices: One for all or all for one? Rivista Italiana di Economia Demografia e Statistica LXVII: 67–80. [Google Scholar]
- Mazziotta, Matteo, and Adriano Pareto. 2017. Synthesis of Indicators: The Composite Indicators Approach. In Complexity in Society: From Indicators Construction to their Synthesis. Edited by F. Maggino. New York: Springer, pp. 159–91. [Google Scholar]
- Milbrath, Lester W. 1977. Political Participation: How and Why Do People get Involved in Politics? 2nd ed. Chicago: Rand McNally College Pub. Co. [Google Scholar]
- Mishler, William, and Richard Rose. 2001. What Are the Origins of Political Trust? Comparative Political Studies 34: 30–62. [Google Scholar] [CrossRef]
- Mitchell, Andrew David, and Thomas J. Bossert. 2007. Measuring dimensions of social capital: Evidence from surveys in poor communities in Nicaragua. Social Science & Medicine 64: 50–63. [Google Scholar] [CrossRef]
- Mlambo, Courage, and Forget Kapingura. 2019. Factors influencing women political participation: The case of the SADC region. Cogent Social Sciences 5: 1681048. [Google Scholar] [CrossRef]
- Munger, M. C., and D. C. North. 1991. Institutions, Institutional Change and Economic Performance. Southern Economic Journal 58: 296. [Google Scholar] [CrossRef]
- Mutti, Antonio. 2003. La teoria della fiducia nelle ricerche sul capitale sociale. Rassegna Italiana di Sociologia 44: 515–36. [Google Scholar] [CrossRef]
- Newton, K. 1999. Social and Political Trust in Established Democracies. In Critical Citizens: Global Support for Democratic Governance. Edited by Pippa Norris. Oxford: Oxford University Press, pp. 169–87. [Google Scholar]
- Norris, Pippa, Steffan Walgrave, and P. van Aelst. 2005. Who Demonstrates? Antistate Rebels, Conventional Participants, or Everyone? Comparative Politics 37: 189–205. [Google Scholar] [CrossRef]
- Nye, Joseph S., P. Zelikov, and D. C. King. 1997. Introduction: The decline of confidence in government. In Why People Don’t Trust Government. Edited by Joseph S. Nye, P. Zelikov and D. C. King. Cambridge: Cambridge University Press. [Google Scholar]
- Organisation for Economic Co-Operation and Develop (OECD). 2008. Handbook on Constructing Composite Indicators: Methodology and User Guide (Science et Technologies de L’information). Pap/Ado ed. Paris: OECD Publishing. [Google Scholar]
- Pareto, V. 1935. The Mind and Society (Trattato di Sociologia generale) Volumes I through IV (Volumes One through Four), 1st ed. New York: Harcourt, Brace & Co. [Google Scholar]
- Pasquino, Gianfranco. 1997. Corso di Scienza Politica. Bologna: Il Mulino. [Google Scholar]
- Pinker, Steven. 2018. Enlightenment Now: The Case for Reason, Science, Humanism, and Progress. Reprint ed. London: Penguin Books. [Google Scholar]
- Pizzorno, Alessandro. 1960. Comunità e Razionalizzazione. Milano: Einaudi. [Google Scholar]
- Pizzorno, Alessandro. 1966. Introduzione allo studio della partecipazione politica. Quaderni di Sociologia XV: 235–86. [Google Scholar]
- Quaranta, Mario. 2012. Chi protesta in Italia? Quaderni Di Sociologia 60: 59–82. [Google Scholar] [CrossRef]
- Raniolo, Francesco. 2007. La Partecipazione Politica. Bologna: Il Mulino. [Google Scholar]
- Rapporto 2019—Rapporto gli Italiani e lo Stato—Demos & Pi. 2019. Available online: http://www.demos.it/a01676.php (accessed on 16 July 2021).
- Rothstein, Bo, and Dietlind Stolle. 2008. The State and Social Capital: An Institutional Theory of Generalized Trust. Comparative Politics 40: 441–59. [Google Scholar] [CrossRef]
- Sønderskov, Kim Mannemar, and Peter Thisted Dinesen. 2014. Danish Exceptionalism: Explaining the Unique Increase in Social Trust Over the Past 30 Years. European Sociological Review 30: 782–95. [Google Scholar] [CrossRef]
- Sønderskov, Kim Mannemar, and Peter Thisted Dinesen. 2015. Trusting the State, Trusting Each Other? The Effect of Institutional Trust on Social Trust. Political Behavior 38: 179–202. [Google Scholar] [CrossRef] [Green Version]
- Spreafico, A., and J. La Palombara. 1963. Elezioni e Comportamento Politico in Italia. Milano: Edizioni di Comunità. [Google Scholar]
- Steger, M. B. 2016. La Globalizzazione. Italian ed. Bari: Il Mulino. [Google Scholar]
- Sundström, Aksel, Pamela Paxton, Yi-Ting Wang, and Staffan I. Lindberg. 2017. Women’s Political Empowerment: A New Global Index, 1900–2012. World Development 94: 321–35. [Google Scholar] [CrossRef] [Green Version]
- Tarantola, Stefano. 2008. European Innovation Scoreboard: Strategies to Measure Country Progress Over Time. JRC Scientific and Technical Reports, EUR 23526. Luxembourg: EN. [Google Scholar]
- Verba, Sidney, Kay Lehman Schlozman, and Henry E. Brady. 1995. Voice and Equality: Civic Voluntarism in American Politics. Abridged ed. Cambridge: Harvard University Press. [Google Scholar]
- Walker, Mary Ellen, June Anonson, and Michael Szafron. 2015. Economist intelligence unit democracy index in relation to health services accessibility: A regression analysis. International Health 7: 49–59. [Google Scholar] [CrossRef]
- Wang, Lanlan, and Peter Gordon. 2011. Trust and institutions: A multilevel analysis. The Journal of Socio-Economics 40: 583–93. [Google Scholar] [CrossRef] [Green Version]
- Yadav, Stacey Philbrick. 2009. Does a Vote Equal a Voice? Women in Yemen. Middle East Report 252: 38–45. [Google Scholar] [CrossRef]
- You, Jong-sung. 2012. Social Trust: Fairness Matters More Than Homogeneity. Political Psychology 33: 701–21. [Google Scholar] [CrossRef]
- Zmerli, Sonja, Kenneth Newton, and J. R. Montero. 2007. Trust in people, confidence in political institutions, and satisfaction with democracy. In Citizenship and Involvement in European Democracies: A Comparative Analysis. Edited by J. W. van Deth, J. R. Montero and A. Westholm. New York: Routledge, pp. 35–65. [Google Scholar]
Figure 1.
PRISMA statement 2009. Flow diagram: political participation.

Figure 2.
PRISMA statement 2009. Flow diagram: trust in institutions.

Figure 3.
Cartogram of political participation index.

Figure 4.
Cartogram of trust in institutions index.


Table 1.
Indicators used for the constructions of Political Participation Index and Trust in Institutions Index.
Table 1.
Indicators used for the constructions of Political Participation Index and Trust in Institutions Index.
| Political Participation Index | Description | |
|---|---|---|
| Indicators | Discussions of political issues more than once a week; | % of people aged 14 and over who discuss politics frequently |
| Taking part in political meetings; | % of people aged 14 and over involved in political activities | |
| Taking part in political demonstrations; | ||
| Listening to political debate; | ||
| Volunteering for a political party; | ||
| Giving money to a political party; | ||
| Seeking information on politics once a week. | % of people aged 14 and over for frequency with which they inform of Italian policy | |
| Trust in Institutions Index | Description | |
| Indicators | Trust in parliament; | Average confidence score expressed by people aged 14 and over |
| Trust in political parties; | ||
| Trust in other institutions. |
Source: Istat (“Indagine Multiscopo sulle famiglie” and “Benessere Equo Sostenibile” surveys).
Table 2.
MPI Political Participation Index.
| Regions | MPI Index | Ranks |
|---|---|---|
| Abruzzo | 107.03 | 2 |
| Aosta Valley | 101.38 | 7 |
| Apulia | 95.97 | 16 |
| Basilicata | 104.87 | 3 |
| Calabria | 100.54 | 9 |
| Campania | 92.88 | 18 |
| Emilia-Romagna | 103.21 | 4 |
| Friuli-Venezia Giulia | 101.47 | 6 |
| Lazio | 96.38 | 15 |
| Liguria | 101.35 | 8 |
| Lombardy | 97.11 | 12 |
| Marche | 90.16 | 20 |
| Molise | 99.52 | 11 |
| Piedmont | 96.55 | 14 |
| Sardinia | 99.77 | 10 |
| Sicily | 91.90 | 19 |
| Trentino-Alto Adige | 109.99 | 1 |
| Tuscany | 103.10 | 5 |
| Umbria | 95.58 | 17 |
| Veneto | 96.88 | 13 |
Table 3.
The validation of Political Participation Index.
| Indicators | Rank Shift |
|---|---|
| MPI—No discussing politics facts | 1.7 |
| MPI—No taking part a political meeting | 1 |
| MPI—No taking part in political demonstrations | 1 |
| MPI—No listening to political debate | 0.7 |
| MPI—No volunteering for a political party | 1.3 |
| MPI—No giving money to a political party | 1.8 |
| MPI—No seeking information on politics | 1.7 |
| Average | 1.31 |
Table 4.
MPI Trust in Institutions Index.
| Regions | MPI Index | Ranks |
|---|---|---|
| Abruzzo | 106.71 | 2 |
| Aosta Valley | 85.95 | 20 |
| Apulia | 111.71 | 1 |
| Basilicata | 97.87 | 12 |
| Calabria | 100.84 | 9 |
| Campania | 95.48 | 16 |
| Emilia-Romagna | 99.46 | 10 |
| Friuli-Venezia Giulia | 97.47 | 13 |
| Lazio | 103.11 | 7 |
| Liguria | 101.32 | 8 |
| Lombardy | 97.41 | 14 |
| Marche | 105.33 | 3 |
| Molise | 92.98 | 17 |
| Piedmont | 99.46 | 10 |
| Sardinia | 89.70 | 19 |
| Sicily | 96.68 | 15 |
| Trentino-Alto Adige | 104.42 | 6 |
| Tuscany | 105.03 | 4 |
| Umbria | 104.91 | 5 |
| Veneto | 91.68 | 18 |
Table 5.
The validation of Trust in Institutions Index.
| INDICATORS | RANK SHIFT |
|---|---|
| MPI—No trust in Parliament | 2 |
| MPI—No trust in political parties | 2.05 |
| MPI—No trust in other institutions | 2.65 |
| Average | 2.23 |
Table 6.
Descriptive statistics.
| Political Participation Index | Trust in Institutions Index | |
|---|---|---|
| N | 20 | 20 |
| Mean | 99.28 | 99.37 |
| Median | 99.64 | 99.46 |
| Std. Deviation | 5.03 | 6.3 |
| Minimum | 90.15 | 85.95 |
| Maximum | 109.99 | 111.71 |
| Variance | 25.31 | 39.76 |
| Kurtosis | −1.123 | −0.02 |
| Skewness | 0.20 | −0.26 |
Table 7.
Correlation between Political Participation and Trust in Institutions.
| MPI Political Participation | MPI Trust in Institutions | |||
|---|---|---|---|---|
| Kendall’s Tau-b | MPI Political Participation | Correlation Coefficient | 1.000 | 0.016 |
| Sig. (2-code) | . | 0.922 | ||
| N | 20 | 20 | ||
| MPI Trust in Institutions | Correlation Coefficient | 0.016 | 1.000 | |
| Sig. (2-code) | 0.922 | . | ||
| N | 20 | 20 | ||
Publisher’s Note: MDPI stays neutral with regard to jurisdictional claims in published maps and institutional affiliations. |
© 2021 by the authors. Licensee MDPI, Basel, Switzerland. This article is an open access article distributed under the terms and conditions of the Creative Commons Attribution (CC BY) license (https://creativecommons.org/licenses/by/4.0/).
Share and Cite
MDPI and ACS Style
Bartiromo, M.; Ivaldi, E. Political Participation in the Risk Society: The Italian Case. J. Risk Financial Manag. 2021, 14, 435. https://0-doi-org.brum.beds.ac.uk/10.3390/jrfm14090435
AMA Style
Bartiromo M, Ivaldi E. Political Participation in the Risk Society: The Italian Case. Journal of Risk and Financial Management. 2021; 14(9):435. https://0-doi-org.brum.beds.ac.uk/10.3390/jrfm14090435
Chicago/Turabian StyleBartiromo, Marianna, and Enrico Ivaldi. 2021. "Political Participation in the Risk Society: The Italian Case" Journal of Risk and Financial Management 14, no. 9: 435. https://0-doi-org.brum.beds.ac.uk/10.3390/jrfm14090435