Article

The Economics of a Bed Shortage: Certificate-of-Need Regulation and Hospital Bed Utilization during the COVID-19 Pandemic

by
Matthew Mitchell
1,* and
Thomas Stratmann
2
1
Mercatus Center, George Mason University, 3434 Washington Blvd., 4th Floor, Arlington, VA 22201, USA
2
Economics Department, George Mason University, 4400 University Drive, MSN 1D3, Carow Hall, Fairfax, VA 22030, USA
*
Author to whom correspondence should be addressed.
J. Risk Financial Manag. 2022, 15(1), 10; https://0-doi-org.brum.beds.ac.uk/10.3390/jrfm15010010
Submission received: 10 November 2021 / Revised: 21 December 2021 / Accepted: 28 December 2021 / Published: 31 December 2021
(This article belongs to the Special Issue Health Economics and Insurance)

Abstract

:
Certificate-of-need (CON) laws are intended to restrain health care spending by limiting the acquisition of duplicative capital and the initiation of unnecessary services. Critics contend that need is difficult to objectively assess, especially considering the risks and uncertainty inherent in health care. We compare statewide bed utilization rates and hospital-level bed utilization rates in bed CON and non-bed CON states during the COVID-19 pandemic. Controlling for other possibly confounding factors, we find that states with bed CONs had 12 percent higher bed utilization rates and 58 percent more days in which more than 70 percent of their beds were used. Individual hospitals in bed CON states were 27 percent more likely to utilize all of their beds. States that relaxed CON requirements to make it easier for hospitals to meet the surge in demand did not experience any statistically significant decreases in bed utilization or number of days above 70 percent of capacity. Nor were hospitals in states that relaxed their CON requirements any less likely to use all their beds. Certificate-of-need laws seem to have exacerbated the risk of running out of beds during the COVID-19 pandemic. State efforts to relax these rules had little immediate effect on reducing this risk.

1. Introduction

In states with certificate-of-need requirements in health care, providers wishing to open or expand their facilities must first prove to a regulator that their community needs the service they plan to perform or the equipment they plan to acquire. Unlike other varieties of regulation, the process is not intended to assess a provider’s qualifications, safety record, or the adequacy of his or her facilities. Instead, the regulator’s goal is to assess market need. This is often performed by tabulating the share of equipment, such as beds, that are in use. In many states, a CON can be denied if a regulator believes that the new service will duplicate an existing one. The requirements vary from state to state and cover a variety of services and procedures, ranging from hospitals and hospital beds to medical imaging devices and substance abuse facilities.1
Needs assessment is difficult for a number of reasons. First, need is subjective. It depends on the individually-defined value that particular consumers believe they will obtain from a service. A service that caters to the particular tastes and values of an ethnic or religious minority, for example, may create a great deal of value for members of that group. However, it is difficult for regulators to assess these subjective preferences. In New York City, for example, a group of Hasidic women recently attempted to start an all-female ambulance service that would cater to the particular desire for women in their community for modesty and privacy in medical matters. Because another (all male) ambulance service already existed, however, the certificate-of-need regulator determined that the community did not need the all-female service (Kessler 2020).
Second, need is constantly changing as circumstances and tastes change. Researchers find that when health care providers are able to change their services without proving need to a regulator, they are more likely to adapt (D’Aunno et al. 2000). Third, need is contingent. A facility and its customers may benefit from a new hospital bed, but that may depend on other conditions such as the supply of medical professionals to staff the bed, the supply of beds in competing facilities, and the profitability of businesses in other sectors in the community.
Fourth, the metrics that regulators use to assess need can be exploited by providers. As noted, the risk of over- or under-supply can be assessed by counting the share of beds in use. However, providers may react to this method, making the regulator’s task more difficult. For example, if provider A knows that competitor B will be denied his or her CON if more than, say, 70 percent of A’s beds are used, then A has an incentive to keep his bed usage under 70 percent. Thus, CON may encourage idle medical equipment, which is exactly the opposite of its intent. Natural disasters, pandemics, or social trends such as opioid abuse can confound matters further.
For all of these reasons, estimating the probability of over- or under-supply of a certain service may not be a matter of quantifiable risk, but rather a matter of Knightian, un-quantifiable uncertainty (Knight 1921). The COVID-19 pandemic only exacerbated these difficulties. From the outset, caregivers and public health officials were concerned about hospital capacity (Spektor 2020). In the extreme case of running out of capacity, a hospital is unable to care for patients. However, even before it gets to that point, difficult decisions may have to be made by hospital staff and administrators (Sánchez-Úbeda et al. 2021). As the Delta variant swept through the nation in the summer of 2021, several states either enacted or considered enacting what is known as “crisis standards of care” (Boone et al. 2021). As a recent NPR report put it, under crisis standards of care:
Certain patients deemed less likely to survive may not get a bed in the intensive care unit. Nurses may be asked to treat many more patients than is normally considered safe. Patients may have to be discharged from the hospital before they would normally go home, and some patients who would usually be admitted for hospital care might have to be denied
Evidence supports these concerns as there is a link between hospital capacity strain and worsened health outcomes. A systematic review of 44 observational and 8 experimental studies in highly developed countries concluded that “mortality increased during times of capacity strain in 18 of the 30 studies and in 9 of 12 studies in intensive care unit settings” (Eriksson et al. 2017).
It was these worries that prompted officials to order lockdowns in the spring of 2020. In flattening the curve, the goal was not necessarily to reduce the total number of infections but to reduce the number of infections at any one time so as not to overwhelm the hospital system. Eighteen months later, many hospital systems found themselves overwhelmed again.
While measures to moderate the demand for care—lockdowns, social distancing, mask mandates, and vaccine drives—have dominated public discourse, another way to address overcrowded hospitals is to increase capacity (Barclay et al. 2020). In this paper, we investigate the effects of one capacity constraint—certificate-of-need (CON) regulations that limit the supply of hospital beds in 27 states. In the next section, we study hospital bed utilization throughout the pandemic, certificate-of-need laws in general, and bed CONs in particular. We also describe our empirical tests exploring the link between bed CONs and bed utilization. In Section 3, we present the results of these tests, showing that states that require bed CONs had higher utilization rates and more days in excess of 70 percent utilization. Hospitals in these states were also more likely to use all of their beds. In Section 4, we offer concluding remarks.

2. Materials and Methods

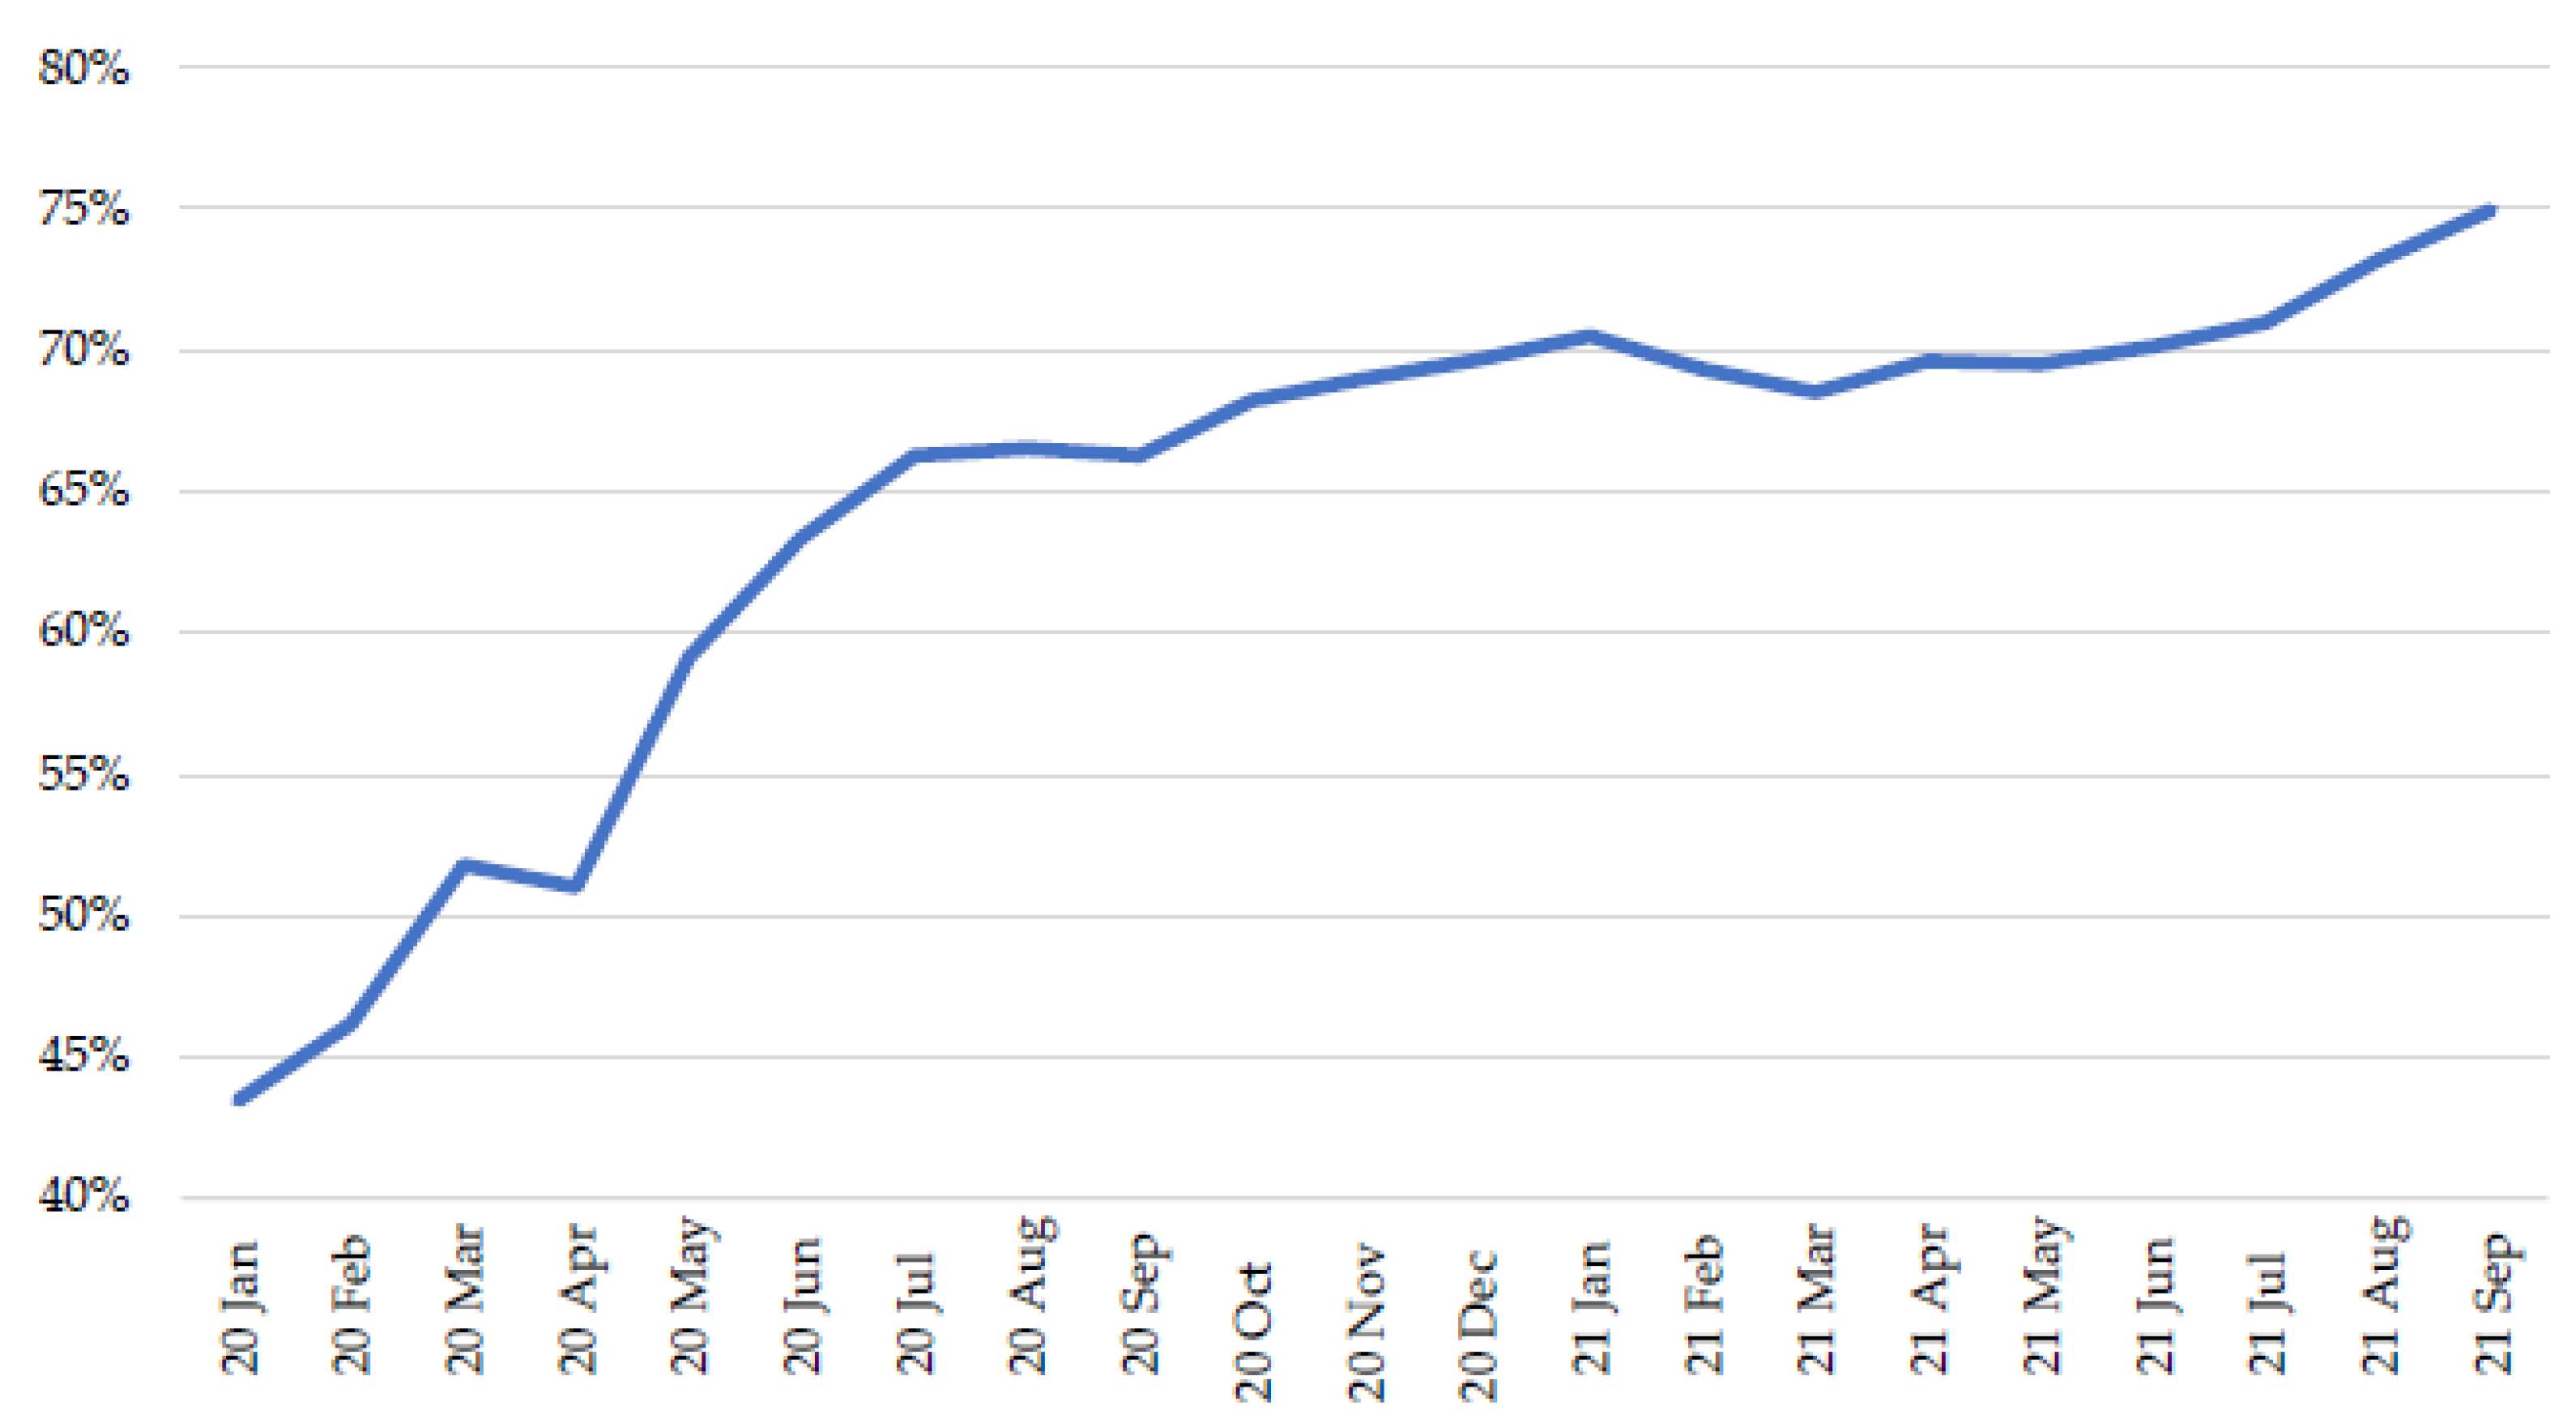
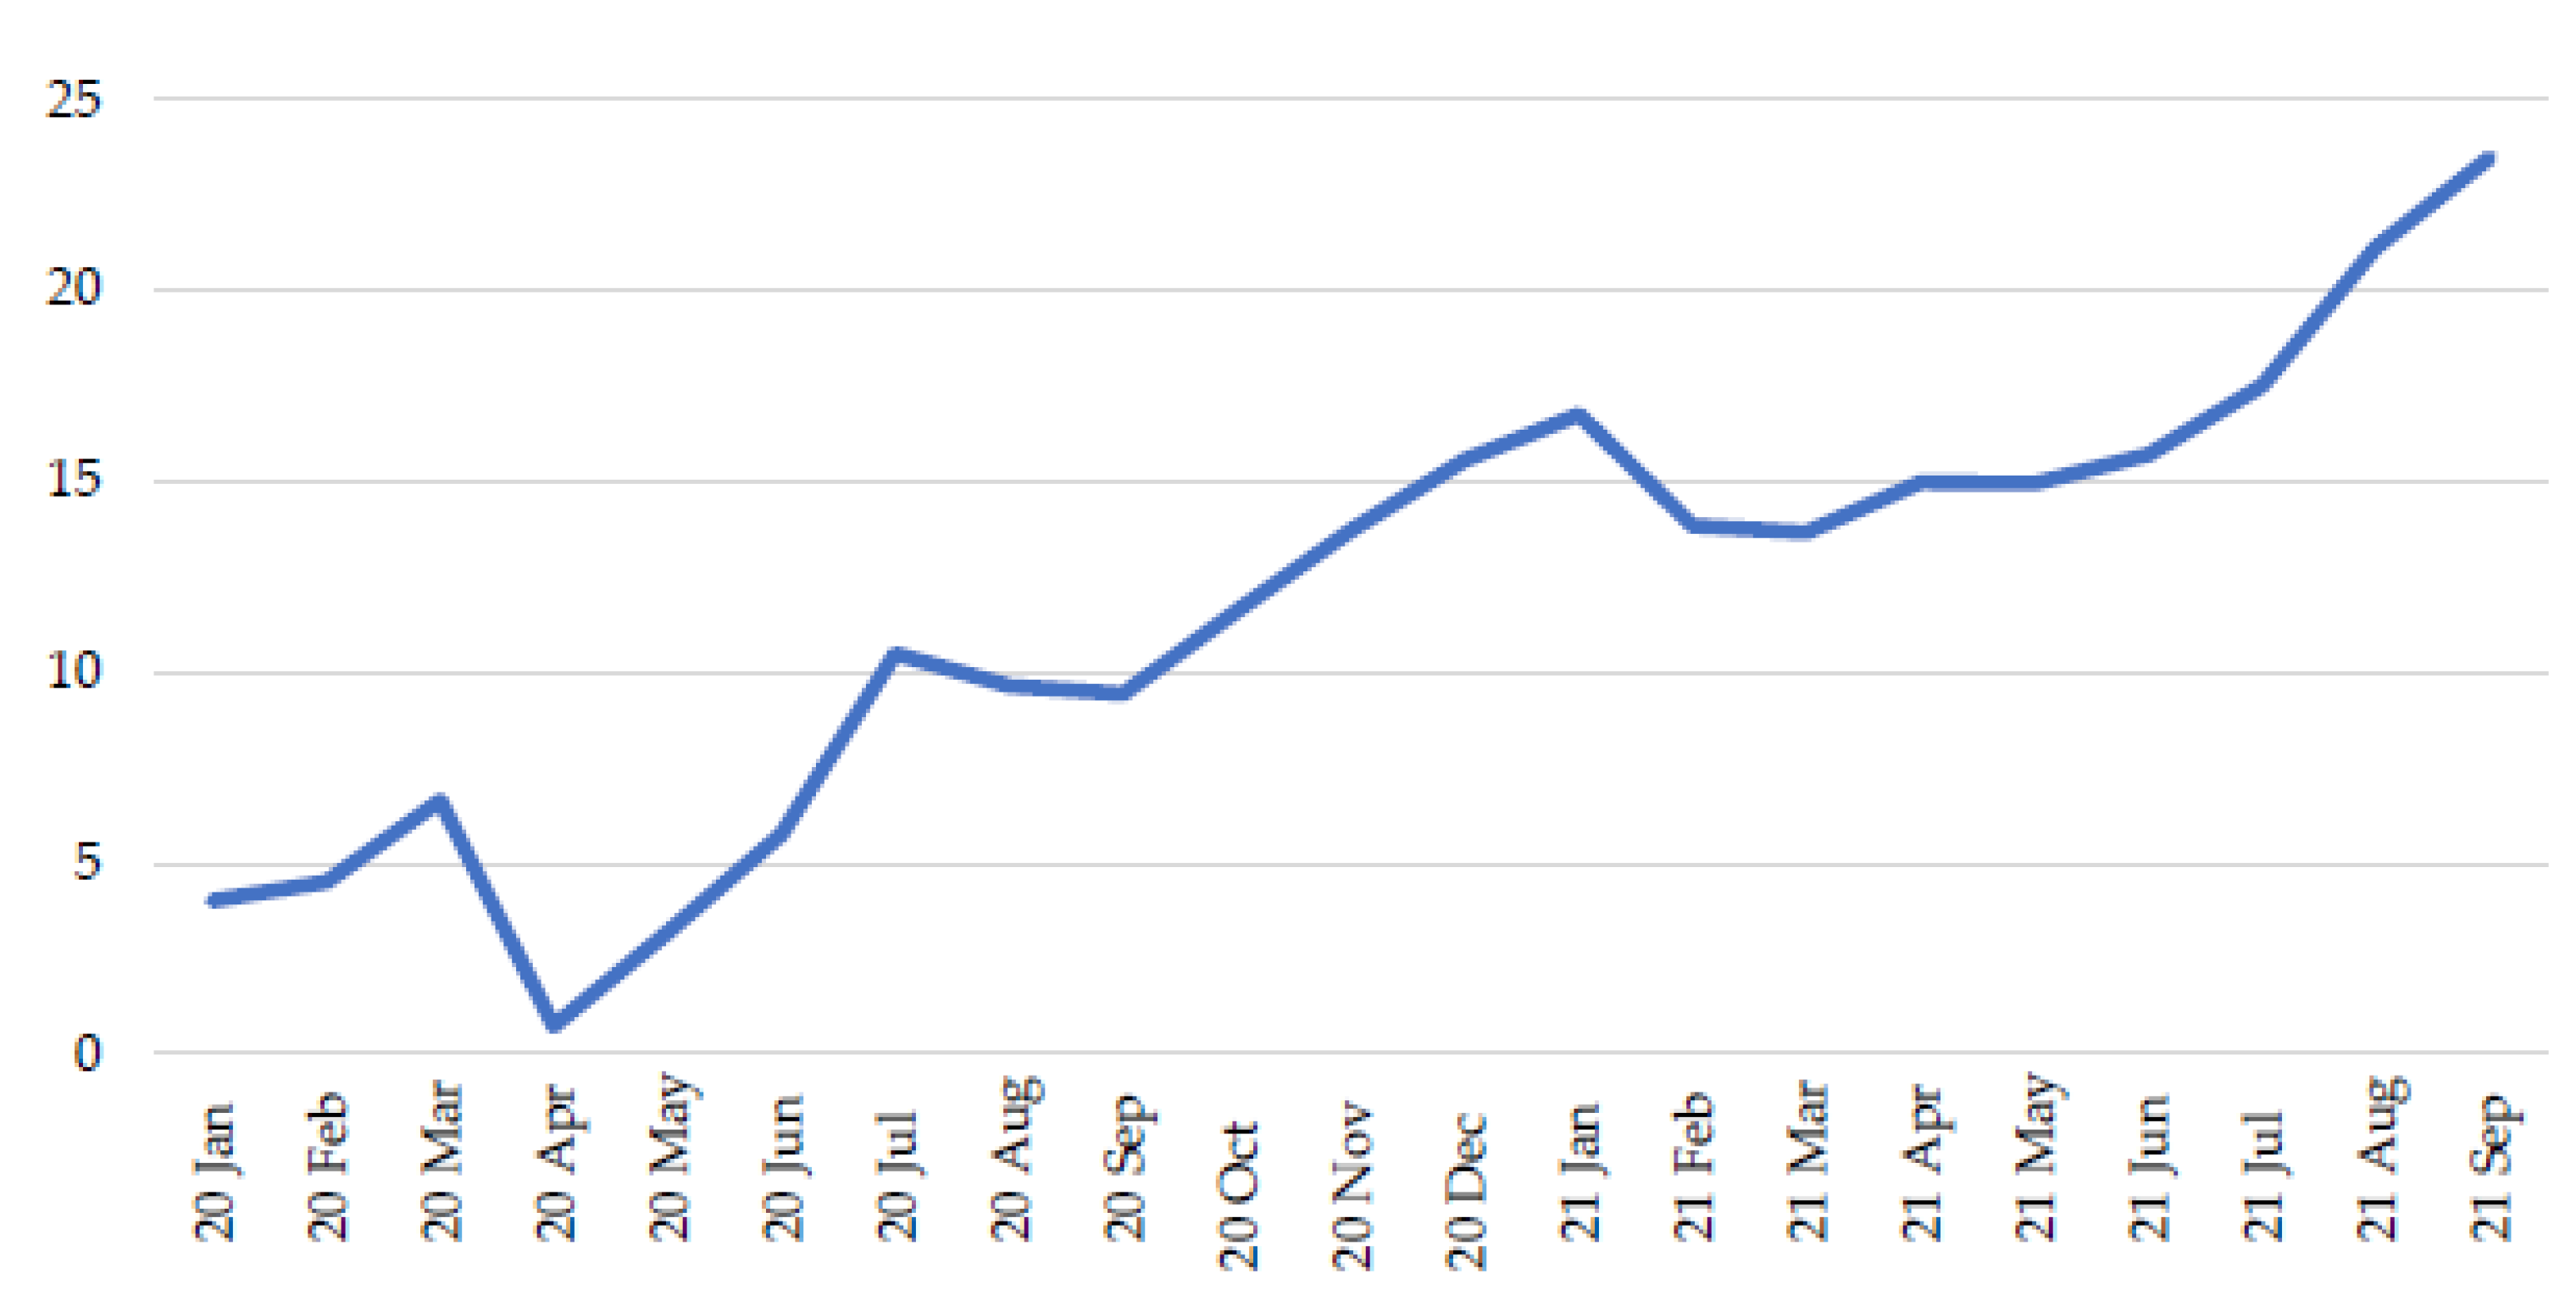
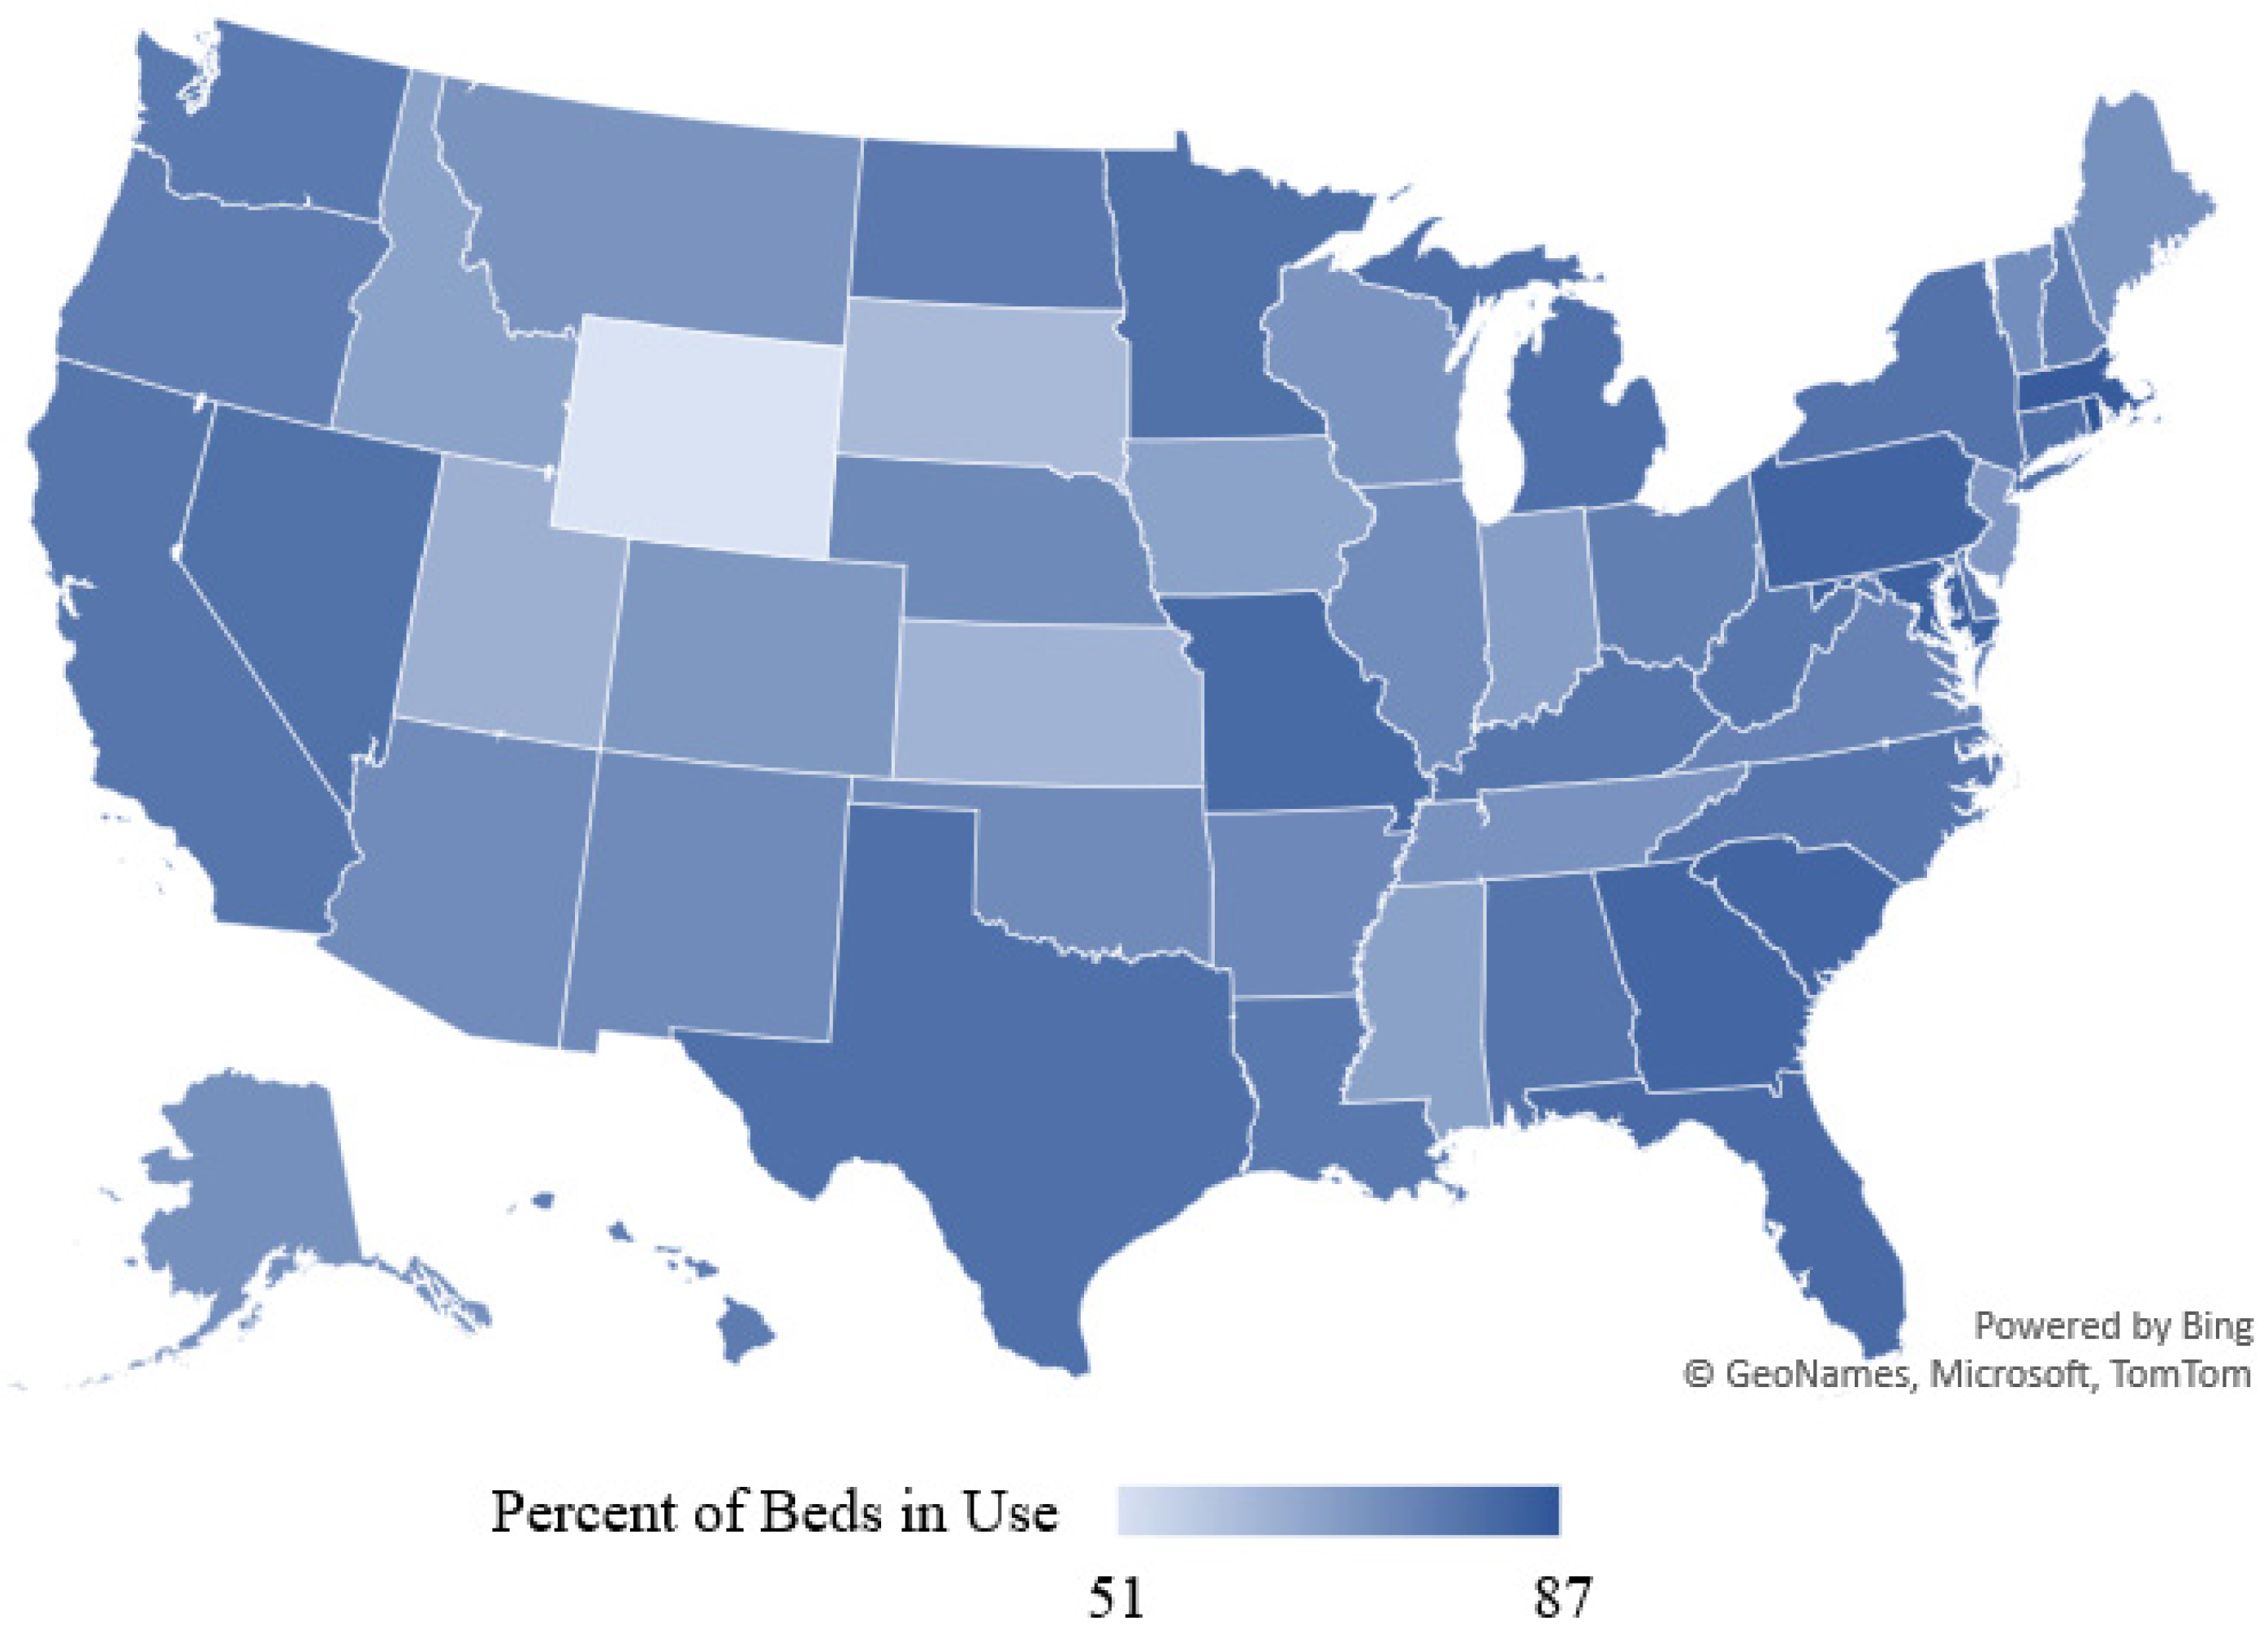
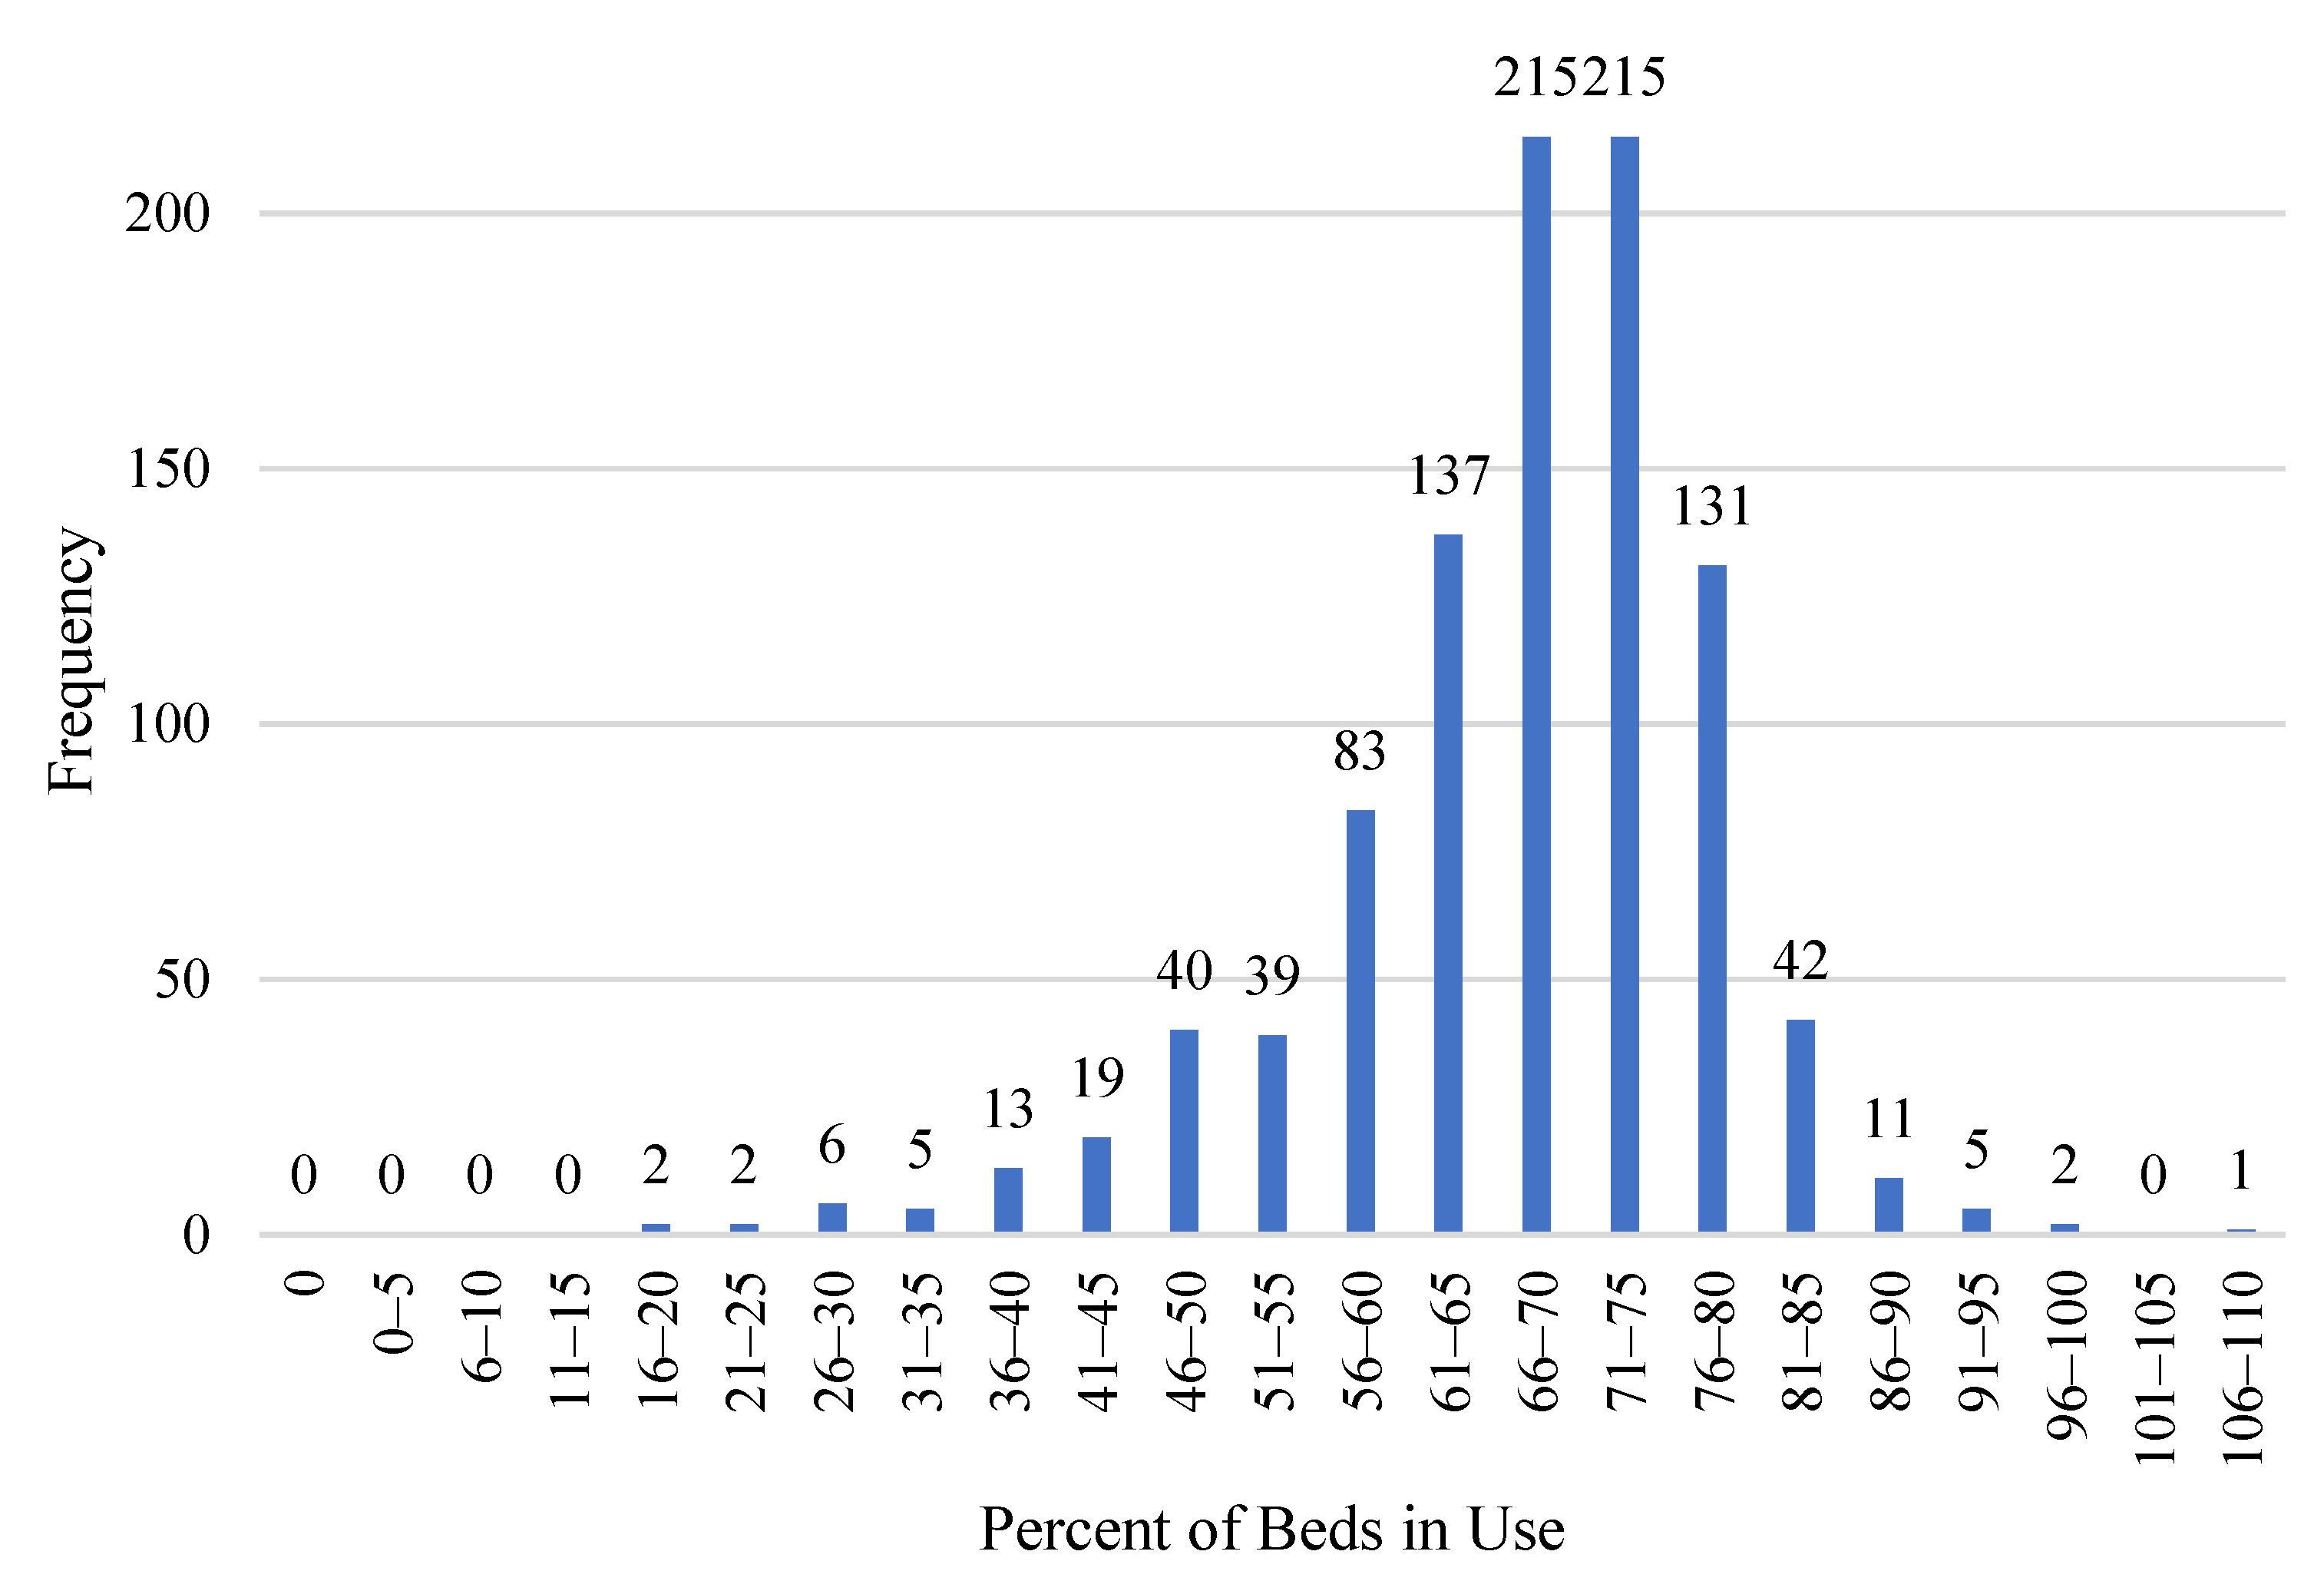
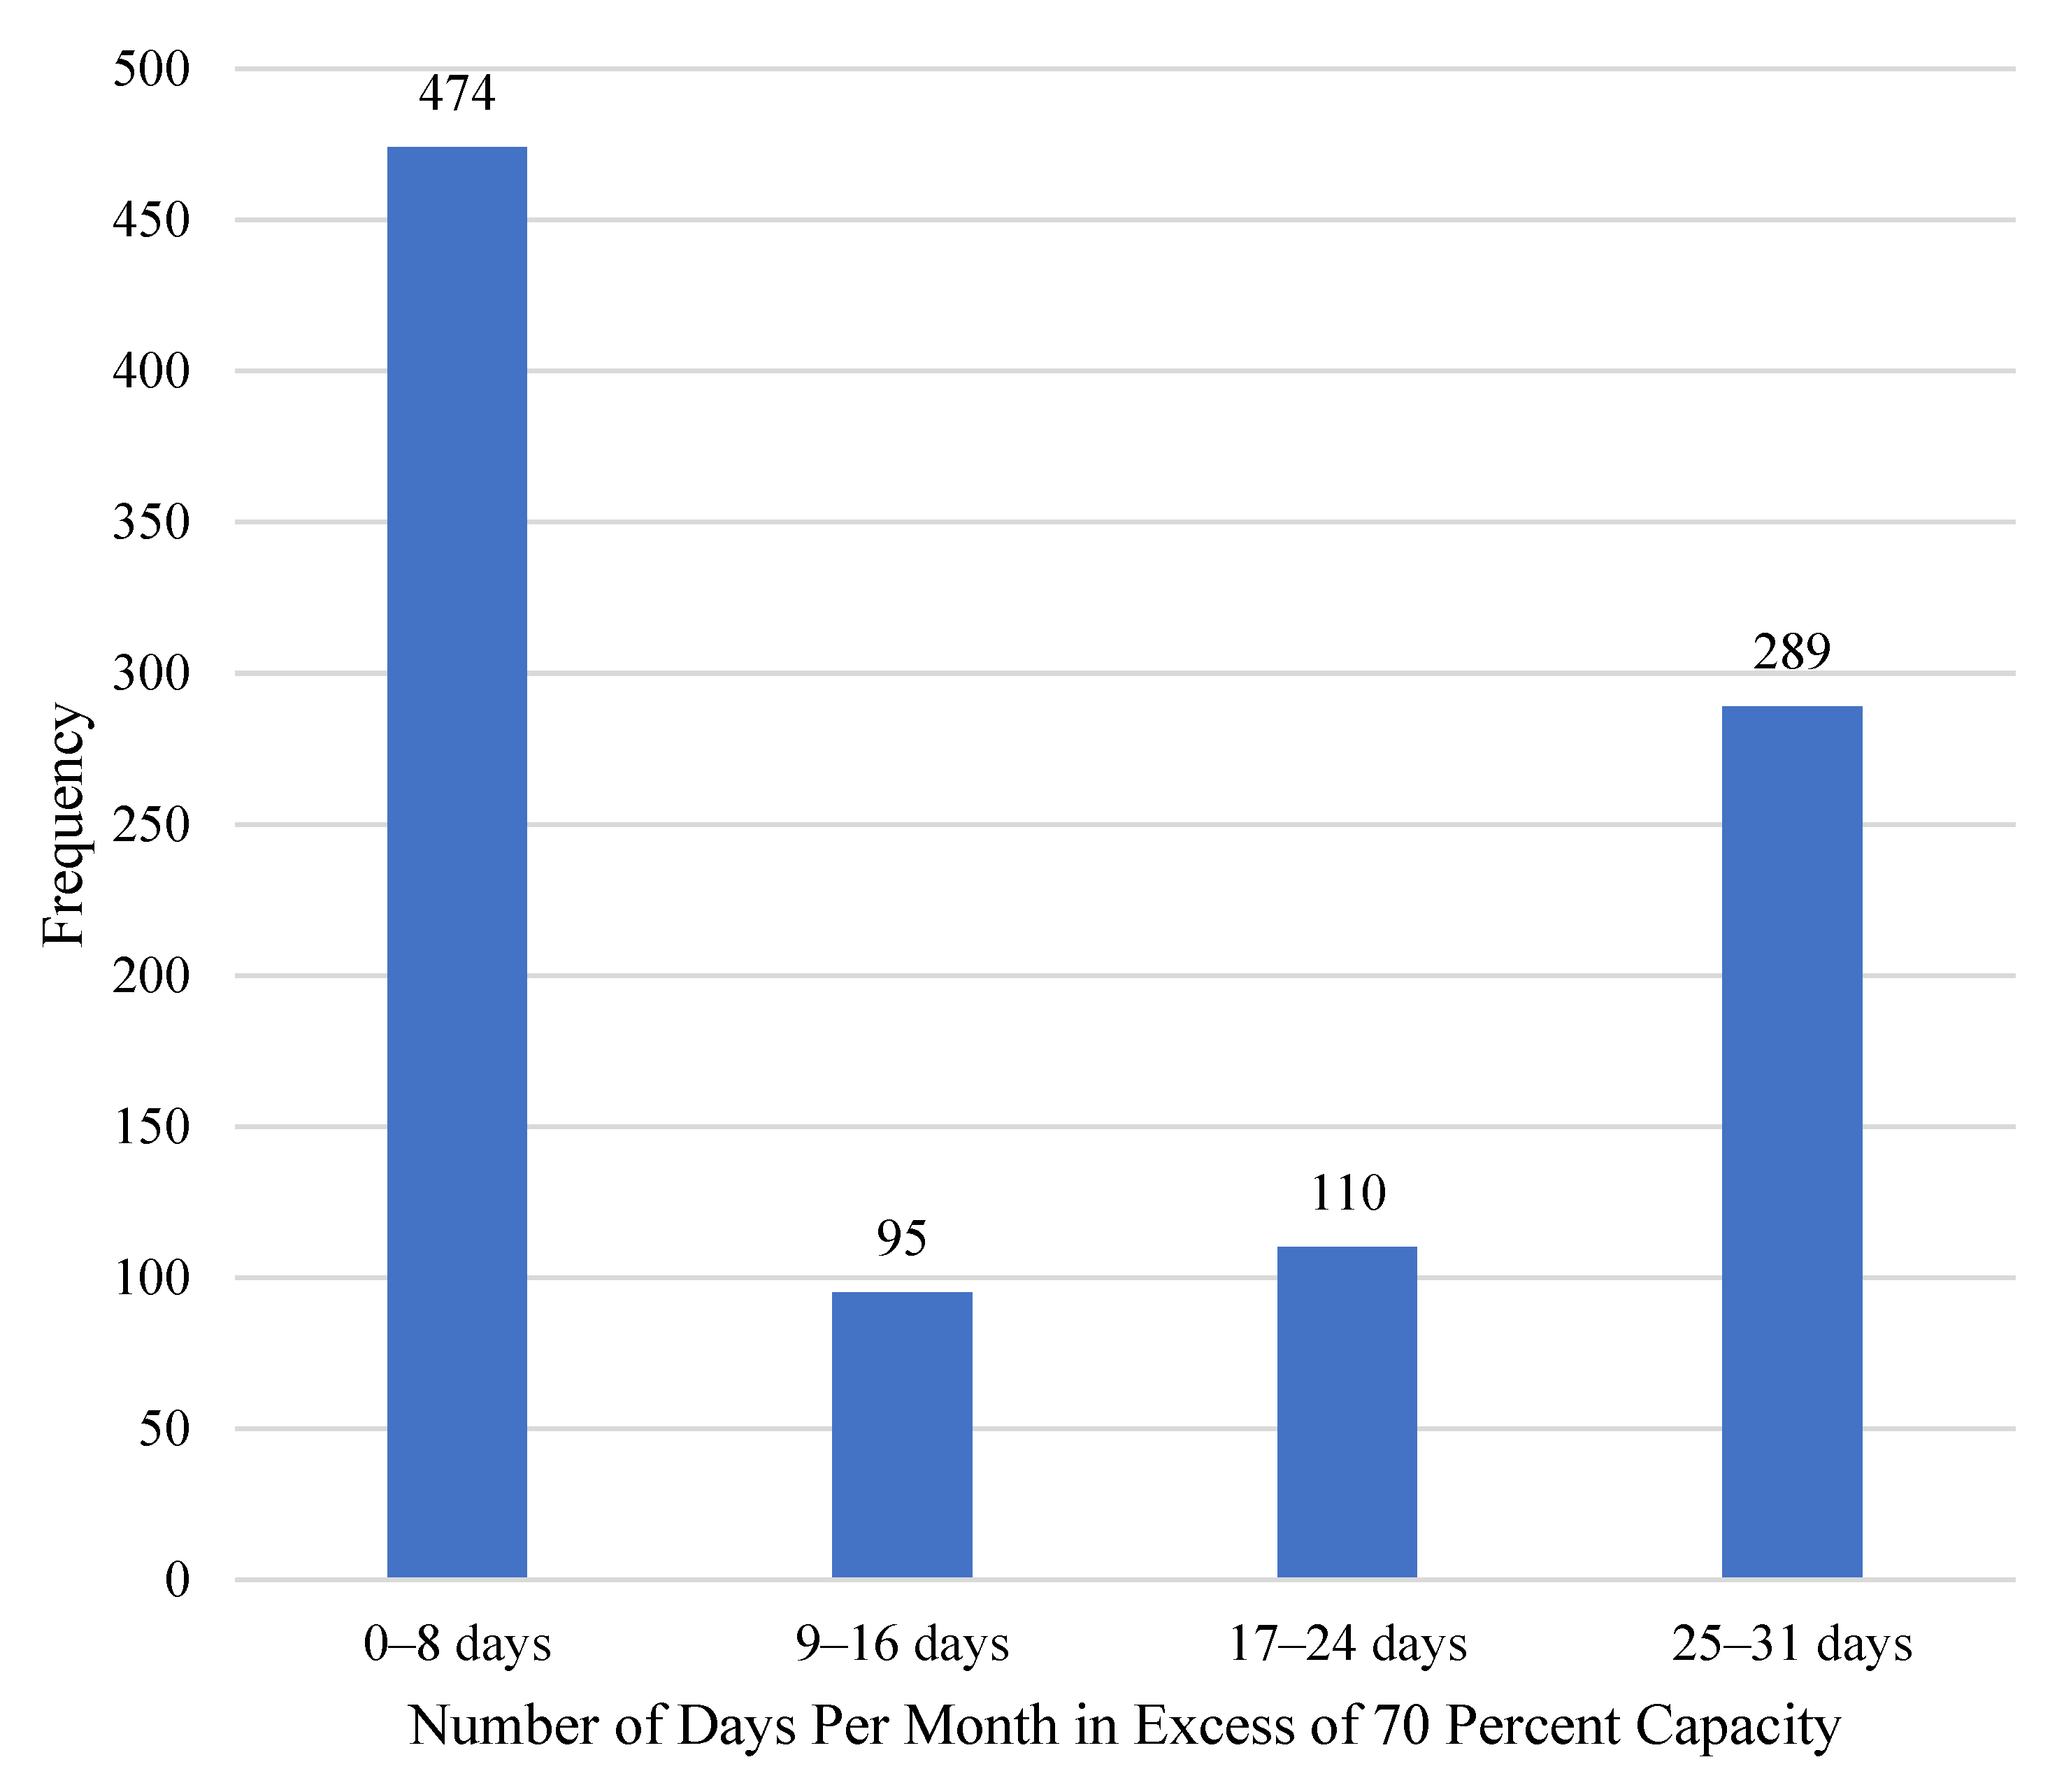
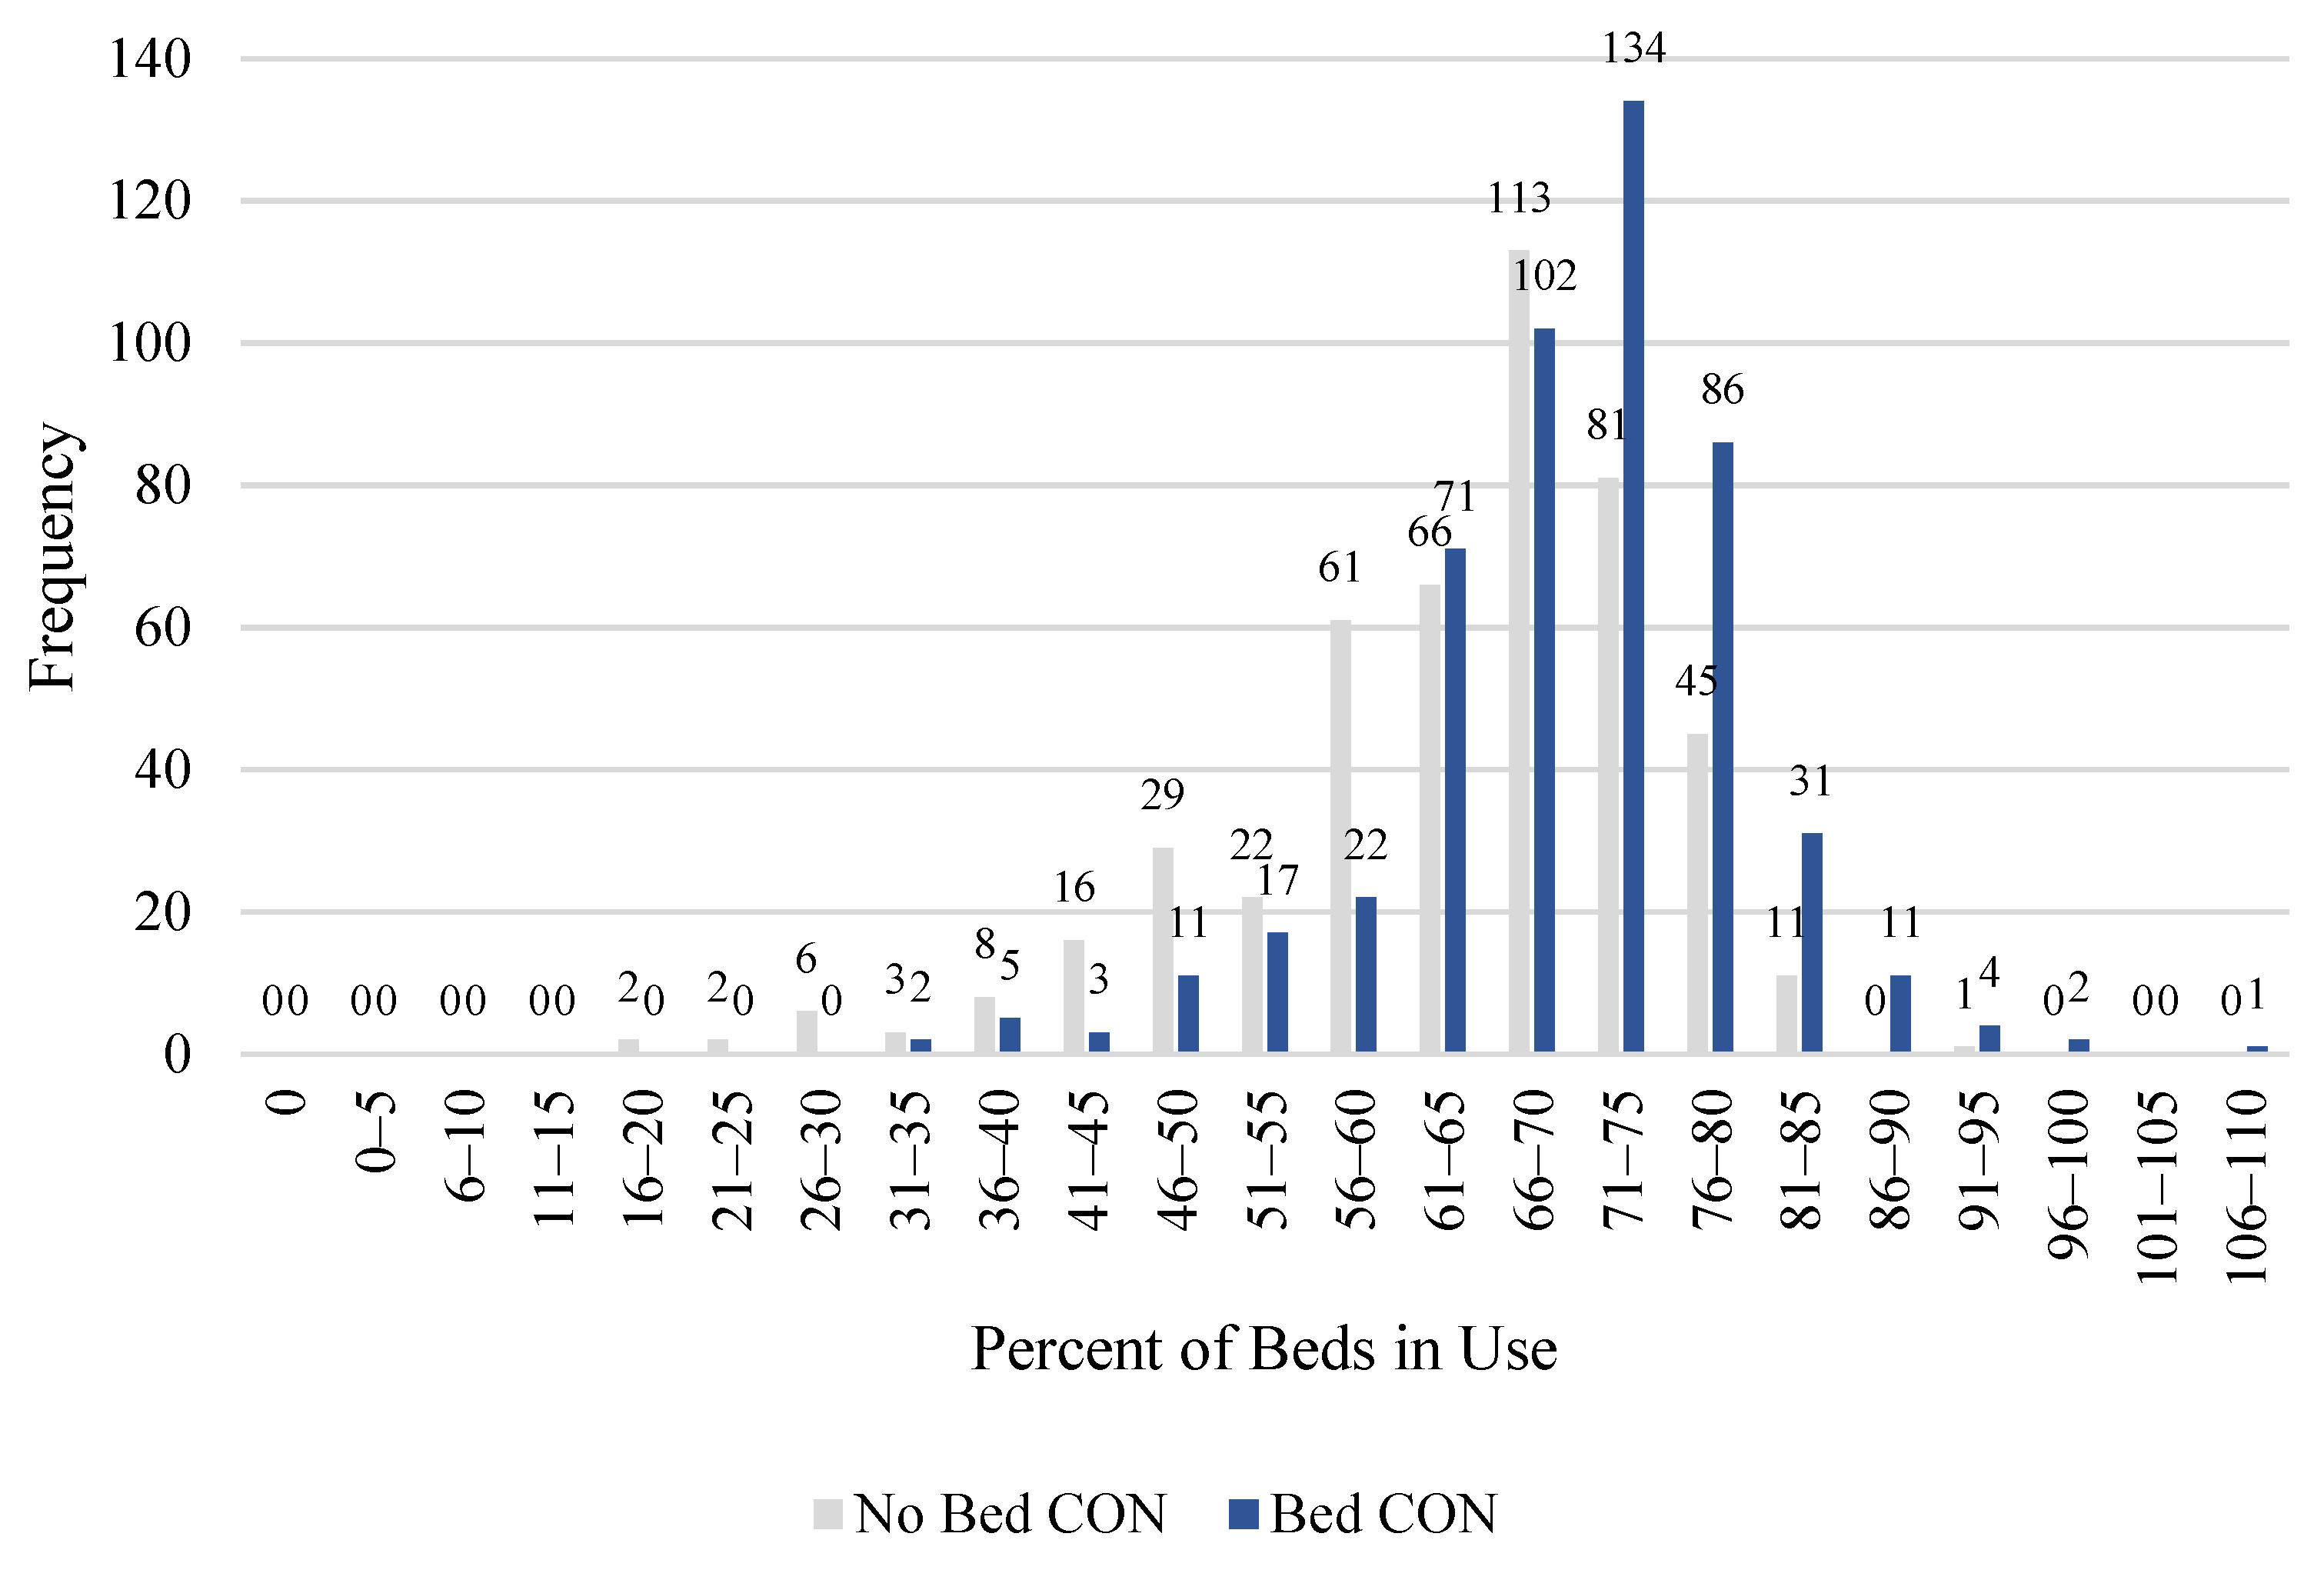
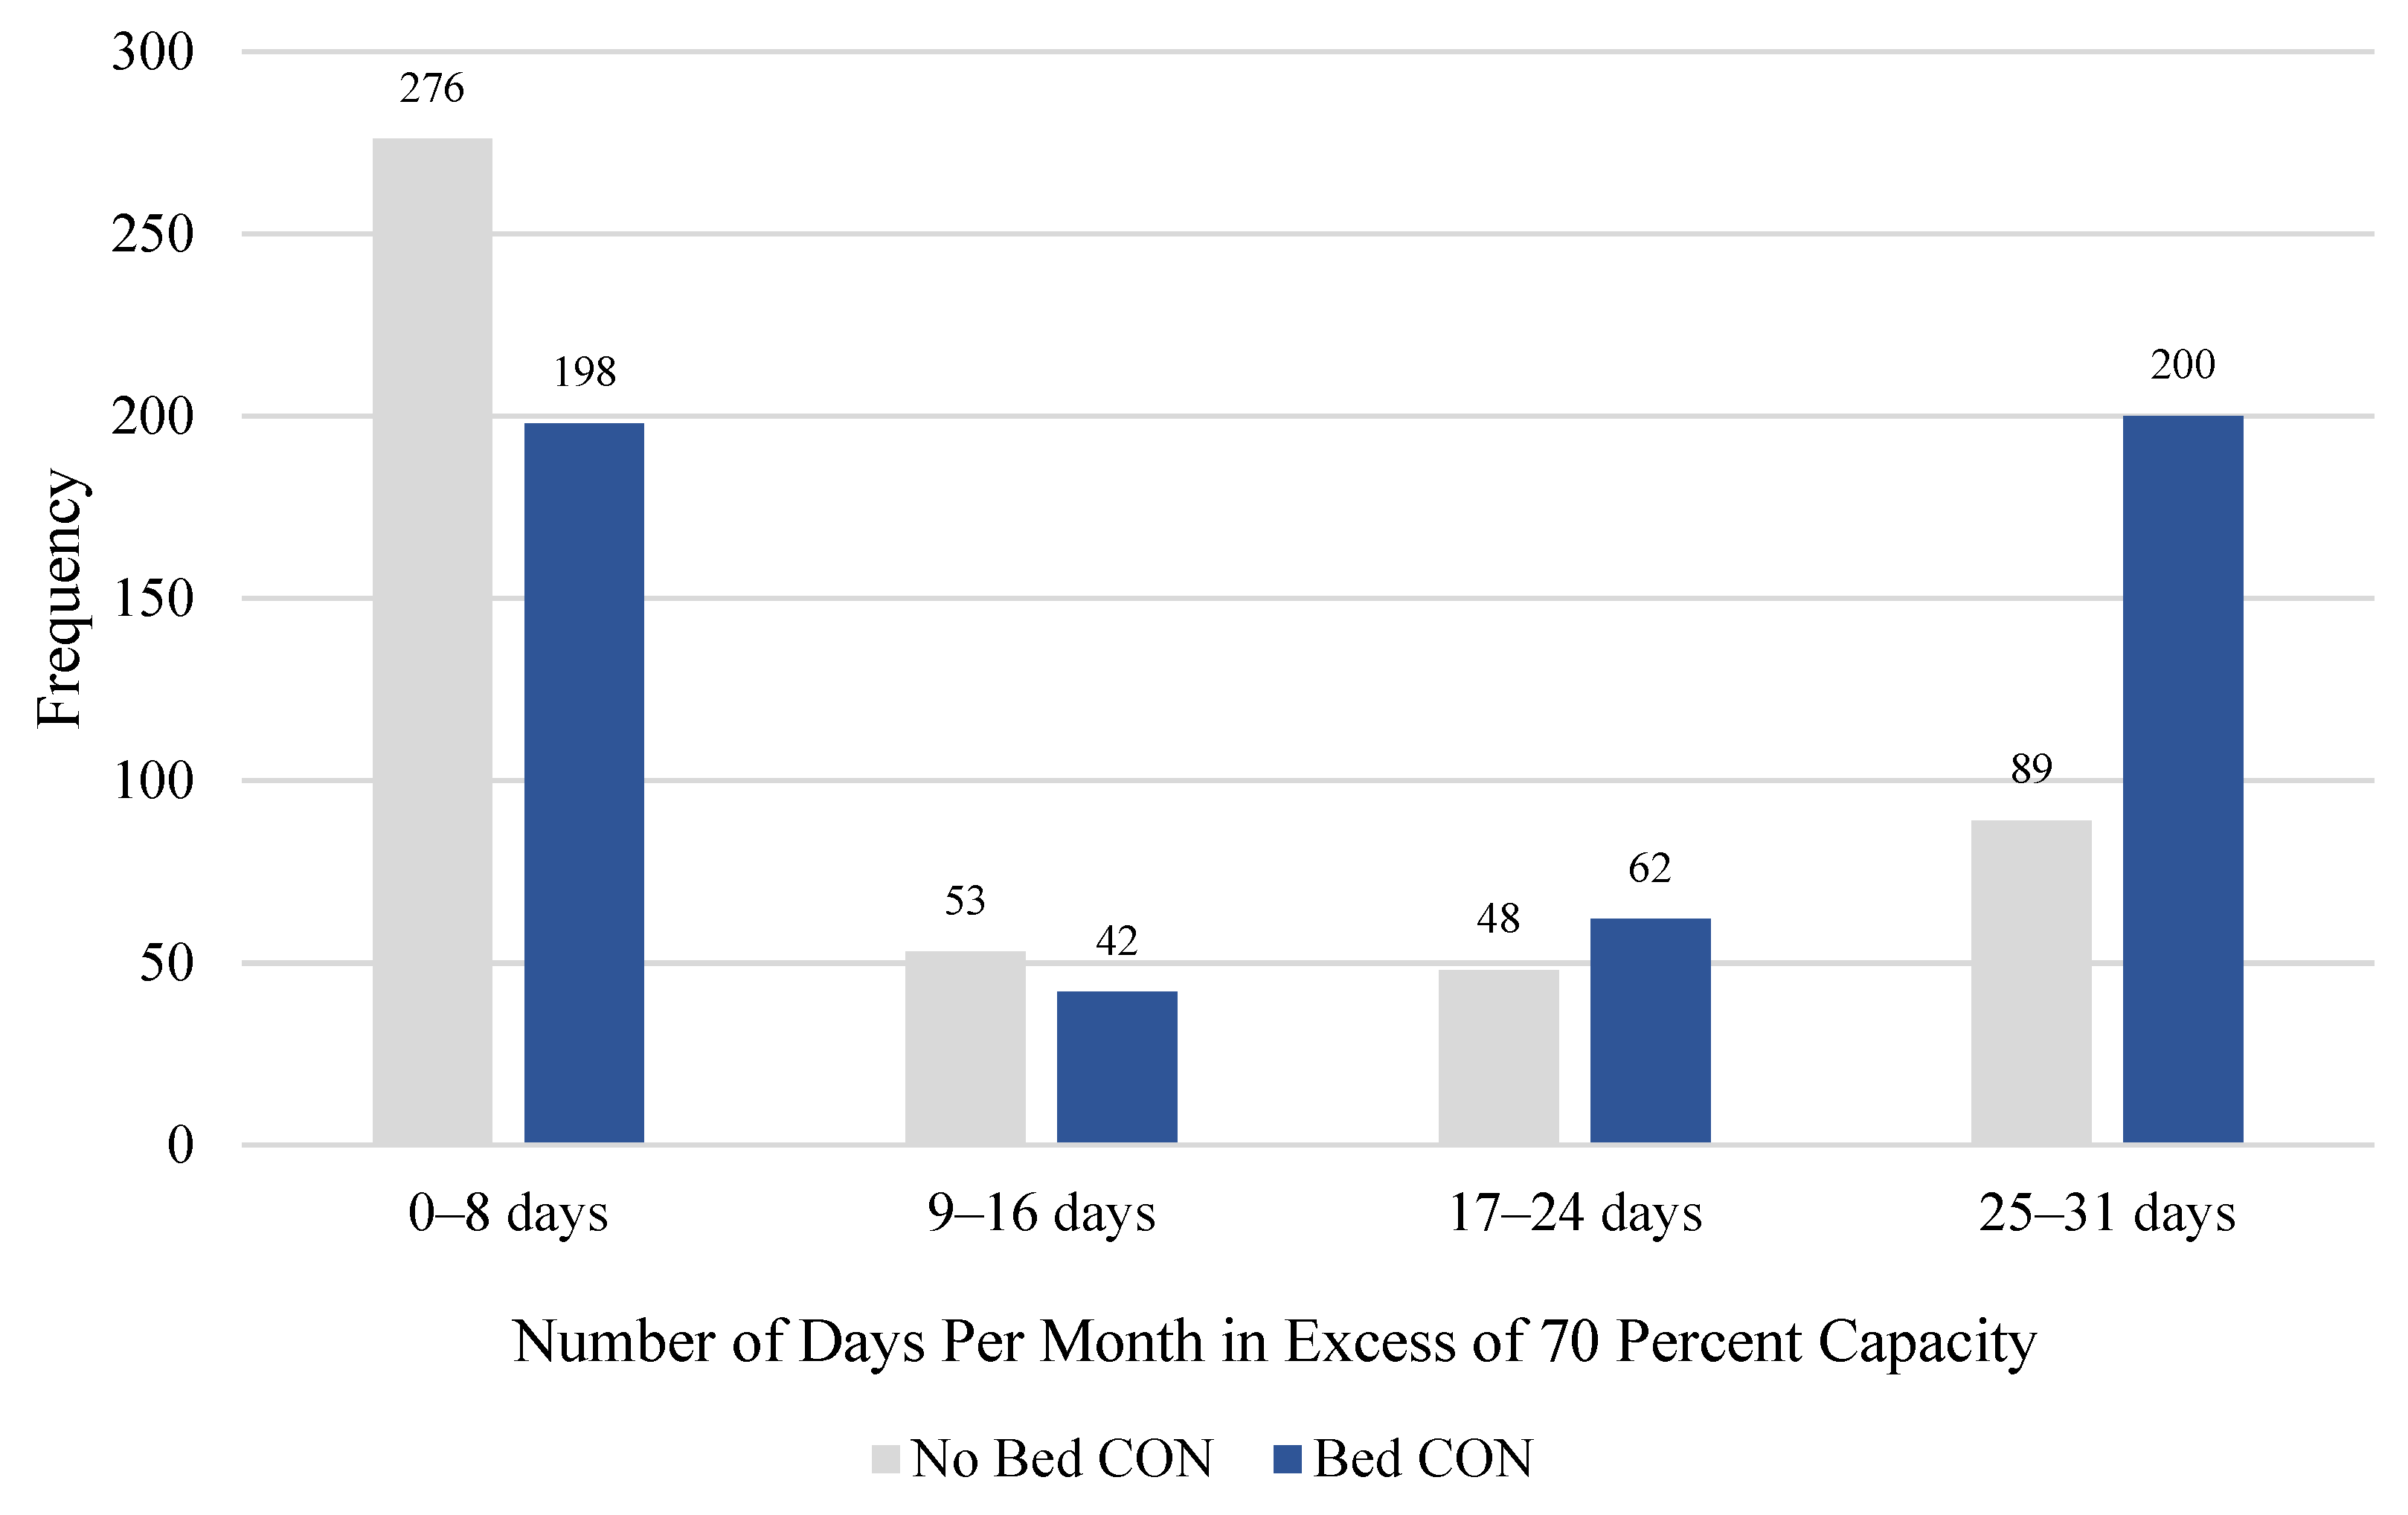
2.1. Hospital Bed Utilization

We obtained hospital bed utilization data from the Federal Department of Health and Human Services (COVID-19 Reported Patient Impact and Hospital Capacity by State Timeseries (2021); COVID-19 Reported Patient Impact and Hospital Capacity by Facility (2021)). That Department maintains a state-aggregated timeseries database on hospital bed utilization rates dating back to the beginning of the pandemic as well as a hospital-level database dating back to July of 2020. Figure 1 shows national bed utilization over the course of the pandemic.2 In January of 2020, approximately 43 percent of all U.S. hospital beds were in use. By July 2020, nationwide bed utilization had jumped to 66 percent. It leveled off at approximately 70 percent until the summer of 2021, when utilization began to rise again.
Figure 2 shows the number of days per month in which the average state was using 70 percent or more of its beds. As late as July 2020, the average state was experiencing 11 days with 70 percent or more of beds in use. The situation continued to worsen, however, so that by September of 2021, the average state was experiencing nearly 24 days of 70 percent occupancy or more. Figure 3 shows bed utilization by state in September of 2021. In that month, Rhode Island had the highest utilization rate, at 87 percent, while Wyoming had the lowest, at 51 percent.
We begin our analysis at the state level and then examine hospital-level data. We rely on two primary measures of statewide bed utilization: average bed utilization per state per month, and the number of days per state per month in which more than 70 percent of a state’s beds are utilized (see Table 1 for a full list of descriptive statistics). These data cover 50 states over the course of 21 months.3
Figure 4 shows the spectrum of bed utilization rates and the frequency with which states fell into different ranges. For example, at the apex of the graph, the first bar with “215” above it indicates that there were 215 times that a state’s average monthly bed utilization rate was between 66 and 70 percent. At the far right of the graph, the short bar with a “1” above it indicates that there was one instance in which a state’s average monthly bed utilization rate was between 106 and 110 percent (in August of 2020 Rhode Island’s average utilization rate was 106.13 percent of its beds).4
Another way to think about statewide bed utilization is to consider how many days in a month a state used 70 percent or more of its hospital beds. Figure 5 offers this perspective. It shows the frequency with which states fell into one of four categories, ranging from 0 to 8 days up to 25 to 31 days. The modal range is 0–8 days. There were 474 times that a state had between 0 and 8 days of the month with more than 70 percent of its beds in use. At the other end of the spectrum, there were 289 times in which a state had between 25 and 31 days of the month with more than 70 percent of its beds in use.

2.2. Certificate-of-Need

There is no centrally collected and systematic data on CON approval rates. Where data are available, however, they suggest that approval is far from guaranteed. One recent study found that from 1996 to 2014, the approval rate in Georgia was approximately 57 percent, in Michigan it was 77 percent, and in Virginia it was 51 percent (Stratmann and Monaghan 2017). Controversially, employees of existing providers often sit on CON boards. Additionally, in all but five CON states, incumbent providers are invited to oppose the applications of would-be competitors (the exceptions are Indiana, Louisiana, Michigan, Nebraska, and New York. Cavanaugh et al. (2020), pp. 61, 75, 89, 117, and 131). In some states, such as Mississippi and Oklahoma, competitors are allowed to appeal a CON decision after it has been made, delaying the process further (Cavanaugh et al. 2020, p. 1). The compliance costs and the revenue providers forgo as they await the decision can amount to tens or even hundreds of thousands of dollars (Hoover 2012).
The federal government once encouraged states to adopt these regulations by threatening to withhold federal funding from any state that failed to do so.5 The goal was to save money by discouraging the acquisition of unneeded equipment that might then be used in unnecessary procedures. A perhaps unintended consequence of these regulations was that by raising barriers to entry and expansion and by allowing providers to challenge their competitor’s expansion plans, CON regulations posed an anticompetitive threat. This explains why antitrust authorities at the Federal Department of Justice and the Federal Trade Commission have long opposed the rules (Botti 2007; Federal Trade Commission and U.S. Department of Justice 2016).
By the 1980s, evidence had begun to emerge that CON laws failed to restrain costs (Hellinger 1976; Salkever and Bice 1976; Sloan and Steinwald 1980; Sloan 1981). Moreover, Congress changed its Medicare reimbursement practices, altering the rationale for the regulation.6 As a result, congressional support for CON waned and in 1986, the federal inducement was eliminated (Pub. L. 99-660, § 701, 100 Stat. 3799 1986). Almost immediately, 12 states repealed their CON laws and in the years since several more have either repealed their CON laws outright or significantly pared them back. With this history, the CON programs have been the subject of many studies examining their effects.7
Research has shown that CON laws do not restrain spending. If anything, the regulations seem to raise spending per service as well as per patient (Noether 1988; Mitchell 2016; Bailey 2019). The evidence on quality has been more mixed (Vaughan-Sarrazin et al. 2002; Lorch et al. 2012) but recent papers that assess quality through multiple metrics and attempt to control for spurious causation conclude that CON laws do not enhance and likely undermine quality of care (Stratmann and Wille 2016; Ohsfeldt and Li 2018; Bailey 2018; Fayissa et al. 2020; Ghosh et al. 2020; Chiu 2021; Baker and Stratmann 2021). By far the most studied aspect of CON regulation is access. Here, the evidence is overwhelming: CON laws restrict access to care, especially for certain populations such as rural communities and ethnic minorities. Researchers find that compared with the experience of patients in non-CON states, the average patient in a CON state has access to fewer hospitals (Stratmann and Russ 2014), fewer ambulatory surgery centers (ASCs) (Stratmann and Koopman 2016; Stratmann and Baker 2020), fewer rural hospitals and rural ASCs (Stratmann and Koopman 2016), fewer hospice care facilities (Carlson et al. 2010), fewer dialysis clinics (Ford and Kaserman 1993), and fewer hospitals offering certain procedures (Robinson et al. 2001; Popescu et al. 2006; Ho et al. 2007; Short et al. 2008; Kolstad 2009; Ho et al. 2009; Vaughan Sarrazin et al. 2010). Patients in CON states wait longer for care (Myers and Sheehan 2020), tend to travel longer distance to obtain care (Kolstad 2009; Cutler et al. 2010; Carlson et al. 2010), and are more likely to leave their states for care (Baker and Stratmann 2021). Large racial disparities in the provision of care close when CON laws are eliminated (Cantor et al. 2009; DeLia et al. 2009).
Previous studies have found that CON regulations are associated with fewer beds per capita (Joskow 1980; Harrington et al. 1997; Hellinger 2009; Eichmann and Santerre 2011; Stratmann and Russ 2014). In the spring of 2020 we examined the link between bed CONs and projected shortages during the pandemic with James Bailey (Mitchell et al. 2020). At that time, however, actual utilization data was not yet available and so we had to rely on projected shortages estimated by the Institute for Health Metrics and Evaluation at the University of Washington. We estimated that states requiring CONs for beds were more likely to experience bed shortages and that these shortages were more likely to be larger than in non-CON states. Now, we have access to actual bed utilization rates during the pandemic and can analyze if these predictions held true.

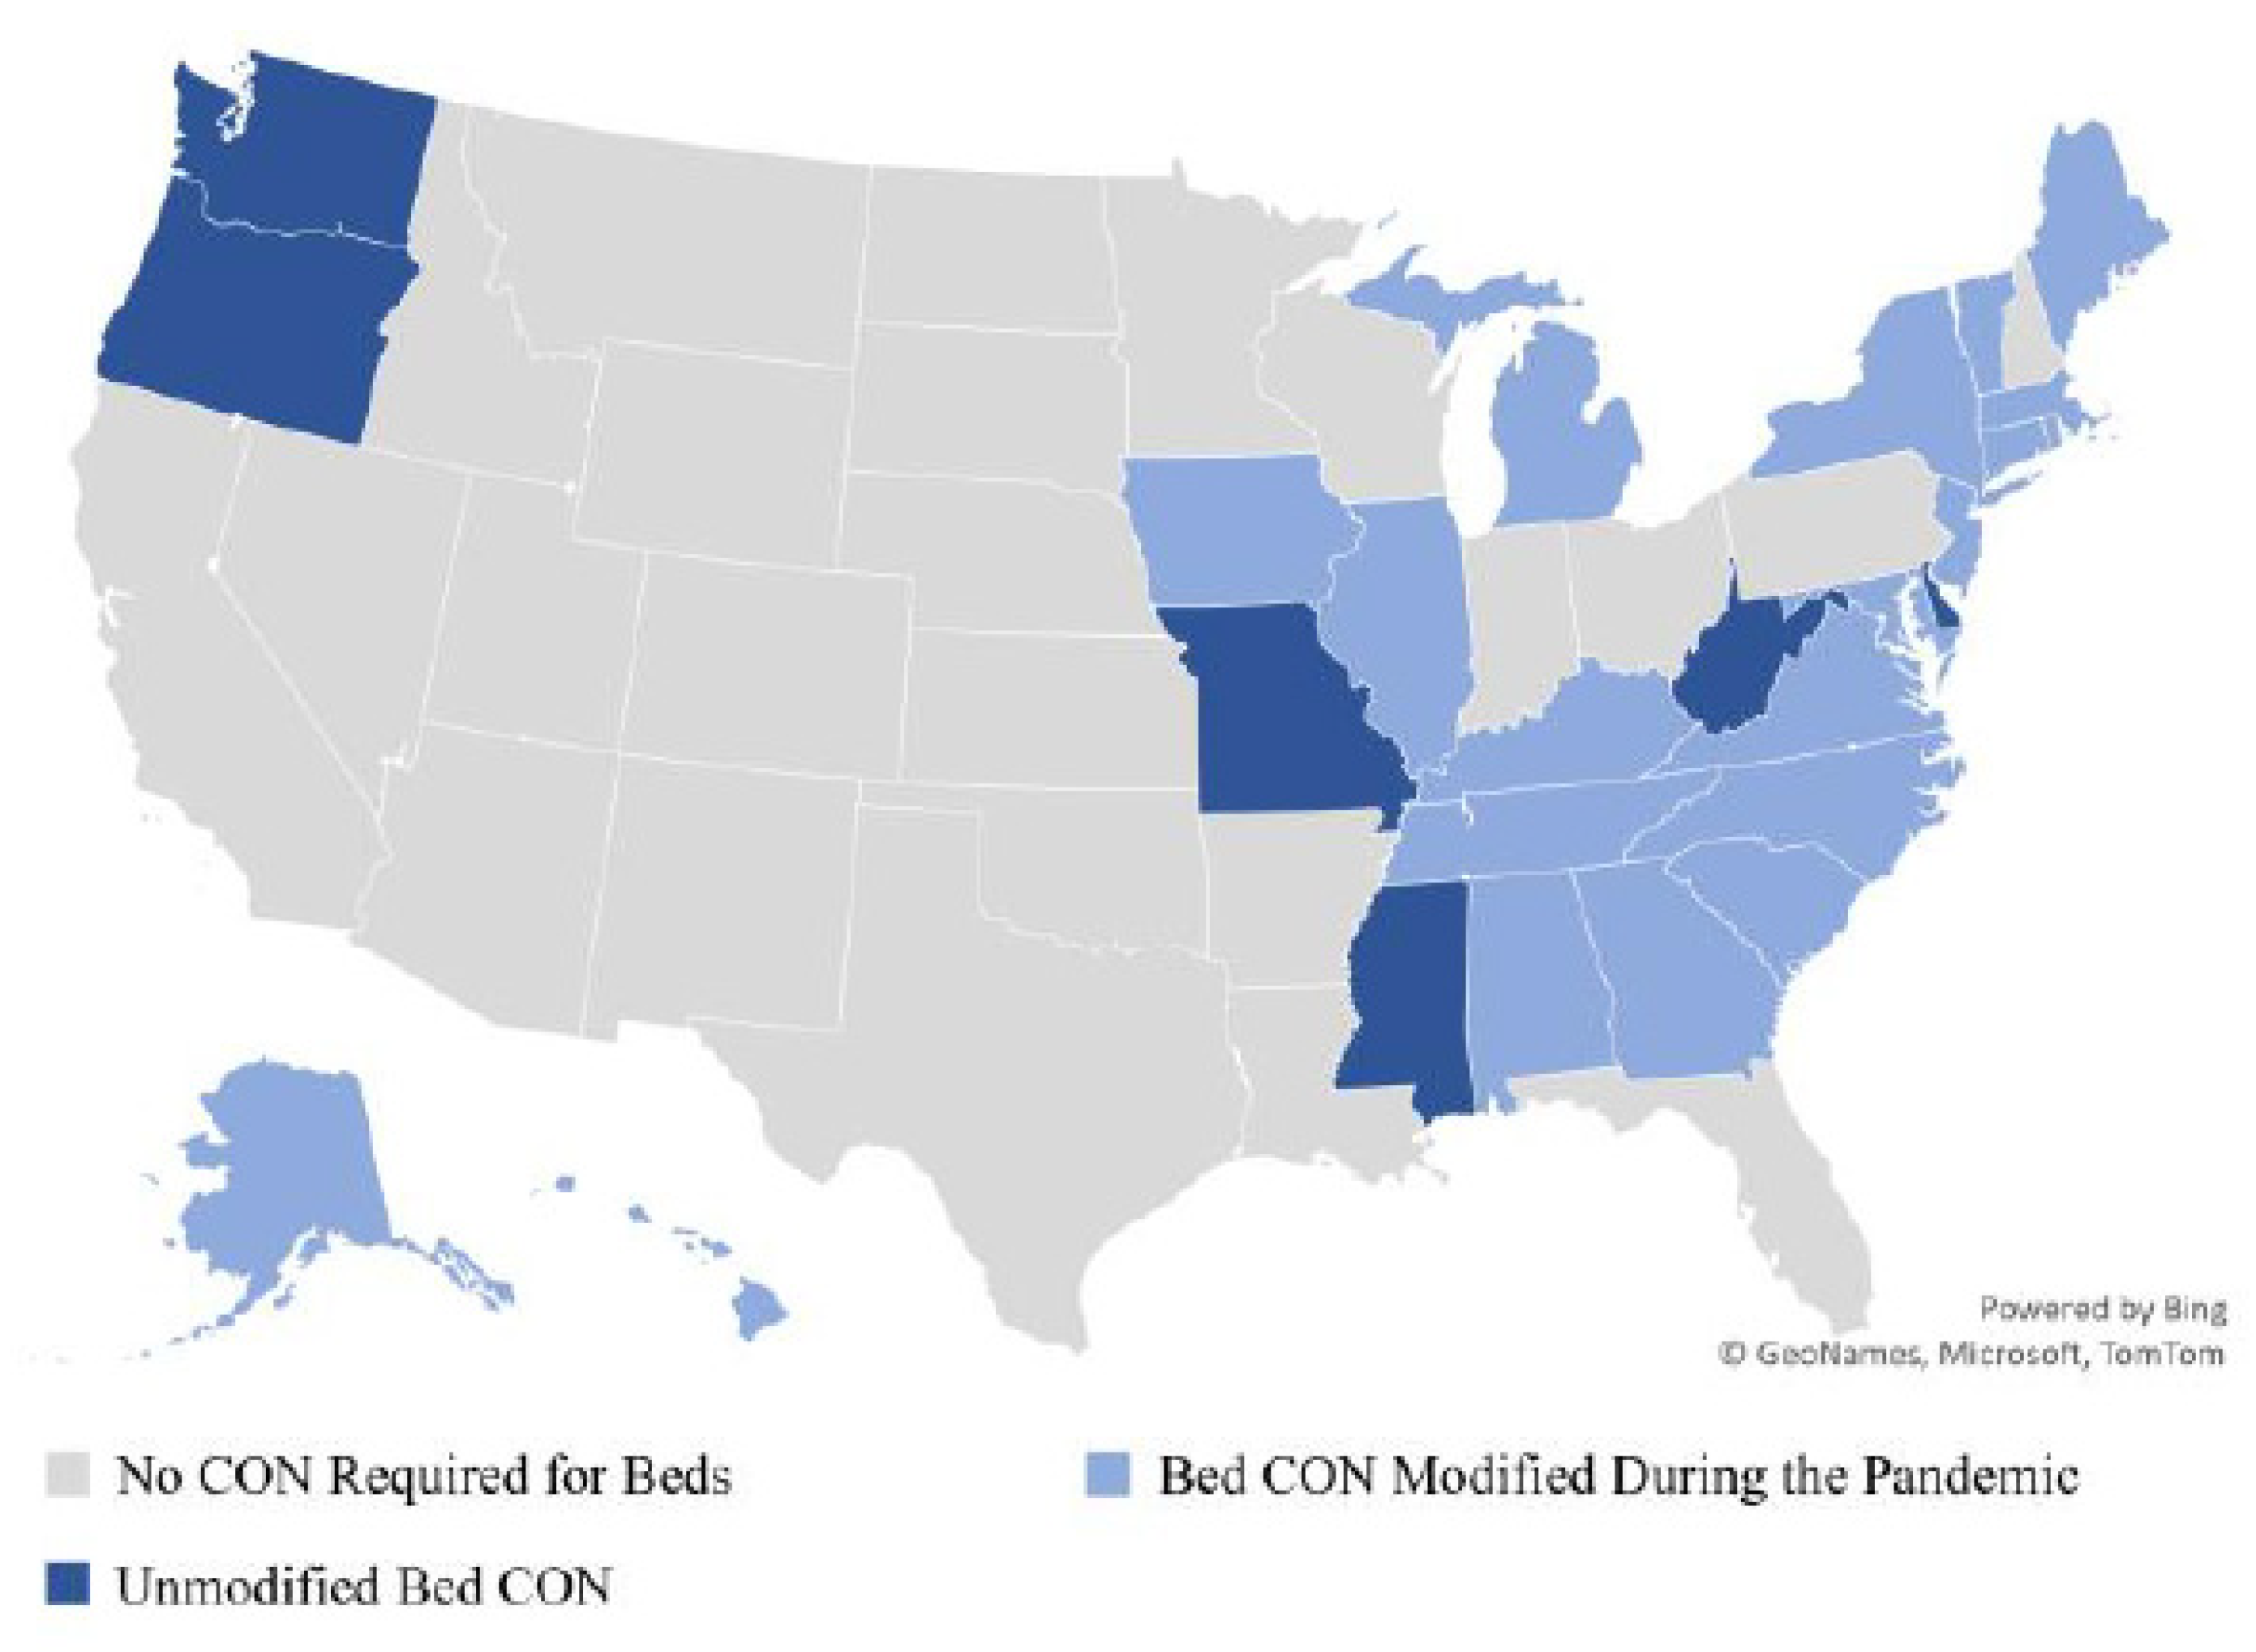
2.3. Hospital Bed CON

Figure 6 shows the status of hospital bed CON requirements during the pandemic. Twenty-six states require providers to obtain a CON before adding—or in some cases even reallocating—hospital beds.8 During the pandemic, however, twenty states moved to relax these rules, often through executive order.9 For example, Tennessee Governor Bill Lee signed an executive order on 19 March 2020 declaring state regulations to be:
suspended to the extent necessary to allow hospitals that would otherwise be subject to certificate of need requirements to temporarily increase their number of licensed hospital beds at any location or temporarily establish hospital and diagnostic services at any location, if necessary for the treatment of COVID-19 patient
The initial executive orders relaxing these requirements were often short term, lasting weeks to months at a time. In addition, CON regulations were generally relaxed so long as a state’s COVID-19 emergency declaration was in effect. Thus, CON relaxations were frequently renewed either by extending a state’s emergency declaration or by issuing new executive orders to amend the length of time that regulations would be relaxed. For instance, Gov. Ralph Northam extended Virginia’s CON suspension in June 2020. Citing the anticipation of rising COVID-19 cases, Northam “again direct[ed] the State Health Commission, at his discretion, to authorize any general hospital or nursing home to increase licensed bed capacity” (Northam 2020).
To the best of our knowledge, in nearly every state that relaxed its CON requirements, any beds acquired under CON relaxation had to be given up upon the expiration of the state’s executive order or emergency declaration. If a health care facility wanted to permanently maintain its increased bed capacity, it could only do so by applying for the beds through the normal CON procedure.
Figure 7 shows the same data that were presented in Figure 4, only now we distinguish between states that require a CON for hospital beds and those that do not. The figure shows that states with bed CON requirements tended to use more of their beds. For example, it shows that in states requiring a CON for beds, the modal range of bed usage is 71 to 75 percent while in states without such a requirement, the modal range is 66–70 percent. Table 2 shows descriptive statistics, broken down by bed CON and non-bed CON states. That table documents that the average bed utilization rate in non-bed CON states was 63.3 percent while the average bed utilization rate in bed CON states was 69.6 percent.
The difference in bed utilization between CON and non-CON states is starker when we focus on the number of days per month in which more than 70 percent of a state’s beds were used. Figure 8 presents this data, showing the same information that was in Figure 5, only now it is broken down by bed CON status. Figure 8 shows that compared with non-CON states, states requiring a CON for beds had more days in which they used more than 70 percent of their beds. For example, it shows that during the time studied (January 2020 through September 2021) there were 200 times that a state requiring a CON for hospital beds had between 25 and 31 days in a month in which it used more than 70 percent of its beds. In contrast, among states that do not require a CON for beds, there were 89 times that a state had 25 to 31 days in which it used more than 70 percent of its beds. In fact, states requiring a CON for hospital beds were more likely to have 25 to 31 days in excess of 70 percent capacity as they were to have 0–8 days in excess of 70 percent capacity. At the other end of the spectrum, non-bed CON states were more likely than CON states to have only a few days of the month with more than 70 percent of their beds in use. In Table 2, we report that the average number of days with more than 70 percent utilization for states without bed CONs was 9.6, while in states with bed CONs, it was 15.8.

2.4. Regressions

We began our regression analysis at the state level, running a series of regressions to estimate the marginal effect of bed CON regulation and the effect of relaxing this regulation, while controlling for possibly confounding factors. Equation (1) presents the main regression model. In the full specification, we estimated bed utilization in state s in month m as a function of bed CON regulation, relaxation of bed CON regulation, a vector of control variables, and a vector of month controls.
U t i l i z a t i o n s , m = α + β ( B e d C O N s , m ) + γ ( B e d C O N R e l a x e d s , m ) + ( D e m o g r a p h i c C o n t r o l s s , m ) Ξ + Γ M 1 Τ + ε s , m
In our state-level analysis, we measure bed utilization in two ways. The first is the average share of beds used per state per month. The second is the number of days per month in which more than 70 percent of a state’s beds were used. Our two primary variables of interest are BedCON and BedCONRelaxed. BedCON takes the value 1 if the state requires a CON for hospital beds and 0 otherwise. BedCONRelaxed takes the value 1 if the state requires a CON for beds and relaxed this requirement in the month in question and 0 otherwise.
Our control vector includes five variables designed to capture the economic and demographic variation between states that might explain demand for and supply of hospital beds: the percent of the population that is Black, the percent of the population that is Hispanic, per capita personal income in 2017, the percent of adults with diabetes, and new COVID cases per month as a share of the state’s population.10 We present summary statistics for each of these variables in Table 1 and Table 2. We also include a vector of month controls to account for variation in demand for beds over time. Because BedCON is time-invariant, we cannot include state effects.
Next, we examined the effect of bed CON regulation at the hospital level. For this, we relied on DHS facility-level data on hospital utilization. It includes the 7-day average bed utilization rate for 4900 facilities from 31 July 2020, through 15 October 2021. We focus on adult inpatient beds, which include all “staffed inpatient adult beds in the hospital including all overflow and active surg[ery]/expansion beds used for inpatients (including all designated ICU beds) reported during the 7-day period” (COVID-19 Reported Patient Impact and Hospital Capacity by Facility 2021).
Equation (2) shows the main facility-level regression model. The dependent variable is equal to 1 if all of these beds were utilized over the previous 7 days and 0 otherwise. In the full specification, we estimated bed utilization in facility f in week w as a function of bed CON regulation, relaxation of bed CON regulation, a vector of demographic control variables, a vector of hospital controls, and a vector of month controls. The vector of demographic control variables is identical to the demographic control vector used in the state-aggregated tests. The hospital control vector includes indicator variables for critical access and long-term care facilities (with short-term care facilities as the reference). It also includes an indicator equal to 1 if the hospital is located in a rural community and 0 otherwise.
100 P e r c C a p f , w = α + β ( B e d C O N f , w ) + γ ( B e d C O N R e l a x e d f , w ) + ( D e m o g r a p h i c C o n t r o l s s , m ) Ξ + ( H o s p i t a l C o n t r o l s f , w ) Π + Γ M 1 Τ + ε f , w
Table 3 and Table 4 present the descriptive statistics for our hospital-level data.

3. Results

Table 5 presents the results of the first regression. In the full specifications, the estimated coefficient on BedCON is 7.6. This means that, compared with a non-CON state, controlling for other possibly confounding factors, a state that requires a CON for hospital beds had 7.6 percentage points more of its beds in use during the pandemic. Note that among non-CON states, the average share of beds in use was 63 percent (see Table 2). Thus, this point estimate means that a state that requires a CON for hospital beds used 12 percent more of its beds. The estimated coefficient is statistically significant at the one percent level and is robust across specifications. The estimated coefficient on BedCONRelaxed is negative and smaller in magnitude than the estimated coefficient on BedCON and it fails to obtain statistical significance in any of our regressions. Among the control variables, the estimated coefficients on Percent Black, Percent Hispanic, and New Cases per Population are all positive and statistically significant. These estimates suggest that states with a higher share of the population that is Black, Hispanic, or currently suffering from COVID are expected to use a higher share of their hospital beds. Per capita personal income and the share of the population with diabetes do not seem to have a statistically significant effect on average monthly bed usage.
Table 6 presents the results of the second regression. In the full specification, the estimated coefficient on BedCON is 5.7. This means that in the average month, compared with a non-CON state, a state that requires a CON for hospital beds had 5.7 more days with more than 70 percent of its beds in use. The typical non-CON state has 9.6 days with more than 70 percent of its beds in use. Thus, compared with non-CON states, a state requiring a CON for beds has approximately 58 percent more days with more than 70 percent of its beds in use. The estimate is statistically significant at the 10 percent level in the full and limited models and at the 5 percent level in the more parsimonious models. As with the previous tests, there is no statistically significant effect from relaxing bed CON requirements.
Higher percentages of Hispanics and Blacks are correlated with more days in excess of 70 percent bed usage, but the latter is not always statistically significant. Counterintuitively, per capita income correlates positively with more days in excess of 70 percent. Additionally, while both diabetes and new COVID cases correlate with more days in excess of 70 percent, only the latter is statistically significant and not always so.
Table 7 presents the results of our facility-level regression analysis. The point estimate on BedCON suggests that facilities in states that require a CON for beds were approximately 27 percent more likely to utilize all of their beds. The estimate is statistically significant at the 5 percent level in all specifications. As with the state-level analysis, we find that relaxed CON requirements have no statistically significant effect on the likelihood that a facility will use all of its beds. The statewide share of Hispanics and Blacks is also statistically unrelated to facility-level bed utilization. Unsurprisingly, facilities in states with more COVID cases were more likely to utilize all of their beds. Facilities in states with higher incomes were less likely to utilize all of their beds. Diabetes rates were unrelated to facility-level utilization. If anything, hospitals serving rural communities and critical access hospitals were less likely to utilize all of their beds, but neither effect was statistically significant. Long-term care facilities were slightly more likely to utilize all of their beds but the effect was not statistically significant.

4. Discussion

Health care providers in certificate-of-need states must obtain permission from regulators before they may open new facilities, expand existing services, or acquire new equipment. The regulation is intended to limit the acquisition of expensive, unneeded medical equipment, but research suggests that it limits access, throttles competition, and undermines quality. Need is subjective and difficult to assess under normal circumstances (especially since planners are not guided by the market signals of prices, profit, and loss). However, the COVID-19 pandemic exposed the acute difficulty in planning for an unprecedented surge in the need for medical services. Though it was widely believed to be a temporary phenomenon, the surge in demand has persisted and many hospitals found themselves overwhelmed in the summer of 2021. This surge has taken a toll on patients, as strained hospitals across the country have had to triage cases more aggressively.
As the pandemic unfolded, early analysis using projections suggested that CON states were more likely to experience shortages in hospital beds and that these shortages were likely to be larger in CON states relative to non-CON states (Mitchell et al. 2020). Now that we have access to actual bed utilization rates during the pandemic, we can study whether these projections were accurate.
In this paper, we examine statewide bed utilization during the pandemic to see if states that require CONs for hospital beds were more likely to utilize more of their beds. We also examine the effect of emergency measures to relax these CON requirements. We find that compared with non-CON states, states that require a CON for beds used approximately 12 percent more of their beds and had approximately 58 percent more days with more than 70 percent of their beds in use. Facilities in these states were 27 percent more likely to utilize all of their beds. These findings are important given that previous research has established a link between capacity strain and increased risk of mortality.
We also find that states that relaxed these regulations saw no statistically significant difference in bed utilization. It is possible that hospitals were unable to add beds because complementary capital (emergency rooms, ICUs) could not be built quickly enough to house the beds. It is also possible that the procurement process simply takes too long to ramp up capacity in a global emergency. Finally, providers may not have been able to expand their capacity because of the way that CON laws were relaxed. As a rule, any beds acquired under relaxed CON procedures had to be surrendered upon the expiration of state executive orders or emergency declarations and this may have made providers reluctant to even try to expand their bed counts to accommodate the surging need. In any case, the relaxation of CON laws during the pandemic seems to have been too little, too late.
These results suggest that states that permanently eliminate their CON requirements for hospital beds may be less likely to experience shortages. They also suggest, however, that CON relaxation may need to be permanent to be helpful.

Author Contributions

Conceptualization, M.M. and T.S.; methodology, M.M. and T.S.; validation M.M. and T.S.; formal analysis, M.M. and T.S.; investigation, M.M. and T.S.; data curation, M.M.; writing—original draft preparation, M.M.; writing—review and editing, T.S.; visualization, M.M. All authors have read and agreed to the published version of the manuscript.

Funding

This research received no external funding.

Informed Consent Statement

Not applicable.

Data Availability Statement

Our primary data sources were: “American Community Survey (ACS)”. n.d. The United States Census Bureau. Accessed on 8 October 2021: https://www.census.gov/programs-surveys/acs. “COVID-19 Reported Patient Impact and Hospital Capacity by Facility”. 2021. HealthData.Gov. Accessed on 1 November 2021: https://healthdata.gov/Hospital/COVID-19-Reported-Patient-Impact-and-Hospital-Capa/anag-cw7u. “COVID-19 Reported Patient Impact and Hospital Capacity by State Timeseries”. 2021. HealthData.Gov. Accessed on 1 October 2021: https://healthdata.gov/Hospital/COVID-19-Reported-Patient-Impact-and-Hospital-Capa/g62h-syeh. Erickson, Angela. 2021. “States Are Suspending Certificate of Need Laws in the Wake of COVID-19 but the Damage Might Already Be Done”. Pacific Legal Foundation (blog). Accessed on 11 January 2021: https://pacificlegal.org/certificate-of-need-laws-covid-19/. Mitchell, Matthew D., Anne Philpot, and Jessica McBirney. 2021. “CON Laws in 2020: About the Update”. Arlington, VA: Mercatus Center at George Mason University. https://www.mercatus.org/publications/healthcare/con-laws-2020-about-update. “National Diabetes Statistics Report, 2020”. 2020. Centers for Disease Control and Prevention. Accessed on 11 February 2020: https://www.cdc.gov/diabetes/library/features/diabetes-stat-report.html. “United States COVID-19 Cases and Deaths by State over Time”. n.d. HealthData.Gov. Accessed 1 October 2021. https://healthdata.gov/dataset/United-States-COVID-19-Cases-and-Deaths-by-State-o/hiyb-zgc2. US Department of Commerce, B. E. A. n.d. “Bureau of Economic Analysis”. National Income and Product Accounts Tables. Accessed on 6 December 2013: http://www.bea.gov/iTable/iTable.cfm?ReqID=9&step=1#reqid=9&step=1&isuri=1.

Acknowledgments

We thank two anonymous reviewers for their helpful suggestions. We are grateful to Christopher Kaiser and Liam Sigaud for their careful research assistance. We are responsible for any errors or omissions.

Conflicts of Interest

The authors declare no conflict of interest.

Notes

1
For an overview, see Mitchell et al. (2021).
2
In this figure, the data are national; they are not averaged across states. In other words, it shows the total number of occupied beds in the country, divided by the total number of beds in the country. In subsequent analysis, however, we use state-aggregated data.
3
Owing to missing data in the first two months of the pandemic, we have 968 observations, one for each state-month combination.
4
A state or a hospital’s bed utilization rate can exceed 100 percent if it has more patients than beds to accommodate them.
5
(National Health Planning and Resources Development Act of 1974 1975) Due to repeated postponement, this was a threat that never materialized (Conover and Bailey 2020, p. 2).
6
Mark Botti of the Antitrust Division of the Department of Justice noted the implications of this change in testimony before the Georgia State Assembly in 2007: “In addition to the fact that CON laws have been ineffective in serving their original purpose, CON laws should be reexamined because the reimbursement methodologies that may in theory have justified them initially have changed significantly since the 1970s. The federal government no longer reimburses on a cost-plus basis” (Botti 2007).
7
One of us is preparing a survey of the CON literature and has identified over 70 peer reviewed empirical studies.
8
Our data are derived from Mitchell et al. (2021).
9
Other states relaxed their CON laws, but 20 of these modifications affected bed CON requirements. To obtain this data, we began with initial research conducted by Angela C. Erikson of the Pacific Legal Foundation (Erickson 2021). We then updated this information by reviewing state executive orders and by contacting states’ CON regulatory authorities for comment. In instances where we were unable to contact a state’s CON regulatory authority, we relied on textual examination of a state’s executive orders and emergency declarations to obtain the status and substance of the CON relaxation. If a relaxation occurred (ended) in the first 15 days of the month, then it is coded to have occurred (ended) in that month. If the relaxation occurred (ended) after the first 15 days of a month, then it is coded to have occurred (ended) in the following month.
10
We obtained Percent Black and Percent Hispanic data from the Census Bureau. We obtained per capita income data from the Bureau of Economic Analysis. The percent of adults (age 18 or older) with diabetes was obtained from the Centers for Disease Control and Prevention. Additionally, the number of new cases was obtained from the Healthdata.gov website maintained by the DHS and converted to per capita figures using state population totals obtained from the Census (American Community Survey n.d.; US Department of Commerce, B. E. A. n.d.; National Diabetes Statistics Report 2020; United States COVID-19 Cases and Deaths by State over Time n.d.).

References

  1. American Community Survey—ACS. n.d. The United States Census Bureau. Available online: https://www.census.gov/programs-surveys/acs (accessed on 8 October 2021).
  2. Bailey, James. 2018. The Effect of Certificate of Need Laws on All-Cause Mortality. Health Services Research 53: 49–62. [Google Scholar] [CrossRef]
  3. Bailey, James. 2019. Can Health Spending Be Reined in through Supply Restraints? An Evaluation of Certificate-of-Need Laws. Journal of Public Health 27: 755–60. [Google Scholar] [CrossRef]
  4. Baker, Matthew C., and Thomas Stratmann. 2021. Barriers to Entry in the Healthcare Markets: Winners and Losers from Certificate-of-Need Laws. Socio-Economic Planning Sciences 2021: 101007. [Google Scholar] [CrossRef]
  5. Barclay, Eliza, Dylan Scott, and Christina Animashaun. 2020. The US Doesn’t Just Need to Flatten the Curve. It Needs to ‘Raise the Line’. Vox. April 7. Available online: https://www.vox.com/2020/4/7/21201260/coronavirus-usa-chart-mask-shortage-ventilators-flatten-the-curve (accessed on 8 October 2021).
  6. Boone, Rebecca, Iris Samuels, and Lindsey Tanner. 2021. EXPLAINER: What Are ‘Crisis Standards of Care?’. AP NEWS. September 17. Available online: https://apnews.com/article/business-health-public-health-coronavirus-pandemic-montana-4f68683b175340bf525c45aa133045ba (accessed on 8 October 2021).
  7. Botti, Mark. 2007. Competition In Healthcare And Certificates Of Need. In Testimony Before A Joint Session of The Health and Human Services Committee of the State Senate and The CON Special Committee of the State House of Representatives of the General Assembly of the State of Georgia. Washington, DC: U.S. Department of Justice Antitrust Division, Available online: https://www.justice.gov/atr/competition-healthcare-and-certificates-need#N_16_ (accessed on 8 October 2021).
  8. Cantor, Joel C., Derek DeLia, Amy Tiedemann, Ava Stanley, and Karl Kronebusch. 2009. Reducing Racial Disparities In Coronary Angiography. Health Affairs 28: 1521–31. [Google Scholar] [CrossRef] [Green Version]
  9. Carlson, Melissa D. A., Elizabeth H. Bradley, Qingling Du, and R. Sean Morrison. 2010. Geographic Access to Hospice in the United States. Journal of Palliative Medicine 13: 1331–38. [Google Scholar] [CrossRef] [Green Version]
  10. Cavanaugh, Jaimie, Caroline Grace Brothers, Adam Griffin, Richard Hoover, Melissa LoPresti, and John Wrench. 2020. Conning the Competition: A Nationwide Survey of Certificate of Need Laws. Arlington: Institute for Justice, Available online: https://ij.org/wp-content/uploads/2020/08/Conning-the-Competition-WEB-08.11.2020.pdf (accessed on 8 October 2021).
  11. Chiu, Kevin. 2021. The Impact of Certificate of Need Laws on Heart Attack Mortality: Evidence from County Borders. Journal of Health Economics 79: 102518. [Google Scholar] [CrossRef]
  12. Conover, Christopher J., and James Bailey. 2020. Certificate of Need Laws: A Systematic Review and Cost-Effectiveness Analysis. BMC Health Services Research 20: 748. [Google Scholar] [CrossRef]
  13. COVID-19 Reported Patient Impact and Hospital Capacity by Facility. 2021. HealthData.Gov. November 1. Available online: https://healthdata.gov/Hospital/COVID-19-Reported-Patient-Impact-and-Hospital-Capa/anag-cw7u (accessed on 8 October 2021).
  14. COVID-19 Reported Patient Impact and Hospital Capacity by State Timeseries. 2021. HealthData.Gov. October 1. Available online: https://healthdata.gov/Hospital/COVID-19-Reported-Patient-Impact-and-Hospital-Capa/g62h-syeh (accessed on 8 October 2021).
  15. Cutler, David M., Robert S. Huckman, and Jonathan T. Kolstad. 2010. Input Constraints and the Efficiency of Entry: Lessons from Cardiac Surgery. American Economic Journal: Economic Policy 2: 51–76. [Google Scholar] [CrossRef]
  16. D’Aunno, Thomas, Melissa Succi, and Jeffrey A. Alexander. 2000. The Role of Institutional and Market Forces in Divergent Organizational Change. Administrative Science Quarterly 45: 679–703. [Google Scholar] [CrossRef] [Green Version]
  17. DeLia, Derek, Joel C. Cantor, Amy Tiedemann, and Cecilia S. Huang. 2009. Effects of Regulation and Competition on Health Care Disparities: The Case of Cardiac Angiography in New Jersey. Journal of Health Politics, Policy and Law 34: 63–91. [Google Scholar] [CrossRef] [PubMed]
  18. Eichmann, Traci L., and Rexford E. Santerre. 2011. Do Hospital Chief Executive Officers Extract Rents from Certificate of Need Laws. Journal of Health Care Finance 37: 1–14. [Google Scholar] [PubMed]
  19. Erickson, Angela. 2021. States Are Suspending Certificate of Need Laws in the Wake of COVID-19 but the Damage Might Already Be Done. Pacific Legal Foundation (Blog). January 11. Available online: https://pacificlegal.org/certificate-of-need-laws-covid-19/ (accessed on 8 October 2021).
  20. Eriksson, Carl O., Ryan C. Stoner, Karen B. Eden, Craig D. Newgard, and Jeanne-Marie Guise. 2017. The Association Between Hospital Capacity Strain and Inpatient Outcomes in Highly Developed Countries: A Systematic Review. Journal of General Internal Medicine 32: 686–96. [Google Scholar] [CrossRef] [PubMed] [Green Version]
  21. Fayissa, Bichaka, Saleh Alsaif, Fady Mansour, Tesa E. Leonce, and Franklin G. Mixon. 2020. Certificate-Of-Need Regulation and Healthcare Service Quality: Evidence from the Nursing Home Industry. Healthcare (Basel, Switzerland) 8: 423. [Google Scholar] [CrossRef] [PubMed]
  22. Federal Trade Commission and U.S. Department of Justice. 2016. Joint Statement of the Federal Trade Commission and the Antitrust Division of the U.S. Department of Justice on Certificate-of-Need Laws and South Carolina House Bill 3250. Available online: https://www.ftc.gov/policy/policy-actions/advocacy-filings/2016/01/joint-statement-federal-trade-commission-antitrust (accessed on 8 October 2021).
  23. Ford, Jon M., and David L. Kaserman. 1993. Certificate-of-Need Regulation and Entry: Evidence from the Dialysis Industry. Southern Economic Journal 59: 783–91. [Google Scholar] [CrossRef]
  24. Ghosh, Sriparna, Agnitra Roy Choudhury, and Alicia Plemmons. 2020. Certificate-of-Need Laws and Healthcare Utilization During COVID-19 Pandemic. SSRN Scholarly Paper ID 3663547. Rochester: Social Science Research Network. [Google Scholar] [CrossRef]
  25. Harrington, Charlene, James H. Swan, John A. Nyman, and Helen Carrillo. 1997. The Effect of Certificate of Need and Moratoria Policy on Change in Nursing Home Beds in the United States. Medical Care 35: 574–88. [Google Scholar] [CrossRef] [PubMed]
  26. Hellinger, Fred J. 1976. The Effect of Certificate-of-Need Legislation on Hospital Investment. Inquiry 13: 187–93. [Google Scholar] [PubMed]
  27. Hellinger, Fred J. 2009. The Effect of Certificate-of-Need Laws on Hospital Beds and Healthcare Expenditures: An Empirical Analysis. The American Journal of Managed Care 15: 737–44. [Google Scholar]
  28. Ho, Vivian, Joseph S. Ross, Brahmajee K. Nallamothu, and Harlan M. Krumholz. 2007. Cardiac Certificate of Need Regulations and the Availability and Use of Revascularization Services. American Heart Journal 154: 767–75. [Google Scholar] [CrossRef] [Green Version]
  29. Ho, Vivian, Meei-Hsiang Ku-Goto, and James G Jollis. 2009. Certificate of Need (CON) for Cardiac Care: Controversy over the Contributions of CON. Health Services Research 44: 483–500. [Google Scholar] [CrossRef]
  30. Hoover, Kent. 2012. Doctors Challenge Virginia’s Certificate-of-Need Requirement. The Business Journals. June 5. Available online: http://www.bizjournals.com/bizjournals/washingtonbureau/2012/06/05/doctors-challenge-virginias.html (accessed on 8 October 2021).
  31. Joskow, Paul L. 1980. The Effects of Competition and Regulation on Hospital Bed Supply and the Reservation Quality of the Hospital. The Bell Journal of Economics 11: 421–47. [Google Scholar] [CrossRef]
  32. Kessler, Carson. 2020. Emergency Mission: Hasidic Women Battle Male EMS for an Ambulance of Their Own. THE CITY. August 6. Available online: https://www.thecity.nyc/health/2020/8/6/21358050/hasidic-women-ambulance-brooklyn-ems-hatzalah-pandemic (accessed on 8 October 2021).
  33. Knight, Frank H. 1921. Risk Uncertainty and Profit. Boston: Hart, Schaffner & Marx. [Google Scholar]
  34. Kolstad, Jonathan T. 2009. Essays on Information, Competition and Quality in Health Care Provider Markets. Ph.D. dissertation, Harvard University, Boston, MA, USA. Available online: https://healthpolicy.fas.harvard.edu/people/jonathan-kolstad (accessed on 8 October 2021).
  35. Lee, Bill. 2020. Tennessee Exec. Order No. 15, 10. Available online: https://publications.tnsosfiles.com/pub/execorders/exec-orders-lee15.pdf (accessed on 8 October 2021).
  36. Lorch, S. A., P. Maheshwari, and O. Even-Shoshan. 2012. The Impact of Certificate of Need Programs on Neonatal Intensive Care Units. Journal of Perinatology: Official Journal of the California Perinatal Association 32: 39–44. [Google Scholar] [CrossRef] [PubMed]
  37. Mitchell, Matthew D., Anne Philpot, and Jessica McBirney. 2021. CON Laws in 2020: About the Update. Arlington: Mercatus Center at George Mason University, Available online: https://www.mercatus.org/publications/healthcare/con-laws-2020-about-update (accessed on 8 October 2021).
  38. Mitchell, Matthew, Thomas Stratmann, and James Bailey. 2020. Raising the Bar: ICU Beds and Certificates of Need. Arlington: Mercatus Center at George Mason University, Available online: https://www.mercatus.org/publications/covid-19-crisis-response/raising-bar-icu-beds-and-certificates-need (accessed on 8 October 2021).
  39. Mitchell, Matthew. 2016. Do Certificate-of-Need Laws Limit Spending? Mercatus Working Paper. Arlington: Mercatus Center at George Mason University, Available online: https://www.mercatus.org/system/files/mercatus-mitchell-con-healthcare-spending-v3.pdf (accessed on 8 October 2021).
  40. Myers, Molly S., and Kathleen M. Sheehan. 2020. The Impact of Certificate of Need Laws on Emergency Department Wait Times. Journal of Private Enterprise 35: 59–75. [Google Scholar]
  41. National Diabetes Statistics Report. 2020. Centers for Disease Control and Prevention. February 11. Available online: https://www.cdc.gov/diabetes/library/features/diabetes-stat-report.html (accessed on 8 October 2021).
  42. National Health Planning and Resources Development Act of 1974. 1975. U.S.C. Vol. 88. Available online: https://www.gpo.gov/fdsys/pkg/STATUTE-88/pdf/STATUTE-88-Pg2225.pdf (accessed on 8 October 2021).
  43. Noether, Monica. 1988. Competition Among Hospitals. Journal of Health Economics 7: 259–84. [Google Scholar] [CrossRef]
  44. Northam, Ralph. 2020. Virginia Exc. Order No. 52 Amended, 1. Available online: https://www.governor.virginia.gov/media/governorvirginiagov/executive-actions/EO-52-AMENDED---Extension-of-Increases-in-Hospital-Bed-Capacity-in-Response-to-Novel-Coronavirus-(COVID-19).pdf (accessed on 8 October 2021).
  45. Ohsfeldt, Robert L., and Pengxiang Li. 2018. State Entry Regulation and Home Health Agency Quality Ratings. Journal of Regulatory Economics 53: 1–19. [Google Scholar] [CrossRef] [Green Version]
  46. Popescu, Iona, Mary S. Vaughan-Sarrazin, and Gary E. Rosenthal. 2006. Certificate of Need Regulations and Use of Coronary Revascularization After Acute Myocardial Infarction. The Journal of the American Medical Association 295: 2141–47. [Google Scholar] [CrossRef] [PubMed] [Green Version]
  47. Pub. L. 99-660, § 701, 100 Stat. 3799. 1986.
  48. Robinson, Jamie L., David B. Nash, Elizabeth Moxey, and John P. O’Connor. 2001. Certificate of Need and the Quality of Cardiac Surgery. American Journal of Medical Quality: The Official Journal of the American College of Medical Quality 16: 155–60. [Google Scholar] [CrossRef]
  49. Salkever, David S., and Thomas W. Bice. 1976. The Impact of Certificate-of Need Controls on Hospital Investment. The Milbank Memorial Fund Quarterly. Health and Society 54: 185–214. [Google Scholar] [CrossRef]
  50. Sánchez-Úbeda, Eugenio F., Pedro Sánchez-Martín, Macarena Torrego-Ellacuría, Ángel Del Rey-Mejías, Manuel F. Morales-Contreras, and José-Luis Puerta. 2021. Flexibility and Bed Margins of the Community of Madrid’s Hospitals during the First Wave of the SARS-CoV-2 Pandemic. International Journal of Environmental Research and Public Health 18: 3510. [Google Scholar] [CrossRef]
  51. Short, Marah N., Thomas A. Aloia, and Vivian Ho. 2008. Certificate of Need Regulations and the Availability and Use of Cancer Resections. Annals of Surgical Oncology 15: 1837–45. [Google Scholar] [CrossRef]
  52. Sloan, Frank A. 1981. Regulation and the Rising Cost of Hospital Care. The Review of Economics and Statistics 63: 479–87. [Google Scholar] [CrossRef]
  53. Sloan, Frank A., and Bruce Steinwald. 1980. Effects of Regulation on Hospital Costs and Input Use. The Journal of Law & Economics 23: 81–109. [Google Scholar]
  54. Spektor, Brandon. 2020. Coronavirus: What Is ‘flattening the Curve,’ and Will It Work? Live Science. March 16. Available online: https://www.livescience.com/coronavirus-flatten-the-curve.html (accessed on 8 October 2021).
  55. Stone, Will. 2021. A COVID Surge Is Overwhelming U.S. Hospitals, Raising Fears Of Rationed Care. NPR, September 5. sec. The Coronavirus Crisis. Available online: https://www.npr.org/sections/health-shots/2021/09/05/1034210487/covid-surge-overwhelming-hospitals-raising-fears-rationed-care (accessed on 8 October 2021).
  56. Stratmann, Thomas, and Christopher Koopman. 2016. Entry Regulation and Rural Health Care: Certificate-of-Need Laws, Ambulatory Surgical Centers, and Community. Working Paper. Arlington: Mercatus Center at George Mason University, Available online: http://mercatus.org/sites/default/files/Stratmann-Rural-Health-Care-v1.pdf (accessed on 8 October 2021).
  57. Stratmann, Thomas, and David Wille. 2016. Certificate of Need Laws and Hospital Quality. Mercatus Working Paper. Arlington: Mercatus Center at George Mason University, Available online: https://www.mercatus.org/system/files/mercatus-stratmann-wille-con-hospital-quality-v1.pdf (accessed on 8 October 2021).
  58. Stratmann, Thomas, and Jacob Russ. 2014. Do Certificate-of-Need Laws Increase Indigent Care? Working Paper 14–20. Arlington: Mercatus Center at George Mason University. Available online: http://mercatus.org/sites/default/files/Stratmann-Certificate-of-Need.pdf (accessed on 8 October 2021).
  59. Stratmann, Thomas, and Matthew Baker. 2020. Examining Certificate-of-Need Laws in the Context of the Rural Health Crisis. Mercatus Working Paper. Arlington: Mercatus Center at George Mason University, Available online: https://www.mercatus.org/publications/healthcare/examining-certificate-need-laws-context-rural-health-crisis (accessed on 8 October 2021).
  60. Stratmann, Thomas, and Steven Monaghan. 2017. The Effect of Interest Group Pressure on Favorable Regulatory Decisions: The Case of Certificate-of-Need Laws. Mercatus Working Paper. Arlington: Mercatus Center at George Mason University, Available online: https://www.mercatus.org/publications/interest-group-pressure-favorable-regulatory-decisions-certificate-of-need (accessed on 8 October 2021).
  61. United States COVID-19 Cases and Deaths by State over Time. n.d. HealthData.Gov. Available online: https://healthdata.gov/dataset/United-States-COVID-19-Cases-and-Deaths-by-State-o/hiyb-zgc2 (accessed on 1 October 2021).
  62. US Department of Commerce, B. E. A. n.d. Bureau of Economic Analysis. National Income and Product Accounts Tables. Available online: http://www.bea.gov/iTable/iTable.cfm?ReqID=9&step=1#reqid=9&step=1&isuri=1 (accessed on 6 December 2013).
  63. Vaughan Sarrazin, Mary S., Levent Bayman, and Peter Cram. 2010. Trends during 1993–2004 in the Availability and Use of Revascularization after Acute Myocardial Infarction in Markets Affected by Certificate of Need Regulations. Medical Care Research and Review: MCRR 67: 213–31. [Google Scholar] [CrossRef] [PubMed]
  64. Vaughan-Sarrazin, Mary S., Edward L. Hannan, Carol J. Gormley, and Gary E. Rosenthal. 2002. Mortality in Medicare Beneficiaries Following Coronary Artery Bypass Graft Surgery in States with and without Certificate of Need Regulation. JAMA 288: 1859–66. [Google Scholar] [CrossRef] [PubMed] [Green Version]
Figure 1. National Share of Beds in Use. Source: (COVID-19 Reported Patient Impact and Hospital Capacity by State Timeseries 2021).
Jrfm 15 00010 g001
Figure 2. Number of Days per Month in Which More than 70 Percent of a State’s Beds Are in Use, Averaged over 50 States. Source: (COVID-19 Reported Patient Impact and Hospital Capacity by State Timeseries 2021).
Jrfm 15 00010 g002
Figure 3. Statewide Bed Utilization, September 2021. Source: (COVID-19 Reported Patient Impact and Hospital Capacity by State Timeseries 2021).
Jrfm 15 00010 g003
Figure 4. Frequency of Hospital Bed Usage Rates. Source: (COVID-19 Reported Patient Impact and Hospital Capacity by State Timeseries 2021).
Jrfm 15 00010 g004
Figure 5. Frequency of Days per Month in Excess of 70 Percent Capacity. Source: (COVID-19 Reported Patient Impact and Hospital Capacity by State Timeseries 2021).
Jrfm 15 00010 g005
Figure 6. Bed CON Regulations during the Pandemic. Source: State CON regulators.
Jrfm 15 00010 g006
Figure 7. Frequency of Hospital Bed Usage Rates, by CON Requirement. Source: Authors’ calculations, COVID-19 Reported Patient Impact and Hospital Capacity by State Timeseries (2021).
Jrfm 15 00010 g007
Figure 8. Frequency of Days per Month in Excess of 70 Percent Capacity, by CON Requirement. Source: Authors’ calculations, COVID-19 Reported Patient Impact and Hospital Capacity by State Timeseries (2021).
Jrfm 15 00010 g008
Table 1. Descriptive Statistics, Observations by State and Month.
ObsMeanStd. Dev.MinMax
Outcome Variables
  Average Share of Beds Used per Month per State96866.5611.1717.50106.13
  Number of Days per Month in Which More than 70 Percent of Beds in Use96812.8212.610.0031.00
Explanatory Variables of Interest
  Bed CON9680.520.500.001.00
  Bed CON Relaxed9680.320.460.001.00
Control Variables
Percent Black96810.659.430.5038.00
Percent Hispanic96812.1310.441.4049.10
Real per Capita Personal Income, $201796848,624.154814.19240,11863,366
Percent of Adults with Diabetes9689.411.616.2013.20
New Cases per Population9680.680.710.004.55
Table 2. Descriptive Statistics, Observations by State and Month, Bed CON and Non-Bed CON States.
States That Do Not Require a CON for Hospital Beds
VariableObsMeanStd. Dev.MinMax
Outcome Variables
  Average Share of Beds Used per Month per State46663.2711.7217.5092.58
  Number of Days per Month in Which More than 70 Percent of Beds in Use4669.6411.600.0031.00
Control Variables
  Percent Black4667.376.860.5032.40
  Percent Hispanic46615.3813.183.6049.10
  Real per Capita Personal Income, 201746648,470.554290.45640,11856,114
  Percent of Adults with Diabetes4669.031.536.2012.10
  New Cases per Population4660.730.770.004.55
States That Require a CON for Hospital Beds
ObsMeanStd. Dev.MinMax
Outcome Variables
  Average Share of Beds Used per Month per State50269.619.7030.56106.13
  Number of Days per Month in Which More than 70 Percent of Beds in Use50215.7812.790.0031.00
Control Variables
  Percent Black50213.7010.421.2038.00
  Percent Hispanic5029.115.501.4020.60
  Real per Capita Personal Income, 201750248,766.755254.15740,19563,366
  Percent of Adults with Diabetes5029.761.607.3013.20
  New Cases per Population5020.630.660.003.42
Table 3. Descriptive Statistics, Observations by Hospital and Week.
ObsMeanStd. Dev.MinMax
Outcome Variables
  100 Percent or More of Facility’s Beds In Use259,1490.010.0901
Explanatory Variables of Interest
  Bed CON259,1490.430.5001
  Bed CON Relaxed259,1490.290.4501
Control Variables
  Percent Black259,14912.448.660.5038.00
Percent Hispanic259,14915.5412.881.4049.10
Real per Capita Personal Income, $2017259,14948,535.133937.4040,118.0063,366.00
Percent of Adults with Diabetes259,1499.811.416.213.2
New Cases per Population259,1490.010.010.000.05
Rural Indicator259,1490.180.3801
Critical Access Hospital Indicator259,1490.220.4201
Long-Term Care Facility Indicator259,1490.080.2701
Table 4. Descriptive Statistics, Observations by Hospital and Week, Bed CON and Non-Bed CON States.
States That Do Not Require a CON for Hospital Beds
ObsMeanStd. Dev.MinMax
Outcome Variables
  100 Percent or More of Facility’s Beds In Use147,2640.010.0801
Control Variables
  Percent Black147,2649.896.780.5032.40
  Percent Hispanic147,26420.0514.843.6049.10
  Real per Capita Personal Income, $2017147,26448,355.093148.4040,118.0056,114.00
Percent of Adults with Diabetes147,2649.601.326.2012.10
New Cases per Population147,2640.010.010.000.05
Rural Indicator147,2640.170.3701
Critical Access Hospital Indicator147,2640.230.4201
Long-Term Care Facility Indicator147,2640.090.2801
States That Require a CON for Hospital Beds
ObsMeanStd. Dev.MinMax
Outcome Variables
100 Percent or More of Facility’s Beds In Use111,8850.010.1101
Control Variables
Percent Black111,88515.809.671.2038.00
Percent Hispanic111,8859.615.721.4020.60
Real per Capita Personal Income, $2017111,88548,772.094771.0540,195.0063,366.00
Percent of Adults with Diabetes111,88510.091.497.313.2
New Cases per Population111,8850.010.010.000.03
Rural Indicator111,8850.190.3901
Critical Access Hospital Indicator111,8850.210.4101
Long-Term Care Facility Indicator111,8850.060.2401
Table 5. Modeling Average Share of Beds Used per Month per State.
(1)(2)(3)(4)
VariablesFull ModelLimited ModelMore Limited ModelUnivariate Model
Bed CON7.571 ***7.694 ***7.674 ***6.344 ***
(2.659)(2.663)(2.620)(1.883)
Bed CON Relaxed−2.168−1.962−1.096
(2.344)(2.366)(2.207)
Percent Black0.203 *0.246 **0.224 **
(0.109)(0.104)(0.102)
Percent Hispanic0.261 ***0.261 ***0.263 ***
(0.0619)(0.0643)(0.0639)
New Cases per Population1.523 *1.574 *4.569 ***
(0.867)(0.848)(0.457)
Real per Capita Personal Income, $20170.000232
(0.000211)
Percent of Adults with Diabetes0.623
(0.560)
Constant27.73 *44.33 ***54.26 ***63.27 ***
(14.25)(8.062)(2.155)(1.401)
Month EffectsYesYesNoNo
Observations968968968968
R-Squared0.500.500.250.08
Notes: The dependent variable is the average percent of beds used per month per state. Regressions were estimated with OLS. Values in parentheses are the standard errors which are clustered at the state level. *** p < 0.01, ** p < 0.05, * p < 0.1.
Table 6. Modeling the Number of Days in Which More than 70 Percent of Beds Used per Month per State.
(1)(2)(3)(4)
VariablesFull ModelLimited ModelMore Limited ModelUnivariate Model
Bed CON5.675 *5.968 *6.818 **6.146 **
(3.121)(3.199)(3.040)(2.379)
Bed CON Relaxed0.5630.9010.224
(3.204)(3.377)(3.110)
Percent Black0.1860.282 *0.263
(0.180)(0.157)(0.157)
Percent Hispanic0.324 ***0.325 ***0.329 ***
(0.0849)(0.0920)(0.0900)
New Cases per Population1.4081.5334.368 ***
(1.188)(1.229)(0.663)
Real per Capita Personal Income, $20170.000445 **
(0.000218)
Percent of Adults with Diabetes1.322
(0.883)
Constant−37.76 **−4.735−0.5329.637 ***
(16.16)(3.058)(2.264)(1.601)
Month EffectsYesYesNoNo
Observations968968968968
R-Squared0.390.370.220.06
Notes: The dependent variable is the average percent of beds used per month per state. Regressions were estimated with OLS. Values in parentheses are the standard errors which are clustered at the state level. *** p < 0.01, ** p < 0.05, * p < 0.1.
Table 7. Modeling the Likelihood That a Hospital Will Use 100 Percent of Its Beds.
(1)(2)(3)(4)
VariablesFull ModelLimited ModelMore Limited ModelUnivariate Model
Bed CON0.268 **0.250 **0.264 **0.244 **
(0.125)(0.120)(0.112)(0.101)
Bed CON Relaxed0.0910.058−0.001
(0.125)(0.122)(0.125)
Percent Black−0.0020.0010.003
(0.00753)(0.00572)(0.00580)
Percent Hispanic0.0020.0020.002
(0.00488)(0.00532)(0.00532)
New Cases per Population14.43 **19.11 ***10.66 **
(6.570)(5.882)(4.140)
Real per Capita Personal Income, $2017−3.12 × 10⁻⁵ **
(1.30 × 10⁻⁵)
Percent of Adults with Diabetes−0.00730
(0.0569)
Rural Indicator−0.0936−0.0717−0.0602
(0.110)(0.102)(0.0983)
Critical Access Hospital Indicator−0.138−0.124−0.124
(0.104)(0.0973)(0.0951)
Long-Term Care Facility Indicator0.009030.02250.0250
(0.0857)(0.0819)(0.0806)
Month EffectsYesYesNoNo
Observations259,149259,149259,149259,149
Notes: The dependent variable is equal to 1 if the hospital used all of its beds in the previous week and 0 otherwise. Regressions were estimated with probit. Values in parentheses are the standard errors which are clustered at the state level. *** p < 0.01, ** p < 0.05.
Publisher’s Note: MDPI stays neutral with regard to jurisdictional claims in published maps and institutional affiliations.

