Article

The Impact of Organizational Culture on the Effectiveness of Corporate Governance to Control Earnings Management

by
José Ignacio Jarne-Jarne
,
Susana Callao-Gastón
,
Miguel Marco-Fondevila
* and
Fernando Llena-Macarulla
Department of Accounting and Finance, University of Zaragoza, 50009 Zaragoza, Spain
*
Author to whom correspondence should be addressed.
J. Risk Financial Manag. 2022, 15(9), 379; https://0-doi-org.brum.beds.ac.uk/10.3390/jrfm15090379
Submission received: 7 July 2022 / Revised: 20 August 2022 / Accepted: 22 August 2022 / Published: 25 August 2022
(This article belongs to the Special Issue Green Marketing, Green Finance and Sustainable Development)

Abstract

:
The relationship between culture, earnings management and corporate governance has been studied in different ways, but the influence that culture has over the actual effectiveness of corporate governance to control earnings management has not, even though it should be a determinant factor to define successful governance schemes. Using Hofstede four organizational models as a framework, in this paper, we analyze a sample of companies listed in 16 different stock markets in terms of organizational culture, assessing their governance standards and performance in relation to earnings management, and measuring their actual effectiveness. The results confirm that earnings management is conditioned by organizational culture and that corporate governance acts as a brake on earnings management, regardless of the cultural field in which it is analyzed. However, its effectiveness depends on organizational culture, mostly on the uncertainty avoidance and the power distance. Therefore, modelling a country based on its organizational culture does limit the success of corporate governance policies and standards. This study brings in a new perspective for policy makers and practitioners to design and enforce their corporate governance policies targeting earnings management, according to the prevailing culture. The previous literature on the subject is complemented and enriched by this significant contribution, through which limitations in terms of the number of countries studied could be overcome by further studies addressing specific regions or sectors.

1. Introduction

Previous literature has paid attention to the influence of culture on earnings management (EM) and has found a significant relationship between different culture dimensions and earnings management (among others, Guan et al. 2005; Han et al. 2010; Desender et al. 2011; Doupnik 2008; Kanagaretnam et al. 2011; Zhang et al. 2013 or Riahinejad and Tavangar 2022). In addition, the perception and acceptability of earnings management are different across the geographical and cultural areas (Elias 2004; Geiger et al. 2006; Geiger and van der Laan Smith 2010; Cameran et al. 2022).
Given that earnings management diminishes the financial reporting quality and its usefulness for decision making, many studies have focused on the mechanisms for controlling earnings management, such as corporate governance (Shen and Chih 2007; Shan 2015; Katmon and Al Farooque 2017). The relationship between the corporate governance structure and earnings management has been evidenced (Klein 2002; Jaggi and Tsui 2007; Cornett et al. 2009; Bonetti et al. 2016), although the same structure is not always equally effective as a brake on manipulation (García Osma and Gill de Albornoz Nouger 2005). In addition, previous literature has evidenced the influence of the national culture on corporate governance (Licht et al. 2005; Li and Harrison 2008; Breuer and Salzmann 2012).
In the framework of literature about the effect of culture in earnings management, about corporate governance as mechanism to constrain earnings management and about the relationship between culture and the structure of corporate governance, some papers analyze how culture may influence the design of corporate governance. However, the actual impact of culture on corporate governance effectiveness to hinder earnings management in a company has not been studied, even though it is a crucial factor to design a sound corporate governance policy. Studies such as Hassan and Karim (2022) emphasize the importance of corporate culture as an essential determining factor of organizational behavior. While culture has an influence in corporate governance structure and design, we think it may also hinder its effectiveness to control earnings management, since it determines the decision-making process in the company, the functions of corporate governance and the perception of the earnings management practices. Therefore, we focus on the organizational culture, defined as “the collective programming of the mind that distinguishes the members of one organization from others” (Hofstede et al. 2010, p. 344).
The main objective of this paper is to assess whether the effectiveness of corporate governance to control the earnings management is affected or not by the organizational culture. To that end, we perform a regression where the quality of corporate governance is measured by the Corporate Governance Score, the third pillar in the calculation of ESG Scores designed by Thomson and Reuters, to measure the company performance, commitment and effectiveness in relation to the environmental, social and corporate governance areas; earnings management is measured by discretionary accruals estimated applying the model proposed by Larcker and Richardson (2004); and the proxies to organisational culture are power distance and uncertainty avoidance from Hofstede et al. (2010). We base our study on a sample of companies from 16 countries with different organisational culture models (“pyramid”, “family”, “market” and “machine” models), as proposed by Hofstede et al. (2010).
The results obtained evidence that, although corporate governance acts as a brake on earnings management regardless of the culture, its effectiveness as a limit to earnings management depends on organisational culture. In countries with strong uncertainty avoidance and short power distance (“machine” model), corporate governance is more effective in constraining earnings management, while in countries with weak uncertainty avoidance and large power distance (“family” model), corporate governance is less effective.
These results contribute to the understanding of the actual relationship between culture, corporate governance and earnings management, making it clear that standard models of corporate governance cannot be transferred from one country to another in order to ensure that their effectiveness in controlling manipulation is the same in all countries. It should not be forgotten that each country’s culture influences the practices of earnings management and the organizational model of the companies, thus influencing the effectiveness of the corporate governance in constraining earnings management.

2. Literature Review

The phenomenon of earnings management has drawn the attention of academic researchers and regulators. As Cornett et al. (2009) point out, “accountants and financial economists have recognized for years that firms use latitude in accounting rules to manage their reported earnings in a wide variety of contexts”. Indeed, the incentives for earnings management are often present in managers’ activities (Dechow and Sloan (1991); Holthausen et al. (1995)).
However, Doupnik (2008) points out that there are systematic differences in earnings management across countries because some conditions and characteristics of the environment may influence the reported earnings (see also Burgstahler and Dichev 1997; Teoh et al. 1998; Kasznik 1999; Healy and Wahlen 1999; Ball and Shivakumar 2005; Kneiding and Kritikos 2007 or Chen et al. 2018, among others). Li et al. (2020) show that corporate culture correlates with earnings management, as well as with other business outcomes (operational efficiency, risk-taking, executive compensation design or firm value). Some previous studies have also found a significant relationship between different culture dimensions and earnings management (among others, Guan et al. 2005; Han et al. 2010; Desender et al. 2011; Doupnik 2008; Kanagaretnam et al. 2011; Zhang et al. 2013 or Riahinejad and Tavangar 2022). Other investigations have analyzed how the perception and acceptability of earnings management vary depending on the geographical and cultural areas (Elias 2004; Geiger et al. 2006; Geiger and van der Laan Smith 2010; Cameran et al. 2022).
The earnings management practices impair the quality of the financial reporting, so limiting them through the appropriate control mechanisms will benefit the information (Monterrey Majoral 2004). Among the mechanisms that may constrain earnings management, the internal control by good corporate governance has been analyzed in numerous previous studies (Shen and Chih 2007; Shan 2015; Katmon and Al Farooque 2017; Nia et al. 2022).
Some investigations have related the effectiveness of corporate governance to limit earnings management practices with corporate governance structure, especially with the proportion of independent directors, and many of these studies have evidenced a negative relationship between this proportion and earnings management (Klein 2002; Jaggi and Tsui 2007; Cornett et al. 2009). However, other studies have not obtained the same evidence. For example, Kjærland et al. (2020) find a significantly positive relation between the proportion of independent board members and earnings management. García Osma and Gill de Albornoz Nouger (2005) did not find a significant relationship between the independent directors and earnings management. The differences in the results obtained can be explained by the differences in the corporate ownership structure, which is reflected in the composition of board of directors and in their goals. In addition, studies such as Choi et al. (2020) and Khuong et al. (2022) show that there is a relationship between corporate ownership and earnings management.
Some studies, such as Shleifer and Vishny (1997) or La Porta et al. (1999), have found that national culture is associated with the corporate ownership structure, more concentrated in Europe continental countries and Japan and more dispersed in, for instance, the UK and USA. In addition, previous literature has evidenced the influence of the national culture on corporate governance (Licht et al. 2005; Li and Harrison 2008; Breuer and Salzmann 2012; Duong et al. 2016).
Although there is abundant literature about the effect of culture in earnings management, corporate governance as mechanism to constrain earnings management and the relationship between culture and the structure of corporate governance, we have not found studies addressing the impact that culture (more specifically, organizational culture) may have on the ability of corporate governance to control earnings management. Even though the influence of culture in corporate governance may exist, derived of different ownership structures, different business model traditions, different legislation, etc., whether that influence has an indirect effect on controlling earnings management has not been studied.
In this paper, we try to fill the observed gap and, based on Hofstede’s organizational culture categories, we study the influence of organizational culture over the corporate governance effectiveness in controlling earnings management. Since organizational culture determines the decision-making process in the company, the functions of corporate governance and the perception of the earnings management practices as something more or less acceptable or completely unacceptable, it is to be expected that the effectiveness of corporate governance in controlling earnings management is affected by the organizational culture.
Hofstede (1980) named four national culture dimensions: power distance (from small to large), collectivism versus individualism, femininity versus masculinity, and uncertainty avoidance (from weak to strong). Following Hofstede et al. (2010), from the four dimensions of national culture mentioned, power distance and uncertainty avoidance, in particular, affect organizational culture. The remaining two dimensions, collectivism versus individualism and femininity versus masculinity, affect people in organizations, rather than organizations themselves.
Power distance (PDI) is defined as the extent to which the less powerful members of institutions (the family, the school, the community) and organizations (the places where people work) within a country expect and accept that power is distributed unequally.
According to the model, in small power distance countries, there is limited dependence of subordinates on bosses, and there is a preference for consultation (that is, interdependence between boss and subordinate). The emotional distance between them is relatively small: subordinates will rather easily approach and contradict their bosses. In large power distance countries, there is considerable dependence of subordinates on bosses. In these cases, the emotional distance between subordinates and their bosses is large: subordinates are unlikely to approach and contradict their bosses directly.
Uncertainty avoidance (UAI) is defined as the extent to which the members of a culture feel threatened by ambiguous or unknown situations. In strong uncertainty avoidance countries, there is more conservatism, even within parties that call themselves progressive, and a stronger need for law and order. In weak uncertainty avoidance countries, society tends to be more liberally minded.
According to the position of a country in relation to power distance and uncertainty avoidance dimensions, Hofstede et al. (2010) distinguish between four organizational models: “market”, “machine”, “pyramid” and “family” models. In “market” models, the power distance is small and the uncertainty avoidance is weak. In this kind of organizational model, when there is a problem to solve, neither the hierarchy nor rules, but rather the demands of the situation, determine what will happen. The United Kingdom is an example of this organizational model. In “machine” organizational models, the power distance is small and the uncertainty avoidance is strong. In “machine” companies, the rules should solve all daily problems and decisions; the management interventions are limited to exceptional cases. An example of this model is Germany. “Pyramid” models are specific to countries where the power distance is large and the uncertainty avoidance is strong. In this organizational model, the manager is at the top of the pyramid and each successive level at its proper place below. France or Spain are examples of pyramid models.
Finally, in “family” models (large power distance and weak uncertainty avoidance), there is a high concentration of authority without structuring of activities; there is a direct supervision by the boss. China or Hong Kong are countries with this culture organizational model.
As we explain in Section 3, our study is based on a sample of companies from 16 countries, four countries of each organizational culture model.
This research contributes to the existing debate over the effectiveness of corporate governance in controlling earning management from a newest perspective involving the indirect cultural effect. Furthermore, this paper helps understand how corporate governance codes must be designed according to the cultural context in which they will be applied, therefore gaining in efficacy and usefulness.
Considering the four organisational models described above, and in order to analyze and assess this relationship between organizational culture and corporate governance effectiveness in controlling earnings management, we formulate the following hypothesis (in alternative form):
H0. 
Organizational culture has a significant effect on the effectiveness of corporate governance as a brake on earnings management.

3. Sample

To test the hypothesis, a sample composed of companies listed in 16 different stock markets was created. Working with these countries, we are able to compare the impact of four different organizational cultures on the relationship between corporate governance and earnings management practices. Based on the four organizational models proposed by Hofstede et al. (2010) and according to two dimensions of national culture (power distance and uncertainty avoidance), we select four countries for each model: market, family, machine and pyramid.
Figure 1 shows the position of the countries in the study according to the different culture organizational models.

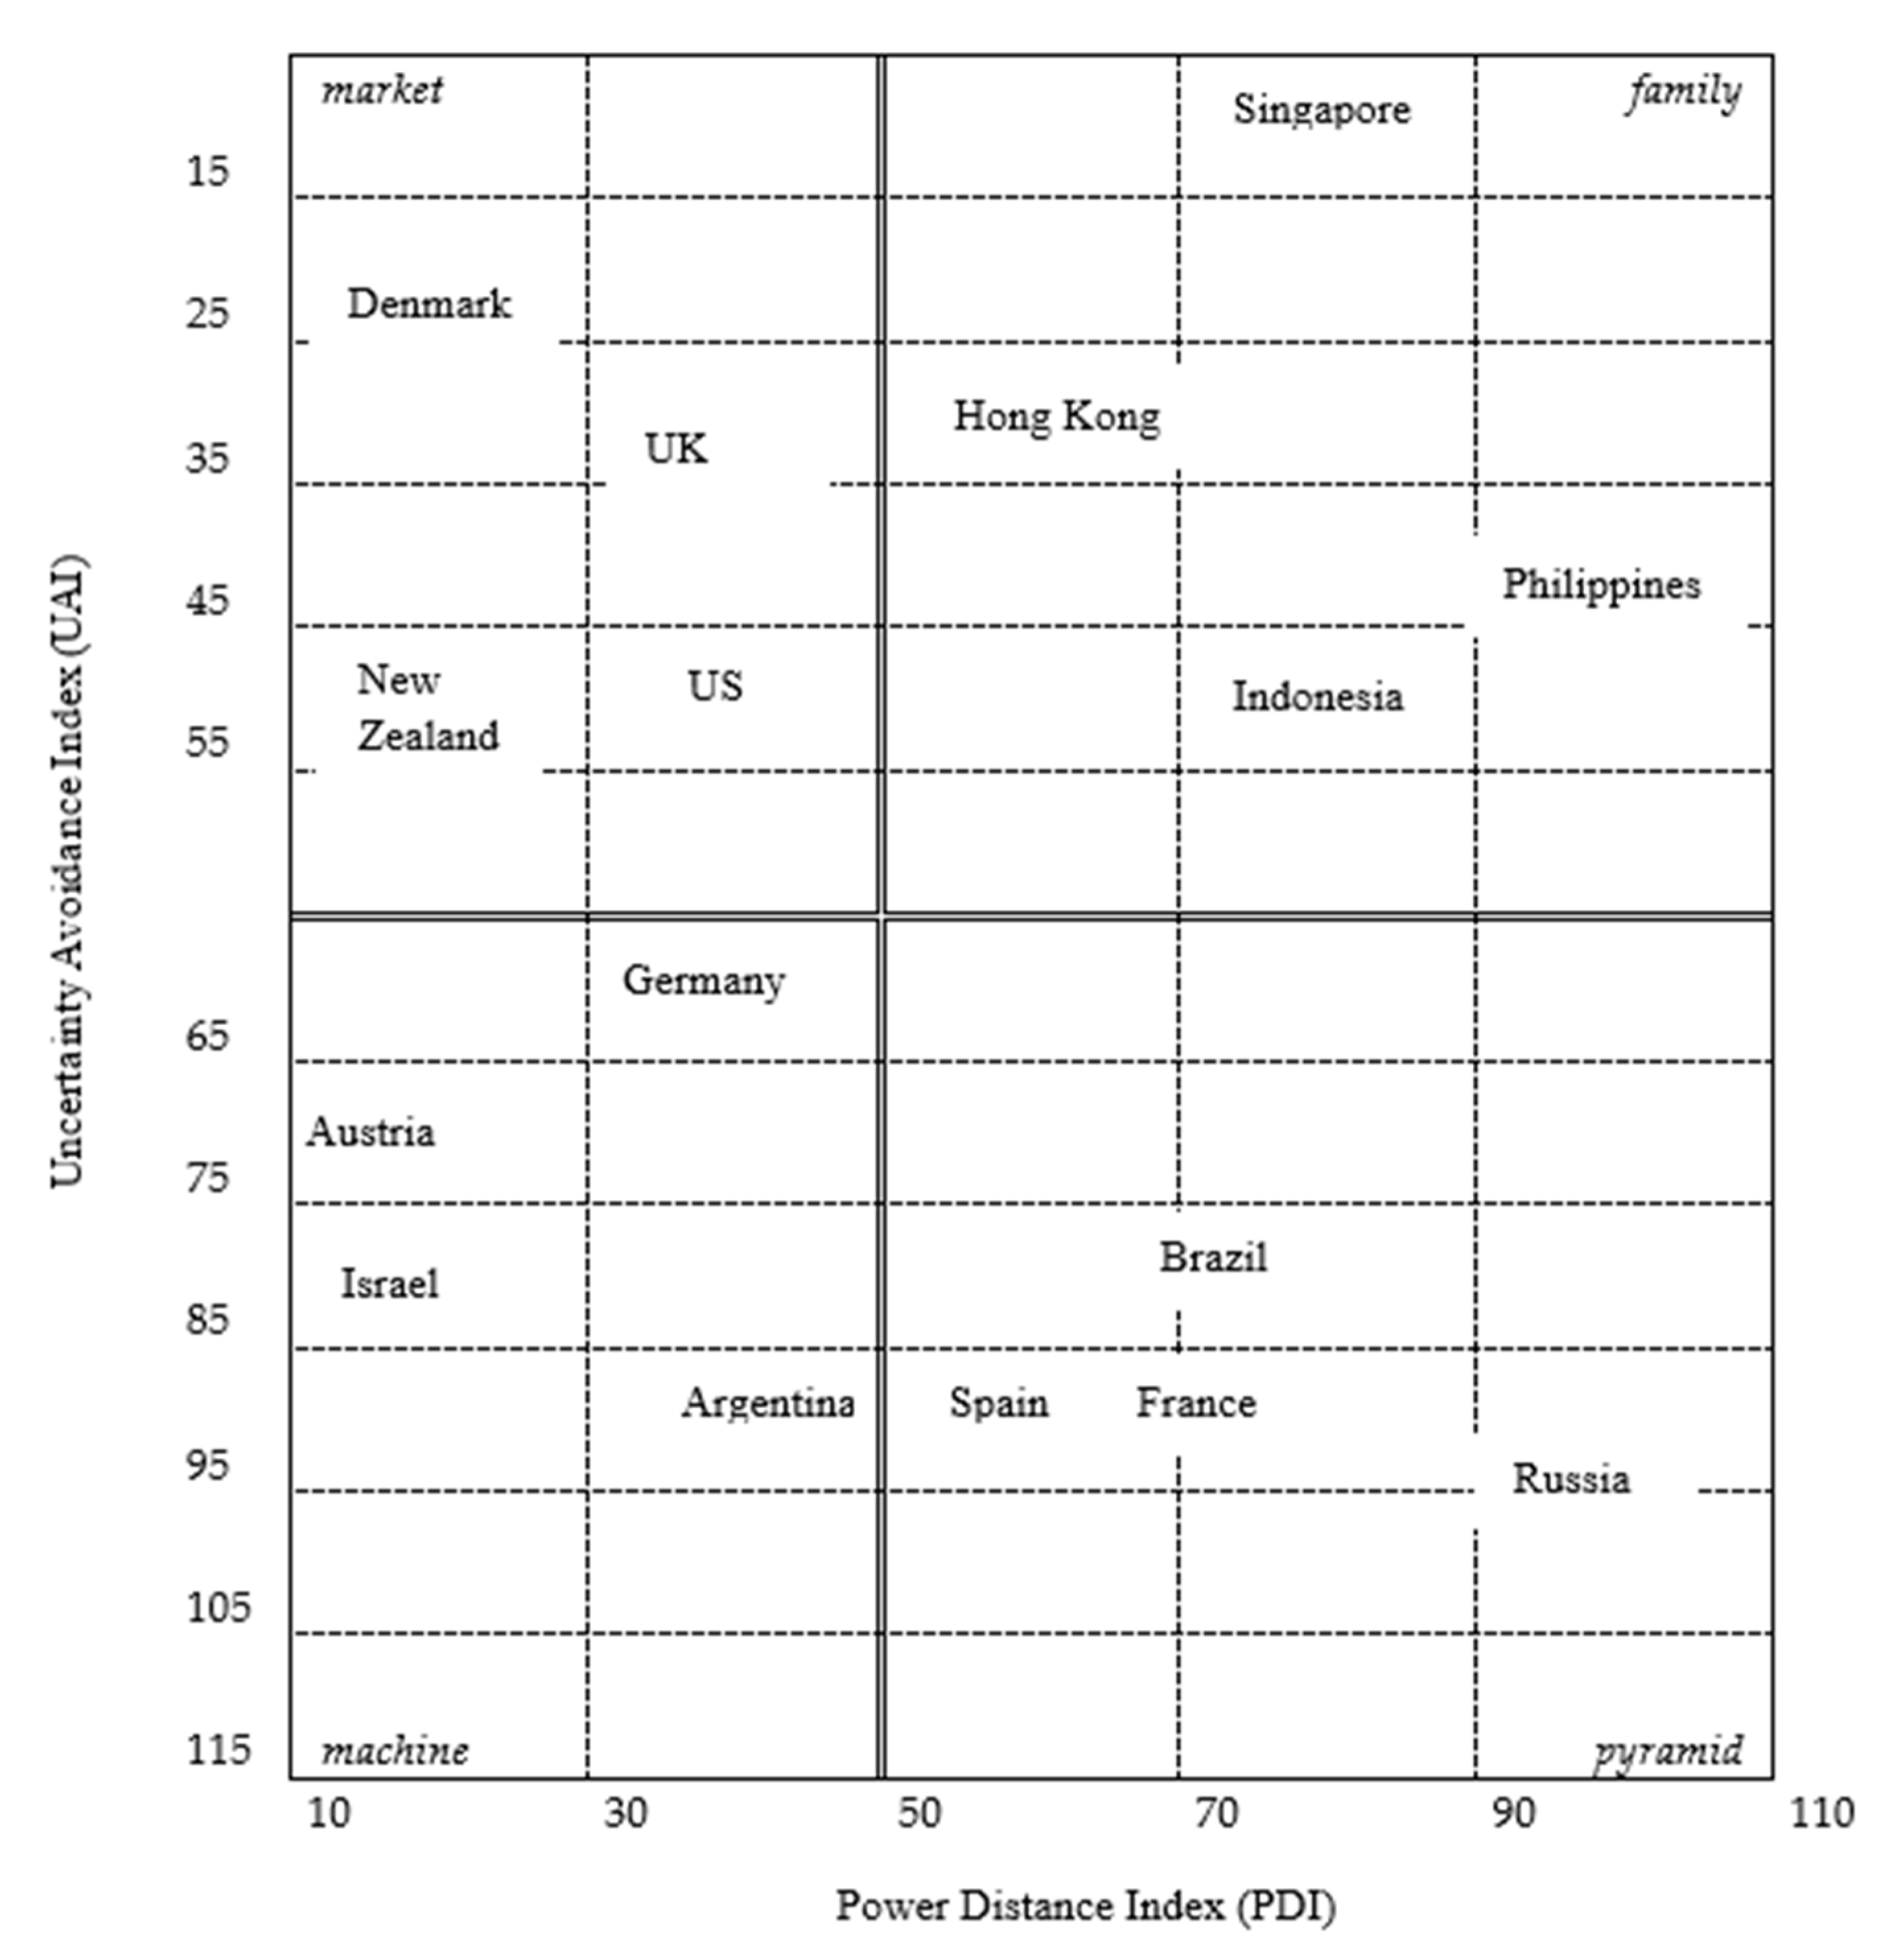
Power Distance Index (PDI)

The criterion to choose the countries within each organizational model has been that, within the range of values of uncertainty avoidance index (UAI) and power distance index (PDI) for the group of countries in each model, there is a country with low uncertainty avoidance index (UAI) and low power distance index (PDI), a country with low UAI and high PDI, a country with high UAI and low PDI and a country with high UAI and high PDI.
As shown in Figure 1, Brazil, France, Russia and Spain were included in the study as representatives of the “pyramid” organizational model, in which the general manager is at the top of the pyramid concentrating the authority and each successive level is at its proper place below. In these countries, power distance is large (PDI above 50) and uncertainty avoidance is strong (UAI above 63)1. As representatives of the “machine” organizational model, we included Argentina, Austria, Germany and Israel, in which the power distance is short (PDI below 50) and the uncertainty avoidance is strong (UAI above 63). In the machine model, management intervention is limited to exceptional cases because the rules should settle all daily problems.
Denmark, New Zealand, the United Kingdom and the United States, with short power distance (PDI below 50) and weak uncertainty avoidance (UAI below 63), represent the “market” organizational model, in which neither hierarchy nor rules, but rather the demands of the situation determine what will happen. Finally, the “family” organizational model is represented by Hong Kong, Indonesia, the Philippines and Singapore. There, with large power distance (PDI above 50), but weak uncertainty avoidance (UAI below 63), the owner–manager is the almighty (grand) father and the conflicts are solved by permanent referral to the boss, with a concentration of authority without the structuring of activities.
Leaving financial companies aside, we identified 8970 companies. After the removal of 808 companies lacking data, the final sample comprised 8162 companies. The period of analysis covers the years from 2009 to 2018, providing us with 81,620 observations. The country distribution of these observations is presented in Table 12.

4. Methods

In order to test whether there are differences in the effectiveness of the control exerted by corporate governance to avoid earnings management that would be linked to the organizational culture, we perform a regression (Equation (1)), where the dependent variable is a proxy of earnings management (absDA) and the explanatory variables are related to the corporate governance quality (logCGVS), to the organizational culture (logUAI and logPDI) and to the interaction between culture and corporate governance (UAIxlogCGVS and PDIxlogCGVS):
absDAit = α0 + α1logCGVSit + α2logUAIj + α3logPDIj + α4dicUAIj xlogCGVSit + α5dicPDIj xlogCGVSit + α6LIQit + α7DEBTit + α8ROIit + α9SIZEit + α10logGDPjt + eit
where:
absDAit is the absolute value of discretionary accruals for company i in period t and it is used as a proxy of earnings management, the dependent variable. The values of DA have been estimated applying the model proposed by Larcker and Richardson (2004), as we explain below.
logCGVSit is the logarithm of the corporate governance score (CGVS) for company i in period t, obtained from Eikon. It is used as a measure of the corporate governance quality.
logUAIj is the logarithm of the uncertainty avoidance index for country j proposed by Hofstede et al. (2010) as one of the two national culture dimensions affecting organizations in particular.
logPDIj is the logarithm of the power distance index for country j proposed by Hofstede et al. (2010) as one of the two national culture dimensions affecting organizations in particular.
dicUAIjxlogCGVSit is the product between dicUAIj (dichotomous variable which takes a value of 0 when the uncertainty avoidance index for the country j is higher than 63 and a value of 1 when it is lower than 63) and logCGVSit.
dicPDIjxlogCGVSit is the product between dicPDIj (dichotomous variable that takes a value of 0 when the power distance index for the country j is lower than 50 and a value of 1 when it is higher than 50) and logCGVSit.
LIQit is the liquidity ratio for company i in period t, which we define as the quotient between the current assets and current liabilities (data from Eikon).
DEBTit is the debt ratio for company i in period t, which we define as the quotient between the liabilities and equity (data from Eikon).
ROIit is the return on investment for company i in period t, which we define as the quotient between the operating profits and total assets (data from Eikon).
SIZEit measures the size of company i in period t, and we define it using the asset logarithm (data from Eikon).
logGDPjt is the logarithm of the gross domestic product (GDP) for country j in period t (data from World Bank).
Below, we explain the variables used in the regression as well as the expected signs regarding the relationship between the independent variables and the dependent one.
Dependent variable (absDA): is the absolute value of discretionary accruals (DA). The estimation of discretionary accruals is the most common methodology in the literature for detecting earnings management (McNichols 2000; García Osma et al. 2005). Accruals are defined as the part of earnings that does not involve cash flow and, therefore, are more likely to be manipulated by managers. However, not all accruals can be managed, so we can distinguish between non-discretionary accruals (NDA), which are not manipulated by management since they depend on the economic circumstances of the company, and discretionary accruals, which are subject to the discretion of the management and are therefore vulnerable to being managed3.
Since it is possible to observe total accrual (TA), the non-discretionary accruals (NDA) are estimated to subsequently calculate the discretionary component (DA) as the difference between the total accruals and the estimated non-discretionary accruals4. A positive value of DA indicates upwards earnings management, and a negative one indicates downwards earnings management. We use the absolute value of DA because the sign is not relevant, just the magnitude. We draw upon Larcker and Richardson’s (2004) model (Equation (2))5:
T A i t A i t 1 = α 1 1 A i t 1 + α 2 ( Δ S A L E i t Δ R E C i t ) A i t 1 + α 3 P P E i t A i t 1 + α 4 B t M i t + α 5 C F O i t A i t 1 + e i t ,
where:
TAit represents the total accruals for company i in period t, which were calculated based on the difference between earnings (E) and cash flow from operations (CFO): TAit = EitCFOit.
SALEit represents the change in sales for company i in period t compared to t − 1.
RECit represents the change in receivables for company i in period t compared to t − 1.
PPEit represents the property, plants and equipment of company i in period t.
BtMit represents the book to market ratio for company i in period t.
CFOit represents the cash flow from operations for company i in period t.
Ait−1 represents the total assets of company i in period t − 1, which we used as a deflator to prevent heteroskedasticity problems.
eit is the error term for company i in period t.
After estimating the parameters for Equation (2) for each country, we used these values to predict the total accruals during the period of analysis (2009–2018) and to calculate the prediction error (DA) using Equation (3):
D A i t A i t 1 = T A i t A i t 1 ( a 1 1 A i t 1 + a 2 Δ S A L E i t Δ R E C i t A i t 1 + a 3 P P E i t A i t 1 + a 4 B t M i t + a 5 C F O i t A i t 1 ) ,
where DAit represents the discretionary accruals for firm i in period t and a1, a2, a3, a4 and a5 are the estimated values of parameters α1α5.
Explanatory variables and predicted signs: we have introduced five explanatory variables in Equation (1):
Corporate governance score (logCGVS): this score is one of the three pillar scores (environmental, E; social, S; and corporate governance, G) in the calculation of the ESG scores designed by Thomson and Reuters to transparently and objectively measure a company’s relative ESG performance, commitment and effectiveness across different themes related to environmental, social and corporate governance practices, based on company-reported data. The corporate governance score reflects the company’s commitment and effectiveness towards following best practice principles in corporate governance.
Corporate governance, in addition to governing, has the mission of supervising management. Previous research has studied the relationship between corporate governance and earnings management, as in Klein (2002); Xie et al. (2003); Shen and Chih (2007); Jaggi and Tsui (2007); Cornett et al. (2009) or Shan (2015), among others.
It is expected that, when corporate governance does a good job of supervision and control, there is less earnings management. A higher score means better quality of governance and, therefore, better control practices and, consequently, less earnings management. Therefore, the expected sign of the coefficient of the CGVS variable is negative.
Uncertainty avoidance index (logUAI): this index measures the uncertainty avoidance, considered by Hofstede (1980) as a national culture dimension. It can be defined as the extent to which the members of a culture feel threatened by ambiguous or unknown situations. Cultures with high indexes (strong uncertainty avoidance) are worse at tolerating uncertainty, have more fear of the unknown and, therefore, prefer having rules. A low index (weak uncertainty avoidance) indicates more flexibility to face changes and more tolerance for uncertainty.
Hofstede et al. (2010) consider uncertainty avoidance, together with power distance, as the two national culture dimensions particularly affecting organizations. They describe some key differences between organizations in weak versus strong uncertainty avoidance countries. For example, in the first one, top managers are concerned with strategy, entrepreneurs are relatively free from rules, and they are better at invention and worse at implementation, while in the second one, top managers are concerned with daily operations, entrepreneurs are constrained by existing rules and they are worse at invention and better at implementation.
According to Gray (1988), strong uncertainty avoidance leads to a preference for conservative accounting, with many rules and little room for professional judgment. Consistent with this argument, studies such as Guan et al. (2005) and Han et al. (2010) have found a negative association between uncertainty avoidance and earnings management. Other studies have also considered a possible positive relationship between uncertainty avoidance and earnings management because this practice may be perceived as a tool at the accountant’s disposal that could enable the reporting of desired numbers and reduce overall uncertainty (see, for example, Geiger et al. (2006) or Doupnik (2008)).
We think that when uncertainty avoidance is strong (higher index values), companies are less likely to manage earnings because in these societies, there are fewer opportunities for earnings management and because of the fear of the unknown, there is a need for precision, leading to lower risk-taking and to the preference for a more predictable environment. Therefore, the expected sign for the coefficient of logUAI is negative.
Power distance index (logPDI): this index measures the power distance, another national culture dimension according to Hofstede (1980). It can be defined as the extent to which the less powerful members of institutions and organizations within a country expect and accept that power is distributed unequally. A high index value means individuals with less power are fully aware of hierarchies and their distant position to power, admitting that power is distributed unevenly. A low value of the index means that this culture expects and accepts that power relations are democratic and assumes that its members are equal.
As we have stated before, power distance particularly affects the organization culture (Hofstede et al. 2010). In large power distance countries (high index value), there is considerable dependence of subordinates on bosses and the subordinates are unlikely to approach and contradict their bosses directly. In small power distance countries (low index value), there is limited dependence of subordinates on bosses and subordinates will easily approach and contradict their bosses.
Previous studies (Kanagaretnam et al. 2011), among others) have predicted a positive relationship between power distance and earnings management, reasoning that a longer power distance implies that decisions are more centralized and managers have greater influence on financial reporting choices for opportunistic reasons. Conversely, Geiger et al. (2006) state that individuals from high power distance countries perceive earnings management as less acceptable than individuals from low power distance cultures. They assume an unequal power distribution and are less likely to engage in a practice of earnings management that would present an unrealistic portrayal of the company in an attempt to look better than others.
In line with the reasoning by Geiger et al. (2006), we expect more earnings management practices in organizations belonging to cultures with small power distance (negative sign for the coefficient) because there is an interdependent relationship between bosses and subordinates, reliance and a no supervision environment.
The next two variables have been introduced because we cannot forget that culture may influence corporate governance (Breuer and Salzmann 2012; Li and Harrison 2008; Licht et al. 2005) and affect its effectiveness in controlling earnings management.
Interaction between uncertainty avoidance and corporate governance (dicUAIxlogCGVS): this variable has been introduced into the regression to evaluate whether there are significant differences in control of earnings management by corporate governance depending on the national culture, specifically on whether uncertainty avoidance is high or low. The variable is the product between dicUAI and logCGVS. dicUAI is a dichotomous variable, which takes a value of 0 when uncertainty avoidance is strong (index for the country is higher than 63) and a value of 1 when it is weak (index lower than 63)6. The relationship between CGVS and earnings management is expected to be negative and we expect the sign for the coefficient of dicUAIxlogCGVS to be positive, because in countries where the uncertainty avoidance is weak, corporate governance is less concerned with the control of daily operations and their accounting. It would mean that corporate governance controls earnings management less effectively in countries where uncertainty avoidance is weak.
Interaction between power distance and corporate governance (dicPDIxlogCGVS): this variable has been introduced into the regression to evaluate whether there are significant differences in the control of earnings management by corporate governance depending on whether the power distance is large or small. The variable is the product between dicPDI and logCGVS. dicPDI is a dichotomous variable, which takes a value of 0 when the power distance is small (index for the country is lower than 50) and a value of 1 when it is large (index lower than 50)7. We expect the sign for the coefficient of dicPDIxlogCGVS to be positive because, as stated before, when the power distance is large, individuals accept an unequal power distribution and are less likely to engage in earnings management; therefore, corporate governance is less worried about controlling these earnings management practices. Thus, if the sign for the coefficient of logCGVS is negative, and the sign for the coefficient of dicPDIxlogCGVS is positive, it would mean that corporate governance controls earnings management less effectively in countries with a large power distance.
Table 2 shows the cultural variables (UAI and PDI) values extracted from Hofstede et al. (2010) for countries in the sample and the values for the dichotomous variables (dicUAI and dicPDI).
Control variables: We have introduced five control variables into Equation (1):
Economic–financial ratios measuring the liquidity (LIQ), indebtedness (DEBT) and return on investment (ROI) of the companies: Previous investigations have evidenced that the economic and financial position of companies influences their earnings management (Defond and Jiambalvo 1994; Sweeney 1994; Jaggi and Lee 2002; Rosner 2003; Iatridis and Kadorinis 2009; Charitou et al. 2012). We can expect that a worse economic and financial situation (lower liquidity, higher indebtedness and lower profitability) will be associated with higher discretionary accruals. Thus, the expected sign for LIQ and ROI is negative, while for DEBT it is positive.
Firm size (SIZE): Many prior studies have analyzed the relationship between firm size and earnings management, reaching diverse conclusions (Burgstahler and Dichev 1997; Barton and Simko 2002; Kim et al. 2003; Llukani 2013; Swastika 2013). Hence, we are not able to predict the sign for this variable.
Gross domestic product (logGDP): Through this variable, we control the effect of the country’s economic situation on the earnings management by companies. We expect to find a negative relationship, indicating that a better economic position of the country may limit earnings management. Chih et al. (2007) and Shen and Chih (2005) point out that richer countries are generally less likely to manage earnings.
The descriptive statistics for the variables in regression (1) are presented in Table 3, and the correlations between these variables are shown in Table 4. As can be seen, the correlations between the variables are low or moderate and the signs of the correlations are as expected.

5. Results and Discussion

The first set of results shows that all of the explanatory variables are significant, except for liquidity and size, with all coefficient signs as expected (except for logGDP). Table 5 provides the regression parameters of Equation (1).
absDAit = α0 + α1logCGVSit + α2logUAIj + α3logPDIj + α4dicUAIj xlogCGVSit + α5dicPDIj xlogCGVSit + α6LIQit + α7DEBTit + α8ROIit + α9SIZEit + α10logGDPjt + eit
As previously explained, our objective is to assess the effect of corporate governance on the magnitude of earnings management (α1 in the model), linked to the relationship between organizational culture and earnings management (α2 and α3 in the model). Our main interest lies in evaluating whether there are differences in the effectiveness of the control exerted by corporate governance in order to avoid earnings management (α4 and α5 in the model), depending on the organizational culture.
Firstly, in relation to the effect of corporate governance in earnings management, the coefficient is negative (−0.069), meaning that the better the corporate governance practice in a company, the lower its level of earnings management. Therefore, we obtain evidence of the general effectiveness of corporate governance as a brake on earnings management.
Secondly, with regard to the two dimensions of national culture influencing the organizational culture (uncertainty avoidance and power distance), we observe that both coefficients are negative.
The UAI coefficient is −0.033, and therefore, we can conclude that, in companies located in countries with weak uncertainty avoidance, the discretionary accruals intensity is higher. In these countries, accounting systems are more pragmatic, counting with a common law system, where the traditional regulation does not prescribe rules to cover the behavior of companies and how they should prepare their financial statements to produce accounting earnings. The regulations are less detailed and there are more possibilities for interpretation by professionals. If standards are imprecise, consistency of accounting choices can be justified via the aggressive interpretation of standards. On the contrary, in countries where uncertainty avoidance is stronger, accounting systems are more detailed. They have a law accounting system code, designed to ensure orderly business conduct, and regulations, usually collected in a General Accounting Plan, collect detailed and procedural accounting standards.
Regarding the power distance variable, our results are in line with the studies of Guan et al. (2005) and Han et al. (2010). The PDI coefficient is −0.057, so in large power distance countries, the earnings management is lower. In these countries, employees are more subject to the orders of superiors, abiding by their guidelines. This will make it more stringent in the area of the application of the rules—particularly accounting standards—and therefore incentives for earnings management decrease. When the power distance decreases, professionals are more capable of discussing the decisions of their superiors, including those of regulators. It increases the incentive to apply the rules in the most appropriate way for their interests, increasing the earnings management.
Given that our paper’s focus is to study the interactions between cultural values and the effectiveness of corporate governance as a control of earnings management, we bring our attention to the values and signs of α4 and α5, as well as the sum of α2 plus α4 and α3 plus α5.
The interaction between UAI and GVCS shows how the effectiveness of corporate governance, as a control measure for earnings management, is significantly reduced in companies located in countries with lower UAI values. The coefficient of dicUAIxlogGCVS is positive and significant (α4 = 0.021). Given that α1 is −0.069, in countries where UAI is weak (dicUAI = 1), corporate governance is less effective in controlling earnings management (α1 + α4 = −0.069 + 0.021) than in countries where UAI is strong (dicUAI = 0, and so α1 + α4 = −0.069 + 0).
These results show that the UAI partly conditions the effectiveness of corporate governance as a controlling mechanism for earnings management. Although, in all cases, corporate governance is effective in reducing earnings management, in countries with weak UAI, corporate governance reduces earnings management to a lesser extent than in countries with strong UAI8. Where UAI is weak, the management of companies serves more strategical and not so much operational aspects, being the corporate governance more linked to this type of objective, and is therefore less efficient in controlling earnings management. In addition, in this area, the control of earnings management is more closely linked to the enforcement mechanisms of accounting rules and to the audit of financial reporting. In view of these results, we may affirm that the corporate governance control of earnings management is less effective in the “market” and “family” organizational models than in the “machine” and “pyramid” models.
As for the interaction between PDI and GVCS, it also shows how the effectiveness of corporate governance to control earnings management is conditioned by the PDI (α5 is significant and positive). Given that α1 is −0.069, the positive sign of α5 (0.042) suggests that in companies located in countries with large PDI (dicPDI = 1), the effectiveness of corporate governance is lower (α1 + α5 = −0.069 + 0.042) than in companies located in countries with short PDI (dicPDI = 0, and so α1 + α5 = −0.069 + 0). On the one hand, in environments with a large power distance, the results show that the earnings management level is lower. Corporate governance could be less vigilant about adopting earnings management practices. Managers perceive earnings management as less acceptable than managers in companies from a short power distance culture, so corporate governance is not focused on control and supervision.
On the other hand, where power distance is short, the components of the organization are less dependent on their bosses, and subordinates are able to discuss orders and adopt their own strategies. In this context, control tools and, in particular, corporate governance, behave more efficiently in the different areas of the company, and the scope of financial information is no stranger to this. Attending to the power distance variable, in “pyramid” and “family” organizational models, corporate governance is less effective in controlling earnings management than in “market” and “machine” models.
In conclusion, our findings show that corporate governance acts as a brake on earnings management, although with its effectiveness limited in organizations with weak uncertainty avoidance and large power distance. Going back to Hofstede et al.’s (2010) organizational models, corporate governance limits earnings management more effectively in the “machine” model. On the contrary, in the “family” model is where that brake on earnings management occurs in a more limited way. “Market” and “pyramid” models are placed in an intermediate position.
In relation to the control variables, the indebtedness, return on investment and gross domestic product are significant. The economic and financial situation of the company shows the expected sign in its relationship with earnings management. Lower indebtedness and higher ROI are linked to lower earnings management levels.
However, logGDP has an opposite sign than expected. While there are better control mechanisms in more developed countries, it should also be considered that incentives for manipulation might be greater, justifying the sign obtained.

6. Conclusions

This paper examines earnings management in companies from 16 countries representative of the four organizational models proposed by Hofstede et al. (2010), according to two dimensions of national culture (power distance and uncertainty avoidance). Specifically, we look at the indirect interactions between corporate governance, culture and earnings management. The main objective is to study the organizational culture impact over the corporate governance effectiveness to control earnings management.
The results confirm that earnings management is indeed conditioned by organizational culture. In companies located in countries with weak uncertainty avoidance and a large power distance, the discretionary accruals intensity is higher. We also obtain evidence that corporate governance acts as a brake on earnings management, regardless of the cultural field in which it is analyzed.
However, the effectiveness of corporate governance as a limit to earnings management depends on organizational culture. This effectiveness is significantly higher in companies located in countries with strong uncertainty avoidance and short power distance. Therefore, the control mechanism that corporate governance exerts over earnings management depends not only on the corporate governance practice developed by the companies, but is also influenced by the predominant national culture dimensions in the country where the company is located. In the countries classified as following the “machine” model, according to the classification proposed by Hofstede et al. (2010), it is where corporate governance acts as a brake on earnings management in a more effective way. In contrast, in the “family” model, that same brake on earnings management occurs in a more limited way.
Among the implications of the results obtained, it is worth noting that a corporate governance model that is effective as a brake on earnings management in some countries may not be so effective in others, due to the influence of culture on that same corporate governance model. That is why we believe that implementing universal corporate governance models may not be appropriate, and it is necessary to consider the cultural traits of each environment to ensure the effectiveness of corporate governance as a limit to earnings management.
These conclusions may be of great interest to regulators, as they make it clear that transferring corporate governance models from one country to another does not ensure their equal effectiveness in controlling manipulation. It should not be forgotten that the culture of each country influences the practices of earnings management and the organizational model of companies, thus influencing the effectiveness of “standard” corporate governance in constraining earnings management.
Some limitations may affect our research. Firstly, the study is based on 16 countries, representative of the four organizational culture models. Although the selection is fully justified in Section 3, counting on a larger sample of countries could lead to more accurate results. Secondly, using discretionary accruals as measure for earnings management, together with the model used to estimate them, may also have an influence on the results. Finally, measuring corporate governance performance is always difficult, even when using recognized databases, and some aspects could have been overlooked. In this regard, future research could study the evolution of organizational culture across countries and its possible effects on corporate governance and its effectiveness, choosing specific regions and/or sectors as a sample to study. Finally, it would also be interesting to investigate the influence of culture on other earnings management control mechanisms.

Author Contributions

All authors have equally contributed to all phases and parts of the manuscript. All authors have read and agreed to the published version of the manuscript.

Funding

This research received no external funding.

Institutional Review Board Statement

Not applicable.

Informed Consent Statement

Not applicable.

Acknowledgments

This study was financed by the Spanish Government in the framework of the Research Group Ref. PID2019-107822RB-I00 and the Research Group S33_20R Socioeconomics and Sustainability.

Conflicts of Interest

The authors declare no conflict of interest.

Appendix A

Table A1. Descriptive statistics for variables used to characterize the companies in the sample.
CountryNMinimumMaximumMeanSt. Deviation
Argentina
LIQ620.0361083.2412741.3295830.594736
DEBT580.0245245.5775011.6782411.236976
ROI54−0.1726100.1837590.0480060.081617
ASSET65112.3026,182,778.701,428,041.433,887,832.84
Austria
LIQ410.4871763.6736331.4819040.735024
DEBT480.0002384.1212671.3985000.874428
ROI49−0.0978660.1080380.0404240.040772
ASSET516024.0341,436,809.203,284,541.746,657,676.78
Brazil
LIQ2230.0002103.9416381.5250060.859427
DEBT1960.0533635.6365411.6445271.344929
ROI236−0.1692740.1980380.0370240.078451
ASSET247108.4746,619,535.462,978,728.145,964,100.76
Denmark
LIQ870.0000004.0000001.4498120.858622
DEBT1030.0075104.2467801.0483690.821086
ROI91−0.1653930.1975150.0514040.073359
ASSET111469.2056,275,133.782,552,901.948,325,196.84
France
LIQ5210.0000004.1468321.6108370.785762
DEBT5400.0000005.4044941.5249871.170935
ROI504−0.1855630.1920300.0270950.068797
ASSET582299.8969,724,453.603,434,927.769,734,571.06
Germany
LIQ3740.0000004.4651871.7596680.917197
DEBT4160.0193285.4236991.3531051.029270
ROI403−0.1635600.1996350.0368170.065535
ASSET441338.0174,429,143.403,681,025.2710,298,925.20
Hong Kong
LIQ16140.0000004.8650381.8157821.025857
DEBT17700.0046045.0290851.0037400.986760
ROI1737−0.1969230.1990440.0256730.076096
ASSET1926215.3080,779,548.731,982,741.396,390,365.37
Indonesia
LIQ4400.0001604.5597391.5552391.011302
DEBT4750.0025215.3053881.1182211.008536
ROI485−0.1460240.1817700.0453130.060192
ASSET520119.2423,678,859.53636,240.211,662,465.92
Israel
LIQ2400.0000004.6388401.6825050.948095
DEBT3020.0005716.7531441.6553761.404634
ROI75−0.1480820.1996490.0562160.084741
ASSET229117.9910,253,377.93286,447.731,092,101.74
New Zealand
LIQ860.0177374.5782881.4450280.925851
DEBT980.0146843.8199610.8847420.698235
ROI85−0.1485970.1636850.0488340.065393
ASSET104262.7111,712,560.80915,036.521,710,211.67
Philippines
LIQ1710.0000004.6820741.6312911.097005
DEBT1890.0003364.0511450.9709630.889239
ROI205−0.1333400.1944920.0307170.060335
ASSET213119.5633,743,409.521,648,782.374,408,567.40
Russia
LIQ1450.0828493.7715051.2349470.707970
DEBT1190.0009626.1916031.5512341.532212
ROI144−0.1594950.1968880.0470400.075180
ASSET1661608.5373,544,712.373,122,642.638,120,882.68
Singapore
LIQ3500.0000004.8691711.8290301.127291
DEBT3860.0083753.9304760.9336730.792831
ROI383−0.1601390.1950370.0219140.056903
ASSET422159.0776,795,732.471,913,751.256,510,460.00
Spain
LIQ1230.4051913.6313031.4437150.765132
DEBT1520.0143586.0936291.6401591.423719
ROI164−0.1723170.1769330.0236930.061967
ASSET1782880.9665,112,860.203,196,049.108,204,187.49
United Kingdom
LIQ9130.0000004.6791411.6063750.989184
DEBT9930.0011344.9096240.9426900.971165
ROI874−0.1988430.1978710.0353170.086542
ASSET1090125.0474,941,262.401,800,685.761,800,685.766,711,569.39
United States
LIQ11760.0000004.5621601.6770970.882393
DEBT12210.0000006.1597121.6888281.272706
ROI1294−0.1208420.1968670.0632780.057070
ASSET1399110.0080,549,000.007,536,909.6412,180,106.81
Total Sample
LIQ65660.0000004.8691711.6698840.960132
DEBT70660.0000006.7531441.2526921.137450
ROI6783−0.1988430.1996490.0382600.071556
ASSET7744108.4780,779,548.733,094,962.648,365,296.53

Notes

1
The range of values for PDI in Hofstede et al. (2010) are between 10 and 110 and for UAI the values are between 5 and 115.
2
Data are extracted from Eikon database by Thomson Reuters.
3
The concepts of discretionary and non-discretionary accruals are explained by Dechow et al. (2010), Francis et al. (2004) and Kothari et al. (2005), among others.
4
Different models have been used in the literature to estimate non-discretionary accruals. A comprehensive overview of these models is presented by Callao et al. (2014).
5
For this regression, data were extracted from Eikon.
6
We take the value 63 as a reference based on Hofstede et al. (2010).
7
We take the value 50 as a reference based on Hofstede et al. (2010).
8
Shi et al. (2022), although in relation to CSR, show the influence of UAI on the negative relationship between CSR and earnings management. This negative association is higher in high uncertainty avoidance cultures.

References

  1. Ball, Ray, and Lakshmanan Shivakumar. 2005. Earnings quality in UK private firms: Comparative loss recognition timeliness. Journal of Accounting and Economics 39: 83–128. [Google Scholar] [CrossRef]
  2. Barton, Jan, and Paul J. Simko. 2002. The balance sheet as an earnings management constraint. The Accounting Review 77: 1–27. [Google Scholar] [CrossRef]
  3. Bonetti, Pietro, Michel L. Magnan, and Antonio Perbonetti. 2016. The Influence of Country- and Firm-Level Governance on Financial Reporting Quality: Revisiting the Evidence. Journal of Business Finance & Accounting 43: 1059–94. [Google Scholar]
  4. Breuer, Wolfgang, and Astrid J. Salzmann. 2012. National culture and corporate governance. In Corporate Governance. Berlin and Heidelberg: Springer, pp. 369–97. [Google Scholar]
  5. Burgstahler, David, and Ilia Dichev. 1997. Earnings Management to Avoid Earnings Decreases and Losses. Journal of Accounting and Economics 24: 99–126. [Google Scholar] [CrossRef]
  6. Callao, Susana, José I. Jarne, and David Wroblewski. 2014. The development of earnings management research. Review of literature from three different perspectives. Theoretical Journal of Accounting 79: 135–77. [Google Scholar] [CrossRef]
  7. Cameran, Mara, Peiwei Lyu, and Pietro Perotti. 2022. The Consequences of Audit Partner Narcissism: Evidence from the UK Market. Available online: https://papers.ssrn.com/sol3/papers.cfm?abstract_id=4109142 (accessed on 1 May 2022).
  8. Charitou, Melita, Petros Lois, and Halim B. Santoso. 2012. The Relationship Between Working Capital Management and Firms Profitability: An Empirical Investigation for an Emerging Asian Country. International Business and Economics Research Journal 11: 839–47. [Google Scholar] [CrossRef]
  9. Chen, Chu, Giorgio Gotti, Tony Kang, and Michael C. Wolfe. 2018. Corporate Codes of Ethics, Culture, and Earnings Discretion: International Evidence. Journal of Business Ethics 151: 141–63. [Google Scholar] [CrossRef]
  10. Chih, Hsiang-Lin, Chung-Hua Shen, and Feng-Ching Kang. 2007. Corporate Social Responsibility, Investor Protection, and Earnings Management: Some International Evidence. Journal of Business Ethics 79: 179–98. [Google Scholar] [CrossRef]
  11. Choi, Daeheon, Chune Y. Chung, Young-Eun Kim, Y. J. Kim, and Paul M. S. Choi. 2020. Sustainable Corporate Ownership Structures and Earnings Management in the Vietnamese Stock Market. Sustainability 12: 6089. [Google Scholar] [CrossRef]
  12. Cornett, Marcia M., Jamie J. McNutt, and Hassan Tehranian. 2009. Corporate governance and earnings management at large US bank holding companies. Journal of Corporate Finance 15: 412–30. [Google Scholar] [CrossRef]
  13. Dechow, Patricia, and Richard Sloan. 1991. Executive incentives and the horizon problem: An empirical investigation. Journal of Accounting and Economics 14: 51–89. [Google Scholar] [CrossRef]
  14. Dechow, Patricia, Weili Ge, and Catherine Schrand. 2010. Understanding earnings quality: A review of the proxies, their determinants and their consequences. Journal of Accounting and Economics 50: 344–401. [Google Scholar] [CrossRef]
  15. Defond, Mark, and James Jiambalvo. 1994. Debt covenant violation and manipulation of accruals. Journal of Accounting and Economics 17: 145–76. [Google Scholar] [CrossRef]
  16. Desender, Kurt, Christian Castro, and Sergio De León. 2011. Earnings Management and Cultural Values. American Journal of Economics and Sociology 70: 639–70. Available online: http://0-www-jstor-org.brum.beds.ac.uk/stable/41329204 (accessed on 28 August 2020). [CrossRef]
  17. Doupnik, Timothy S. 2008. Influence of Culture on Earnings Management: A Note. Abacus 44: 317–40. [Google Scholar] [CrossRef]
  18. Duong, Hong K., Helen Kang, and Stephen B. Salter. 2016. Culture and corporate governance. Journal of International Accounting Research 15: 67–96. [Google Scholar] [CrossRef]
  19. Elias, Rafik. 2004. The impact of corporate ethical values on perceptions of earnings management. Managerial Auditing Journal 19: 84–98. [Google Scholar] [CrossRef]
  20. Francis, Jennifer, Ryan LaFond, Per M. Olsson, and Katherine Schipper. 2004. Costs of Equity and Earnings Attributes. The Accounting Review 79: 967–1010. [Google Scholar] [CrossRef]
  21. García Osma, Beatriz, and Belén Gill de Albornoz Nouger. 2005. El Gobierno Corporativo y las Prácticas de Earnings Management: Evidencia Empírica en España. Valencia: Instituto Valenciano de Investigaciones Económicas, vol. 11, pp. 1–46. [Google Scholar]
  22. García Osma, Beatriz, Belén Gill de Albornoz Nouger, and Ana Gisbert Clemente. 2005. La investigación sobre earnings managements. Spanish Journal of Finance and Accounting 34: 1001–33. [Google Scholar]
  23. Geiger, Marshall, and Joyce van der Laan Smith. 2010. The Effect of Institutional and Cultural Factors on the Perceptions of Earnings Management. Journal of International Accounting Research 9: 21–43. [Google Scholar] [CrossRef]
  24. Geiger, Marshall, Brendan O’Connell, Paul Clikeman, Elena Ochoa, Kristen Witkowski, and Ilias Basioudis. 2006. Perceptions of earnings management: The effects of national cultura. Advances in International Accounting 19: 175–99. [Google Scholar] [CrossRef]
  25. Gray, S. J. 1988. Towards a theory of cultural influence on the development of accounting systems internationally. Abacus 24: 1–15. [Google Scholar] [CrossRef]
  26. Guan, Liming, Hamid Pourjalali, Partha Sengupta, and Jenny Teruya. 2005. Effect of cultural environment on earnings manipulation: A five Asia—Pacific country analysis. Multinational Business Review 13: 23–41. [Google Scholar] [CrossRef]
  27. Han, Sam, Tony Kang, Stephen Salter, and Yong Keun Yoo. 2010. A cross-country study on the effects of national culture on earnings management. Journal of International Business Studies 41: 123–41. [Google Scholar] [CrossRef]
  28. Hassan, M. Kabir, and Md. Sydul Karim. 2022. Corporate Culture and Inventory Behavior (May 15). Available online: https://ssrn.com/abstract=4110229 (accessed on 28 August 2020). [CrossRef]
  29. Healy, Paul, and James M. Wahlen. 1999. A Review of the Earnings Management Literature and its Implications for Standard Setting. Accounting Horizons 13: 365–83. [Google Scholar] [CrossRef]
  30. Hofstede, Geert. 1980. Culture’s Consequences: International Differences in Work-Related Values. Beverly Hills: Sage. [Google Scholar]
  31. Hofstede, Geert, Gert J. Hofstede, and Michael Minkov. 2010. Cultures and Organizations: Software of the Mind Intercultural Cooperation and Its Importance for Survival. New York: McGraw Hill. [Google Scholar]
  32. Holthausen, Robert, David F. Larcker, and Richard G. Sloan. 1995. Annual bonus schemes and the manipulation of earnings. Journal of Accounting and Economics 19: 29–74. [Google Scholar] [CrossRef]
  33. Iatridis, George, and George Kadorinis. 2009. Earnings management and firm financial motives: A financial investigation of UK listed firms. International Review of Financial Analysis 4: 164–73. [Google Scholar] [CrossRef]
  34. Jaggi, Bikki, and Judy Tsui. 2007. Insider trading, earnings management and corporate governance: Empirical evidence based on Hong Kong firms. Journal of International Financial Management and Accounting 18: 192–222. [Google Scholar] [CrossRef]
  35. Jaggi, Bikki, and Picheng Lee. 2002. Earnings management in response to debt covenant violations and debt restructuring. Journal of Accounting, Auditing and Finance 17: 295–324. [Google Scholar] [CrossRef]
  36. Kanagaretnam, Kiridaran, Chee Y. Lim, and Gerald Lobo. 2011. Effects of national culture on earnings quality of Banks. Journal of International Business Studies 42: 853–74. [Google Scholar] [CrossRef]
  37. Kasznik, Ron. 1999. On the association between voluntary disclosure and earnings management. Journal of Accounting Research 37: 57–81. [Google Scholar] [CrossRef]
  38. Katmon, Nooraisah, and Omar Al Farooque. 2017. Exploring the Impact of Internal Corporate Governance on the Relation between Disclosure Quality and Earnings Management in the UK Listed Companies. Journal of Business Ethics 142: 345–67. [Google Scholar] [CrossRef]
  39. Khuong, Nguyen V., Le H. T. Anh, and Nguyen T. H. Van. 2022. Firm life cycle and earnings management: The moderating role of state ownership. Cogent Economics & Finance 10: 2085260. [Google Scholar] [CrossRef]
  40. Kim, Yangseon, Caixing Liu, and S. Ghon Rhee. 2003. The Relation of Earnings Management to Firm Size. Working Paper. Honolulu: University of Hawaii, pp. 1–31. [Google Scholar]
  41. Kjærland, Frode, Ane T. Haugdal, Anna Søndergaard, and Anne Vågslid. 2020. Corporate Governance and Earnings Management in a Nordic Perspective: Evidence from the Oslo Stock Exchange. Journal of Risk and Financial Management 13: 256. [Google Scholar] [CrossRef]
  42. Klein, April. 2002. Audit committee, board of director characteristics and earnings management. Journal of Accounting and Economics 33: 375–400. [Google Scholar] [CrossRef]
  43. Kneiding, Christoph, and Alexander S. Kritikos. 2007. Microfinance in Eastern and Western Europe: A Comparative Analysis. GfA Discussion Paper No. 09/2007. Berlin: Gesellschaft fur Arbeitsmarktaktivierung, pp. 1–18. [Google Scholar]
  44. Kothari, S.P., Andrew J. Leone, and Charles E. Wasley. 2005. Performance matched discretionary accrual measures. Journal of Accounting and Economics 39: 163–97. [Google Scholar] [CrossRef]
  45. La Porta, Rafael, Florencio Lopez-de-Silanes, and Andrei Shleifer. 1999. Corporate ownership around the world. The Journal of Finance 54: 471–517. [Google Scholar] [CrossRef]
  46. Larcker, David F., and Scott A. Richardson. 2004. Fees paid to audit firms, accrual choices, and corporate governance. Journal of Accounting Research 42: 625–58. [Google Scholar] [CrossRef]
  47. Li, Jiatao, and J. Richard Harrison. 2008. Corporate governance and national culture: A multi-country study. Corporate Governance 8: 607–21. [Google Scholar] [CrossRef]
  48. Li, Kai, Feng Mai, Rui Shen, and Xinyan Yan. 2020. Measuring Corporate Culture Using Machine Learning. Review of Financial Studies 34: 3265–315. [Google Scholar] [CrossRef]
  49. Licht, Amir, Chanan Goldschmidt, and Shalom H. Schwartz. 2005. Culture, law, and corporate governance. International Review of Law and Economics 25: 229–55. [Google Scholar] [CrossRef]
  50. Llukani, Teuta. 2013. Earnings management and firm size: An empirical analyze in Albanian market. European Scientific Journal 9: 135–43. [Google Scholar]
  51. McNichols, Maureen F. 2000. Research design issues in earnings management studies. Journal of Accounting and Public Policy 19: 313–45. [Google Scholar] [CrossRef]
  52. Monterrey Majoral, Juan. 2004. Información contable y gobierno corporativo. Revista de Contabilidad 7: 89–122. [Google Scholar]
  53. Nia, Nia M., Nila F. Nuzula, and Caci R. Damayanti. 2022. Corporate governance and socially responsible on accounting conservatism and earnings management in indonesia’s soe enterprises. Profit: Jurnal Administrasi Bisnis 16: 216–29. [Google Scholar]
  54. Riahinejad, Mohaddeseh, and Afsaneh Tavangar. 2022. The Effect of Organizational Culture on the Relationship between Earnings Management and the Readability of Financial Statements. The Financial Accounting and Auditing Researches 13: 87–114. Available online: https://www.sid.ir/en/journal/ViewPaper.aspx?id=896009 (accessed on 28 August 2020).
  55. Rosner, Rebecca L. 2003. Earnings manipulation in failing firms. Contemporary Accounting Research 2: 361–408. [Google Scholar] [CrossRef]
  56. Shan, Yuan G. 2015. Value relevance, earnings management and corporate governance in China. Emerging Markets Review 23: 186–207. [Google Scholar] [CrossRef]
  57. Shen, Chung-Hua, and Hsiang-Lin Chih. 2005. Investor protection, prospect theory, and earnings management: An international comparison of the banking industry. Journal of Banking and Finance 29: 2675–97. [Google Scholar] [CrossRef]
  58. Shen, Chung-Hua, and Hsiang-Lin Chih. 2007. Earnings management and corporate governance in Asia’s emerging markets. Corporate Governance: An International Review 15: 999–1021. [Google Scholar] [CrossRef]
  59. Shi, Hao, Haijian Liu, and Yixue Wu. 2022. Are socially responsible firms responsible to accounting? A meta-analysis of the relationship between corporate social responsibility and earnings management. Journal of Financial Reporting and Accounting. ahead-of-print. [Google Scholar] [CrossRef]
  60. Shleifer, Andrei, and Robert W. Vishny. 1997. A survey of corporate governance. The Journal of Finance 52: 737–83. [Google Scholar] [CrossRef]
  61. Swastika, Dwi L.T. 2013. Corporate Governance, Firm Size, and Earnings management: Evidente in Indonesia stock exchange. Journal of Business and Management 10: 77–82. [Google Scholar]
  62. Sweeney, Amy P. 1994. Debt covenant violations and managers’ accounting responses. Journal of Accounting and Economics 17: 281–308. [Google Scholar] [CrossRef]
  63. Teoh, Siew H., Ivo Welch, and T.J. Wong. 1998. Earnings management and the underperformance of seasoned equity offerings. Journal of Financial Economics 50: 63–99. [Google Scholar] [CrossRef]
  64. Xie, Biao, Wallace N. Davidson III, and Peter J. DaDalt. 2003. Earnings management and corporate governance: The role of the board and the audit committee. Journal of Corporate Finance 9: 295–316. [Google Scholar] [CrossRef]
  65. Zhang, Xu, Xing Liang, and Hongyan Sun. 2013. Individualism–Collectivism, Private Benefits of Control, and Earnings Management: A Cross-Culture Comparison. Journal of Business Ethics 114: 655–64. [Google Scholar] [CrossRef]
Figure 1. Power distance versus uncertainty avoidance.
Jrfm 15 00379 g001
Table 1. Sample.
Table 1. Sample.
Countries in the Study by Organizational Model
Hofstede et al. (2010)
Firms in the SampleObservations
2009–2018
PYRAMID127312,730
Brazil2522520
France6486480
Russia1811810
Spain1921920
MACHINE9469460
Argentina67670
Austria54540
Germany4934930
Israel3323320
MARKET275927,590
Denmark1131130
New Zealand1051050
United Kingdom111411,140
United States142714,270
FAMILY318431,840
Hong Kong197919,790
Indonesia5285280
Philippines2212210
Singapore4564560
Appendix ATable A1 shows the minimum, maximum, mean and standard deviation for the variables that we use to characterize the companies in the sample.
Table 2. Culture variable values for countries in the sample.
UAIPDIdicUAIdicPDI
PYRAMID
Brazil766901
France866801
Russia959301
Spain865701
MACHINE
Argentina864900
Austria701100
Germany653500
Israel811300
MARKET
Denmark231810
New Zealand492210
United Kingdom353510
United States464010
FAMILY
Hong Kong296811
Indonesia487811
Philippines449411
Singapore87411
Source: own elaboration from Hofstede et al. (2010).
Table 3. Descriptive statistics for variables in Equation (1).
NMinimumMaximumMeanSt Deviation
absDA64,8220.0000010.4575000.0812760.077274
logCGVS15,1250.0334241.9915801.7082110.313714
logUAI81,6200.9030901.9777241.6165800.242846
logPDI81,6201.0413931.9731281.6966230.203969
UAIxlogCGVS15,1250.0000001.9915801.4068850.744396
PDIxlogCGVS15,1250.0000001.9905160.4237510.707890
LIQ58,7770.0000004.9734901.6684100.943571
DEBT63,0650.0000007.0503471.2747441.138188
ROI61,584−0.1999670.1999690.0417270.070775
SIZE70,7302.3044738.6341525.4751251.048062
logGDP81,6203.2604354.8101114.4975390.357641
N: 81,620
Table 4. Pearson correlations (variables in Equation (1)).
absDAlogCGVSlogUAIlogPDILIQDEBTROISIZElogGDP
absDA1−0.293 **−0.314 **−0.210 **0.014 **0.133 **−0.152 **0.016 **−0.012 **
logCGVS 1−0.128 **−0.266 **−0.035 **0.094 **0.076 **−0.166 **0.433 **
logUAI 1−0.232 **−0.092 **0.186 **0.037 **0.038 **−0.244 **
logPDI 10.009 *−0.089 **−0.053 **0.309 **−0.415 **
LIQ 1−0.410 **0.082 **−0.082 **0.082 **
DEBT 10.061 **0.173 **0.022 **
ROI 10.196 **−0.009 *
SIZE 1−0.498 **
logGDP 1
* Significant at 0.05; ** Significant at 0.01.
Table 5. Linear regression results (Equation (1)).
BStandard ErrortSig.
logCGVS−0.0690.002−31.1380.000
logUAI−0.0330.004−8.4930.000
logPDI−0.0570.005−10.4780.000
dicUAIx logCGVS0.0210.00117.0330.000
dicPDIx logCGVS0.0420.00130.8550.000
LIQ0.0000.001−0.6650.506
DEBT0.0030.0008.3730.000
ROI−0.1190.008−14.1330.000
SIZE0.0010.0011.1260.260
logGDP0.0150.0026.7200.000
Constant0.2060.01613.1830.000
R2 = 0.301.
Publisher’s Note: MDPI stays neutral with regard to jurisdictional claims in published maps and institutional affiliations.

